


Introduction
Potatoes are grown in a wide range of climates and to optimize production, it is important to understand how photosynthesis rate, radiation use efficiency (RUE) and water use efficiency (WUE) are affected by weather, growth stage and management of the crop. Also, for the accuracy of crop model simulations, it is important to get a good handle on these processes. The availability of eddy covariance systems (ECV) offer the possibility of measuring water and carbon dioxide (CO2) fluxes on an hourly and daily basis. This creates opportunities to follow in detail how photosynthesis, RUE and WUE fluctuate over the growing season and how these are affected by weather and growth stage (Baldocchi et al., Reference Baldocchi, Chu and Reichstein2018; Rodda et al., Reference Rodda, Thumaty, Praveen, Jha and Dadhwal2021).
ECV techniques can be used to indirectly determine the dry matter (DM) yield of potato by conducting continuous measurements of net ecosystem exchange (NEE) across the plant canopy-atmosphere interface (Baldocchi, Reference Baldocchi2003). Gross primary production (GPP) representing photosynthesis rate, is indirectly measured from NEE by subtracting ecosystem respiration (R eco) from NEE (GPP = NEE − R eco). NEE reflects the balance between gross CO2 assimilation or GPP and R eco (Lasslop et al., Reference Lasslop, Reichstein, Papale, Richardson, Arneth, Barr, Stoy and Wohlfahrt2010; Lee et al., Reference Lee, Christen, Black, Jassal, Ketler and Nesic2020). R eco is comprised of heterotrophic and autotrophic respiration. The activity of soil microbes that contribute to heterotrophic respiration strongly depends on soil moisture and temperature (Falge et al., Reference Falge, Baldocchi, Tenhunen, Aubinet, Bakwin, Berbigier, Bernhofer, Burba, Clement, Davis, Elbers, Goldstein, Grelle, Granier, Gumundsson, Hollinger, Kowalski, Katul, Law, Malhi, Meyers, Monson, Munger, Oechel, Paw U, Pilegaard, Rannik, Rebmann, Suyker, Valentini, Wilson and Wofsy2002). The major driving factors behind fluctuations in NEE are: growth stage of the crop, the light response of the plant, air or soil temperature, vapour pressure deficit (VPD) and soil water availability (Zhao and Lüers, Reference Zhao and Lüers2012). Martínez-Maldonado et al. (Reference Martínez-Maldonado, Castaño-Marín, Góez-Vinasco and Marin2021) assessed GPP of rainfed and irrigated potato in the Andean region and found that GPP was closely linked to water availability for potato plants. The management decision to irrigate or not affected carbon fluxes, as was also reported by Baldocchi et al. (Reference Baldocchi, Chu and Reichstein2018).
GPP and R eco can be estimated from NEE using algorithms. The two most widely used methods are the night-time partitioning and daytime partitioning methods (Reichstein et al., Reference Reichstein, Falge, Baldocchi, Papale, Aubinet, Berbigier, Bernhofer, Buchmann, Gilmanov, Granier, Grünwald, Havránková, Ilvesniemi, Janous, Knohl, Laurila, Lohila, Loustau, Matteucci, Meyers, Miglietta, Ourcival, Pumpanen, Rambal, Rotenberg, Sanz, Tenhunen, Seufert, Vaccari, Vesala, Yakir and Valentini2005; Lasslop et al., Reference Lasslop, Reichstein, Papale, Richardson, Arneth, Barr, Stoy and Wohlfahrt2010). The night-time flux partitioning method of Reichstein et al. (Reference Reichstein, Falge, Baldocchi, Papale, Aubinet, Berbigier, Bernhofer, Buchmann, Gilmanov, Granier, Grünwald, Havránková, Ilvesniemi, Janous, Knohl, Laurila, Lohila, Loustau, Matteucci, Meyers, Miglietta, Ourcival, Pumpanen, Rambal, Rotenberg, Sanz, Tenhunen, Seufert, Vaccari, Vesala, Yakir and Valentini2005) estimates a temporally varying respiration-temperature relationship from night-time data. GPP is assumed zero during night-time and the measured NEE is entirely R eco. A threshold of global radiation (R g) < 10 W/m2 (20 W/m2 in some cases) is used to select night-time data which is constrained between computed sunset and sunrise. The temperature sensitivity is estimated from successive 15-day periods of night-time data. The R eco for both day and night-time is estimated from the varying relationship with temperature, and the daytime GPP is determined as the difference between R eco and NEE. The daytime flux partitioning method of Lasslop et al. (Reference Lasslop, Reichstein, Papale, Richardson, Arneth, Barr, Stoy and Wohlfahrt2010) uses a light response curve which also accounts for temperature dependency of respiration. Only daytime data is used to fit the parameters of the curve, whilst GPP and R eco are estimated from model predictions.
This study was based on measurements by ECV systems placed in potato fields at two contrasting sites in South Africa. Evapotranspiration rates (ET) and crop coefficients (K c) measured by the ECV systems were published by Machakaire et al. (Reference Machakaire, Steyn and Franke2021). In the current study, the observed ET were used along with the observed NEE fluxes to quantify and assess variability in photosynthesis rate, RUE and WUE, calculated as GPP divided by ET. The objectives of this study were to:
(i) Quantify the NEE of CO2 in two potato fields in two contrasting agro-ecologies and partition NEE into ecosystem respiration (R eco) and GPP.
(ii) Describe the seasonal patterns in daily photosynthesis/GPP, RUE and WUE in potato.
(iii) Analyse the variability in photosynthesis rate, RUE and WUE as affected by weather and growth stage of the crop.
Materials and methods
Site description and crop management
Potato fields were selected on commercial farms in two production regions of South Africa. One site was located in North West Province nearby the village of Louwna (26°41′S, 24°12′E, 1357 m a.s.l.) in the Vryburg District and had a loamy sand soil (Fig. 1). The climate of this area is characterized by warm to hot summers, and dry and cold winters, with major temperature swings between day and night. The second site was in Limpopo nearby the village of Tom Burke (23°06′S; 28°04′E, 854 m a.s.l. above sea level) and had a sandy soil. Tom Burke has more of a tropical climate, with hot summers and mild winters. Both sites were situated in the summer rainfall region of South Africa.
Map of South Africa showing location of the monitored potato fields.

Both fields were under centre pivot irrigation systems. Planting was done in May in Tom Burke (winter crop) and in August in Louwna (spring/summer crop) (Table 1). Potato variety ‘Mondial’ was planted at both sites. Seed tubers were planted in rows spaced 0.9 m apart at a target plant density of 44 000 plants/ha. Crop emergence reached 50% at 23 days after planting (DAP) in North West and 25 DAP in Limpopo (Table 1). Granular, water soluble and foliar-based fertilizers were applied to the crops during the growing season through a combination of broadcasting before and after planting, band placement with planting, fertigation and spraying. Substantial amounts of nutrients (nitrogen-phosphorus-potassium [N-P-K]) were applied to the crops (Table 1) and nutrient availability was unlikely to limit crop growth. The haulms of the potato crops in Louwna were killed before the crop fully senesced for marketing reasons.
Crop and management characteristics, total rainfall and irrigation from planting to haulm killing at the two sites

N-P-K rates refer to the nitrogen, phosphorus and potassium application rates.
Data collection and handling
NEE flux measurement
ECV were used to measure CO2 fluxes and estimate the NEE of the potato crops. A 3-axis CSAT 3A sonic anemometer and a fast response infrared gas analyzer (Campbell Scientific, USA) installed on a tripod stand at a height 2 m above the crop canopy, were used as part of the ECV system (EC150 open path). The data were derived from high frequency measurements (10 Hz) of wind speed and direction together with measurements of the air scalar characteristics of CO2 and water vapour concentration and temperature. The ECV measures the covariance between fluctuations in vertical wind velocity (w) and CO2 mixing ratio (Baldocchi, Reference Baldocchi2003);

where c is the CO2 mixing ratio, P c is the CO2 density and P a the air density. The NEE flux density of CO2 is measured 10 times/s (10 Hz) and the covariance expressed as;
where NEE is the mean flux density averaged over the time span of measurement interval (in μmol/m2/s) and w is fluctuation in vertical wind velocity. The overbars denote time averaging and the primes represent fluctuations from the mean;


Measured 10 Hz data were processed using the EasyFlux dl program (Campbell Scientific) and stored for 30 min intervals. The measured data were stored on a memory card and downloaded at two- to three-weekly intervals.
Seasonal NEE flux (NEE S) was calculated from the daily NEE flux (NEE D) as measured from the 30 min interval data;
where NEE S is the seasonal flux in g CO2/m2, NEE D is the daily flux in g CO2/m2/day1 and D n is the number of days (D n) in the season. Positive covariance represented net CO2 transfer into the atmosphere and negative covariance net CO2 transfer into the canopy (uptake). Additional sensors were connected to the ECV system: a silicon pyranometer (LI-COR PY67127, USA) for measuring incoming solar radiation and a tipping bucket rain gauge for precipitation and irrigation. The silicon pyranometer was placed at a height of 2.0 m above the ground surface and the tipping bucket rain gauge at 1.2 m above the ground. Data were stored on a CR1000 datalogger (Campbell Scientific, USA). Concurrent measurements of high frequency CO2 fluxes and climatic variables by the ECV system allowed us to investigate the dynamics of carbon fluxes and environmental conditions. The system was powered by a 12 V battery connected to a solar system. Weather data were obtained from automatic weather stations installed nearby the fields. The measured weather parameters were maximum temperature (T max), minimum temperature (T min), total solar radiation (R s) and precipitation.
Flux partitioning
Although ECV measurements are continuous, the data usually contain gaps due to malfunctioning of instruments or due to micrometeorological conditions under which the assumptions of the ECV technique are not met (Wutzler et al., Reference Wutzler, Lucas-Moffat, Migliavacca, Knauer, Sickel, Šigut, Menzer and Reichstein2018). The measured raw fluxes require post-processing routines for flux partitioning into GPP and R eco. Wutzler et al. (Reference Wutzler, Lucas-Moffat, Migliavacca, Knauer, Sickel, Šigut, Menzer and Reichstein2018) developed the REddyProc package which is a tool that provides standard CO2 focused post-processing routines for reading ECV data. The NEE flux was partitioned into GPP and R eco using the REddyProc package from the Max Planck Institute for Biogeochemistry (Wagle et al., Reference Wagle, Gowda, Moorhead, Marek and Brauer2018; Gnanamoorthy et al., Reference Gnanamoorthy, Selvam, Deb Burman, Chakraborty, Karipot, Nagarajan, Ramasubramanian, Song, Zhang and Grace2020). The package uses the R programming language for data analysis (Ihaka and Gentleman, Reference Ihaka and Gentleman1996). For more details, see https://www.bgc-jena.mpg.de/bgi/index.php/Services/REddyProcWeb (Wutzler et al., Reference Wutzler, Lucas-Moffat, Migliavacca, Knauer, Sickel, Šigut, Menzer and Reichstein2018). The tool uses the temporally varying respiration-temperature relationship. Both the night-time and day-time partitioning algorithms were used. Only the data from the night-time algorithm is presented for the seasonal patterns of R eco and GPP (Figs 2 and 3).
Daily rainfall (mm), maximum temperature (T max), minimum temperature (T min) (°C) and daily total solar radiation (R s (MJ/m2) from planting to harvest at Louwna and Tom Burke.

Seasonal mean diurnal variation in net ecosystem exchange flux (NEE) and ambient temperature (T).

During low turbulence conditions, for instance at night, the ECV tends to under-estimate CO2 fluxes and low turbulence flux data were identified using u* threshold and subsequently filtered before gap-filling (Rodda et al., Reference Rodda, Thumaty, Praveen, Jha and Dadhwal2021). The seasonal u* threshold was evaluated using the online tool as 0.240 m/s for Louwna and 0.117 m/s for Tom Burke and used to filter flux data for calm conditions. ECV measurements may be interrupted by turbulent conditions, resulting in system failures or data rejection and the tool gap-filled missing data to provide complete datasets for flux partitioning (Falge et al., Reference Falge, Baldocchi, Olson, Anthoni, Aubinet, Bernhofer, Burba, Ceulemans, Clement, Dolman, Granier, Gross, Grünwald, Hollinger, Jensen, Katul, Keronen, Kowalski, Lai, Law, Meyers, Moncrieff, Moors, Munger, Pilegaard, Rannik, Rebmann, Suyker, Tenhunen, Tu, Verma, Vesala, Wilson and Wofsy2001). NEE was used as the basis for calculating DM accumulation. The GPP partitioned from NEE using the REddyProc package, was considered equivalent to the total carbon uptake by the crop (C uptake ) and used to calculate the total DM yield and tuber DM yield:


where DM total is the total dry matter yield, DM tuber is tuber dry matter yield, C uptake is equivalent to partitioned GPP, HI is the harvest index of potato (assumed to be 75%) and a conversion factor from carbon to glucose of 2.5 was used (Goudriaan and Van Laar, Reference Goudriaan and Van Laar1994).
Radiation use efficiency
Daily fraction of photosynthetic active radiation (PAR) intercepted by the crop was determined from AccuPAR LP-80 ceptometer (Decagon Devices) measurements done at 10 locations in the field in the vicinity of the ECV system at 2- to 3-week intervals;
where FI PAR is the fraction of PAR intercepted, I R is the above canopy PAR and I O is the below canopy PAR in μmol/m2/s. Linear interpolation was used to determine FI PAR between sampling events. However, we assumed exponential growth in light interception in the early stage, from emergence to 13 DAE in Louwna and 18 DAE in Tom Burke.
RUE for different growth stages of potato, and also for the whole growing season, was calculated using DM yield determined from the REddyProc package partitioned GPP and the intercepted PAR over the relevant period;

where RUE is radiation use efficiency (g/MJ), DM total is total dry matter yield (g/m) and $\sum {\rm PAR}$ is the accumulated intercepted photosynthetic active radiation (MJ/m).
WUE of potato was calculated using two methods; (i) as the GPP per unit of total water lost through evapotranspiration (from emergence as measured by the ECV);

where WUE is water use efficiency (g C/m2/mm), GPP is gross primary production (g C/m2/day) and ET is the crop evapotranspiration (mm/day), (ii) as the fresh tuber yield harvested per unit of total water lost through evapotranspiration (from emergence as measured by the ECV);

where WUE fm is water use efficiency as determined from fresh tuber yield and FM tuber is the harvested fresh tuber yield (kg/ha). Fresh tuber yield was measured through destructive sampling at crop maturity. Tuber DM content was also determined from sub-samples oven-dried at 70°C to constant weight and compared to DM determined from GPP.
Results
Weather data
Maximum day temperatures at both sites occasionally exceeded 35°C towards the end of the growing season (Fig. 4). Temperatures in the cropping season at Tom Burke were relatively cool from emergence to tuber bulking as the crop was planted in autumn and harvested in spring (Table 2).Temperatures during the growing season at Louwna were generally warm in comparison to Tom Burke. Both seasons were dry with 19 mm total rainfall at Louwna and 15 mm at Tom Burke.
Daily net ecosystem exchange flux (NEE) in different growth phases of potato (VG, vegetative growth; TI, tuber initiation; TB, tuber bulking; M, maturation) from crop emergence to crop end.

Comparison of weather parameters at the monitored sites: mean maximum temperature (T max) and minimum temperature (T min) (°C) and mean daily solar radiation (R s) (MJ/m2) and total rainfall (mm) for different growth stages and the totals for the active growing period (emergence to end of tuber bulking)

Diurnal course of NEE
A positive NEE flux represents a net loss of CO2 to the atmosphere, whereas, a negative flux represents net uptake by the ecosystem. The mean NEE flux was generally positive (a net upward CO2 flux) from 19:00 to 06:00 (Fig. 5). During night-time, a net respiration and loss of CO2 from the ecosystem was observed, as soil micro-organisms and plants released CO2 into the atmosphere. During daytime when the crop photosynthesized, NEE flux was negative (a net downward flux). As water and nutrients were generally supplied in ample amounts, photosynthesis rate was assumed to be primarily a function of weather conditions. Peak NEE activity, which corresponds to highest CO2 uptake from the atmosphere, was observed between 11:00 and 12:00 at both sites, which is slightly before the diurnal peak in solar radiation. As radiation intensity declined in the afternoon, NEE also gradually declined. This suggests that photosynthesis rate was greatly driven by solar radiation, and that high temperatures in the afternoon may have limited photosynthesis. Although mean temperatures at Louwna and Tom Burke in the afternoon did not indicate substantial heat stress in potato, during tuber bulking maximum temperatures often well exceeded 30°C (Fig. 4), likely leading to heat stress.
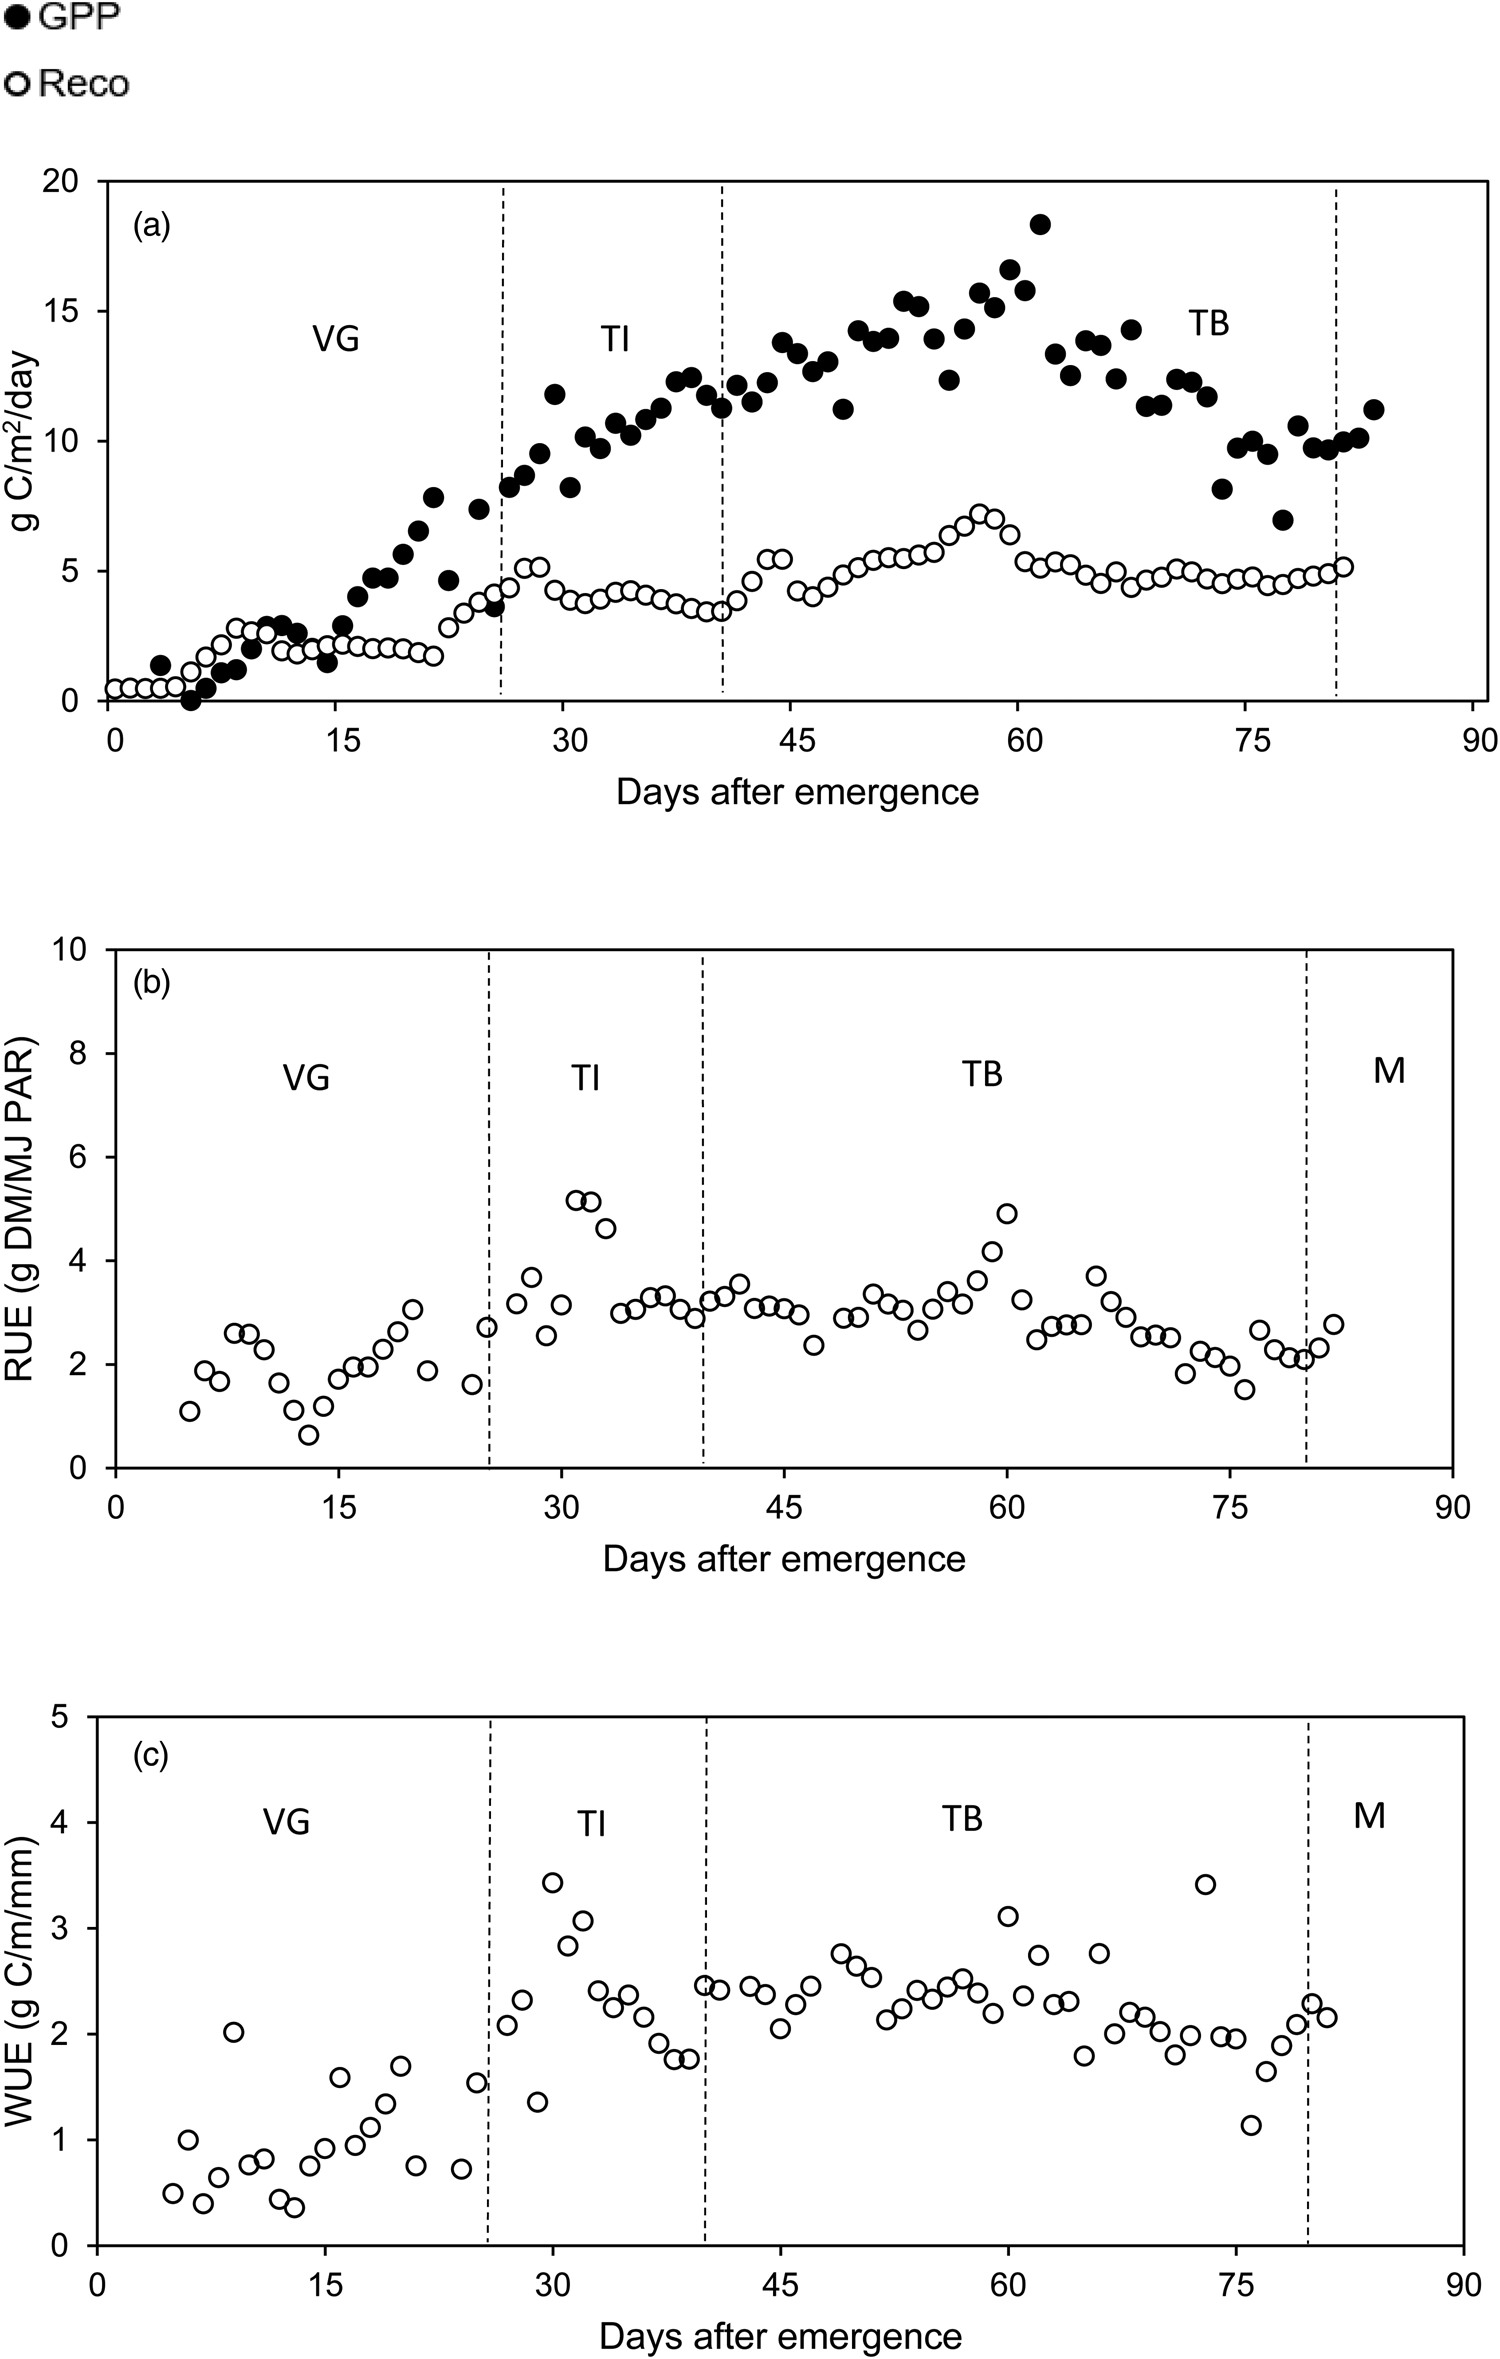
Seasonal pattern of daily ecosystem respiration (R eco) and gross primary production (GPP) (a), radiation use efficiency (RUE) (b) and water use efficiency (WUE) (c) at Louwna (VG, vegetative growth; TI, tuber initiation; TB, tuber bulking; M, maturation; DM, dry matter; C, carbon; PAR, photosynthetic active radiation).
Seasonal course of NEE
During the season, NEE and photosynthesis were influenced by crop growth stage. Early after planting, the NEE flux was slightly positive or neutral because the crop had a small leaf area and absorbed little CO2 from the atmosphere (Fig. 6). As the crop developed and photosynthesized more, the net flux became more negative. However, there were a few positive outliers in NEE and these mostly coincided with periods of low radiation and low temperature, resulting in reduced photosynthesis. Towards the end of the growing season, as the crop matured and senesced, photosynthesis reduced and NEE became less negative. The crop at Louwna achieved a greater peak NEE than at Tom Burke, probably because radiation intensities were higher in the spring-summer crop than in the winter crop. Moreover, the crop at Louwna was terminated earlier (for marketing reasons) than at Tom Burke and the relatively high NEE values at Louwna towards crop end indicated that the crop was still photosynthesizing actively at this time.
Seasonal pattern of daily ecosystem respiration (R eco) and gross primary production (GPP) (a), radiation use efficiency (RUE) (b) and water use efficiency (WUE) (c) at Tom Burke (VG, vegetative growth; TI, tuber initiation; TB, tuber bulking; M, maturation; DM, dry matter; C, carbon; PAR, photosynthetic active radiation).

GPP and ecosystem respiration
GPP was low after crop emergence and exponentially increased in the vegetative stage with expansion of the canopy (Figs 2 and 3). GPP reached a peak of 18.3 g C/m2/day (Louwna) and 9.6 g C/m2/day (Tom Burke) in the tuber bulking stage and gradually declined as the tubers developed. In the maturation stage, GPP declined as the leaves senesced. R eco was low early in the season and gradually increased to a peak of 7.0 g C/m2/day at Louwna, whilst at Tom Burke the maximum R eco was 5.1 g C/m2/day. The increasing R eco values later in the season at Tom Burke could be attributed to warmer temperatures in spring. In both areas, respiration rates increased with warmer temperatures, presumably due to an increase in activities of soil micro-organisms.
Fluctuations in GPP could be linked to changes in weather conditions (Fig. 4). In general, GPP was stable and relatively high when weather conditions were stable. There were sharp dips in GPP at Louwna at 14 and around 24 days after emergence (DAE), 48 and 77 DAE, which could be related to drops in day temperatures and radiation due to cloudy conditions (Figs 2 and 4). Similarly, at Tom Burke the dips on 36 and 88 DAE were related to cold conditions, cloudy conditions and low radiation (Figs 3 and 4). At 36 DAE, the minimum temperature was 2°C and it is likely that the crop was affected by cold night temperatures. The peak in GPP at 61 DAE at Louwna coincided with rainfall (Fig. 4).
The accumulated NEE, R eco and GPP were higher at Louwna than Tom Burke (Table 3), reflecting higher photosynthesis and respiration rates due to high radiation and temperatures in the spring-summer crop of Louwna. The tuber DM yields calculated from the accumulated GPP compared well with the yields measured in the field at crop end, suggesting that GPP measurements were fairly accurate.
Accumulated net ecosystem exchange (NEE), ecosystem respiration (R eco) and gross primary production (GPP) over the season and final tuber dry matter yield of potato (DMtuber) measured in the field and calculated from GPP

Radiation use efficiency
The winter crop at Tom Burke received less radiation, and was more efficient in utilizing the available radiation compared to the spring-summer crop at Louwna, leading to a higher mean RUE at Tom Burke (Table 4; Figs 2 and 3). Generally, RUE was rather erratic from crop emergence to tuber initiation, whereafter it was relatively stable from tuber intiation and slightly declined in the final stages of crop growth (Figs 2 and 3; Table 4). Strong fluctuations in RUE early in the season, particularly at Tom Burke, might be related to measurement errors. As both GPP and light interception were very low early in the season, relatively small errors in GPP and/or light interception estimations could lead to relatively large errors in RUE estimations. However, these outliers early in the season had little impact on the mean RUE over the season, as this was calculated as the biomass accumulated over the season divided by the accumulated radiation intercepted over the season. The biomass accumulated and light intercepted early after emergence contributed little to this.
Mean gross primary production (g C/m2/day), radiation use efficiency (g DM/MJ PAR) and water use efficiency (g C/m2/mm) for different growth phases of potato (VG, vegetative growth; TI, tuber initiation; TB, tuber bulking; M, maturation)
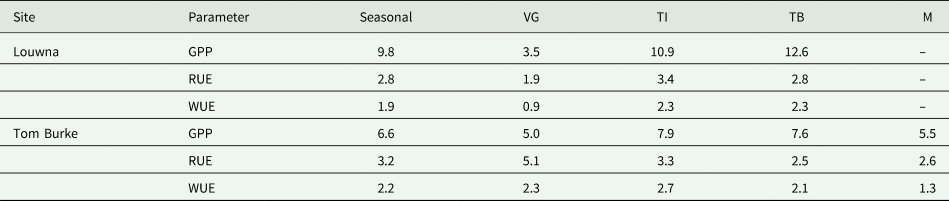
When full soil cover was reached in the tuber initiation and bulking stages, RUE was fairly stable, around 2.5–3.5 g DM/MJ PAR at both sites. The few outliers in these stages could be related to sudden changes in weather conditions. High RUE values between 31 and 33 DAE at Louwna coincided with a drop in maximum temperature and solar radiation (Figs 2 and 4). Similarly at Tom Burke, high RUE values at 87 and 88 DAE coincided with sharp drops in maximum temperature (from 32.0°C on 86 DAE to 20.9–21.9°C) and in solar radiation (from 15.2 to 3.5–5.4 MJ/m2; Fig. 3). A general negative relationship between incident radiation and RUE could be observed at both sites (Fig. 7). Moreover, mean RUE at Tom Burke was higher but reduced more severely at higher radiation level, compared to the RUE at Louwna. No clear relationships were found between RUE and maximum or minimum day temperature.
Relationship between radiation use efficiency (RUE) and incident solar radiation (R s) from tuber initiation to maturation in irrigated potato fields at Louwna and Tom Burke.

Water use efficiency
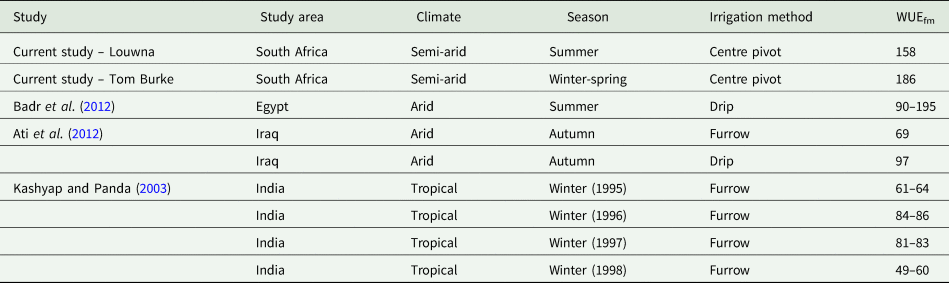
WUE rapidly increased after emergence as the plants developed, and reached a peak around tuber initiation (Table 4; Figs 2 and 3). Thereafter, WUE gradually declined in the tuber bulking and maturation stages. This decline was less pronounced at Louwna as the crop was killed earlier. WUE was more erratic in the early stages of crop growth, possibly because soil evaporation is relatively important in evapotranspiration when the crop canopy is not fully developed yet, and evaporation bears little relation with photosynthesis rate and GPP. Mean WUE was slightly higher at Tom Burke than at Louwna (Table 4). Cooler temperatures during the first half of the growing season at Tom Burke likely facilitated a more efficient use of water. The mean seasonal WUE (Table 4) was equivalent to a WUE of 55 kg DM/ha/mm at Tom Burke and 48 kg DM/ha/mm at Louwna, assuming a conversion rate of 2.5 from absorbed C to DM. Total accumulated ET over the season was 338 mm at Tom Burke and 466 mm at Louwna (Machakaire et al., Reference Machakaire, Steyn and Franke2021). Actual irrigation need of the crops was considerably higher due to irrigation inefficiency losses and losses due to drainage and run-off. WUE fm was 186 kg/ha/mm at Tom Burke and 158 kg/ha/mm at Louwna.
Daily fluctuations in WUE were influenced by temperature and VPD. Peaks in WUE were associated with cooler days and lower VPDs, which resulted in lower ET. WUE dipped on days with a high ET and a high temperature such as the period from 37 to 39 DAE at Louwna, when maximum temperature was between 34 and 36°C and ET above 6 mm/day.
Discussion
It is preferable to collect NEE data over long periods (i.e. more than 90 days) for accurate flux partitioning (Wutzler et al., Reference Wutzler, Lucas-Moffat, Migliavacca, Knauer, Sickel, Šigut, Menzer and Reichstein2018), but the short growing period of a potato crop makes this challenging. However, accumulated GPP in the present study closely matched observed final yields, which suggests the results from the flux partitioning are credible.
Photosynthesis rate, as indicated by GPP, remained high for most of the tuber bulking stage and only started to decline towards the end of tuber bulking and in the maturation stage. In general, crops in the tuber bulking stage have the highest demand for carbon dioxide when assimilates are partitioned from the leaves and stems into the developing tubers (Martínez-Maldonado et al., Reference Martínez-Maldonado, Castaño-Marín, Góez-Vinasco and Marin2021). The duration of the period that plants maintain a full canopy whilst assimilates are being partitioned to the tubers is important for final yield of potato (Haverkort and Struik, Reference Haverkort and Struik2015). Extending the tuber bulking stage can help to increase yield, but the observed decline in RUE and WUE towards crop end suggest this may come at a cost of reducing RUE and WUE. Peak WUE and RUE occurred in the late vegetative stage and the tuber initiation stage at Tom Burke, and in the tuber initiation stage at Louwna. RUE and WUE declined in the later phases of crop growth. This suggests that good early crop establishment and optimal growing conditions in the first half of the growing season are important to achieve a high overall RUE and WUE over the season.
Sudden changes in GPP, RUE and WUE could often be explained by weather events, particularly the passing by of cold fronts, leading to cooler and cloudy conditions, which resulted in lower GPP but higher RUE and WUE. When little incident radiation was available, the plant used the available radiation more efficiently. Also, the minimum temperature dropping close to freezing point one night at Tom Burke reduced both GPP and WUE on the following days. Generic relationships between these variables (GPP, RUE and WUE) and weather variables (temperatures, solar radiation and VPD) were often not clear, as changes in weather condtions were confounded with growth stage. For instance, RUE and WUE at Tom Burke clearly declined with higher day temperatures (data not shown), but high day temperatures (>40°C) occurred late in the growing period when the crop senesced.
Potato grown in the warm spring-summer season at Louwna had a higher accumulated NEE and GPP, absorbed more CO2, and a higher day-time photosynthesis compared to the winter crop at Tom Burke. However, the winter crop had higher RUE and WUE, probably due to the cooler temperatures and lower solar radiation levels. A reduction in RUE at higher radiation levels was more visible at Tom Burke. Since the crop at Tom Burke was growing in winter when radiation levels are low, photoacclimation could have resulted in the observed reduction in RUE when radiation levels increased later in the season towards spring. Plants alter the chemical composition (proteins, pigments, enzymes etc.) and morphology of the leaf in order to adjust photosynthesis to different light conditions as a long-term response (Murchie et al., Reference Murchie, Pinto and Horton2009). Leaf level acclimation is not reversible and cannot be altered in leaves grown under low light (in winter) when transferred to high light conditions (in spring/summer). This lack in ability of plants to acclimate to fluctuating irradiance conditions is a potential limitation to plant growth under field conditions (Morales and Kaiser, Reference Morales and Kaiser2020).
The RUE values observed in this study (Table 4) were relatively high but within the range of values reported by Kooman et al. (Reference Kooman, Fahem, Tegera and Haverkort1996), based on a study in Tunisia (Table 5). RUE for potato grown under optimal conditions in crop growth models is often assumed to be 2.5 g/MJ PAR (Kooman and Haverkort, Reference Kooman and Haverkort1995), while we observed mean RUE values over the season of 2.8 and 3.2 g/MJ PAR, and even higher values in particular growth stages (Table 4). Warm temperatures, especially at Louwna, and the observed diurnal pattern in NEE pointing at heat stress experienced by the crop in the afternoons, suggest that conditions in the field were not always optimal for photosynthesis. Potato is sensitive to high temperatures (above 30°C), which limit growth and DM production due to heat stress constraining photosynthesis (Timlin et al., Reference Timlin, Rahman, Baker, Reddy, Fleisher and Quebedeaux2006; Peng et al., Reference Peng, Manevski, Kørup, Larsen, Zhou and Andersen2021). Therefore, the RUE values under optimal conditions are likely to be even higher than the mean values observed in this study. Given the central role of RUE in many crop growth models (Griffin et al., Reference Griffin, Johnson and Ritchie1993; Haverkort et al., Reference Haverkort, Franke, Steyn, Pronk, Caldiz and Kooman2015; Borus et al., Reference Borus, Parsons, Boersma, Brown and Mohammed2018), a correct quantification of RUE and how it is affected by temperatures is essential for accurate crop growth simulations.
Comparison of mean seasonal radiation use efficiency (RUE) (g/MJ PAR) of potato in different locations

The WUE values observed in this study were generally higher than those from other studies (Table 6). The differences could be attributed to the method used to determine crop evapotranspiration (ET) as well as the type of irrigation. Badr et al. (Reference Badr, El-Tohamy and Zaghloul2012) determined ET from reference ETo and crop coefficient whilst Ati et al. (Reference Ati, Iyada and Najim2012) used the soil water balance method and Kashyap and Panda (Reference Kashyap and Panda2003) used a weighing lysimeter. It is likely that ET calculated using other methods may be higher than that measured by the ECV, resulting in lower WUE values.
Comparison of water use efficiency (WUEfm) (kg/ha/mm) of potato at different locations
Conclusions
A potato crop growing in winter generally had a lower GPP, but a higher RUE and WUE due to cooler growing conditions and lower radiation levels.
To optimize DM production, WUE and RUE, it is important to get potato crops well established with a full canopy early after planting, and maintaining the canopy for as long as possible. However, the data suggest that the benefits of extending crop duration may be limited, as the crop becomes less efficient with radiation and water as it matures.
Specific dips and peaks in GPP, RUE and WUE could be related to sudden changes in weather conditions, particularly the passing by of cold fronts and when minimum night temperatures drop close to zero. However, the effect of weather conditions were confounded with crop stage, making it difficult to derive generic relationships.
The RUE observed over the growing period in the present study was high, relative to findings by other field studies and values used as optimal RUE in potato modelling studies, despite relatively warm growing conditions in the current study that were likely to be sub-optimal for potato.
Acknowledgements
Technical support and data collection by Mrs. Nozi Radebe and postgraduate students (Phiwo Mkhize, Itumeleng Sekoboane, Kumsa Masizana, Lucian Fredericks, Randy Kumasamba and Alex Mukiibi) is highly appreciated.
Author contributions
A. T. B. Machakaire, J. M. Steyn and A. C. Franke conceived and designed the study. A. T. B. Machakaire conducted data gathering, performed data analysis and wrote the article. A. C. Franke and J. M. Steyn contributed to the article writing.
Financial support
This work was financially supported by Potatoes South Africa.
Conflict of interest
The authors declare that they have no known competing financial interests or personal relationships that could have appeared to influence the work reported in this paper.
Ethical standards
Not applicable.


 Open access