

1. Introduction
Numerous wireless power transfer (WPT) systems operate through nonuniform magnetic field strength distribution at receiving plane. Magnetic field nonuniformity in magnetically coupled resonant (MCR) WPT system causes resonant frequency splitting phenomena and impedance mismatching when receiving coil (RX-coil) is not properly aligned with transmitting coil (TX-coil) [Reference Lee, Lee, Oh and Yu1, Reference Vinko, Biondić and Bilandžija2]. Namely, the efficiency of WPT system is significantly impaired due to frequency splitting phenomena or impedance mismatching [Reference Lee, Lee, Oh and Yu1, Reference Park, Tak, Kim, Kim and Nam3]. Consequently, to achieve efficient energy transfer along with greater degree of freedom, in terms of RX-coil position, such WPT systems require frequency tracking [Reference Park, Tak, Kim, Kim and Nam3] and automatic impedance matching [Reference Park, Tak, Kim, Kim and Nam3, Reference Wang, Che, Dionigi, Mastri, Mongiardo and Monti4]. In order to create uniform magnetic field strength distribution at a receiving plane, various TX-coil designs are developed [Reference Lee, Lee, Oh and Yu1, Reference Wang, Che, Mongiardo and Monti5–Reference Xu, Hu, Wang, Mao and Sun21].
In this paper, a novel 3D structure of TX-coil is proposed to achieve uniform magnetic field distribution at the given receiving plane (114 × 28 cm). Presence of uniform magnetic field strength distribution at the receiving plane will provide stable resonant frequency regardless of RX-coil position due to steady value of magnetic coupling factor k between TX- and RX-coil. Hence, uniform magnetic field strength distribution at a receiving plane results in a WPT system that does not require frequency tracking and automatic impedance matching [Reference Jolani, Yu and Chen8]. Uniform magnetic field strength distribution also provides uniform and simultaneous power delivery to multiple RX-coils, i.e., loads. Furthermore, uniform magnetic field strength distribution at a receiving plane ensures nondegraded wireless power transfer efficiency regardless of RX-coil position within receiving plane [Reference Lee, Lee, Oh and Yu1].
The proposed TX-coil structure consists of two layers and is based on optimization method which is validated by simulation and measurement results. Since the proposed TX-coil structure is characterized by folded sides, it is more suitable for large sized WPT systems, for instance, installation under office desk. Computer simulations of TX-coils with different winding arrangement (coil layers relative spacing), but with the same outer dimensions (114 × 28 cm), were run, and magnetic field distribution at the given receiving plane which is above the TX-coil was observed. According to the simulation results, experimental TX-coils are made out of Litz wire instead of PCB realization which is not appropriate for large receiving plane. Both computer simulation and measurement results verified that uniform magnetic field distribution at considerable surface of the receiving plane is produced by the novel 3D TX-coil structure. With the approximately 100 W of output power at receiving side of a WPT system, application of such TX-coil enables simultaneous wireless charging of monitors, smartphones, laptops, etc.
2. Model Explanation
To maintain stable transfer efficiency and power delivery to freely moving RX-coil(s), TX-coil in WPT system should generate uniform magnetic field [Reference Kim, Yun, Lee and Yook18, Reference Xu, Hu, Wang, Mao and Sun21]. Such field distribution is difficult to achieve with “standard” flat wound coils. When designing a 3D coil structure, a fast method for magnetic field evaluation is a significant advantage. A common approach for magnetic field evaluation is using dedicated software (e.g., Ansys Maxwell, FEMM, MATLAB, etc.) which executes a numerical analysis. Such approach is very time consuming, both in preparation (model preprocessing) and in simulation itself.
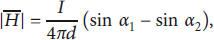
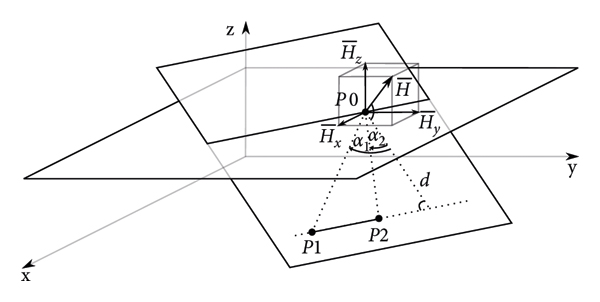
If the 3D TX-coil structure can be represented as a number of linear sections, the magnetic field simulations can be significantly simplified. Uniformity of magnetic field of the TX-coil is evaluated with respect to the plane of interest. In MCR-WPT, where multiple loads can be wirelessly powered, a flat surface (e.g., office desk) should have uniform magnetic field distribution. Therefore, magnetic field evaluations are done with respect to this plane of interest, i.e., referent plane. Under these conditions (coil represented by linear sections and a defined referent plane), a fast magnetic field simulation model can be developed. Since a coil is defined as a piecewise linear structure, a magnetic field in any given point can be calculated as a vector sum of magnetic fields generated by each linear segment of 3D coil structure. Each linear segment is defined by two points in 3D space, P1 and P2, as shown in Figure 1. When a current flows from P1 to P2, the linear segment P1-P2 generates a magnetic field. Figure 1 shows magnetic field generated by one linear segment (P1-P2) in a single point (P0) on referent plane. Magnitude of the magnetic field strength at point P0 can be calculated using (1).
Magnetic field in the point P0 generated by the linear segment P1-P2.
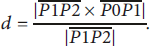
The shortest distance between P0 and the line which passes through P1 and P2 equals
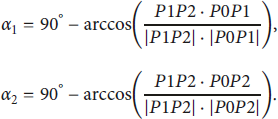
The angles α1 and α2 are calculated as follows:
For coil current I in linear segment flowing from P1 to P2, the direction of the magnetic field strength
 at point P0 is perpendicular to the plane defined by points P0, P1, and P2 (Figure 1). Equation (1) gives only the magnitude of the magnetic field strength, but the direction of magnetic field strength can be calculated by
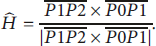
With respect to the referent plane, only the part of the magnetic field directed in the z-axis (
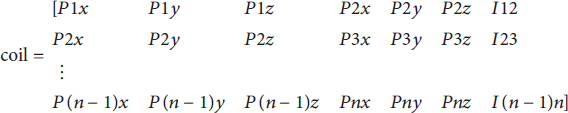
 z in Figure 1) is of interest. The proposed magnetic field modelling method is implemented in MATLAB. Coil is defined as piecewise linear structure using the array, where each row in array defines one segment of the coil. The first three values define the position of point P1, the next three values define the position of point P2, and the last value defines the current from P1 to P2.
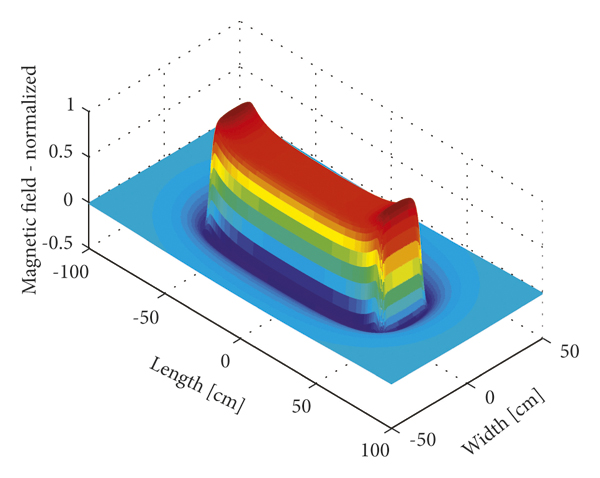
For a coil structure defined as an array of linear current segments, a magnetic field in each point of a referent plane can be calculated. Figure 2 shows the simulated magnetic field for a single-layer rectangular coil (114 × 28 cm) at referent plane placed 30 mm above the coil.
Simulated magnetic field distribution generated by single-layer rectangular coil (114 × 28 cm).
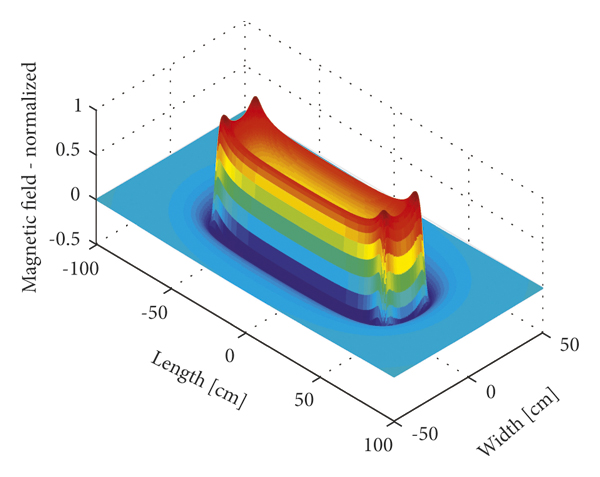
The magnetic field has a bowl-like shape with pronounced spikes at the coil corners. For application in position tolerant (in terms of RX-coil) WPT system, such magnetic field shape is not suitable. The rectangular shape of the coil is one of the least favorable candidates for uniform magnetic field (with triangular coil shape being the worst), but it is the shape widely used in WPT systems. This is the main motivation for the development of the rectangular 3D coil structures which can generate uniform magnetic field.
In this paper, we focused on a two-layer 3D coil structure, due to simpler fabrication compared to a multilayer coil with respect to required precision of manufacture.
2.1. Optimization of Coil Structure
Figure 3 shows the generalized structure of two-layer 3D coil. Coil layers can be distinguished by their color; the first layer is shown in black and the second layer in red. Second coil layer is placed at a depth D 2 relative to the first coil layer, and it has narrower width W 2 compared to width of the first coil layer W. 3D coil structure has a length L with both coil layers folded to a depth D at the coil ends. Grey surface represents the referent plane placed at the distance h from the coil.
Two-layer 3D coil structure.
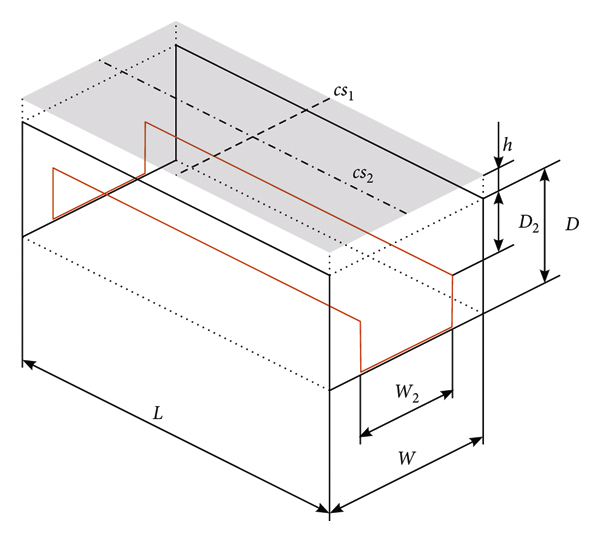
Coil structure optimization is a two-step procedure. In step one, the goal is to ensure a uniform field distribution across a width of the coil, i.e., over cross-section of the referent plane named cs 1 in Figure 3. In step two, the goal is to ensure a uniform field distribution across a length of the coil, i.e., over cross-section of the referent plane named cs 2 in Figure 3.
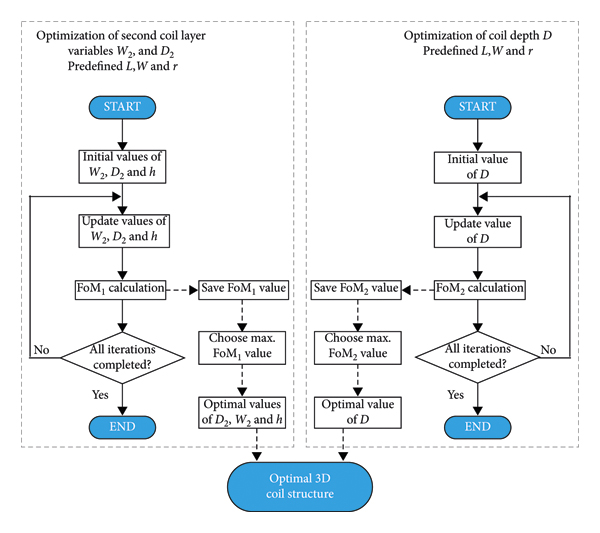
Figure 4 shows the proposed optimization framework. The maximal allowed ripple value of magnetic field (r) and first coil layer dimensions (width W and length L) are considered as inputs. The optimization outputs are optimal transfer distance (h), second coil layer variables (D 2, W 2), and end fold depth D, for which the magnetic field strength and uniform surface size are maximized.
Optimization framework.
Extensive analysis is conducted, resulting in mathematical model for rectangular coil optimization. Conducted analysis and mathematical model are explained in the next two sections.
2.2. Optimization of Second Coil Layer Variables
To ensure a uniform magnetic field distribution over cross-section cs 1 (width of the coil), a position of the second coil layer must be optimized. Perfectly uniform magnetic field distribution cannot be achieved, so one parameter that must be taken into account is the maximal ripple of the magnetic field. The second parameter is the distance h of the referent plane from the coil. For different distances h, different values of the second coil layer variables (W 2 and D 2) obtain “most” uniform field distribution. Similarly, for different allowed ripple values of a magnetic field, different values of the second coil layer variables (W 2 and D 2) result in different shortest distance of the referent plane h.
Optimization deals with the following problem: finding values of the second coil layer variables to generate the most uniform field possible at a shortest distance between TX-coil and a referent plane. However, such optimization problem misses some important aspects. Namely, the short distance generally results in high magnetic field strength. Certain values of the second coil layer variables that ensure uniform field at short distances do that at the cost of a lower magnetic field strength. This would decrease the overall performance of WPT system. The second important aspect is the percentage of the cross-section over which the uniform field is achieved. It is quite easy to get uniform field at short distance with high field strength, but only over a small fraction of total coil width.
Accordingly, the first part of the optimization process is finding values of the second coil layer variables to get uniform field on most of the cross-section, but also with a highest magnetic field strength value. Therefore, as a figure of merit (FoM1), we propose the product of average magnetic flux density (calculated only for part of the cross-section where magnetic field strength is uniform with respect to defined ripple value) and percentage of cross-section on which the uniform field is achieved.
The first step in second coil variables’ optimization is the FoM1 analysis. This is a 4-dimensional problem. FoM1 is affected by the referent plane distance h (first dimension), maximal allowed ripple of the uniform field (second dimension), and variables (W 2, D 2) of second coil layer (third and fourth dimension, respectively). Since the referent plane distance h must be observed with respect to coil width W, their ratio (h/W) will be used in FoM1 analysis. We assume the same current magnitude and direction in both coil layers.
The four parameters are varied in the following ranges: h/W ratio ranges from 1% to 20% (20 steps), ripple value ranges from 1% to 20% (6 steps), width of the second coil layer W 2 ranges from 0 to the coil width W (50 steps), and depth of the second coil layer D 2 ranges from 0 to half of the coil width W/2 (50 steps).
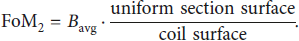
The following methodology was used: for fixed values of h/W ratio and ripple, magnetic field strength was calculated for each possible value of the second coil layer variables. Namely, magnetic field strength for each value of D 2 and W 2 was calculated over the cs 1 cross-section of the coil, and magnetic field shape is analyzed. In this step of the coil optimization, the coil length L is set to be at least 10 times larger than the coil width W, and the ends of the coil are not folded down to the depth D. Figure 5 shows results of the analysis of a magnetic field shape for four different positions of second coil layer. Position of the second coil layer is completely determined by the values of the second coil layer variables, D 2 and W 2.
Examples of magnetic field shape analysis: (a) ripple = 1%, h/W = 0.08, D 2/W = 0.18, W 2/W = 0.7; (b) ripple = 1%, h/W = 0.08, D 2/W = 0.12, W 2/W = 0.6; (c) ripple = 1%, h/W = 0.08, D 2/W = 0.24, W 2/W = 0.7; (d) ripple = 1%, h/W = 0.08, D 2/W = 0.1, W 2/W = 0.7.
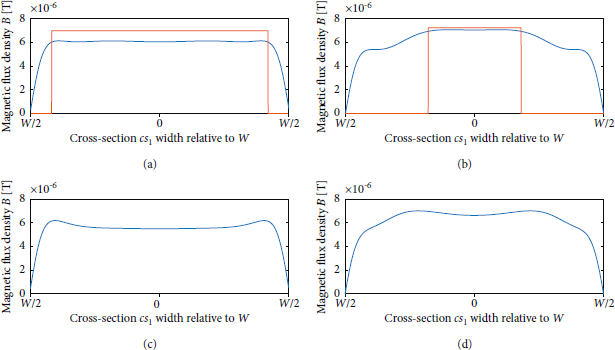
Ripple of the magnetic field is used as input parameter in the optimization process. It is used to determine the size of the uniform section of magnetic field. Uniform section is defined as a section of the coil where the magnetic field deviation does not exceed the defined ripple value. The analysis of the magnetic field begins at the center of the cross-section and moves to the sides. The magnetic field strength at the center is used as an initial average field strength value. The two adjacent magnetic field strengths are compared to the initial value, and if they do not deviate from initial value by more than the defined ripple, they are considered to be in the uniform section of the magnetic field. New average field strength of uniform section is then calculated. The next two adjacent field values are then evaluated using the same methodology. At one point, the field values that deviate by more than the defined ripple value will be reached. These field values and all the remaining ones are not a part of the uniform magnetic field section. This can be seen in Figures 5(a) and 5(b). The section of the magnetic field shape that is considered uniform (with defined ripple) corresponds to the top section of the square waveform (Figures 5(a) and 5(b)).
In Figures 5(c) and 5(d), different shapes of the magnetic field that correspond to different positions of the second coil layer are shown. Such magnetic field shapes are not considered uniform because of the two peaks at the sides. While the center part of the magnetic field has uniform field distribution (Figure 5(c)), the overall magnetic field shape is considered nonuniform. The parts of the coil cross-section where the magnetic field strength exceeds the maximal allowed field strength (average strength + ripple value) can potentially be harmful for receiver circuits in WPT system, which are designed for uniform magnetic field. For that reason, Figures 5(c) and 5(d) have no square waveform representing the uniform section of the magnetic field.
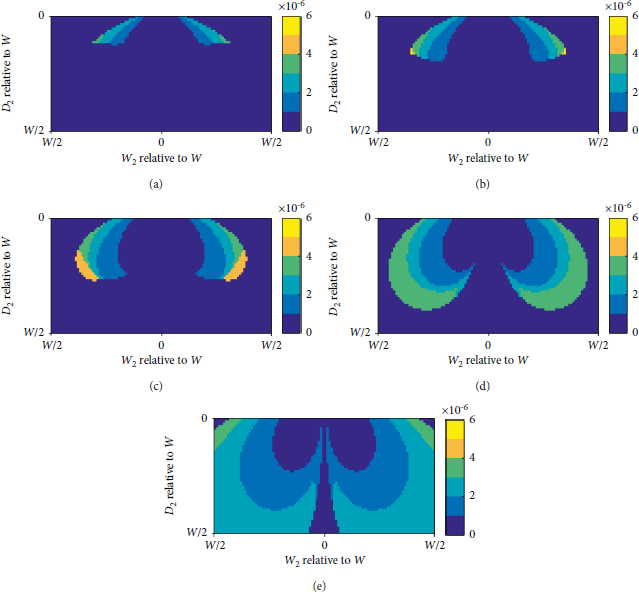
To summarize, there are two possible outcomes of magnetic field shape analysis. The uniform section of the magnetic field is identified, or the magnetic field is considered nonuniform. For magnetic field shapes that have a uniform section, the FoM1 is calculated:
where B avg is an average value of magnetic flux density calculated only for the uniform section of magnetic field.
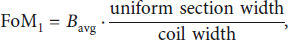
The same methodology is used to evaluate the magnetic field shapes for each possible position of the second coil layer. As a result, we get FoM1 values for each position of the second coil layer. Figure 6 shows the FoM1 values for five different h/W ratios with fixed ripple value.
FoM1 values for different combinations of h/W ratio and ripple value of 2%: (a) ripple = 2%, h/W = 0.05; (b) ripple = 2%, h/W = 0.07; (c) ripple = 2%, h/W = 0.10; (d) ripple = 2%, h/W = 0.14; (e) ripple = 2%, h/W = 0.20.
For low h/W ratio value, majority of positions of second coil layer result in nonuniform field (dark blue areas). With higher h/W ratio values, more positions of second coil layer generate uniform magnetic field. For each fixed combination of h/W ratio and ripple value, there is an optimal position of the second coil layer which results in maximal FoM1 value. This maximal FoM1 value is represented as one dot in Figure 7. Figure 7 shows maximal FoM1 values for all evaluated combinations of h/W ratio and ripple.
FoM1 analysis results.
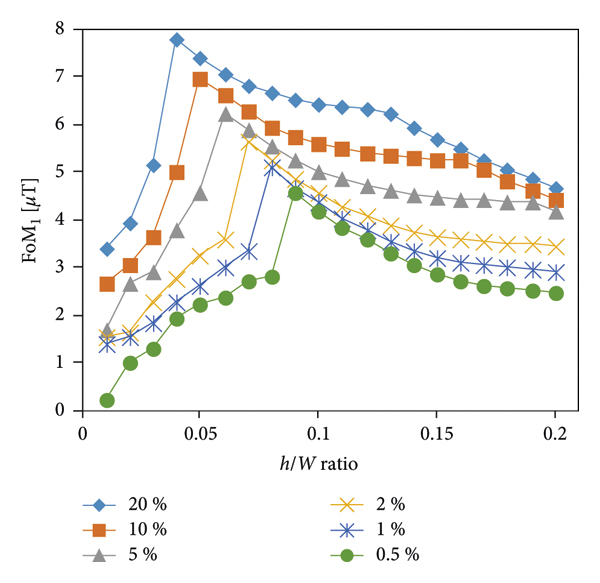
It can be seen that, for a higher ripple value, a higher FoM1 can be achieved. For each ripple value, the maximal FoM1 value is achieved at different h/W ratio (different distance between the referent plane and the coil). For higher values of h/W ratio, large uniform section can be easily achieved, but the average magnetic field strength is lower. For lower h/W ratio values, we have higher average magnetic field values, but narrower uniform sections. The maximal FoM1 is achieved at optimal distance from the coil (optimal h/W ratio) with large uniform section and high average magnetic field strength. These optimal h/W ratios are shown with blue markers in Figure 8.
Optimal h/W ratios for different ripple values: simulated results are denoted by blue markers, and fitted mathematical model is represented by solid line.
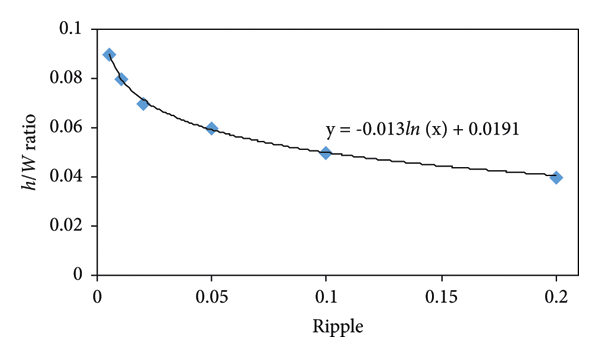
For a given ripple value and known coil width W, optimal distance h of the referent plane can be calculated as

Once the distance of the referent plane is selected, the position of second coil layer can be determined. Figure 9 shows the positions of second coil layer that achieve maximal FoM1, for different ripple values with referent plane at optimal distance.
Positions of second coil layer that achieve maximal FoM1, for different ripple values with referent plane placed at optimal distance.
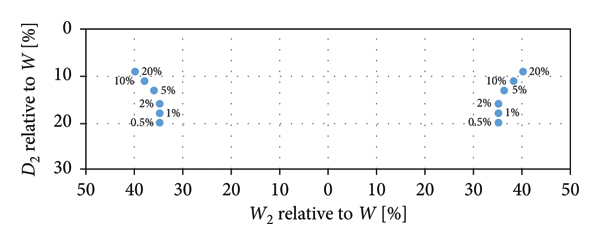
For the lowest evaluated ripple values (0.5%–2%), the optimal width of the second coil layer, W 2, is 70% of the first coil layer width, W. For larger ripple values, the second coil layer width increases. The depth of second coil layer, D 2, shows direct correlation with the ripple value (Figure 10).
Optimal depth of second coil layer (D)2 for different ripple values: simulated results are denoted by blue markers, and fitted mathematical model is represented by solid line.
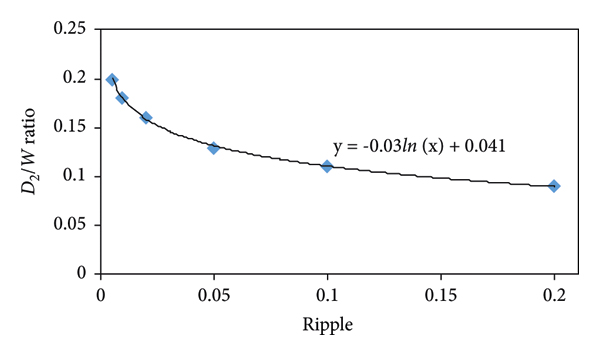
For a given ripple value and known coil width W, with referent plane placed at optimal distance, the depth of second coil layer can be calculated as

Figure 11 shows resulting magnetic field with optimized cs 1 cross-section, for 0.5% ripple.
Simulated magnetic field distribution generated by two-layer coil with optimized cs 1.
2.3. Optimization of Coil Depth D
To achieve uniform magnetic field across cs 2 (Figure 3), the narrower sides of the coil structure are folded downwards to the depth D. The goal is to get magnetic field shape from cross-section cs 1 across the length of the coil L. If the coil ends are not folded down, at the ends of the coil there is a significant increase in the magnetic field strength (Figure 11).
The second part of the optimization process is determining the depth, D, to which the sides have to be folded down. The methodology to achieve this is the same as in the first part of the optimization process, but with one significant difference. The magnetic field shape throughout the coil length should be consistent, meaning that the magnetic field strength should not deviate across cs 2 cross-section. If the same ripple value as in cs 1 optimization would be allowed during cs 2 optimization, the result would have unwanted field increase at the coil ends, as shown in Figure 12(a). Thus, surface enclosed by W and L of the coil has a minor part of uniform magnetic field, as shown in Figure 13(a). In this stage of optimization, modified figure of merit is adopted:
Magnetic field shape (top view) for different ripple values: (a) cs 1 5%, cs 2 5% (D/W = 0.19); (b) cs 1 5%, cs 2 0.5% (D/W = 0.43); (c) cs 1 0.5%, cs 2 5% (D/W = 0.19); (d) cs 1 2.5%, cs 2 2.5% (D/W = 0.26).
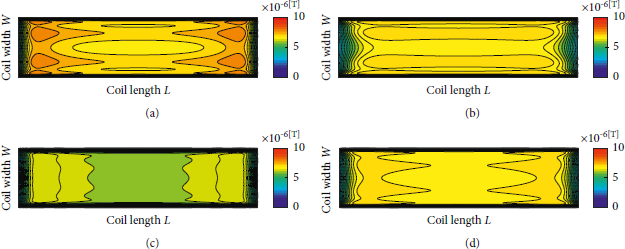
Uniform field section (top view) for different combinations of cs 1 and cs 2 ripple values: (a) uniform magnetic field section (49.81%) for magnetic field shape from Figure 12(a), FoM2 = 0.0015 T; (b) uniform magnetic field section (75.78%) for magnetic field shape from Figure 12(b), FoM2 = 0.0021 T; (c) uniform magnetic field section (75.92%) for magnetic field shape from Figure 12(c), FoM2 = 0.0019 T; (d) uniform magnetic field section (79.85%) for magnetic field shape from Figure 12(d), FoM2 = 0.0021 T.
It is not practical to try to optimize cs 2 cross-section for 0% ripple, but using a ripple value 10 times lower than that used during cs 1 optimization gives good enough result (Figure 12(b)).
Due to high D/W ratio (0.43), the uniform section of the magnetic field at the coil end is quite irregular (Figure 13(b)). Such shape of the uniform field was obtained by optimizing cs 1 for 5% ripple and cs 2 for 0.5% ripple.
Alternative approach is to first optimize cs 1 for 0.5% ripple and then optimize cs 2 for 5% ripple. The resulting magnetic field is given in Figure 12(c). Uniform surface is 0.14% larger, and FoM2 value is 10% lower, but the shape of the surface with uniform magnetic field follows the rectangular shape significantly better, as shown in Figure 13(c).
There is a trade-off between FoM2 value and the shape of the surface with uniform magnetic field. The best results are obtained when both the cs 1 and the cs 2 optimizations are done for ripple value equal to one-half of the desired ripple. Figure 12(d) shows the magnetic field when cs 1 and cs 2 are optimized for 2.5% ripple. The uniform surface (Figure 13(d)) is drawn for ripple value of 5%. It results in the highest FoM2 value and largest uniform surface. This approach is chosen as optimal.
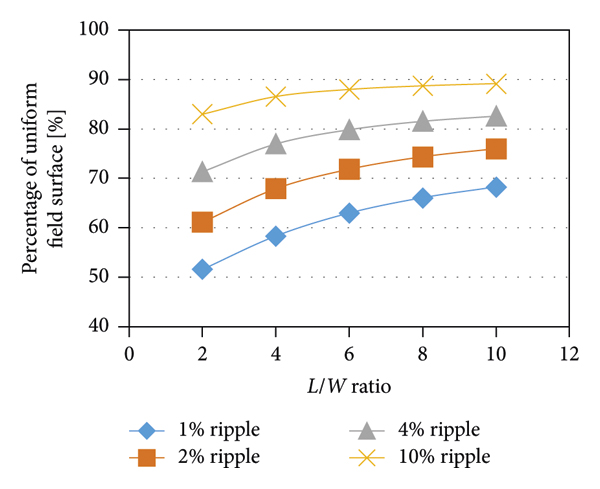
The depth of the end fold D is a function of the ripple value (r) and the length to width ratio (L/W) of the coil. Figure 14 shows the end fold depths for different ripple values and L/W ratios. The fold depth increases for coils with larger L/W ratio and with lower allowed ripple value.
Required end fold depth (D) for different ripple values and L/W ratios.
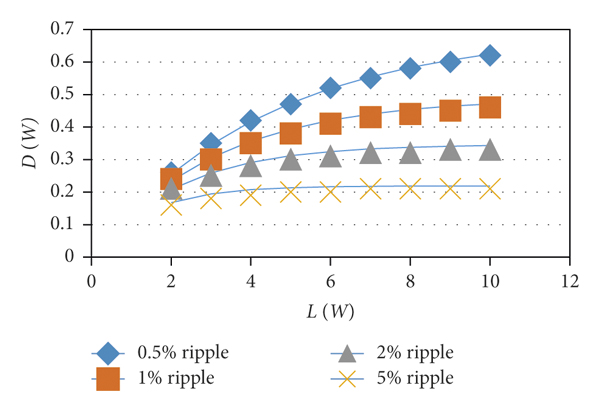
Results of cs 2 optimization are given as markers, and solid lines represent mathematical model, (9), which can be used to calculate required folding depth.
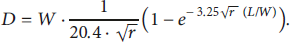
The proposed optimization method is developed for rectangular coil where the percentage of uniform surface increases with higher L/W ratio of the coil (Figure 15).
Percentage of uniform field surface for different L/W ratios.
3. Measurements
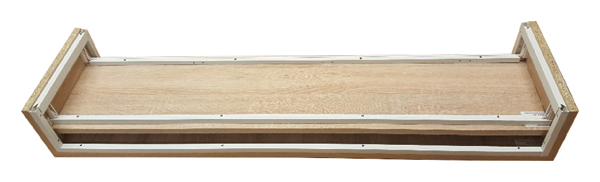
To evaluate the developed optimization method, magnetic field measurements are performed on fabricated coils (proposed and conventional). The first coil layer size is set as L = 114 cm, W = 28 cm. The position of second coil layer is calculated using proposed optimization method for ripple value of 1%. Optimizations for cross-sections cs 1 and cs 2 are done for 0.5% ripple (one-half of the desired ripple). Optimal height of the referent plane equals (7): h = 2.46 cm. Calculated variables of the second coil layer position are W 2 = 19.6 cm, D 2 = 5.6 cm. Calculated end fold depth is D = 11.8 cm. The fabricated proposed TX-coil prototype is shown in Figure 16. Actual placement of the coil layers differs a bit from the calculated values, mainly due to the limited precision of fabrication (W 2 = 20 cm, D 2 = 6 cm, D = 12 cm). The wire that forms coil layers is placed in the white wire casing. Moreover, proposed TX-coil prototype is constructed using plywood framework to hold wire casings and ensure flat surface above in order to carry out magnetic field measurements in the same plane. Each coil layer consists of 4 windings of Litz wire, resulting in inductance of 103 μH.
Fabricated proposed TX-coil, bottom view.
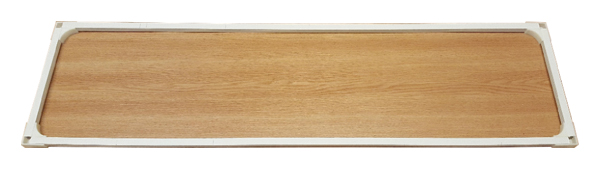
Conventional, single-layer rectangular coil (114 × 28 cm) is also fabricated using Litz wire placed in the white wire casings installed at one side of the flat plywood board (Figure 17). Coil is made up of 6 windings, which results in inductance of 116 μH.
Fabricated conventional TX-coil, bottom view.
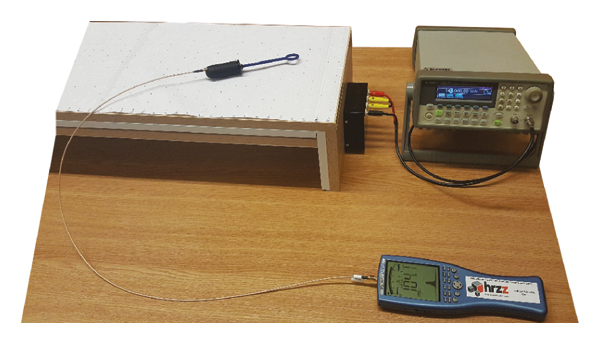
The magnetic field strength of these coils was measured at a temperature of 26°C and humidity of 50%. Field strength measurements are performed in the near field zone with measuring equipment consisting of a Spectran NF-5035 spectral analyzer, PBS-H3 probe (25 mm magnetic field test with 50 Ohms SMB m socket), and SMA cable. In performed experiments, fabricated TX-coils were energized by Agilent 33250A signal generator at operating frequency of 150 kHz.
Magnetic field strength of both fabricated TX-coils is measured at 900 points in a receiving plane 30 mm above the coil. Because it is measured by a PBS-H3 probe connected to the SMA input of a Spectran NF-5035 instrument, the analyzer provides highly sensitive measurement of an external alternating field up to 0.2 V max. Thus, the spectrum analyzer returns voltage values that are proportional to the magnetic field strength values. Hold mode is selected to measure the field strength values. Measuring setup is shown in Figure 18, and measurement results are given in Figure 19, along with the simulation results.
Measuring setup.
Simulation and measurement results: (a) simulated magnetic field distribution of optimized folded 3D coil structure; (b) normalized simulation results, top view; (c) normalized measurement results, top view (optimized folded 3D coil structure); (d) normalized measurement results, top view (conventional coil structure).
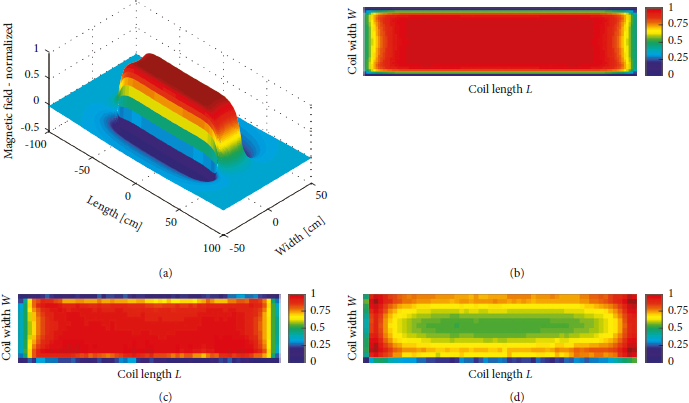
Simulation results of the proposed folded 3D coil structure are shown in Figures 19(a) and 19(b). Measurements of magnetic field strength distribution at receiving plane for both fabricated TX-coils (Figures 19(c) and 19(d)) confirmed that optimal and proposed folded 3D TX-coil structure provides significantly larger uniform magnetic field strength section in comparison to conventional TX-coil structure. From measured magnetic field shape (Figures 19(c) and 19(d)), it can be seen that one side of the coil has slightly higher field values than the opposite side. This is due to limited precision of wire windings placement in the wire casing. Aside from that, measurement and simulation results match to a high degree.
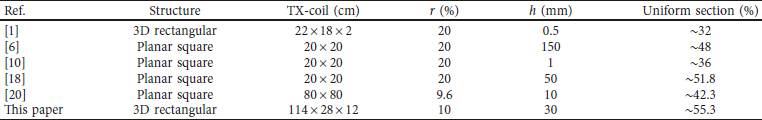
Measured characteristics of different TX-coil designs which generate uniform magnetic field strength distribution at receiving plane are listed in Table 1. In comparison with other TX-coil characteristics from Table 1, the proposed coil generates improved magnetic field strength distribution with respect to uniform section of receiving plane. Further development of the proposed TX-coil will be aimed at reducing coil depth, D, which will result in lower profile of TX-coil.
4. Conclusion
A novel 3D TX-coil structure with improved uniform magnetic field distribution is proposed. Optimization methodology is presented and optimizing method is developed for rectangular 3D coil structure. Optimization results in coil structure that has maximized average magnetic field strength and uniform surface section. Computer simulations and experimental verification of the optimization method are successfully carried out. Both TX-coils, conventional and proposed, are fabricated to carry out magnetic field measurements which confirmed that proposed coil, unlike conventional coil, generates uniform magnetic field strength distribution at receiving plane. Furthermore, measured results show larger uniform section in comparison to other optimized TX-coil structures. Depending on the maximal ripple and proportions of the coil, optimization method results in 3D coil structure that generates improved uniform magnetic field strength distribution across 50% to 90% of the receiving plane.
Data Availability
The data used to support the findings of this study can be available upon request.
Conflicts of Interest
The authors declare that they have no conflicts of interest.
Acknowledgments
This work has been supported in part by Croatian Science Foundation under the project “Efficient Wireless Power Supply” (UIP-2017-05-5373).


 Open access