


Introduction
Emperor penguins are highly reliant on stable fast ice around the margins of the Antarctic continent between March and December for successful breeding (e.g. Stonehouse 1953, Prévost 1961, Barbraud & Weimerskirch Reference Barbraud and Weimerskirch2001, Kooyman & Ponganis 2016, Fretwell & Trathan Reference Fretwell and Trathan2019, Schmidt & Ballard Reference Schmidt and Ballard2020, Labrousse et al. Reference Labrousse, Nerini, Fraser, Salas, Sumner and Le Manach2023). Consequently, it is thought that breakout of their fast-ice breeding platform before the end of December, and especially before early December, can lead to partial or full breeding failure as chicks drown prior to fledging (Fretwell Reference Fretwell2024a). Additionally, long distances from the breeding site to the fast-ice edge can negatively impact breeding as it can make the access to foraging grounds more difficult (Kooyman et al. Reference Kooyman, Ainley, Ballard and Ponganis2007, Younger et al. Reference Younger, Clucas, Kooyman, Wienecke, Rogers and Trathan2015, Labrousse et al. Reference Labrousse, Fraser, Sumner, Le Manach, Sauser and Horstmann2021). Therefore, the penguins must choose a location that is stable enough until chicks are ready to fledge but also sufficiently close to the edge of the fast ice. Hence, emperor penguins are highly vulnerable to changes in fast ice that could be linked to wider changes in sea ice associated with ocean-climate warming, as well as changes to the margins of the Antarctic Ice Sheet, which may disrupt sea ice via changes in ice flow or major calving events from floating ice shelves. Models linking sea-ice extent to breeding success suggest that almost all colonies may lose > 90% of their populations by the end of the century if current rates of warming persist, rendering them quasi-extinct (Jenouvrier et al. Reference Jenouvrier, Che-Castaldo, Wolf, Holland, Labrousse and LaRue2021).
Emperor penguins are vulnerable both to natural variations in fast-ice conditions that lead to early breakout and to changes to the glaciers and ice shelves at the margins of the Antarctic Ice Sheet. Colonies typically locate immediately adjacent to the edges of the ice sheet or nearby icebergs because they prefer to be in sites sheltered from the wind (Fretwell & Trathan Reference Fretwell and Trathan2021). Calving of icebergs from ice shelves can promote local sea-ice loss by pushing away or causing fracturing of the sea ice or by removing the embayment’s shelter from the wider ocean and swell. For example, following a calving event at Barrier Bay in 2020 that shortened and opened the embayment, associated early sea-ice loss led to breeding failure in 2020 and 2021, and the colony has not returned in subsequent years (Wienecke et al. Reference Wienecke, Lieser, McInnes and Barrington2024). Calving can also completely or partially change the configuration of the location where a colony usually establishes. In 2010, the collision of iceberg B9B with the Mertz Glacier Tongue caused the vast majority of the protruding tongue to calve, including the part adjacent to the emperor penguin breeding colony. After two seasons of no recorded sightings, the colony was found in 2012 re-established farther south on fast ice at the new terminus position, as well as along the eastern margin in 2012 (Ancel et al. Reference Ancel, Cristofari, Fretwell, Trathan and Wienecke2014), where it has been observed in subsequent years (Wienecke et al. Reference Wienecke, Lieser, McInnes and Barrington2024). Calving can also produce icebergs that negatively impact colonies’ ability to forage both through their impact on fast-ice conditions and by acting as a barrier (Kooyman et al. Reference Kooyman, Ainley, Ballard and Ponganis2007, Kooyman & Pongans Reference Kooyman and Ponganis2017).
Although calving and terminus change are parts of a natural cyclical process, calving is increasing in frequency (Miles et al. Reference Miles, Stokes, Jenkins, Jordan, Jamieson and Gudmundsson2020), and Antarctica lost 1.9% of its floating margins between 1997 and 2021 (Greene et al. Reference Greene, Gardner, Schlegel and Fraser2022). This suggests that large, disruptive calving events could have an increasingly important influence on emperor penguin colonies, and modelling suggests that extreme events strongly influence the trajectory of population decline, although models have not considered the impact of calving (Jenouvrier et al. Reference Jenouvrier, Che-Castaldo, Wolf, Holland, Labrousse and LaRue2021). Also of concern is that, since 2016, Antarctic sea-ice extent has entered a state of sharp decline (Purich & Doddridge Reference Purich and Doddridge2023, Raphael et al. Reference Raphael, Maierhofer, Fogt, Hobbs and Handcock2025). Although the relationship between fast ice and overall sea ice is not well-resolved (Fraser et al. Reference Fraser, Massom, Handcock, Reid, Ohshima and Raphael2021), the long-term loss of pack ice is likely to negatively impact the duration and possibly the extent of fast ice (Fraser et al. Reference Fraser, Wongpan, Langhorne, Klekociuk, Kusahara and Lannuzel2023). Recently, poor fast-ice conditions at the sites of emperor penguin colonies have occurred alongside record-minimum sea-ice conditions. For example, four out of the five breeding sites in the central and eastern Bellingshausen Sea region are assumed to have experienced total breeding failure in 2022 (Fretwell et al. Reference Fretwell, Boutet and Ratcliffe2023). Specifically, the primary risk to penguins associated with sea-ice conditions is early fast-ice breakout. The number of colonies negatively impacted by early fast-ice breakout increased over the period 2016–2023, with 19 of the total 66 colonies around the continent impacted by the then-record low of 2022. However, despite the fact that 2023 set a new record-low sea-ice extent, fewer colonies experienced early fast-ice breakout, demonstrating the complex relationship between sea-ice extent and fast-ice breakout (Fretwell Reference Fretwell2024a). A survey of 27 colonies in East Antarctica also found nine of them to have experienced increased or total breeding failure associated with loss of fast ice at least once over the period 2021–2023 (Wienecke et al. Reference Wienecke, Lieser, McInnes and Barrington2024). As a species with high longevity, late maturation and low genetic diversity and annual reproductive output (i.e. laying a single egg), the potential for emperor penguins to physiologically adapt to such drastic and rapid changes is limited (Younger et al. Reference Younger, Clucas, Kao, Rogers, Gharbi, Hart and Miller2017). Although there is evidence of a small number of colonies residing on ice shelves (Wienecke Reference Wienecke2012, Fretwell et al. Reference Fretwell, Trathan, Wienecke and Kooyman2014), it has generally been thought that most ice shelves or outlet glaciers are inaccessible to the species, which is not well-suited to negotiating rough or steep terrain (Fretwell et al. Reference Fretwell, Trathan, Wienecke and Kooyman2014, Trathan et al. Reference Trathan, Wienecke, Barbraud, Jenouvrier, Kooyman, Le Bohec, Ainley, Ancel, Zitterbart, Chown, LaRue, Cristofari, Younger and Clucas2020). Together, we refer to major calving events that cause large changes to or total removal of a colony’s typical breeding area and early fast-ice breakout as ‘extreme ice events’. Early fast-ice breakout is defined as breakout at a colony site before 31 December, and it is identified when a single image acquired before that date shows that breakout has occurred.
Previous remote sensing studies have provided valuable insights into the behaviour of emperor penguin colonies, which are visible in satellite imagery due to the distinct spectral signature of their guano. The guano appears as a brown stain on snow and ice, which is visible in medium-resolution optical imagery (10–30 m), such as Landsat 4–9 and Sentinel-2. The first satellite-based continent-wide survey of the breeding distribution of the species was performed by Fretwell & Trathan (Reference Fretwell and Trathan2009), who identified 38 colonies using visual and spectral analysis (utilizing the red and blue bands) of the Landsat Image Mosaic of Antarctica (LIMA) and other Landsat data. Since then, other studies have updated the catalogue of colony locations using Landsat and very-high-resolution (VHR) Quickbird imagery (Fretwell et al. Reference Fretwell, LaRue, Morin, Kooyman, Wienecke and Ratcliffe2012), Sentinel-2 only data (Fretwell & Trathan 2020) or Sentinel-2 combined with VHR WorldView-2 (Fretwell Reference Fretwell2024b). Typically, such studies used manual identification of colonies in true-colour or false-colour composite images (utilizing near-infrared or shortwave infrared; e.g. Fretwell & Trathan 2012) or images segmented by a simple spectral analysis (e.g. Fretwell & Trathan Reference Fretwell and Trathan2009). Automated detection of colonies has also been tested and has shown promise at some colonies, although spectral overlap with other surface types was a significant limitation (Shen et al. Reference Shen, Ke, Miao, Zhang and Zhang2017). In some cases, studies have taken advantage of the fact that in VHR imagery, unlike in medium-resolution imagery, penguins can be directly observed, enabling estimates of population size (Barber-Meyer 2007, Fretwell et al. Reference Fretwell, LaRue, Morin, Kooyman, Wienecke and Ratcliffe2012, LaRue et al. Reference LaRue, Iles, Labrousse, Fretwell, Ortega and Devane2024, Winterl et al. Reference Winterl, Richter, Houstin, Barracho, Boureau and Cornec2024, Fretwell et al. Reference Fretwell, Bamford, Skachkova, Trathan and Forcada2025). Aerial photography has also been used on a smaller scale for the same purpose (e.g. Kooyman & Ponganis Reference Kooyman and Ponganis2017). In addition to surveys of colony locations and population estimates, remote sensing of emperor penguins has been used to document breeding habits at particular locations (Fretwell et al. Reference Fretwell, Trathan, Wienecke and Kooyman2014), to assess habitat types (Labrousse et al. Reference Labrousse, Nerini, Fraser, Salas, Sumner and Le Manach2023) and to investigate their response to recent low sea-ice conditions (Labrousse et al. Reference Labrousse, Fraser, Sumner, Le Manach, Sauser and Horstmann2021, Fretwell et al. Reference Fretwell, Boutet and Ratcliffe2023, Fretwell Reference Fretwell2024a, Wienecke et al. Reference Wienecke, Lieser, McInnes and Barrington2024).
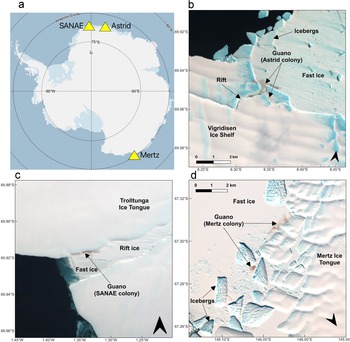
To better understand the future response of emperor penguins to sea-ice decline associated with climate warming and to the likelihood of increasing extreme ice events, it is essential to better understand how colonies have responded to such events and variations in the past. Although previous remote sensing studies have improved our understanding of the species, there is a paucity of knowledge on how colonies have responded to ice changes over the long term, including major calving events and early loss of fast ice. The aim of this paper is to understand how colonies have responded historically to changing glacier and fast-ice conditions. We integrate analysis of both Landsat and Sentinel-2 imagery, supplemented by the Advanced Spaceborne Thermal Emission and Reflections satellite (ASTER), to document colony movements and analyse their response to extreme ice events throughout the whole satellite record (colonies are observed from 1984 to 2024). We focus our study on the SANAE (70.00°S, 1.41°W), Astrid (69.95°S, 8.32°E) and Mertz (67.24°S, 145.53°E) colonies (Fig. 1) because they are known to be situated close to ice shelves/tongues that underwent major calving events over this period.
The locations and example Landsat 8 images of the three colonies studied. Landsat 8 images are displayed with a false-colour composite of bands 5, 3 and 2 (NIR, G and B, respectively) and with gamma set to 0.5, as was used for identifying guano. a. The three colony locations in Antarctica. The basemap is from Quantarctica (Matsuoka et al. Reference Matsuoka, Skoglund, Roth, de Pomereu, Griffiths and Headland2021): b. Astrid (69.95°S, 8.32°E) on 3 December 2023; c. SANAE (70.00°S, 1.41°W) on 28 November 2022; and d. Mertz (67.24°S, 145.53°E) on 13 November 2022.

Data and methods
Identification of colony location
In order to observe the emperor penguin colonies at SANAE, Mertz and Astrid (Fig. 1) and their responses to changes in ice conditions throughout the satellite record, we analysed Landsat 4, 5, 7, 8 and 9, Sentinel-2 and ASTER imagery. We used the Google Earth Engine platform along with an adapted version of the Google Earth Engine Digitisation Tool (GEEDiT) tool (Lea Reference Lea2018) to review all available imagery for the sites spanning December 1984 to April 2024. The cloud-based nature of this platform enabled us to analyse imagery at full resolution without the need to download images. The GEEDiT tool allowed us to select a region of interest and cycle through images for all the above satellites. Landsat and Sentinel-2 imagery was displayed with the near-infrared, green and blue bands mapped to R, G and B, respectively, whereas for ASTER the near-infrared, red and green bands were mapped to R, G and B, respectively. Although guano is visible in true-colour imagery, its high reflectivity at near-infrared wavelengths help enable its detection (e.g. Fretwell & Trathan 2020). For Landsat satellites, top-of-atmosphere reflectance was viewed from collection 2, tier 2 imagery. Sentinel-2 top-of-atmosphere reflectance from Level-1C imagery was used and ASTER at-sensor radiance from Level-1T. All images with < 90% cloud cover (based on the platforms’ cloud cover metadata) were inspected. Note that we also searched the United States Geological Survey (USGS) EarthExplorer for older images (pre-1984) and assessed Landsat 1–3 images from 1972 to 1986 but were unable to identify the colonies in any of this coarser temporal and spatial (60 m) resolution imagery in those years.
All available images were visually assessed for the presence of emperor penguin guano. The presence or absence of visible guano was recorded for all images. We note that, at times, the presence of guano does not necessarily equate to the presence of penguins, primarily in later summer (January–March) when faint, unchanging guano may be evidence only of recent penguin presence. Additionally, the absence of visible guano does not necessarily equate to the absence of penguins, which could be difficult to detect if the group is small or hidden, such as by shadows at the margins of a glacier or iceberg. In some early years with limited imagery, no guano was observed, but, given the lack of imagery, we could not determine whether this meant that the colony was absent. Those years are not included in our figures, but they are included in the supplementary dataset. Additionally, the surface on which guano is present was also recorded for each image. Surface categories included fast ice, ice shelf, iceberg or ‘rift ice’. By ‘rift ice’ we refer to multi-year ice present in a rift, which appears to be thick and is present for upwards of a decade and calves like shelf ice.
Using the GEEDiT tool (Lea Reference Lea2018), we also record the location of the colony at each site in the first ‘post-winter’ image (Table S1) of the season (i.e. the first observable image after the polar night). Henceforth, in this study a ‘season’ refers to the period of visible optical imagery after the polar night from approximately late August to approximately early April. The timing of the first post-winter image varies due to image availability. From 2014/2015 to 2023/2024 images were available from August or September, but before this period images were not available until later in the season. Where possible, we choose the earliest image because we found colonies to be relatively stationary in the early part of the season, before becoming increasingly mobile in October/November. From 2014/2015 onwards, we also recorded the number of ‘subgroups’ of a colony at the beginning of the season. We define ‘subgroups’ as groups that are separated by hundreds of metres up to several kilometres but are in the same approximate region. We only recorded this from 2014/2015 onwards (when images from earlier in the season are available) because later in the season such groups were difficult to identify when colonies become more mobile and may split further. We also identified when colonies were situated at ‘new’ sites. Distinct from ‘subgroups’, these ‘new’ sites were in a substantially different area in the region, such as in a completely different embayment or, for example, at the terminus of a glacier instead of the lateral margin and are clear relocations in response to an event.
Finally, we also assessed all images for the occurrence of extreme ice events (i.e. major calving events that are disruptive to the configuration of the colony’s breeding location) or early fast-ice breakout at the site of a colony (before the end of December).
Other metrics
For the years 2014/2015–2023/2024, which is the period when images were available earlier in the breeding season (from August/September), we measured the ‘maximum colony location span’ during a season. This was the measured Euclidean distance from the colony’s location in the first image of the season to the farthest away that guano staining reached that season (i.e. a measure of how far the colony spread out within a season).
Additionally, from 2000/2001 onwards, in all years when we observed penguin colonies, we measured the distance to the fast-ice edge when fast ice was at its maximum. We measured the distance from the location of the colony in the first image of the season to the fast-ice edge. The fast-ice edge was visually determined from Landsat, Sentinel-2 or MODIS imagery using NASA’s Worldview application (https://worldview.earthdata.nasa.gov), which was possible due to the distinct contrast between the fast ice and open ocean or pack ice. This maximum distance to the fast-ice edge represents the maximum distance required to travel to reach open water, as well as being an indication of the fast ice’s stability. This was measured from the image in September or October, when fast ice was most extensive (see dementary data for shapefiles of the estimated routes to the fast-ice edge and for a list of images used in the calculation). The date that the maximum distance to the edge was measured may not have coincided with the date when the colony’s location was observed, especially before the 2014/2015 season, when colony locations often became visible only later in the season. When there were obstacles between a colony and the fast-ice edge, such as icebergs embedded within the sea ice, we attempted to account for these and estimated the track distance to the fast-ice edge rather than the straight-line distance. However, it was not always possible to be certain as to whether a particular route was traversable (shapefiles for estimates of the route to the fast-ice edge are included in the supplementary dataset).
Results
By analysing the archive of satellite imagery, we were able to observe emperor penguin colony locations at the SANAE, Astrid and Mertz sites as far back as 1984, 1989 and 1988, respectively, up to April 2024 (Fig. 2). In total, the Astrid site location was observed on 411 days, with guano visible on 258 days. Collectively, the SANAE site location were observed on 403 days: the original SANAE site with guano on 207 days and the two new SANAE sites with guano on 102 and 36 days. The Mertz site locations were observed on 409 days, the original/eastern-margin site with guano on 238 days and the new terminus site with guano on 18 days (full list available in the supplementary dataset). These include some images obscured heavily by cloud but when the dark guano could still be detected through the cloud. It also includes images where guano is partially obscured by scan-lines due to the failure of Landsat 7’s Scan Line Corrector (SLC) in May 2003. The highest number of useful images examined in a single season was at Mertz in 2023/2024, when 53 scenes were viewed between 27 August and 17 April. There was a substantial imagery gap, with no images at any of the colonies, for the period from 1990/1991 to 1999/2000 inclusive. This period largely coincided with the period December 1993–April 1999, when only the limited-capacity Landsat 5 was in operation, after the end of Landsat 4 and the failure of Landsat 6’s launch and before the launch of Landsat 7.
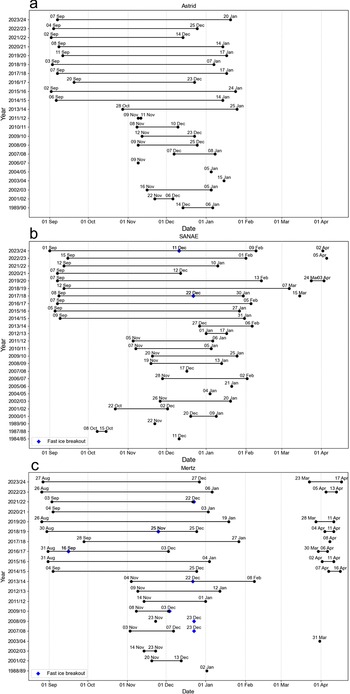
Date ranges of visible of guano at each colony by season and the timing of notable early fast-ice breakout events. Black dots show the first and last dates of guano visibility after winter at the a. Astrid, b. SANAE and c. Mertz sites. If a colony is observed returning prior to the next winter in March/April, they are recorded separately. Blue dots show dates when we identify notable fast-ice breakout events prior to the end of December that were likely to impact breeding. A complete list of dates on which observations were made, including and not including guano, is available in the supplementary dataset.

Astrid
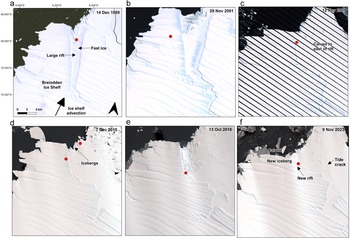
The Astrid colony was first visible on 14 December 1989 on fast ice (Figs 2a, 3a & 4a), next to an iceberg in a sheltered, large rift at the terminus of Vigridisen ice shelf. After this season, the colony was not visible again (due to a lack of imagery) until November 2001, when it became visible on the ice shelf to the west of the rift (Fig. 3b). By this time, the rift in which the colony was observed in 1989 was wider, but the configuration of the area was otherwise very similar. In the three subsequent years the colony was visible in the rift on fast ice/mélange, typically alongside the margin of the ice shelf to the west and sheltered by numerous icebergs to the north-west. In February 2006 there was a major calving event (~350 km2), during which a portion of ice shelf to the east of the rift broke off. Consequently, the colony’s typical site was no longer in a rift but was exposed to the coast to the east, although icebergs continued to shelter the area to the north. In some years, many small icebergs became fixed in the area (e.g. Fig. 3e). Despite this major calving event, the colony continued to return to the same approximate site until 2023/2024 (Fig. 3c,f). Approximately 5 km of the shelf terminus to the west of the colony’s typical location calved in the winter of 2020, but this had little effect on the colony’s location. In the winter of 2021, a new opening developed (~0.3 km wide) adjacent to the colony’s typical location, between the shelf terminus and a newly calved iceberg, into which the colony sometimes moved in later years (e.g. Fig. 5a). Overall, the distance between the colony’s most southern location in a first post-winter sighting in 2007 and it most northern location in 2015 was 8.2 km. Broadly, the colony remained in a similar position at the terminus of the ice shelf, which remained in a similar location throughout the period.
Astrid colony location over time. Red dots show the location of the Astrid colony in the first image of the season in selected years: a. 1989/1990, b. 2001/2002, c. 2009/2010, d. 2015/2016, e. 2016/2017 and f. 2023/2024. Note that the location of the colony shows little variation, including after the calving event east of the rift. All frames show the same area/extent.

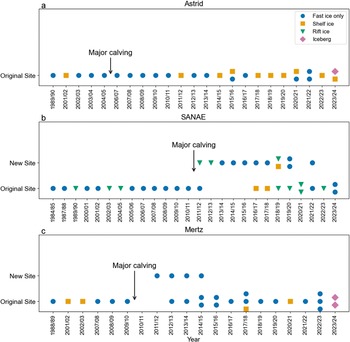
Graphs showing the seasons in which colonies were confirmed as present or probably absent, the surfaces on which they were observed and the timings of the major calving events at a. Astrid, b. SANAE and c. Mertz. In cases when colonies were observed on shelf ice or icebergs, they are confirmed to have been initially on fast ice when there is imagery available in August/September. An orange icon indicates that the group was at one of the ‘new’ and temporary relocation sites (the terminus at Mertz or the two southern sites at SANAE). A blue icon indicates that the group was approximately at the colony’s typical location. From 2014/2015 to 2023/2024 the number of icons in each year also indicates the number of ‘subgroups’ at a particular site. Note that the Mertz colony was observed in 2003/2004 but only on its return in March and is not included in this plot.

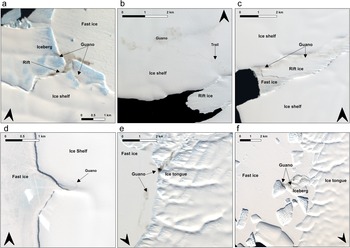
Examples of evidence of the colonies on surfaces other than fast ice: a. The Astrid colony on the ice shelf and an iceberg on 3 December 2023; b. the SANAE colony on the ice shelf, along with the trail showing their route to the site on 23 January 2018; c. the SANAE colony on rift ice on 4 January 2023; d. the SANAE colony on the ice shelf at one of its ‘new’ temporary relocation sites on 10 November 2018; e. the Mertz colony on the ice tongue as well as fast ice on 8 December 2017; and f. the Mertz colony on an iceberg on 7 November 2023.

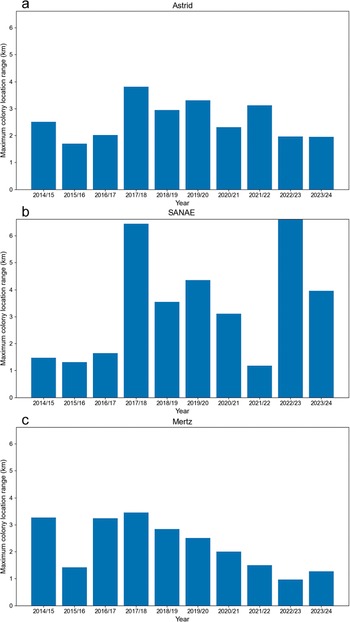
Typically, the colony was in one or two subgroups alongside the margin of ice shelf in early September. In 2015/2016, uniquely, there was a second subgroup situated next to an iceberg that was ~3.5 km from the shelf margin (Fig. 3d). Looking across the satellite record, the colony usually becomes more mobile, and staining spreads out over a larger area as the season progresses, particularly into October and November. The maximum colony location span within a season ranges from 1.7 km in 2015/2016 to 3.8 km in 2017/2018 (Fig. 6a). Although the colony was always first visible on fast ice (apart from in 2001/2002 when there was no early-summer imagery), part of the colony often moved onto the shelf ice (e.g. Fig 5a). When part of the ice shelf it had occupied calved and became an iceberg, it continued to move onto it (in 2023/2024). The colony was visible on the ice shelf in 10 of the 23 seasons (Fig. 4a), including 8 of the last 10, when the temporal coverage of imagery improved. The colony ascended the shelf at multiple entry points, which were reused over multiple years.
The maximum colony location spans during a season of the a. Astrid, b. SANAE and c. Mertz colonies for the seasons 2014/2015–2023/2024. The spans are based on the furthest guano staining reaches from the colonies’ earliest recorded locations of the season. When there is more than one subgroup, the longer distance is presented.

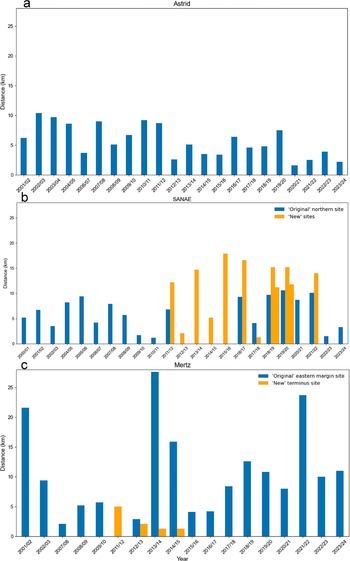
No early (i.e. pre-31 December) fast-ice breakout events were observed at Astrid. When fast ice was at its maximum, the closest edge was beyond the icebergs to the north-west (Fig. 7a). In years when the distance to the fast-ice edge was largest (8–10 km away), this was when the ice extended farther to the west of these icebergs. In recent years this edge moved closer to the colony’s typical location, due to the calving event in the winter of 2020. As the fast ice would break up, the edge to the east also became closer, and, later in the season, it sometimes became the closest fast-ice edge. Tide cracks (e.g. Fig. 3f) also regularly developed that, at times, seemed (staining does not extend beyond these tide cracks) to become entry points to the ocean.
The maximum distance to the fast-ice edge of the colonies for the seasons 2000/2001–2023/2024 (when the colonies are observed): a. Astrid, b. SANAE and c. Mertz. The distance is measured to the estimated maximum fast-ice edge in September–October from the earliest location of the colony that season. When two subgroups are recorded at a site, the larger distance is presented. In years when a colony is located at one of the ‘new’ relocation sites at SANAE or Mertz, they are presented in orange.

In one season (2016/2017), there was guano staining on blue ice on the ice shelf that seemed to be residual from the previous year rather than new staining from that year’s colony (Fig. S1). We infer that this may be residual from the previous year because staining through the current season did not seem to show the colony as having moved to that location, and the staining was in the exact same spot (accounting for ice advection) as the previous year.
SANAE
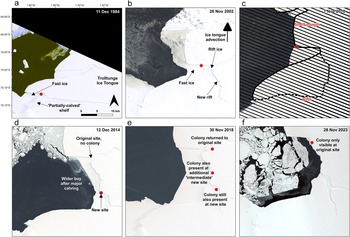
The SANAE colony was first observed on 11 December 1984 on fast ice in a sheltered bay between two pieces of ice shelf on the western margin of the Trolltunga Ice Tongue (Figs 2b, 4b & 8a) after a part of the ice shelf had rotated and created an opening in a large rift prior to this date. By the next observation (8 October 1987) the shelf ice to the east of the rift was no longer present, exposing a large, ~2.5 km-wide open rift filled with ‘rift ice’ (examples of which are shown in Fig. 5b,c), but the colony was in approximately the same location. In the next observable season (1989/1990), there was guano on the terminus of this rift ice, as well as on the fast ice. Following a gap in image availability until 2000/2001, the colony was in approximately the same location relative to the ice, having moved north as the ice advected. In the years in-between, an additional ~14 km-long rift formed to the south of the rift ice, which rift ice also filled (Fig. 8b). The colony continued in the same approximate location in the sheltered bay on fast ice and/or rift ice (Fig. 8c), albeit moving northwards as the ice advected. However, on ca. 20 January 2011, an ~189 km2 portion of ice shelf that formed the southern margin of the colony’s embayment calved, creating a wide embayment. In the following season (2011/2012), a small stain was only observed in one image from 5 November at the original site, and this was not detectable from subsequent images during the season, and during the following four seasons (2012/2013–2015/2016) the colony was not observed at its original site at all. Rather, the colony initially relocated to a new site that was ~11 km to the south, where there was a newly exposed small bay of fast ice and rift ice (Fig. 8d). The colony was there in 2011/2012 and then for 4 years remained exclusively at this new southern site, but it then split, and a group was detected again at its original site on 12 September 2016, alongside the group at the ‘new’ site. Notably, retreat of the rift ice at the original site in the intervening years meant that there was once again a sheltered bay of fast ice in that area. Penguins were then visible again at the original site in all subsequent years, but they were also visible at the new site farther south in 2017/2018–2019/2020 and in 2021/2022, as well as at an ‘intermediate site’ located between the original site and new site (Fig. 7e). In the final two years (2022/2023 and 2023/2024) the colony was not visible at the two ‘new sites’ and was only visible at its original northern site. Overall, the colony’s location on the ice moved 25.8 km over the period, from its most southern point in 1984 to its most northern in 2023, due to ice shelf advection.
SANAE colony location over time. Red dots show the location of the SANAE colony in the first image of the season in selected years: a. 1984/1985, b. 2002/2003, c. 2010/2011, d. 2014/2015, e. 2018/2019 and f. 2023/2024. In a.–c. before the major calving event the colony is only observed at the original site. After the major calving event in February 2011, in d. the colony is only observed at the new site, in e. at two new sites and the original site and in f. only at the original site again. The original site has moved north with ice advection and east as the rift it is situated in retreated.

Typically, one to two subgroups were present, and guano staining at SANAE became more dispersed as the colony seemingly became more spread out and mobile later in the season. Although the colony was most often visible on fast ice and/or rift ice, the colony at the original northern site moved onto the ice shelf to the north in 2016/2017 and 2017/2018. In 2017/2018, staining across the ice shelf was particularly extensive (Fig. 5b), accounting for the second-largest maximum colony location span (6.4 km) for the colony or for any of the three colonies (Fig. 6b). The colony at the intermediate ‘new’ site also moved onto the ice shelf in 2018/2019 (Fig. 5d). In all cases the trail onto the shelf was visible, and the colony moved onto the shelf while there was still apparently stable fast ice and rift ice. In 2022/2023 the colony spanned the largest distance (6.6 km) at SANAE or at any of the three study colonies, when it spread substantially away from the shelf margin along the rift ice. The colony seemed to be spreading away from the ocean until late December/early January, with the maximum distance from the early September location being recorded on 5 January. We note that the 2 years with the two largest colony location spans were also the 2 years when the distances to the fast-ice edge were shortest (2017/2018: 2.1 km; 2022/2023: 1.9 km; Fig. 7b).
Two early (pre-31 December) fast-ice breakout events may have impacted breeding success at SANAE. In 2017/2018, at the more northern ‘intermediate’ new site, almost all of the fast ice in the small bay on which the colony was present had broken out by 22 December, although at least some of the colony was visible after this, either on a small amount of fast ice or on the very edge of the ice shelf. At the original site, between 1 December (when the colony was clustered on the fast-ice edge) and 11 December 2023, a 3.4 km2 portion of fast ice broke out. After this breakout there was evidence of some of the colony on the remaining fast ice, but it seems possible that some of the colony was lost.
In four instances we observed the return of the SANAE colony for the next breeding season, the earliest of which was on 15 March 2018. On this occasion there was staining on the edge of the narrow band of fast ice adjacent to the lateral margin on the rift ice, before the fast ice broke out by 28 March. In 2020 staining was visible on the edge of the same area of fast ice on 24 March. By 31 March that ice retreated, and a small group was evident on the rift ice, which was then visible again on 2 and 3 April, moving up the rift ice towards the interior of the shelf. On 5 April 2023 and 2 April 2024 a small group was visible towards the terminus of the rift ice while there was no fast ice.
Mertz
The Mertz colony was first visible on 2 January 1989 at the eastern margin of the Mertz Ice Tongue, on an area of fast ice that was pinned between an outcrop of the tongue and an iceberg (Figs 2c, 4c & 9a). Following the gap in available imagery, the colony was next visible in November 2001. Although the exact configuration of the margin of the tongue changed in the intervening years due to several relatively small calving events, the colony was in a similar location relative to the ice tongue, having moved approximately northwards with the ice. Where imagery is available, guano was observed in a similar location until 2009/2010 (Fig. 9b). In mid-February 2010 a major calving event occurred, resulting in the loss of ~73 km of the tongue’s length, leaving only ~17 km protruding from the ice shelf. This included the loss of the area adjacent to which the colony was previously located, as well as loss of associated fast ice in subsequent years. We could not locate the colony in 2010/2011, and it is probable that it was absent. In 2011/2012 the colony was not visible at the eastern margin of the remaining tongue but instead was evident at the tongue’s terminus on fast ice in a narrow gap between the tongue and an iceberg that had calved but had not been displaced (Fig. 9c). In the following year, the group at the ‘new’ terminus site returned, but a group also returned to the eastern margin of the tongue, as was evident on mélange between icebergs on 9 November 2012. By January 2013 the iceberg that was sheltering the terminus group dislodged, leaving exposed fast ice in the embayment. However, this group returned in both 2013/2014 and 2014/2015, in addition to those at the original eastern-margin site (Fig. 8d). For the remaining 9 years of the study period the colony was observed only at the eastern margin (Fig. 8e,f). Although the site migrated northwards with the ice tongue, there was interannual variability, as variations in the local configuration of the tongue margin and iceberg placement led to variations in precise site. Overall, the colony’s location spanned 64.0 km from its most northern location in 2007/2008, prior to calving, to its most southern location in 2017/2018, after calving.
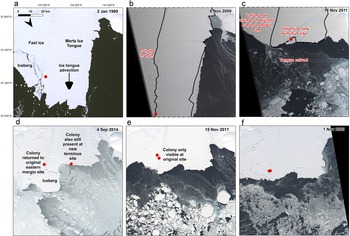
Mertz colony location over time. Red dots show the location of the Mertz colony in the first image of the season in selected years: a. 1988/1989, b. 2009/2010, c. 2011/2012, d. 2014/2015, e. 2017/2018 and f. 2023/2024. In a. & b. before the major calving event the colony is only observed at the original site at the eastern margin. After the major calving event in February 2010 (a year in which the colony is not observed at all), in c. the colony is only observed at the new site at the terminus. In d. it is at the new site and the original site, and in e. & f. it is only at the original site again. The original site moved north with ice advection, south after the calving event and is moving southwards again, with some variation due to variations in the precise location.

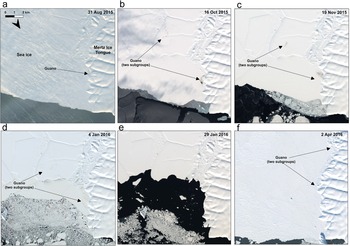
The Mertz colony was visible as early as late August in up to three subgroups, which were typically initially separated by hundreds of metres up to 1–2 km, but in one case they were separated by ~6 km (Fig. 10). As the season progressed, the guano moved and spread out along the fast ice (Fig. 10) and sometimes moved onto the margin of the ice tongue (Fig. 5e) or, as was the case in 2023/2024, onto an iceberg (Fig. 5f). As at the other sites, the colony often moved onto the tongue even when apparently stable fast ice was available (e.g. Fig. 5e). Movement of the colony was usually limited to within the sheltered embayment, where fast ice tended to break out later. The maximum colony location span within a season by a colony since 2014/2015 was 3.4 km, the lowest span of the three study sites reported in this paper (Fig. 6c).
Example images of the colony throughout 2015/2016 at Mertz. a. Guano is visible in a small, dense spot on fast ice in late August, tucked against the tongue margin. b. Staining is more extensive and a second subgroup is visible. c. & d. Staining has spread further and become more diffuse. e. By late January the fast ice has broken out at the site of the northern subgroup and no guano is visible. f. In early April fast ice has reformed and two subgroups have returned to the area, once again forming small, dense stains.

At Mertz we observed the return of the colony for the following breeding season, before the polar night, more often than at the other sites, including in 8 of the last 10 years and as far back as March 2004. When the colony returned, guano tended again to be concentrated in a small stain on fast ice close to the tongue margin (e.g. Fig. 10f).
At Mertz the maximum distances to the fast-ice edge were greater than at the other two colonies, exceeding 20 km in 3 years (Fig. 7c), although at times the penguins may have entered the water through a tide crack. In three of the four seasons (2000/2001, 2013/2014 and 2014/2015) with the greatest fast-ice edge distance, it appeared that extensive fast ice was related to lodging of large icebergs (~795 km2 in 2000/2001 and 335 km2 in 2013/2014 and 2014/2015) to the east/north-east of the tongue, close to the terminus (e.g. Fig. 9d). Despite this, we recorded more early (pre-31 December) fast-ice breakouts at Mertz than at the other two study sites, totalling six, although not when such an iceberg was lodged. In 2007/2008 the fast ice that hosted the colony broke out between 7 and 23 December, and there was no evidence of the colony on nearby remnants of fast ice. Notably, this year represented the second-closest fast-ice edge in the entire period (2.0 km). During the following season (2008/2009) the fast ice once again broke out early, between 23 November and 23 December 2008, and there was no subsequent evidence of the colony. Fast ice in this area again broke out early in 2009/2010, between 8 November and 3 December. However, on this occasion the colony continued to be visible in a small enclave of fast ice in a short, narrow opening at the edge of the tongue. The next early fast-ice breakout was recorded at the ‘new’ terminus site in 2013/2014, when the fast ice that most of this group was present on (now exposed from removal of the iceberg) broke out between 29 November and 22 December. There was no subsequent evidence of that group in that year, although some individuals were also present in a narrow crack where ice remained. In 2016/2017 fast-ice breakout occurred remarkably early, between 31 August and 16 September (Fig. 11a–c). On the latter date the colony was not observed. However, on 2 October the colony was evident on newly formed fast ice in the same area. Although we do not make estimates of populations, we noted that the guano staining for the rest of this season was faint, covering an especially small area (maximum of < ~8000 m2 vs typically > ~25 000 m2), and, unusually, it was no longer visible on the ice at all by 3 December.
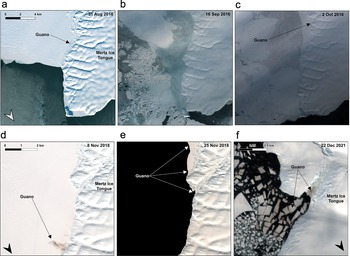
Example images of early fast-ice breakout events at Mertz. a.–c. The early breakout of fast ice in September 2016. On 31 August a colony is visible on the fast ice by the margin of the tongue, but the ice has broken out by 16 September and the colony is no longer visible. On 2 October fast ice has reformed and the colony is visible as a small guano stain. d. & e. Early fast-ice breakout in November 2018. On 8 November there is extensive guano staining on the fast ice between the tongue margin and a tide crack. On 25 November that ice has broken out, but now guano staining is evident in three small spots: two on adjacent remnant fast ice and one to the north on the very edge of the tongue margin (possibly on a small amount of sea ice or the edge of the tongue). f. Following fast-ice breakout in December 2021, guano staining is still evident on the edge of the tongue (sea ice or shelf ice) and on ice floes that previously formed the fast ice.

In 2018/2019 the fast ice again broke out early, between 8 and 25 November. On the latter date, however, the colony was visible on an adjacent area of fast ice that remained on the very edge of the original patch, possibly on the edge of the tongue (Fig. 11d,e). Subsequent staining also covered a notably small area in 2018. In 2021/2022 the fast ice progressively broke out through December, with the final substantial remnant breaking out between 19 and 22 December. At this point, there was evidence of the colony remaining in a gap between an almost-calved iceberg, possibly on sea ice or shelf/iceberg ice. Notably, guano was still evident on the fragmented ice floes, but it was not clear whether penguins remained on these floes or whether this was residual staining (Fig. 11f).
Discussion
Remote sensing of emperor penguins
Our long-term investigation of the Astrid, SANAE and Mertz emperor penguin colonies is the first to take advantage of the full archive of satellite imagery, and it demonstrates the feasibility of recording and studying colonies over the course of several decades. Using a cloud computing platform in the form of Google Earth Engine makes analysis of hundreds of images more efficient, reducing the computational and time demands compared to downloading images onto a local computer. In addition, we combined multiple instruments, including five iterations of Landsat and Sentinel-2, to increase both the length and temporal resolution of the record. We also demonstrate the value of ASTER, which, to our knowledge, has not previously been employed in the identification of emperor penguin colonies. For example, there were several years in the early to mid-2000s when it was only possible to locate these colonies in ASTER imagery (2004/2005 and 2005/2006 at SANAE and 2003/2004, 2004/2005 and 2006/2007 at Astrid).
After a gap in availability between 1990/1991 and 2000/2001, imagery became more plentiful due to the launches of Landsat 7 and ASTER. The temporal resolution of our observations also increased dramatically from 2014/2015 onwards due to the launch of Landsat 8 in 2013 followed by that of Sentinel-2 in 2015. Prior to these dates there were years with no usable images available, too few images to locate a colony or when it was only possible to observe the colony over a limited period. From 2014/2015 there were no years without imagery, and imagery tended to cover the full period of daylight, from late August or early September to early to mid-April. This means imagery covered most of the period of chick rearing and potentially the arrival phase prior to the next season (Trathan et al. Reference Trathan, Wienecke, Barbraud, Jenouvrier, Kooyman, Le Bohec, Ainley, Ancel, Zitterbart, Chown, LaRue, Cristofari, Younger and Clucas2020). This broader image availability also means that a colony’s location and number of subgroups could be recorded in the period shortly after winter, when the colony appears to remain densely packed and before it has become more mobile and disperses. Although studies have noted that staining does not always represent the present location of penguins (e.g. Fretwell & Trathan 2009), early in the breeding season (e.g. Fig. 10a) it can be assumed that staining represents a reasonable approximation of the location of penguins because it occupies a small area. Later in the period, when the staining spreads as the penguins move, it appeared that some of the staining was residual and that the penguins were only located in the newer part of the guano stain (e.g. Fig. 10b–d). Later, in January–February, staining became fainter and stopped spreading, and the penguins may no longer have been there. In some years the colony was visible on its return in March–April as a small, dense/darker stain, particularly at Mertz (Fig. 10f). At that time, the stain probably represents a good approximation of current penguin location. Unsurprisingly, the colonies were also more difficult to spot in August–September and in March–April, when their staining was smaller and less spread out, and at times they may have been missed. It is unclear whether we failed to observe colony return before winter at Astrid, and only rarely at SANAE, because colonies returned later, when images were not available, or because they were present but not clearly visible. By combining imagery from Landsat 8 and Sentinel-2, and more recently also from Landsat 9, there were times since 2015 when there were images of colonies in consecutive days, or even on multiple occasions on the same day, creating further opportunities for remote sensing of emperor penguins.
On one occasion at Astrid we inferred that guano staining remained from the preceding year. Usually, older guano staining is no longer visible at the surface but instead remains in deeper layers of the snow/ice after being covered by snowfall (Ancel et al. Reference Ancel, Cristofari, Fretwell, Trathan and Wienecke2014), but it seemed on this occasion that it had been re-exposed. The patch was at the edge of the ice shelf in an area of blue ice (Fig. S1), suggesting that snow is regularly blown off. On this occasion, it is possible to identify this probably as an old stain because it was at the precise location of the previous year’s colony and did not seem to be contiguous with the current year’s colony’s stain or movement. The possibility of residual staining from a previous year should be kept in mind in some cases when conducting such analyses.
Response to major calving events
At the end of the 35–40 year study period we found all the colonies to be in similar locations relative to the ice shelf as they were at the beginning of the period. The SANAE colony ultimately remained in the same bay/rift on the tongue margin as it advected northwards. The Mertz colony similarly ultimately continued to be on the eastern margin of the tongue, close to the terminus, and to an extent its location matched the advance and retreat of the tongue. The Astrid colony was located at the terminus rather than the margin of the ice shelf and remained there throughout.
Major calving events occurred at least once in the vicinity of the colonies’ typical locations at all three sites throughout the study period. In the case of Astrid, the calving of a large iceberg exposed the rift where the colony was situated, but this seemed to have little effect on the colony. The colony returned to the same site in the following year, presumably because it remained relatively sheltered. Colonies prefer sheltered sites (Fretwell & Trathan Reference Fretwell and Trathan2021), and the remaining shelf ice to the west and the icebergs to the north continued to provide crucial sheltering. When a major calving event removed most of the tongue at Mertz in 2010, the colony was seemingly absent the in following season (2010/2011). However, in the season after (2011/2012) the colony was at a new site at the terminus (Fig. 9c), a year earlier than had been previously observed (Ancel et al. Reference Ancel, Cristofari, Fretwell, Trathan and Wienecke2014, Wienecke et al. Reference Wienecke, Lieser, McInnes and Barrington2024). In the following season (2012/2013) the colony returned to a location similar to its original site on the eastern margin of the retreated tongue, although a group continued at the new terminus site for 3 more years before abandoning it. The distance to the fast-ice edge was never more than 3.2 km from the terminus site, which is lower than the distance from the eastern-margin site in 14 of the 17 years (Fig. 7c). The terminus site also experienced an early fast-ice breakout event in 2013 that probably led to total or partial breeding failure for the group that was exposed. It seems probable that this site was abandoned in favour of a return to the eastern margin because the small amount of fast ice and its early breakout left the colony vulnerable. Overall, we found the Mertz colony to be in approximately the same location as reported by Wienecke et al. (Reference Wienecke, Lieser, McInnes and Barrington2024) for the period 2009/2010–2023/2024, but we add the presence of the colony in 2011/2012 when Wienecke et al. (Reference Wienecke, Lieser, McInnes and Barrington2024) did not observe it, we report on additional sightings at the terminus site and we extend the record prior to 2009.
At SANAE, as with Mertz, the colony relocated following a major calving event. In this case the colony’s typical site was not removed in the same way as at Mertz, but its configuration was substantially altered and the site became more exposed. The colony was not absent from the wider region in any years, but, following the first season after calving when it was observed at both the original site and a new site, it was observed exclusively at the ‘new’ sites for the following 4 years. As at Mertz, the colony then continued for a period at the ‘new’ site(s) while also returning to the ‘original’ site. In the two most recent seasons it seemed that the ‘new’ sites had been abandoned. Notably, in the years before being abandoned, one of the ‘new’ sites experienced early fast-ice breakout that could have led to breeding failure. In addition, in 7 of the 10 years when the ‘new’ sites were utilized, the maximum fast-ice edge distance was greater than the maximum distance at any time from the original site. It is not clear what impact the greater distance to the fast ice would have had, but it is possible that the distance to the fast-ice edge at the ‘new’ sites was not as optimal for breeding as at the original site, and some observations have suggested that greater distances could negatively impacting foraging (Kooyman et al. Reference Kooyman, Ainley, Ballard and Ponganis2007, Labrousse et al. Reference Labrousse, Fraser, Sumner, Le Manach, Sauser and Horstmann2021).
These disruptions demonstrate how extreme events could strongly influence the trajectory of population decline (Jenouvrier et al. Reference Jenouvrier, Che-Castaldo, Wolf, Holland, Labrousse and LaRue2021). As calving increases due to ocean warming and sea-ice loss (Miles et al. Reference Miles, Stokes and Jamieson2016, Reference Miles, Stokes, Jenkins, Jordan, Jamieson and Gudmundsson2020, Arthur et al. Reference Arthur, Stokes, Jamieson, Miles, Carr and Leeson2021), among other factors, as has already been observed in some regions (Greene et al. Reference Greene, Gardner, Schlegel and Fraser2022, Miles et al. Reference Miles, Stokes, Jenkins, Jordan, Jamieson and Gudmundsson2020), climate change may further exacerbate this trend. Consequently, colonies may be forced to relocate more frequently, whether temporarily or permanently, to suboptimal sites as their preferred habitats are lost or disrupted.
Early fast-ice breakout
Extreme ice events in the form of early fast-ice breakouts occurred at Mertz and SANAE but not at Astrid. The only early fast-ice breakout that potentially impacted breeding at SANAE’s original site occurred in 2023, when Antarctic sea-ice extent was at a record low (Gilbert & Holmes 2024). At Mertz, seven early breakout events occurred in total, with six of those occurring at the eastern-margin site. Notably, three of those events occurred in the 3 years prior to the major calving event in 2010, when the site was at its most northerly point and sea-ice extent was above the 1981–2010 median extent (NSIDC 2025). Their timing on 23 December 2007, 23 December 2008 and 3 December 2009 (i.e. before 31 December) suggests that partial or total breeding failure may have occurred in these years (Fretwell Reference Fretwell2024a). Following calving, the eastern-margin site moved northwards, and there were no more early breakout events until 2016. The 2016 breakout occurred remarkably early, in September, during a period of record springtime retreat across the continent (Turner et al. Reference Turner, Phillips, Marshall, Hosking, Pope, Bracegirdle and Deb2017). The year 2016 also marked the beginning of the recent decline in Antarctic sea ice that could potentially represent a switch to a new regime (Purich & Doddridge Reference Purich and Doddridge2023). Since then, two more early breakout events have occurred: on 25 November 2018 and 22 December 2021. In 2018 this early breakout was despite the colony being 60.0 km south of its most southerly position (in 2007) prior to the major calving event. Although the relationship between overall sea ice and fast-ice breakouts is not fully understood (Fraser et al. Reference Fraser, Massom, Handcock, Reid, Ohshima and Raphael2021), it is probable that more early breakouts will occur (Fraser et al. Reference Fraser, Wongpan, Langhorne, Klekociuk, Kusahara and Lannuzel2023, Fretwell et al. Reference Fretwell, Boutet and Ratcliffe2023) as sea ice potentially enters a new state (Purich & Doddridge Reference Purich and Doddridge2023, Raphael et al. Reference Raphael, Maierhofer, Fogt, Hobbs and Handcock2025), possibly impacting breeding at all three sites. Additionally, if colonies move northwards towards the fast-ice edge as their adjacent ice shelves advect (as is broadly the case at SANAE and Mertz due to the colonies’ attachment to a particular advecting bay and re-advance of the tongue, respectively), early breakout is also increasingly probable at those sites regardless of sea-ice changes, unless calving events force relocation. Southwards relocation, where possible, could potentially provide some mitigation against such losses, as it seemingly did at Mertz to an extent after the 2010 calving. In contrast to SANAE, at Astrid the colony’s location is tied to the terminus of the ice shelf rather than to a particular area of ice that advects. It therefore has undergone the least change in location and does not move north to ‘follow’ the ice unless there is terminus advance.
In some instances of early fast-ice breakout at a colony some of the colony remained evident on an adjacent platform of fast ice or at the very edge of the ice shelf. This included the 2009, 2013, 2016, 2018 and 2021 events at Mertz and the 2023 event at SANAE. The 2018 breakout at Mertz was noted by Wienecke et al. (Reference Wienecke, Lieser, McInnes and Barrington2024), and they reported no more sightings of the colony that year, but we found the colony to be present after this. However, it remains probable that significant breeding failure occurred in at least some of these instances. Although it is not possible to estimate populations from this imagery, in some instances (particularly 2016 and 2018 at Mertz) the notably smaller guano staining seemed likely to be due to loss of some of the colony.
Ice surface types at colony locations
Although emperor penguin colonies are usually on fast ice, all three colonies were located on an ice shelf at times in some years, as well as on an iceberg in 1 year each at Mertz and Astrid. Several colonies have been recorded on ice shelves/glaciers before, but this was thought to be uncommon (Fretwell & Trathan 2009, Wienecke Reference Wienecke2012, Fretwell et al. Reference Fretwell, Trathan, Wienecke and Kooyman2014, Wienecke et al. 2014). As we found all three colonies to move onto ice shelves, we suggest that this may be more common and more feasible than previously thought. Where early-season images are available, we observed that the colonies move onto the ice shelf during the summer, suggesting that they do not lay their eggs there. Interestingly, they typically move onto the ice shelf when fast ice remains and is apparently stable, and we observe this in older images as far back as 2001. This suggests that other factors, such as exposure to wind or factors relating to the fast ice that are not apparent in the imagery, could be responsible for this behaviour.
The colony at SANAE regularly moved onto thick multi-year sea ice that we refer to as ‘rift ice’. The rift ice remained over many years, similarly to shelf ice, but it is probably easier for the penguins to move onto because it is thinner and its surface is lower. Its presence seems to play an important role for the colony, offering a platform when most or all of the fast ice has broken out or not yet reformed. For example, when the colony returned in April 2023, being visible on rift ice, there did not appear to be any stable fast ice. It is also via the rift ice that the SANAE colony moved onto the shelf ice. If it is more feasible than previously thought, the potential to move onto alternative surfaces, such as shelf ice, icebergs or rift ice, could possibly represent a useful adaptation for emperor penguins as sea ice reduces, although Jenouvrier et al. (Reference Jenouvrier, Eparvier, Şen, Ventura, Che-Castaldo and Holland2025) suggest that moving onto ice shelves will not change the trajectories of population declines.
Conclusions
We analysed the Astrid, SANAE and Mertz emperor penguin colonies using multiple satellite platforms over the years 1984–2024. By leveraging Google Earth Engine cloud computing we demonstrated the feasibility of analysing colonies over several decades and the value of using multiple instruments to maximize temporal coverage, including the first such use of ASTER. Colonies typically returned to approximately the same sheltered sites annually throughout the 35–40 year period, but there were variations due to major calving events. Indeed, over the study period all three sites were subject to major calving or fast-ice breakout events. Following major calving events at Mertz (2010) and SANAE (2011) that disrupted breeding sites, colonies relocated to new sites in different embayments, where they were more vulnerable to earlier fast-ice breakout or had to travel longer distances for foraging. In subsequent years the colonies eventually returned to sites close to their original location. The Astrid colony did not relocate following a major calving event (2006), probably because the original site at the shelf terminus remained covered with fast ice and was sufficiently sheltered by the remaining ice shelf and icebergs. Additionally, we observed early fast-ice breakouts that may have impacted breeding success at the Mertz and SANAE colonies, including as early as September at the Mertz colony in 2016. Such events were related both to broader sea-ice conditions, including the recent dramatic decline in Antarctic sea-ice extent since 2016, and variations in colony location related to ice-shelf advection. Notably, all three colonies moved onto neighbouring ice shelves in some years (and onto icebergs as well at Mertz and Astrid), including when stable fast ice was available, suggesting that this behaviour may be more common than was previously thought. Observation of these behaviours contributes to our broader understanding of emperor penguins’ adaptability and will aid future efforts to model the response of the species to ice loss in the context of climate change.
Supplementary material
Three tables and three figures are in the supplementary document at https://doi.org/10.1017/S0954102025100515.
Author contributions
Project developed by all authors; data collection, mapping and analysis conducted by GJM with discussion from all authors; manuscript drafted by GJM with contributions from all authors.
Acknowledgements
We acknowledge the European Space Agency (ESA) and National Aeronautics and Space Administration (NASA) for making imagery available and Google Earth Engine for hosting. We acknowledge the contributions of the editor and two anonymous reviewers, whose comments helped us to improve the manuscript.
Financial support
This work was funded by Natural Environment Research Council (NERC) UK NE/Y00115X/1 awarded to SSRJ and PTF.
Competing interests
The authors declare none.


 Open access