

Introduction
The structural biology community has been uniquely proactive in establishing data resources that archive the results of research and provide services to access and analyze those data. The Protein Data Bank (PDB) was established as a repository for biomacromolecular structural data more than 45 years ago (Protein Data Bank, 1971). It now contains more than 140 000 structures determined by X-ray crystallography, Nuclear magnetic resonance (NMR) spectroscopy, and three-dimensional electron microscopy (3DEM). A diverse community of researchers, students, educators and the general public downloads more than 1.9 million data sets every day. In this review, we demonstrate how the synergies among science, technology and community enabled the PDB to preserve the past while constantly evolving to reflect contemporary needs. We describe how and why two other structural biology data resources were created to supplement and collaborate with the PDB. We conclude by demonstrating how the experiences of the past inform how we are meeting the current challenges presented by the more recent determination of structural models of large macromolecular machines.
The synergies of science, technology and community in the development of the PDB
In 1957, the structure of myoglobin was determined (Kendrew et al., Reference Kendrew1958), followed shortly thereafter by hemoglobin (Perutz et al., Reference Perutz1960). Thus, began the era of structural biology in which, one by one, structures of small proteins including enzymes such as lysozyme (Blake et al., Reference Blake1965), ribonuclease (Kartha et al., Reference Kartha, Bello and Harker1967; Wyckoff et al., Reference Wyckoff1967), and carboxypeptidase (Quiocho and Lipscomb, Reference Quiocho and Lipscomb1971) were determined using X-ray crystallography. By the late sixties, more than a dozen structures had been determined. In those days, X-ray crystallographic methods involved the use of calculators, newly emerging computers and manual model building relying on the Richards Box, an optical comparator that had to be housed in a large room (Richards, Reference Richards1968). A single determination took years of painstaking work. The three-dimensional (3D) atomic coordinates obtained from these structure determinations contained a treasure trove of information that would eventually reveal new insights into biology, medicine, biophysics and biochemistry. Indeed, the award of the Nobel Prize to Kendrew and Perutz in 1962 (Nobelprize.org, 2017) recognized not just their achievements, but also the potential of X-ray crystallography. However, for others to help build on that knowledge, it would be necessary to have access to the 3D coordinates produced by all of these new structure determinations.
The coordinate data were stored on punched cards, paper tape and magnetic tape. Because the Internet was only beginning to be established, transfer of data between laboratories involved recording the data onto appropriate media and mailing it. Starting in 1966, a small community of scientists met periodically to discuss how best to archive and distribute these structures. In 1971, a seminal meeting was held in Cold Spring Harbor (Phillips, Reference Phillips1972) in which the practitioners and now pioneers of structural biology described their structures to a rapt and inspired audience. Among the attendees was Walter Hamilton, an energetic and highly respected chemical crystallographer from Brookhaven National Laboratory (BNL). Walter had been collaborating with Edgar Meyer who was creating a Protein Library (Meyer, Reference Meyer1997). When presented with the problem of needing an archive for biomacromolecular structures, Hamilton immediately offered to house one at BNL. He contacted Olga Kennard who was then head of the Cambridge Crystallographic Data Center (CCDC) in Cambridge, UK (Allen et al., Reference Allen1973) and they agreed to set up the PDB (Protein Data Bank, 1971) as collaboration between BNL and CCDC. After Hamilton's death in 1973, Tom Koetzle took over the direction of the PDB. In 1979 there were 53 structures in the PDB (Fig. 1), some of which are shown in Fig. 2.
Growth chart of structures in the PDB with indicators of each decade. (a) The number of structures released per year (blue) and the cumulative number of structures (orange). (b) The same information, using a log scale. The number of structures released at the end of each decade is indicated by black brackets.

Examples of structures determined in the 1970's. Ribbon representations were generated using UCSF Chimera (Pettersen et al., Reference Pettersen2004). (a) Myoglobin (Watson, Reference Watson1969), PDB ID: 1MBN. First protein structure determined using X-ray crystallography. (b) Lysozyme (Blake et al., Reference Blake1965; Kelly et al., Reference Kelly1979), PDB ID: 9LYZ. First enzyme structure determined using X-ray crystallography. (c) Yeast phenylalanine transfer RNA (Rich & Kim, Reference Rich and Kim1978; Robertus et al., Reference Robertus1974), PDB ID: 4TNA. First RNA structure determined using X-ray crystallography.

The 1980s saw a steady growth of structures in the PDB in large part because of the emergence of powerful new technologies. Genetic engineering made it possible to clone and express large quantities of protein without resorting to extraction from natural biological sources. Chemical synthesis could be used to obtain purified fragments of DNA. The advent of synchrotron sources allowed the collection of data with intense X-ray beams (Harmsen et al., Reference Harmsen, Leberman and Schulz1976). At the same time, development of the multiple anomalous diffraction phasing method (MAD) (Hendrickson et al., Reference Hendrickson, Smith and Sheriff1985) leveraged the ability to tune the X-ray wavelength using synchrotron radiation. Flash freezing (Hope, Reference Hope1988) to prevent crystal decay began to be more widely used. Multi-wire detectors made it possible to rapidly collect many diffraction reflections at once (Hamlin, Reference Hamlin1985). Computing technology continued to improve. In particular, molecular graphics made it possible to fit structural models to electron density (Jones, Reference Jones1978), replacing the need for the Richards Box. During this period, NMR spectroscopy began to be used for determining the structures of small proteins (Horst et al., Reference Horst2001), thus eliminating the requirement of crystallinity. During the 1980s, the first atomic structures of viruses were determined (Hopper et al., Reference Hopper, Harrison and Sauer1984; Erickson et al., Reference Erickson1985) as were those of DNA (Dickerson et al., Reference Dickerson1982) (Fig. 3).
Examples of structures determined in the 1980's. (a) A, B and Z DNA (Dickerson et al., Reference Dickerson1982). This representation of the three canonical forms of DNA is taken from the Molecule of the Month (Goodsell, Reference Goodsell2001). (b) Rhinovirus (Arnold & Rossmann, Reference Arnold and Rossmann1988), PDB ID: 4RHV. This was one of the early virus structures determined using X-ray crystallography. Three unique chains (grey, pink, orange surfaces) are repeated 60-fold to create a virus capsid with icosahedral symmetry.

With the potential of structural biology being realized at an increasing pace, members of the scientific community began to be concerned that valuable data would be lost if deposition of structures into the PDB were not mandatory (Barinaga, Reference Barinaga1989). Starting in about 1982, committees were set up to determine exactly which data should be archived. Fred Richards created a petition signed by many of the leading structural biologists, urging deposition into the PDB (Hufton, Reference Hufton2014). In 1989, the International Union of Crystallography (IUCr) published guidelines for the deposition, archival and release of structural data (International Union of Crystallography, 1989). The National Institute of General Medical Sciences (NIGMS) then made a ruling that structure determinations funded by that institute had to be archived by the PDB. In time, virtually all journals required deposition of coordinates in the PDB as a mandatory condition of publication. Another important event in the 1980s was the inclusion of structural biology as a focus of research by Howard Hughes investigators (Howard Hughes Medical Institute, 2017). By 1989, there were 365 structures in the PDB (Fig. 1).
The rate of data deposition rapidly took off in the 1990s as even better methods for data collection, structure determination and refinement were developed and adopted. Computer performance continued to improve dramatically and structural biologists were more than eager to embrace the new capabilities. During this period, the very first atomic structure determined by electron microscopy methods was deposited into the PDB (Henderson et al., Reference Henderson1990). The 1990s saw the deposition of many protein-nucleic acid complexes into the archive, including the structure of the nucleosome (Luger et al., Reference Luger1997) (Fig. 4). By 1999, there were 10,963 structures in the PDB10963 (Fig. 1).
Examples of structures determined in the 1990's. (a) The structure of a regulator of transcription called the TATA-binding protein bound to DNA. The binding of beta sheets into the minor groove of DNA causes a profound bend in the DNA (Patikoglou et al., Reference Patikoglou1999), PDB ID: 1QN6. (b) Nucleosome (Luger et al., Reference Luger1997). The DNA is shown in orange wraps around the histone proteins shown in blue. Taken from the Molecule of the Month (Goodsell, Reference Goodsell2000a).

When the PDB was first established, the focus was on the collection of the coordinate data as well as some other descriptive data. The PDB Format (Westbrook & Fitzgerald, Reference Westbrook, Fitzgerald, Bourne and Gu2009) was widely adopted because it was simple and ‘human’-readable. However, it was lacking in many other ways: relationships among data items were implicit and not explicit, there was no controlled vocabulary, there were limitations on the number of atoms and residues, and some of the definitions of data items were vague. In 1990, the IUCR set up a working group (WG) to create a Macromolecular Crystallographic Information File (mmCIF). It was originally supposed to be a variant of the Crystallographic Information File (CIF) that was already established for small molecules (Hall et al., Reference Hall, Allen and Brown1991). The mmCIF WG decided to use the opportunity to not only create richer data content with precise definitions for the macromolecular crystallographic experiment and its results but also to improve the data representation for PDB entries. A new data model was created that had data type definitions, explicit parent–child relationships among data items, enumerations for controlled vocabulary, and many other features. Workshops were held to obtain community feedback; by 1996, more than three thousand definitions were instantiated into a computer readable dictionary (Fitzgerald et al., Reference Fitzgerald, Hall and McMahon2005). When the PDB moved from management by BNL to the Research Collaboratory for Structural Bioinformatics (RCSB) in 1998, mmCIF became the underlying data model that allowed for the creation of a relational database. However, uptake by the community was slow and it was not until 2011 that mmCIF became the Master Format for the PDB, allowing the PDB Format to be retired. As larger structures of macromolecular assemblies started to be deposited into the PDB, the limitations of the PDB format became more apparent, leading to wider acceptance of the mmCIF format.
The 2000s saw even more growth in the PDB. Ribosome structures, representing some of the very largest and most complex structures in the PDB, were deposited (Ban et al., Reference Ban2000; Carter et al., Reference Carter2000; Schluenzen et al., Reference Schluenzen2000) (Fig. 5). Not surprisingly, the feat of determining these structures led to the award of a Nobel Prize in Chemistry in 2009, shared by three structural biologists. During the same period, the Protein Structure Initiative (PSI) began in which structures were determined on a genomic scale, resulting in nearly 7000 new structures in the PDB. In 2009, there were 61,812 structures in the PDB (Fig. 1).
Ribosome subunits. The small subunit is shown on the left and the large on the right (Ban et al., Reference Ban2000; Carter et al., Reference Carter2000; Schluenzen et al., Reference Schluenzen2000). The protein is shown in blue and the RNA in orange and yellow. Taken from the Molecule of the Month (Goodsell, Reference Goodsell2000b).

When the PDB was first established, it was international in nature. Under BNL management, only one site curated the data, although there were multiple mirror or distribution sites. After RCSB was awarded the grant to manage the PDB, other sites were eager to become deposition sites. In 2003, three data centers, RCSB PDB in the USA, MSD (later PDBe) at the EMBL-EBI, and PDBj in Osaka, established the worldwide PDB (wwPDB) (Berman et al., Reference Berman, Henrick and Nakamura2003). A formal agreement was created to ensure that all structures curated by the data centers follow the same rules for data processing and that there would be one archive with identical copies distributed by the wwPDB partners. At the time of this first agreement, compliance was difficult because there were two completely different processing pipelines. To ensure that the curated data files were in fact following the same rules, there were regular exchanges among the wwPDB partners to revalidate the data. The need for a single data processing pipeline became apparent. The project to create OneDep began in 2007; this new pipeline system was put into production in 2014 (Young et al., Reference Young2017).
By establishing an international consortium whose goal was to develop and maintain a single, high-quality archive, it became possible to remediate existing data to meet more modern standards. One of the most important accomplishments was updating the PDB to use IUPAC nomenclature for standard amino acids and nucleotides (Henrick et al., Reference Henrick2008). Other efforts resulted in an incrementally improved corpus of data. Structures that had been represented in multiple, inconsistent ways, for example, peptides and viruses, were corrected, and curation of data going forward was improved (Lawson et al., Reference Lawson2008; Dutta et al., Reference Dutta2014).
During this same era, the requirement for creating more stringent validation criteria emerged from the community. An important milestone was reached in 2008 when all crystallographic depositions were required to be accompanied by structure factors (Wlodawer et al., Reference Wlodawer2008); in 2010, chemical shifts were required for NMR structures. There was also increasing concern about the possibility that fraudulent structures had become a part of the archive. In 2008, the first of many method-specific wwPDB sponsored Validation Task Forces (VTFs) was set up. The charge to the X-ray VTF was to make recommendations to the wwPDB about validation of structures determined by that method. The X-ray VTF examined all available methods, tested them on the entire archive and reported their findings in a paper published in Structure (Read et al., Reference Read2011). Their recommendations became the basis of the wwPDB OneDep Validation module (Gore et al., Reference Gore2017).
In this section, we have demonstrated how the PDB content and policies have evolved over the last 45 years and how the PDB has been agile in responding to rapid and unexpected scientific advances, technical improvements and strongly held beliefs of many stakeholders. Long before the introduction of the ‘FAIR’ guiding principles (Wilkinson et al., Reference Wilkinson2016), the PDB archive has been making the results of structural biology investigations Findable, Accessible, Interoperable and Reusable.
Structural genomics and the Structural Biology Knowledgebase (SBKB)
The PDB contains many related structures, including homologs from different organisms, biomolecular complexes with different ligands, and even systematic small mutations of proteins introduced to investigate the effect on folding and activity; for example, PDB contains 566 structures of Bacteriophage T4 lysozyme variants (Matthews, Reference Matthews1996) and more than 250 structures of small molecule – HIV protease complexes (Wlodawer, Reference Wlodawer2002). The protein structure initiative (PSI) was launched to enable the determination of unique and diverse structures on a genomic scale (Norvell & Berg, Reference Norvell and Berg2007). The first phase focused on determining structures of proteins with extremely low sequence similarity to known structures, with the goal of finding new folds. The second phase focused on biology and linked the high throughput centers with projects on specific biological problems that would benefit from systematic structural approaches. For example, there were substantial gains made in determining structures of previously intractable membrane proteins (Pieper et al., Reference Pieper2013). New high-throughput approaches were developed that allowed for advances in every part of the structure determination pipeline, including methods for producing pure protein samples, robotic crystallization, robotic crystal mounting and positioning and automated structure determination. Counter to some earlier concerns, the quality of the structures improved and the cost per structure determination decreased significantly (Grabowski et al., Reference Grabowski2016).
To meet the data management requirements of the PSI project, SBKB was created in 2008 (Berman et al., Reference Berman2009; Gabanyi et al., Reference Gabanyi2011). The SBKB consisted of several modules that addressed the varying needs of the PSI project, described below.
TargetTrack provided information about the status of over 330 000 targets studied by the PSI Centers, including selection rationale, histories of protein production trials, and structure determination and deposition. It also collected and made public more than a thousand protocols routinely used by the centers, with variations noted on a trial-by-trial basis. Sequence-based annotations were also calculated and aggregated into each TargetTrack record. The data collected by TargetTrack were usually the first pieces of information available about a given sequence; to share it in the public domain, not only within the PSI Network, was unprecedented at that time.
A Technology Portal provided reports about the various technologies being developed to enable high-throughput protein production and structure determination (Gifford et al., Reference Gifford2012). Summaries of over 450 novel technologies or protocols, along with their use cases, contact information, and references were collected. Categorization by experimental step enabled researchers to find new ideas for overcoming barriers that they could translate into their own laboratory.
Biosync (Kuller et al., Reference Kuller2002; Flippen-Andersen et al., Reference Flippen-Andersen, Gabanyi, Chen, Sala, Westbrook and Berman2010) became a module of the SBKB. This data resource collects synchrotron beamline parameters and experimental capabilities, and tracks the number of structures released per facility and beamline.
The Publication Portal tracked PSI publications along with their citations and journal impact factors. To date, 80% of the 2300+ articles published by the PSI have at least 5 citations.
The PSI Materials Repository, collected 90 000+ clones and 120 novel cloning and expression vectors created by the PSI centers and distributed them to researchers all over the world (Seiler et al., Reference Seiler2014).
The Protein Model Portal (PMP) (Bordoli & Schwede, Reference Bordoli and Schwede2012) was created to help researchers locate homology models based on experimentally determined structures, thus further leveraging their impact. Users search the PMP by sequence or UniProt identifier, retrieving a list from among 22.8 million homology models pre-computed by Swiss-Model Repository (Kopp & Schwede, Reference Kopp and Schwede2004), MODBASE (Pieper et al., Reference Pieper2009), and the modeling groups within the PSI centers, as well as experimental structures from the PDB. A graphical map indicated how much of the sequence was covered by an experimental structure or derived from a model, and quality estimates were provided regarding the reliability of a model. If no model existed, new models could be requested and calculated by 6 public modeling servers. In 2013, the PMP group, with the support of the PSI and modeling community, created the Model Archive (Haas & Schwede, Reference Haas and Schwede2013). This new archive stores the computational model coordinates and details about assumptions, parameters and constraints applied in modeling. The Model Archive is open to all modelers and provides stable identifiers within publications as well as data storage and access in the public domain. To develop validation criteria for the modeling community, the PMP also constructed the Continuous Automated Model Evaluation (CAMEO) (Haas et al., Reference Haas2013) server that continuously evaluates the accuracy of predicted models, thus fostering the development of better modeling techniques.
The SBKB website integrated the results of the PSI with over 100 publicly available sequence, structure, function, proteomics and medicine databases. A search for any given protein sequence yielded all relevant annotations or products, presenting a view of what information was known, or still to be discovered. All structures, models, targets, and clones >40% identical in sequence were returned to allow for new connections to be found within the data. If a particular sequence yielded no annotations through the SBKB, users could nominate it for structure determination through the community-nomination portal, where users would be matched to collaborate with a PSI center. As the outreach arm of the PSI project, the SBKB also partnered with the Nature Publishing Group (now Macmillan Group) to write 320 research highlights on PSI advances for the SBKB portal. David Goodsell, the author of the RCSB PDB's Molecule of the Month series (Goodsell et al., Reference Goodsell2015), also created 90 illustrated essays of key PSI structures. PSI workshops were also archived on the SBKB.
By mid-2017, the PSI program produced 6920 structures, contributing over 5% of the current PDB archive (Table 1). Nearly 80% of these entries were distinct from each other and had less than 30% sequence identity to any structure pre-existing in the PDB (Dessailly et al., Reference Dessailly2009). A total of 600 structures were motivated by community requests. During PSI:Biology (2010–2015), the 9 membrane protein centers determined 160 structures and developed ~40 novel technologies/methods for this difficult-to-determine class of proteins. Although the PSI program was terminated in 2015, the high throughput methods that enabled its productivity have endured. The SBKB is no longer operational following the end of the PSI program, but some of the modules continue to be available, including Protein Modeling Portal (Haas et al., Reference Haas2013) and Biosync (Flippen-Andersen et al., Reference Flippen-Andersen, Gabanyi, Chen, Sala, Westbrook and Berman2010). The TargetTrack dataset has been archived (doi: 10.5281/zenodo.821654).
Summary statistics of structures and other research products produced by the Protein Structure Initiative (PSI), 2000–2017

Electron Microscopy Data Bank
Bacterial rhodopsin was the first structure determined by electron microscopy deposited into the PDB (Henderson et al., Reference Henderson1990). Because electron crystallography was used, it was possible for the PDB to curate the entry using a variation of the procedure for structures determined by X-ray crystallography. The determination of structures by cryo-electron microscopy (3DEM) became popular in the 2000s as software for reconstruction of 3D density maps from 2D single-particle images became available, even though the level of detail produced was typically limited (Chiu et al., Reference Chiu2005). 3DEM scientists began to determine the overall shapes of large macromolecular complexes that could not be crystallized, opening up an important new avenue for structural biology investigations. The maps derived from 3DEM experiments could frequently be fitted with structures derived from X-ray crystallography, NMR spectroscopy or homology modeling, yielding ‘pseudo-atomic’ models that were able to provide useful insights and leads for further research (Rossmann et al., Reference Rossmann2005).
In 2002, a new data archive called EM Data Bank (EMDB) containing maps and metadata was established at the EMBL-EBI (Editorial, 2003; Henrick et al., Reference Henrick2003). Structures determined by 3DEM methods began to be deposited with maps archived in EMDB and models separately archived in PDB. An initial dictionary of data terms to describe 3DEM experiments was drafted jointly by the groups at EBI and RCSB, based on requirements provided by the 3DEM community in a series of international workshops. In 2006, the EBI and RCSB groups joined forces with Wah Chiu at the National Center for Macromolecular Imaging (NCMI) to create a ‘one stop shop’ for deposition and retrieval of maps and models at EMDataBank.org (Lawson et al., Reference Lawson2011). Both groups launched ‘serial’ map + model deposition and annotation systems that directed users first to deposit their maps to EMDB using EmDep (Henrick et al., Reference Henrick2003) and second to deposit their models to PDB with the transfer of relevant experimental metadata, as defined in the 3DEM data dictionary. The serial systems worked remarkably well, even though the underlying coordinate deposition and processing systems at the two sites were substantially different (see the section The synergies of science, technology and community in the development of the PDB). Over a 9-year period (2008–2015), nearly 4000 3DEM maps and 1000 3DEM models were processed in this manner. Truly joint map + model deposition for 3DEM structures was instantiated in 2016 with the OneDep system recently implemented by the wwPDB (Young et al., Reference Young2017).
There has been substantial growth in 3DEM derived structures over the past few years (Fig. 6). Major technological advances, including the introduction of the direct electron detector and better data processing methods, have enabled the determination of structures derived from 2D single-particle images to near-atomic resolution, making it increasingly possible to visualize amino acid sidechains and nucleotide bases (Vinothkumar & Henderson, Reference Vinothkumar and Henderson2016). The award of the 2017 Nobel Prize in Chemistry to 3DEM pioneers Henderson, Frank and Dubochet recognized the potential of this rapidly evolving method to contribute to structural biology. Figure 7 provides several examples of maps deposited into EMDB just in the past year, each with a reported resolution of 4·5 Å or better.
Cumulative growth of 3DEM Structures. The number of structures available in EMDB for each recent year is indicated in purple (resolution better than 5·0 Å, dark purple); the number of EM-derived models available in PDB is indicated in green (resolution better than 5·0 Å, dark green).

Sampling of 3DEM structures recently released in EMDB: (a) GroEL (Roh et al., Reference Roh2017), EMD-8750 (b) DNA Protein Kinase (Sharif et al., Reference Sharif2017), EMD-8751 (c) Heterotrimeric Gs protein complex (Liang et al., Reference Liang2017), EMD-8623 (d) Glutamate A2 receptor (Twomey et al., Reference Twomey2017), EMD-8823 (e) Spliceosome (Wan et al., Reference Wan2016), EMD-9525 (f) Rhinovirus/Fab complex (Dong et al., Reference Dong2017), EMD-8763.

The deluge of high-resolution 3DEM structures has made it a priority to establish robust validation methods for 3DEM derived maps and models. With OneDep now providing the facilities for 3DEM deposition, the current focus of EMDataBank.org is on enabling development of validation methods for 3DEM.
The current PDB pipeline
The PDB is responsible for collecting data entries from structural biologists and distributing curated data entries to users. To accomplish this goal, it is necessary to implement a data management pipeline with components for data deposition, curation, validation, archiving and distribution. Over time, data management has changed. Next, we describe current practices in the PDB data management pipeline (Fig. 8).
The Data Processing Pipeline, from Data Creation through Distribution. Each component of the PDB pipeline is described in the section The current PDB pipeline.

Requirements
In addition to the atomic coordinates, a considerable body of metadata is collected to describe how the coordinates were derived. The metadata are based on the details of each experimental method currently supported by the PDB: X-ray crystallography, NMR spectroscopy, and electron microscopy. Table 2 provides a summary of the various aspects of each method that need to be considered for data deposition.
Experimental metadata requirements for the methods currently supported by the PDB
Decisions about which data items must be collected are made in consultation with the community via the respective wwPDB Task Forces. Because the science, technology development and community sentiment change over time, the scope and level of granularity of the data to be collected also change over time. It is notable that protein production procedures are currently not collected. The PSI did, in fact, have procedures in place for collecting protein production protocols through TargetTrack (see the section Structural genomics and the structural biology knowledgebase (SBKB) above). However, compliance from the community was poor, which suggests that the time was not right for collecting and archiving protein production data.
Standards
To make the PDB archive computer searchable, it is essential that there are clear definitions for each data item collected. The PDBx/mmCIF format that is entirely computer readable is now the PDB Master Format. The data dictionary contains the definitions for all of the methods currently supported by the PDB (mmcif.wwpdb.org). The dictionary is extensible and allows for changes in existing methods and inclusion of new methods. A standing committee reviews the changing requirements and when necessary adds new definitions. In anticipation of changing needs, the dictionary also contains definitions for data items not currently in the PDB archive.
Data curation
All PDB entries are extensively curated. Many different aspects of the structure are carefully checked using a modular series of computational tools. For the polymer sequence, the following tasks are performed: cross-checks of author-provided sample sequence and coordinate sequence versus the sequence database, cross-checks of author-provided source organism versus the taxonomy database, assignments of database references and taxonomy identifiers to modeled protein polymer entities, and annotation of sequence discrepancies between sample sequence and database reference. For ligands, a search is performed to determine whether the ligand geometry is novel or equivalent to one of the ligands found in existing PDB entries. The ligand geometry is checked using a variety of 2D and 3D views. Derived data including the biological assembly are determined.
Data validation
Data in the PDB are validated according to recommendations made by Validation Task Forces that are convened by the wwPDB. Because X-ray crystallography is the oldest method supported by the PDB, its community has had the time and experience to develop the most extensive validation procedures (Read et al., Reference Read2011). The wwPDB has implemented the recommendations of the X-ray VTF directly into the data processing pipeline. Covalent geometry is checked against established standards. Intermolecular and intramolecular geometries of the polymer chains are checked for clashes using Molprobity (Chen et al., Reference Chen2010). The geometry of ligands is checked against standards derived from small molecule structures archived in the CCDC (Bruno et al., Reference Bruno2004). The deposition of structure factors allows the checking of real space R factors for each residue and each ligand. A Validation Report is produced with the detailed analysis of the geometrical features of the model as well as the fit of the structure to the underlying experimental data. The graphical representation in the form of sliders gives a summary of the quality of the structure.
Validation of NMR derived structures follows the recommendation of the NMR VTF (Montelione et al., Reference Montelione2013). The model geometry is checked in the same way as for X-ray derived structures. Consistency checks across models are carried out for NMR structures along with an examination of outliers in NMR restraints. For 3DEM-derived structures, the 3DEM VTF recommended that the validation of model geometry follow the same criteria developed for X-ray derived structures and that new methods be developed for 3DEM map validation and map-to-model fit (Henderson et al., Reference Henderson2012). One of the ways to achieve this goal involves engaging the community in EM Challenges (Lawson et al., Reference Lawson2016), where participants attempt to fit models to benchmarked maps, followed by an assessment of the results. These exercises are likely to result in more robust methods for validating 3DEM structural models.
To enable efficient data deposition, curation and processing, a new tool called OneDep was developed by the wwPDB (Young et al., Reference Young2017) (Fig. 9). OneDep has a Deposition and Annotation Workflow system containing the modules required for making data curation as thorough and automatic as possible. Skilled wwPDB biocurators review all of the results of data processing and work with the depositors to ensure the best possible representation of the submitted data.
OneDep System. Deposition is provided for X-ray, 3DEM and NMR. The annotation pipeline is made up of several modules that check the chemistry of the components, add new annotations and validate the structural model against standard geometries and the experimental data.

Archiving
Once the data are processed, the files are put into a temporary archive until they are ready for release, usually upon publication of the structure. The released structures reside in the PDB Archive, which can be accessed using methods such as the File Transport Protocol (FTP) and rsync. The PDB Archive consists of flat files that contain several types of data, including atomic coordinates, a molecular description of macromolecules and ligands, metadata describing the experimental method, and experimental data including structure factors, chemical shifts and restraints. 3DEM map data are curated by EMDB partner sites and archived under a separate, parallel branch of the archive. The PDB Archive is mirrored by all three wwPDB partners.
Data distribution
The PDB is distributed in several ways. Data can be downloaded via rsync or ftp protocols following the directions provided on the wwPDB website (https://www.wwpdb.org/download/downloads). In addition, each of the wwPDB data centers has websites that provide a multitude of services including downloading, searching and browsing (Berman et al., Reference Berman2000; Ulrich et al., Reference Ulrich2008; Velankar et al., Reference Velankar2016; Kinjo et al., Reference Kinjo2017; Rose et al., Reference Rose2017). Coordinate sets are currently downloaded from the wwPDB FTP and websites more than 550 000 000 times per year.
The future: integrative hybrid (I/H) methods
Traditionally, each PDB entry contains an atomic structural model derived from a single structure determination method, including X-ray crystallography, NMR spectroscopy and 3D electron microscopy. Recently, I/H methods have been developed that simultaneously use data from multiple experimental techniques to compute structures of single macromolecules or macromolecular complexes (Ward et al., Reference Ward, Sali and Wilson2013). In some cases, data from a primary method such as NMR are combined with additional information obtained from a secondary method such as small-angle solution scattering (SAS). In other cases, information from multiple experimental sources, such as Fluorescence resonance energy transfer (FRET), SAS, chemical crosslinking (CX) and mass spectrometry (MS) are pooled together to derive a set of spatial restraints that enable computation of a structural model. Combining multiple complementary experimental methods makes it possible to determine structures of large macromolecular machines that have previously eluded traditional structure determination methods. I/H methods have led to the elucidation of structures of macromolecular assemblies such as the nuclear pore complex (Alber et al., Reference Alber2007a, Reference Alber2007b) and its sub-complexes (Fig. 10, (Kim et al., Reference Kim2014; Shi et al., Reference Shi2014)), the type III secretion system needle (Loquet et al., Reference Loquet2012), the proteasomal lid complex (Politis et al., Reference Politis2014), the exosome complex (Shi et al., Reference Shi2015) and the mediator complex (Robinson et al., Reference Robinson2015). Although many important structures have been determined using I/H methods, there are no standard mechanisms to archive these structures and make them available to the public. An important distinction between structural models obtained through I/H methods and the atomistic models currently archived in the PDB is that I/H models are often coarse-grained. The existing PDB data pipeline expects fully atomistic models and hence cannot process coarse-grained I/H models.
I/H model of the Nup84 sub-complex from the Nuclear Pore Complex (Shi et al., Reference Shi2014) available from PDB-Dev (Burley et al., Reference Burley2017; Vallat et al., Reference Vallat, Webb, Westbrook, Sali and Berman2018), PDB-Dev ID: PDBDEV_00000001. Multi-scale structural model of the heptameric Nup84 sub-complex is shown (colored ribbons and spheres) along with the localization densities of the sampled structures (colored contoured surfaces). The model is obtained using the Integrative Modeling Platform (IMP) software (Russel et al., Reference Russel2012) and visualized using ChimeraX software (Goddard et al., Reference Goddard2018).

In 2014, 38 experimental and computational scientists assembled at the EMBL-EBI to discuss how best to archive the results of I/H structure determinations. The wwPDB I/H methods Task Force (I/HTF) made the following series of recommendations that would enable the wwPDB to address this problem (Sali et al., Reference Sali2015): (1) a flexible model representation should be developed, allowing for multi-scale models (with atomistic and non-atomistic coarse-grained representations), multi-state models (existing in various conformations), ensembles of models, and models related by time or other order; (2) procedures for estimating the uncertainty of integrative models should be developed, validated, and adopted; (3) all relevant experimental data and metadata as well as experimental and computational protocols should be archived; (4) a Federation of model and data archives should be created; and (5) publication standards for integrative models should be established.
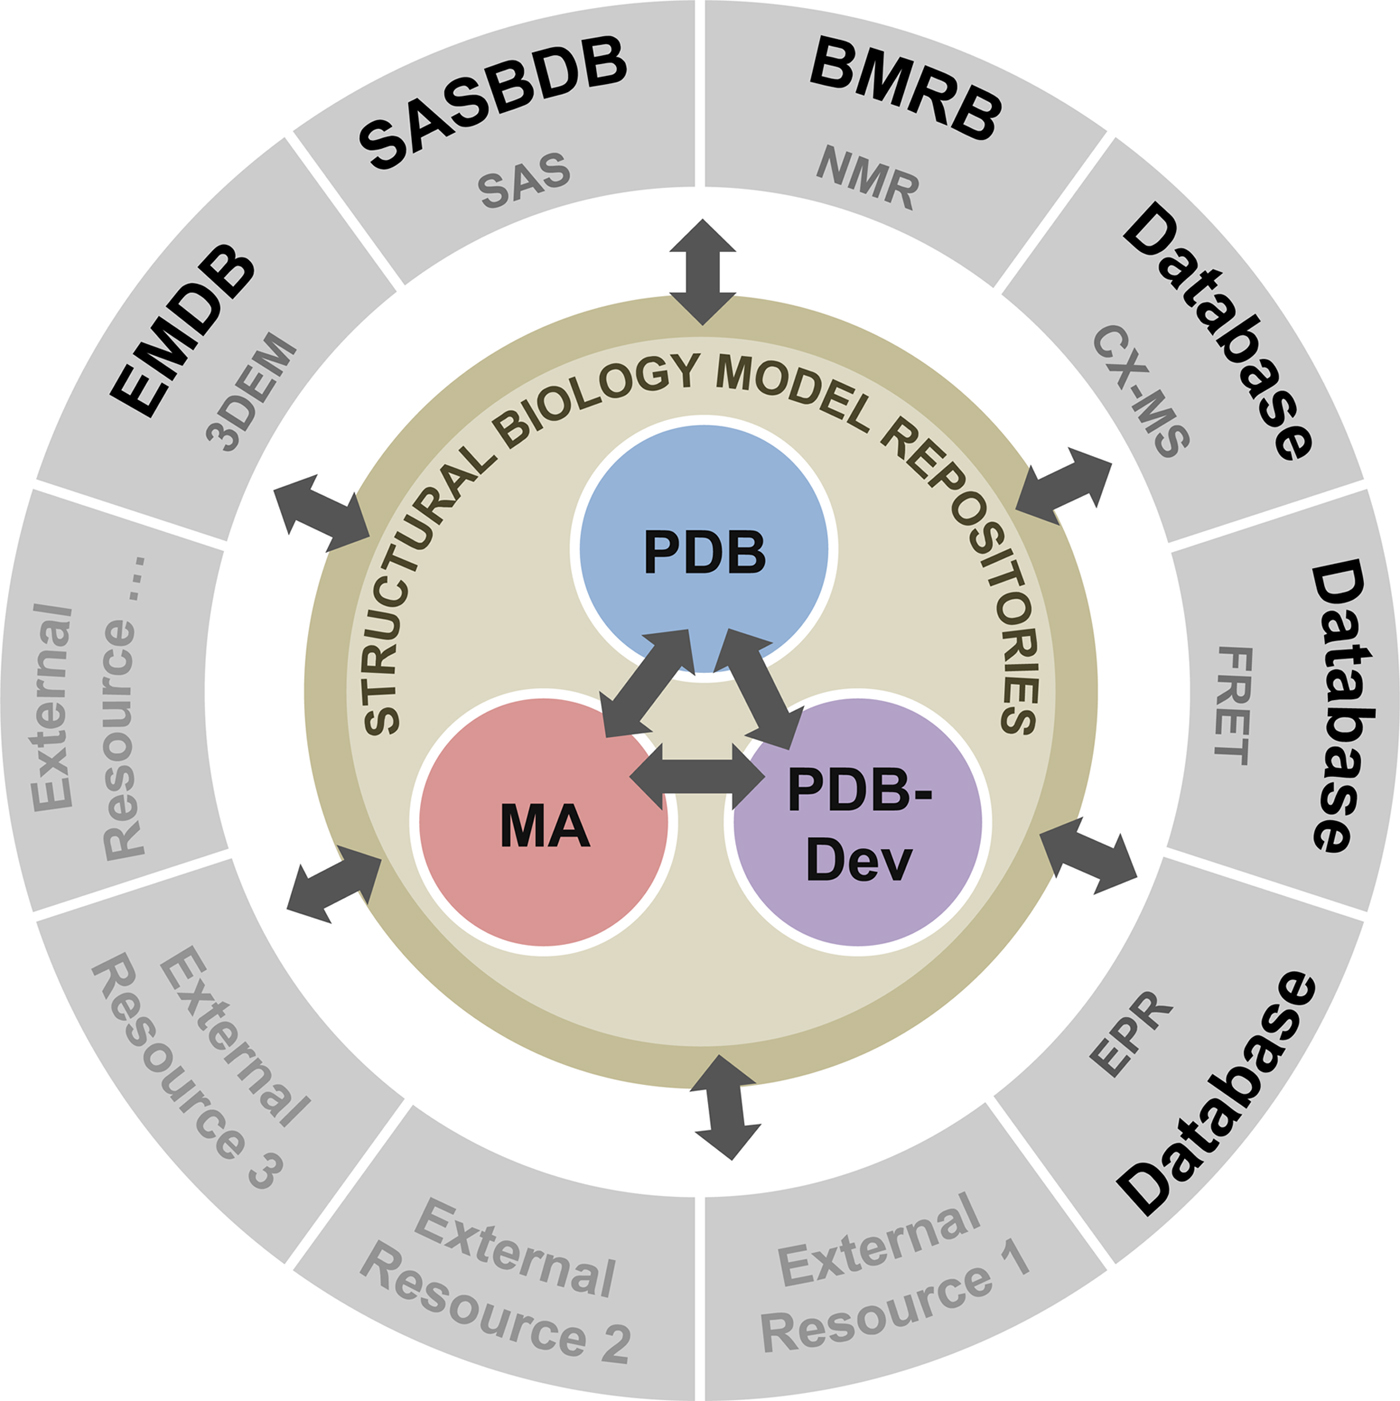
To address these recommendations, two subgroups of the I/HTF have been established: the Model Validation Subgroup and the Federation Subgroup. The concept of a Federation of model and data repositories would allow individual disciplines to create appropriate repositories for their experimental data based on the requirements of their communities. Mechanisms for data exchange would promote seamless interoperation among the federated repositories (Fig. 11).
Conceptual diagram of the I/H Methods Federation. At the center are the three structural biology model repositories: the PDB archives experimentally determined structures of macromolecules (Berman et al., Reference Berman2000); the Model Archive (MA), part of the Protein Model Portal (PMP), archives in silico structural models (Bordoli and Schwede, Reference Bordoli and Schwede2012; Haas and Schwede, Reference Haas and Schwede2013; Haas et al., Reference Haas2013); and PDB-development (PDB-Dev) is the prototype system for archiving I/H models (Vallat et al., Reference Vallat, Webb, Westbrook, Sali and Berman2018; Burley et al., Reference Burley2017). The outer circle consists of experimental data repositories that contribute to structural biology. Only a limited set of experimental data archives have been identified at present and many others may be included as the field evolves and the respective research communities build their own repositories.
Following the recommendations of the I/HTF, a preliminary dictionary has been created to address the flexible data representation required to describe I/H results (Berman et al., Reference Berman2016; Vallat et al., Reference Vallat2017, Reference Vallat, Webb, Westbrook, Sali and Berman2018). This dictionary is a modular extension of the PDBx/mmCIF dictionary (Fitzgerald et al., Reference Fitzgerald, Hall and McMahon2005) used by the PDB archive and contains data definitions necessary to describe the details of I/H models, associated spatial restraints and modeling protocols. The newly developed I/H methods extension dictionary provides the fundamental data specifications required for archiving I/H models. Based on this dictionary extension, a prototype pipeline called PDB-Development (PDB-Dev; pdb-dev.wwpdb.org) has been built to enable testing and development of deposition and archiving for I/H structural models (Burley et al., Reference Burley2017; Vallat et al., Reference Vallat, Webb, Westbrook, Sali and Berman2018). Fifteen I/H models obtained using different modeling software such as the Integrative Modeling Platform (IMP) (Russel et al., Reference Russel2012), Rosetta (Leaver-Fay et al., Reference Leaver-Fay2011), HADDOCK (Dominguez et al., Reference Dominguez, Boelens and Bonvin2003), TADbit (Serra et al., Reference Serra2017) and XPLOR-NIH (Schwieters et al., Reference Schwieters, Bermejo and Clore2018) have been deposited into PDB-Dev in a format compliant with the I/H methods dictionary. These include the Nup84 sub-complex of the nuclear pore complex (Shi et al., Reference Shi2014), the exosome complex (Shi et al., Reference Shi2015), the mediator complex (Robinson et al., Reference Robinson2015), lysine-linked Diubiquitin complex (Liu et al., Reference Liu2018), structures of the human serum albumin domains in their native environment (Belsom et al., Reference Belsom2016), the chromatin model of the first 4·5Mb of chromosome 2L from Drosophila Melanogaster (Trussart et al., Reference Trussart2015) and the ribosomal RNA small subunit methyltransferase A complexed with 16S ribosomal RNA (van Zundert et al., Reference Van Zundert, Melquiond and Bonvin2015). These structures are now publicly available from the PDB-Dev website (Vallat et al., Reference Vallat, Webb, Westbrook, Sali and Berman2018; Burley et al., Reference Burley2017) and can be downloaded and visualized using the ChimeraX software (Goddard et al., Reference Goddard2018) (Fig. 10).
The lessons learned from creating and maintaining the PDB archive are informing the process of developing the PDB-Dev system for archiving I/H structures. To adapt to the evolving needs of the scientific community, many important tasks have been accomplished: consulting with the community to determine requirements, carefully creating standard dictionary definitions and making sure that those dictionary standards are extensible. Once the PDB-Dev system is fully developed, it will be straightforward to include structures derived from I/H methods in the PDB archive, thus making the rich content from structures of complex macromolecular machines available to PDB users.
Conclusion
In this review, we describe the interplay among science, technology and community in creating data resources. The way in which the PDB developed in many ways follows the principles set forth by Elinor Ostrom for the management of natural resources (Ostrom, Reference Ostrom1990). Those principles emphasize that bottom-up collective action can work better than top-down enforcement. Although building a community resource in this way can take much longer, the involvement of the various stakeholders in meaningful ways can better ensure its sustainability.
Domain repositories such as the PDB are key to the conduct of science and development of scientific knowledge. Preserving the data and making it freely available enables reproducibility and the ability to build on previous work to carry out new research. Structural biologists were early adopters of the concept of archiving as being an integral part of the research and publication life cycle. Not only has the availability of data helped enable further discoveries in the field, but it also has allowed computational biologists to analyze the entire corpus of data to understand the underlying principles that govern protein folding and interactions; it is impossible to imagine structural bioinformatics without the PDB. The PDB thus provides a compelling roadmap that could be applied to all of science.
Acknowledgements
We thank the wwPDB data center members, the EMDataBank group and the SBKB partners, with special thanks to Stephen Burley and Wah Chiu for their leadership of the PDB and EM projects and John Westbrook for his vision with respect to the mmCIF effort. This work has been supported by grants to the RCSB PDB from NSF, NIH and DOE (DBI-1338415), SBKB (U01 GM093324), EMDataBank (R01 GM079429), I/H methods (NSF EAGER award DBI-1519158), and the Enabling Data Science in Biology BD2K curriculum development project (R25 LM012286).


