


I. INTRODUCTION
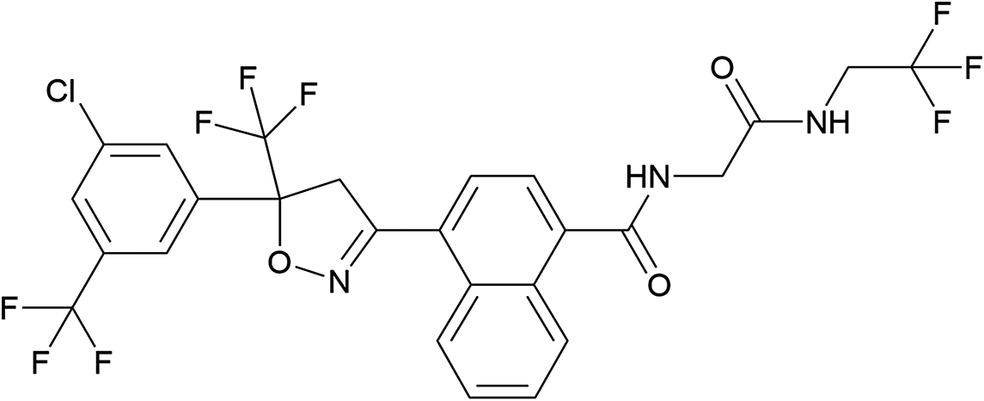
Afoxolaner is an insecticide and is the active ingredient in veterinary products, including NexGard®. Afoxolaner is used for the treatment and prevention of flea infestations, as well as Lyme disease, particularly for dogs. The systematic name (CAS Registry Number 1093861-60-9) is 4-[5-[3-chloro-5-(trifluoromethyl)phenyl]-4,5-dihydro-5-(trifluoromethyl)-3-isoxazolyl]-N-[2-oxo-2-[(2,2,2-trifluoroethyl)amino]ethyl]-1-naphthalenecarboxamide. A two-dimensional molecular diagram of afoxolaner is shown in Figure 1.
The two-dimensional structure of afoxolaner.

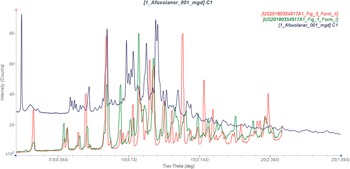
Crystalline Form I and Form II, and the corresponding powder diffraction data, of (S)-afoxolaner are claimed in U.S. Patent Application 2018/0354917 A1 (Gorter de Vries et al., Reference Gorter de Vries, Ballion, Lafont, de Saint Michel and Kozlovic2018; Merial Inc.) and the issued patent US 11130739 B2 (Gorter de Vries et al., Reference Gorter de Vries, Ballion, Lafont, de Saint Michel and Kozlovic2021; Boehringer Ingelheim Animal Health USA, Inc.). A synchrotron powder diffraction, from this study, of commercial afoxolaner did not correspond to those of Form I or Form II (Figure 2).
Comparison of the synchrotron pattern of afoxolaner (black) from this study to those of Form I (green) and Form II (red) reported by Gorter de Vries et al. (Reference Gorter de Vries, Ballion, Lafont, de Saint Michel and Kozlovic2018, Reference Gorter de Vries, Ballion, Lafont, de Saint Michel and Kozlovic2021). The patent patterns (measured using Cu Kα radiation) were digitized using UN-SCAN-IT (Silk Scientific, 2013) and converted to the synchrotron wavelength of 0.819563(2) Å using JADE Pro (MDI, 2024). Image generated using JADE Pro (MDI, 2024).

This work was carried out as part of a project (Kaduk et al., Reference Kaduk, Crowder, Zhong, Fawcett and Suchomel2014) to determine the crystal structures of large-volume commercial pharmaceuticals and include high-quality powder diffraction data for them in the Powder Diffraction File (Kabekkodu et al., Reference Kabekkodu, Dosen and Blanton2024).
II. EXPERIMENTAL
Afoxolaner was a commercial reagent, purchased from TargetMol (Batch #T13536), and was used as received. The white powder was packed into a 0.5-mm-diameter Kapton capillary and rotated during the measurement at ~2 Hz. The powder pattern was measured at 298(1) K at the Wiggler Low Energy Beamline (Leontowich et al., Reference Leontowich, Gomez, Diaz Moreno, Muir, Spasyuk, King, Reid, Kim and Kycia2021) of the Brockhouse X-ray Diffraction and Scattering Sector of the Canadian Light Source using a wavelength of 0.819563(2) Å (15.1 keV) from 1.6 to 75.0° 2θ, with a step size of 0.0025° and a collection time of 3 minutes. The high-resolution powder diffraction data were collected using eight Dectris Mythen2 X series 1K linear strip detectors. NIST SRM 660b LaB6 was used to calibrate the instrument and refine the monochromatic wavelength used in the experiment. The peak/background ratio of this pattern is relatively low, resulting from low peak intensities.
The pattern was indexed using DICVOL14 (Louër and Boultif, Reference Louër and Boultif2014) on a primitive monoclinic unit cell with a = 9.6062, b = 14.0252, c = 39.3961 Å, β = 94.782°, V = 5,289.32 Å3, and Z = 8. The space group suggested by EXPO2014 (Altomare et al., Reference Altomare, Cuocci, Giacovazzo, Moliterni, Rizzi, Corriero and Falcicchio2013) was P21/a, which was confirmed by the successful solution and refinement of the structure. A reduced cell search of the Cambridge Structural Database (Groom et al., Reference Groom, Bruno, Lightfoot and Ward2016) yielded four hits, but no structures of afoxolaner or its derivatives. The centrosymmetric space group indicated that our sample was a racemate, consistent with the pattern not matching the known forms of (S)-afoxolaner.
The structure of the afoxolaner molecule was downloaded from PubChem (Kim et al., Reference Kim, Chen, Cheng, Gindulyte, He, He and Li2023) as Conformer3D_COMPOUND_CID_25154249.sdf. It was converted to a *.mol2 file using Mercury (Macrae et al., Reference Macrae, Sovago, Cottrell, Galek, McCabe, Pidcock and Platings2020). The structure was solved by Monte Carlo-simulated annealing techniques as implemented in EXPO2014 (Altomare et al., Reference Altomare, Cuocci, Giacovazzo, Moliterni, Rizzi, Corriero and Falcicchio2013), using two molecules as fragments and incorporating a bump penalty.
Rietveld refinement, starting from the VASP-optimized structure, was carried out with GSAS-II (Toby and Von Dreele, Reference Toby and Von Dreele2013). Only the 2.0–40.0° portion of the pattern was included in the refinements (d min = 1.198 Å). The region 2.6–3.4°, which contains a peak from the Kapton capillary, was excluded. All non-H-bond distances and angles were subjected to restraints, based on a Mercury/Mogul Geometry Check (Bruno et al., Reference Bruno, Cole, Kessler, Luo, Motherwell, Purkis and Smith2004; Sykes et al., Reference Sykes, McCabe, Allen, Battle, Bruno and Wood2011). The Mogul average and standard deviation for each quantity were used as the restraint parameters. The benzene and naphthalene ring systems were restrained to be planar. The restraints contributed 11.6% to the overall χ 2. The hydrogen atoms were included in calculated positions, which were recalculated during the refinement using Materials Studio (Dassault Systèmes, 2023). Attempts to refine the displacement coefficients in such a complex structure with limited data led to unreasonable U iso values (both positive and negative), so the U iso values were fixed at reasonable values. The peak profiles were described using a generalized microstrain model (Stephens, Reference Stephens1999). A second-order spherical harmonic model was included for preferred orientation. The background was modeled using a six-term shifted Chebyshev polynomial, with a peak at 11.26° to model the scattering from the Kapton capillary and any amorphous component of the sample.
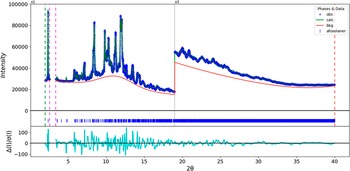
The final refinement of 267 variables using 14,881 observations and 234 restraints yielded the residual R wp = 0.04118. The largest peak (1.04 Å from F64) and hole (1.77 Å from C24) in the difference Fourier map were 0.15(4) and −0.16(4) eÅ−3, respectively. The final Rietveld plot is shown in Figure 3. The largest features in the normalized error plot are evenly distributed among shapes, intensities, and positions.
The Rietveld plot for afoxolaner. The blue crosses represent the observed data points, and the green line is the calculated pattern. The cyan curve is the normalized error plot, and the red line is the background curve. The vertical dashed magenta lines indicate the excluded region from 2.6 to 3.4̊. The blue tick marks indicate the afoxolaner peak positions. The vertical scale has been multiplied by a factor of 3× for 2θ > 19.0̊.

The crystal structure of afoxolaner was optimized (fixed experimental unit cell) with density functional theory techniques using VASP (Kresse and Furthmüller, Reference Kresse and Furthmüller1996) through the MedeA graphical interface (Materials Design, 2024). The calculation was carried out on 32 cores of a 144-core (768 GB memory) HPE Superdome Flex 280 Linux server at North Central College. The calculation used the GGA-PBE functional, a plane wave cutoff energy of 400.0 eV, and a k-point spacing of 0.5 Å−1, leading to a 1 × 1 × 2 mesh, and took ~23.2 days. Single-point density functional calculations (fixed experimental cell) and population analysis were carried out using CRYSTAL23 (Erba et al., Reference Erba, Desmarais, Casassa, Civalleri, Donà, Bush and Searle2023). The basis sets for the H, C, N, and O atoms in the calculation were those of Gatti et al. (Reference Gatti, Saunders and Roetti1994), and those for F and Cl were those of Peintinger et al. (Reference Peintinger, Vilela Oliveira and Bredow2013). The calculations were run on a 3.5 GHz PC using eight k-points and the B3LYP functional, and took ∼11.6 hours.
III. RESULTS AND DISCUSSION
The commercial sample of afoxolaner studied here did not correspond to Form I or Form II of (S)-afoxolaner, as the commercial sample is a racemate. The difference may not be significant for many analytical applications, but it would be crucial for pharmaceutical uses. It is thus unclear how relevant this structure is for materials in actual use.
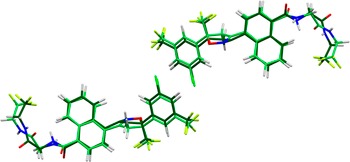
The root-mean-square (rms) difference of the non-H atoms in the two optimized structures, calculated using the Mercury CSD-Materials/Search/Crystal Packing Similarity tool, is 0.454 Å (Figure 4). The main differences are in the conformations of the side chains. The rms Cartesian displacements of the non-H atoms in the optimized structures of molecule 1 and molecule 2, calculated using the Mercury Calculate/Molecule Overlay tool, are 0.799 and 0.583 Å (Figures 5 and 6). The main differences are in the side chains, but they are spread throughout the molecules. The agreements are outside the normal range for correct structures (van de Streek and Neumann, Reference van de Streek and Neumann2014). The broad peaks and limited data range probably mean that the refined structure is less reliable than usual. The refined structure has a close contact between H27 and F64. The asymmetric unit is illustrated in Figure 7. The remaining discussion will emphasize the VASP-optimized structure.
Comparison of the refined structure of afoxolaner (colored by atom type) to the VASP-optimized structure (light green). The comparison was generated by the Mercury CSD-Materials/Search/Crystal Packing Similarity tool; the root-mean-square displacement is 0.454 Å. Image generated using Mercury (Macrae et al., Reference Macrae, Sovago, Cottrell, Galek, McCabe, Pidcock and Platings2020).

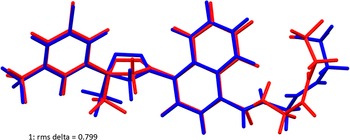
Comparison of the refined structure of afoxolaner molecule 1 (red) to the VASP-optimized structure (blue). The comparison was generated using the Mercury Calculate/Molecule Overlay tool; the root-mean-square difference is 0.799 Å. Image generated using Mercury (Macrae et al., Reference Macrae, Sovago, Cottrell, Galek, McCabe, Pidcock and Platings2020).

Comparison of the refined structure of afoxolaner molecule 2 (red) to the VASP-optimized structure (blue). The comparison was generated using the Mercury Calculate/Molecule Overlay tool; the root-mean-square difference is 0.583 Å. Image generated using Mercury (Macrae et al., Reference Macrae, Sovago, Cottrell, Galek, McCabe, Pidcock and Platings2020).

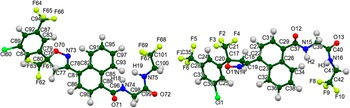
The asymmetric unit of afoxolaner, with the atom numbering. The atoms are represented by 50% probability spheroids. Image generated using Mercury (Macrae et al., Reference Macrae, Sovago, Cottrell, Galek, McCabe, Pidcock and Platings2020).

All of the bond distances and bond angles, and most of the torsion angles, fall within the normal ranges indicated by a Mercury Mogul Geometry check (Macrae et al., Reference Macrae, Sovago, Cottrell, Galek, McCabe, Pidcock and Platings2020). Torsion angles involving rotation about the C17–C20, C39–C40, C78–C81, and C100–C101 bonds lie on the tails of distributions, so are slightly unusual. Torsion angles involving the C19–C22 bond, which describe the relative orientation of the isoxazole and naphthalene ring systems in molecule 1, are unusual. Torsion angles involving rotation about the C76–C79 bond, which describe the relative orientation of the phenyl and isoxazole rings in molecule 2, are also unusual.
Quantum chemical geometry optimization of isolated afoxolaner molecules (DFT/B3LYP/6-31G*/water) using Spartan’24 (Wavefunction, 2023) indicated that molecule 1 is only 1.6 kcal/mol lower in energy than molecule 2, even though they have different conformations (Figure 8); the rms displacement is 2.166 Å. The global minimum-energy conformation is 3.9 kcal/mol lower in energy than molecule 1 and has a very different conformation. The afoxolaner molecule is thus apparently flexible, and intermolecular interactions are important in determining the solid-state conformation.
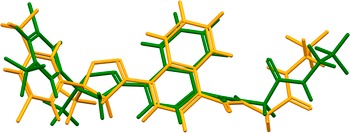
Comparison of molecule 1 (green) and molecule 2 (orange) of afoxolaner. The root-mean-square difference is 2.166 Å. Image generated using Mercury (Macrae et al., Reference Macrae, Sovago, Cottrell, Galek, McCabe, Pidcock and Platings2020).

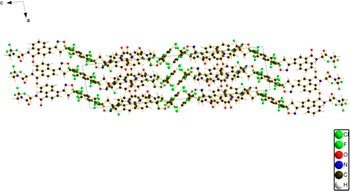
The crystal structure (Figure 9) consists of layers of molecules parallel to the ab-plane. The boundaries of the layers are rich in halogens. Within the layers, there is parallel stacking of rings along both the a- and b-axes. The mean planes of the phenyl, isoxazole, and naphthalene rings in molecule 1 are approximately (−1, 0, −2), (0, 2, −1), and (−5, 5, 1), and in molecule 2, the planes are approximately (1, 0, −3). (0, 1, 0), and (−3, 3, −4). The Mercury Aromatics Analyser indicates a strong interaction (distance = 4.79 Å) between the naphthalene rings of molecules 1 and 2. Also present are moderate interactions between the phenyl rings of two molecules 1 (d = 5.17 Å) and between naphthalene rings (d = 4.98, 6.08, 6.28, and 6.39 Å).
The crystal structure of afoxolaner, viewed down the b-axis. Image generated using Diamond (Crystal Impact, 2023).

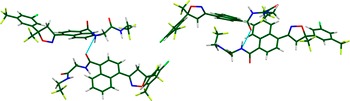
The two classical N–H···O hydrogen bonds (Table I) link molecules 1 and 2 into dimers (Figure 10). The energies of the N–H···O hydrogen bonds were calculated using the correlation of Wheatley and Kaduk (Reference Wheatley and Kaduk2019). A variety of intra- and inter-molecular C–H···O, C–H···N, and C–H···C hydrogen bonds also contribute to the lattice energy. No C–H⋅⋅⋅F hydrogen bonds were detected.
Hydrogen bonds (CRYSTAL23) in racemic afoxolaner.

* Intramolecular.
The two different hydrogen-bonded dimers in the structure of afoxolaner. The cyan dotted lines indicate the hydrogen bonds. Image generated using Mercury (Macrae et al., Reference Macrae, Sovago, Cottrell, Galek, McCabe, Pidcock and Platings2020).

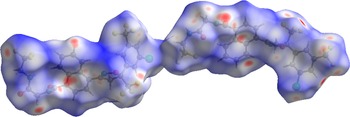
The volume enclosed by the Hirshfeld surface of afoxolaner (Figure 11; Hirshfeld, Reference Hirshfeld1977; Spackman et al., Reference Spackman, Turner, McKinnon, Wolff, Grimwood, Jayatilaka and Spackman2021) is 1,307.67 Å3, 98.79% of one-fourth of the unit cell volume. The packing density is thus typical. The only significant close contacts (red in Figure 11) involve the hydrogen bonds. The volume/non-hydrogen atom is slightly smaller than usual at 15.8 Å3.
The Hirshfeld surface of afoxolaner. Intermolecular contacts longer than the sums of the van der Waals radii are colored blue, and contacts shorter than the sums of the radii are colored red. Contacts equal to the sums of radii are white. Image generated using CrystalExplorer (Spackman et al., Reference Spackman, Turner, McKinnon, Wolff, Grimwood, Jayatilaka and Spackman2021).

The Bravais–Friedel–Donnay–Harker (Bravais, Reference Bravais1866; Friedel, Reference Friedel1907; Donnay and Harker, Reference Donnay and Harker1937) algorithm suggests that we might expect platy morphology for afoxolaner, with {001} as the major faces, as expected from the anisotropy of the lattice parameters. A second-order spherical harmonic model was included in the refinement. The texture index was 1.062(36), indicating that the preferred orientation was significant in this rotated capillary specimen.
DEPOSITED DATA
The powder pattern of racemic afoxolaner from this synchrotron dataset has been submitted to the International Centre for Diffraction Data (ICDD) for inclusion in the Powder Diffraction File. The Crystallographic Information Framework (CIF) files containing the results of the Rietveld refinement (including the raw data) and the DFT geometry optimization were deposited with the ICDD. The data can be requested at pdj@icdd.com.
ACKNOWLEDGEMENTS
We thank Adam Leontowich for his assistance in the data collection. We also thank the ICDD team – Megan Rost, Steve Trimble, and Dave Bohnenberger – for their contribution to research, sample preparation, and in-house XRD data collection and verification.
FUNDING STATEMENT
Part of the research described in this paper was performed at the Canadian Light Source, a national research facility of the University of Saskatchewan, which is supported by the Canada Foundation for Innovation (CFI), the Natural Sciences and Engineering Research Council (NSERC), the Canadian Institute of Health Research (CIHR), the Government of Saskatchewan, and the University of Saskatchewan. This work was partially supported by the International Centre for Diffraction Data.
COMPETING INTERESTS
The authors have no competing interests to declare.


 Open access