1 INTRODUCTION
Type I supernovae (SNe I) are characterised by the lack of prominent hydrogen lines in the spectra (e.g., Filippenko Reference Filippenko1997). Strong helium lines are present in the spectra of SNe Ib, while they are practically absent in those of SNe Ic. SNe Ib/c are further distinguished from SNe Ia by the lack of strong Si ii absorption line at 6355 Å. Most of ordinary SNe Ib/c, if not all, occur in star-forming galaxies, indicating that SNe Ib/c have a massive star origin (e.g., van den Berg, Li, & Filippenko Reference van den Berg, Li and Filippenko2005; Boissier & Prantzos Reference Boissier and Prantozs2009; Hakobyan et al. Reference Hakobyan, Mamon, Petrosian, Kunth and Turatto2009; Kelly & Kirshner Reference Kelly and Kirshner2012; Anderson et al. Reference Anderson, Habergham, James and Hamuy2012; Sander, Hamann, & Todt Reference Sander, Hamann and Todt2012). Their light curves are dominated by the energy release from radioactive 56Ni as in the case of SNe Ia (Schaeffer, Casse, & Cahen Reference Schaeffer, Casse and Cahen1987), but the inferred amounts of 56Ni ejected by SNe Ib/c are similar, on average, to those of SNe II (M 56Ni ~ 0.1M⊙; e.g., Drout et al. Reference Drout2011; Cano Reference Cano2013; Lyman et al. Reference Lyman2014; Taddia et al. Reference Taddia2014) rather than SNe Ia (M 56Ni ~ 1.0M⊙; e.g., Stritzinger et al. Reference Stritzinger, Leibundgut, Walch and Contardo2006; Mazzali et al. Reference Mazzali, Röpke, Benetti and Hillebrandt2007; Scalzo, Ruiter, & Sim Reference Scalzo, Ruiter and Sim2014). The current consensus is that most of SNe Ib/c belong to a subset of core-collapse SNe that are SN explosions via collapse of the iron cores in massive stars at their deaths.
Hydrogen cannot be easily hidden in SN spectra (e.g., Elmhamdi et al. Reference Elmhamdi, Danziger, Branch, Leibundgut, Baron and Kirchner2006; Spencer & Baron Reference Spencer and Baron2010; Dessart et al. Reference Dessart, Hillier, Livne, Yoon, Woosley, Waldman and Langer2011; Hachinger et al. Reference Hachinger, Mazzaili, Taubenberger, Hillebrandt, Nomoto and Sauer2012) and SN Ib/c progenitors must have lost their hydrogen envelopes by the time of explosion. There exist mainly three possible ways for massive stars to become a hydrogen-deficient SN progenitor: mass loss from single stars via stellar winds (e.g., Chiosi & Maeder Reference Chiosi and Maeder1986), binary interactions (e.g., Podsiadlowski, Joss, & Hsu Reference Podsiadlowski, Joss and Hsu1992), and chemically homogeneous evolution with rapid rotation (Maeder & Meynet Reference Maeder and Meynet1987). The last mode of evolution have been invoked for explaining massive blue stragglers and long gamma-ray bursts (GRBs) within the collapsar scenario (Maeder Reference Maeder1987; Langer Reference Langer1992; Yoon & Langer Reference Yoon and Langer2005; Woosley & Heger Reference Woosley and Heger2006; Yoon, Langer & Norman Reference Yoon, Langer and Norman2006; Yoon, Dierks, & Langer Reference Yoon, Dierks and Langer2012a), but is not likely to be much relevant for the majority of SNe Ib/c that are found in the local Universe (Yoon et al. Reference Yoon, Langer and Norman2006).
In this review, we focus on ordinary SNe Ib/c: our objective here is to summarise theoretical results on SN Ib/c progenitors via single and binary evolutionary paths. We emphasise that each case has its own unique prediction that can be in principle well tested by observations. SNe Ib/c can therefore provide an invaluable insight on massive star evolution. Note that we restrict this review to the detailed properties of SNe Ib/c progenitors that are predicted by recent stellar evolution models. Progenitors of SN IIb (i.e., SNe of which the spectra have hydrogen lines at early times, but resemble those of SNe Ib at later times) are closely related to SN Ib/c progenitors, and will also be discussed briefly. Our discussions on observations, SN modelling, and stellar population studies will be highly biased by the selected topics we address here. For more general topics on the evolution of massive stars and SN progenitors, readers are referred to the recent reviews by Maeder & Meynet (Reference Maeder and Meynet2000), Massey (Reference Massey2003), Heger et al. (Reference Heger, Fryer, Woosley, Langer and Hartmann2004), Smartt (Reference Smartt2009), Langer (Reference Langer2012) and Smith (Reference Smith2014).
2 SINGLE STAR MODELS
2.1. Mass loss and final mass
It has been widely believed that Wolf–Rayet (WR) stars are observational counterparts of SNe Ib/c progenitors (e.g., Meynet & Maeder Reference Meynet and Maeder2003; Massey Reference Massey2003; Crowther Reference Crowther2007; Smartt Reference Smartt2009). Although helium stars as WR stars can be produced by binary interactions (e.g., Petrovic, Langer, & van der Hucht Reference Petrovic, Langer and van der Hucht2005a; Vanbeveren, Van Bever, & Belkus Reference Vanbeveren, Van Bever and Belkus2007), a large fraction of WR stars are found in isolation (van der Hucht Reference van der Hucht2001; Crowther Reference Crowther2007), and must have been produced from massive single starsFootnote 1 via mass loss due to stellar winds (the so-called Conti scenario; Conti Reference Conti1976).
Evolutionary models of massive stars with mass loss predict that there exists an initial mass limit for WR stars, above which stars can lose the entire hydrogen envelope during the post-main-sequence phases (e.g., Maeder & Meynet Reference Maeder and Meynet1987; Schaller et al. Reference Schaller, Schaerer, Meynet and Maeder1992; Vanbeveren, De Loore, & Van Rensbergern Reference Vanbeveren, De Loore and Van Rensbergern1998; Meynet & Maeder Reference Meynet and Maeder2003; Eldridge & Vink Reference Eldridge and Vink2006; Georgy et al. Reference Georgy, Ekström, Meynet, Massey, Levesque, Hirschi, Eggenberger and Maeder2012. A useful constraint on this mass limit can be provided by galactic WR stars. Observations indicate that WR stars of WN type in our Galaxy have the lower bolometric luminosity limit of logL/L⊙ ≃ 5.3 (Hamann, Gräfener, & Liermann Reference Hamann, Gräfener and Liermann2006). This roughly corresponds to 10 M⊙ of a naked helium star, which requires an initial mass of about 25 M⊙. Stellar evolution models indicate that non-rotating stars at solar metallicity cannot lose their hydrogen envelope to become a WR star if M ZAMS < 40 M⊙, with the most commonly adopted mass-loss rate from red supergiant stars given by de Jager, Nieuwenhuijzen, & van der Hucht (Reference de Jager, Nieuwenhuijzen and van der Hucht1988). Enhancement of mass loss due to rotation or pulsation compared to the de Jager rate and some alternative empirical mass-loss prescriptions have been invoked to resolve this discrepancy (e.g., Vanbeveren et al. Reference Vanbeveren, De Loore and Van Rensbergern1998; Salasnich, Bressan, & Chiosi Reference Salasnich, Bressan and Chiosi1999; Meynet & Maeder Reference Meynet and Maeder2003; van Loon et al. Reference van Loon, Cioni, Zijlstra and Loup2005, Reference van Loon2008; Yoon & Cantiello Reference Yoon and Cantiello2010; Ekström et al. Reference Ekström2012).
Once a star becomes a WR star, further mass loss due to WR winds determines its final mass. In the 80s and 90s, a fixed value of about 3–8 × 10⁻⁵M⊙yr−1 or mass-dependent values have been widely used for the WR mass-loss rate in most evolutionary models (Maeder & Meynet Reference Maeder and Meynet1987; Langer Reference Langer1989b; Schaller et al. Reference Schaller, Schaerer, Meynet and Maeder1992; Schaerer et al. Reference Schaerer, Charbonnel, Meynet, Maeder and Schaller1993a, Reference Schaerer, Meynet, Maeder and Schaller1993b; Meynet et al. Reference Meynet, Maeder, Schaller, Schaerer and Charbonnel1994; Woosley, Langer, & Weaver Reference Woosley, Langer and Weaver1993, Reference Woosley, Langer and Weaver1995). Later studies began to consider the WR mass-loss rate as a function of the luminosity and the surface abundances of helium and metals in a more explicit way (e.g., Wellstein & Langer Reference Wellstein and Langer1999; Meynet & Maeder Reference Meynet and Maeder2003, Reference Meynet and Maeder2005; Eldridge & Vink Reference Eldridge and Vink2006; Georgy et al. Reference Georgy, Ekström, Meynet, Massey, Levesque, Hirschi, Eggenberger and Maeder2012). More important, with the growing evidence for hydrodynamic clumping of WR wind material, recent estimates for the WR mass-loss rate give significantly lower values than previously thought (e.g., see Figure 1; Nugis & Lamers Reference Nugis and Lamers2000; Hamann et al. Reference Hamann, Gräfener and Liermann2006; Crowther Reference Crowther2007; Sander et al. Reference Sander, Hamann and Todt2012). Several different prescriptions for the WR mass-loss rate are compared in Figure 1.
Comparison of different mass-loss prescriptions of massive helium stars on the zero-age helium main sequence as a function of the surface luminosity, which are based on WR stars (logL/L⊙ > 4.5). The dot–dashed line and the dotted line give the WR mass-loss rates by Nugis & Lamers (Reference Nugis and Lamers2000) and Langer (Reference Langer1989b), respectively. The solid line denotes the mass-loss rate prescription given by Equation (1): the WR mass-loss rate by Hamann, Koesterke, & Wessolowski (Reference Hamann, Koesterke and Wessolowski1995) for logL/L⊙ ⩾ 4.5 and the mass-loss rate of relatively low-mass helium stars for logL/L⊙ < 4.5, which is based on the extreme helium stars analysed by Hamann, Schoenberner, & Heber (Reference Hamann, Schoenberner and Heber1982). The blue data points with the error bars are the mass-loss rates of these extreme helium stars. The orange point with the error bars denotes the mass-loss rate of the quasi-WR star HD 45166 (van Blerkom Reference van Blerkom1978; Groh, Oliveira, & Steiner Reference Groh, Oliveira and Steiner2008). The dashed line is 10 times lower than the solid line: f w is the reduction factor compared to the mass-loss rate given by Equation (1).

The single star models produced later than 2 000 predict systematically higher final masses of SN Ib/c progenitors than those in the 80s and 90s, as summarised in Figure 2. For example, with Langer’s mass-dependent WR mass-loss rate (Langer Reference Langer1989b), a 60-M⊙ star at solar metallicity can become an SN Ib/c progenitor with an final mass as low as 4.25 M⊙ (Woosley et al. Reference Woosley, Langer and Weaver1993). By contrast the models with the WR mass-loss rate of Nugis & Lamers (Reference Nugis and Lamers2000) give final masses higher than 10 M⊙, at solar metallicity.
Theoretical predictions on the final mass of single star progenitors for SNe Ib/c, as a function of the initial mass (i.e., mass on the zero-age main sequence). Circle: rotating models of Georgy et al. (Reference Georgy, Ekström, Meynet, Massey, Levesque, Hirschi, Eggenberger and Maeder2012) at Z = 0.014, Asterisk: rotating models of Meynet & Maeder (Reference Meynet and Maeder2003) at Z = 0.02, Star: rotating models of Meynet & Maeder (Reference Meynet and Maeder2005) at Z = 0.04 with a metallicity-dependent WR mass-loss rate. Triangle: non-rotating models of Woosley et al. (Reference Woosley, Langer and Weaver1993) at Z = 0.02, Square: non-rotating models of Schaller et al. (Reference Schaller, Schaerer, Meynet and Maeder1992) at Z = 0.02.
This high final mass (M f > 10 M⊙) has consequences on the SN explosion. First of all, such massive helium stars have large amounts of binding energy. This would make successful explosion of these progenitors difficult: they may collapse to a black hole, without making an ordinary SN Ib/c (e.g., Heger et al. Reference Heger, Fryer, Woosley, Langer and Hartmann2004, and references therein). Secondly, even if they exploded successfully, the resultant light curves would be too broad to be compatible with observations (Woosley et al. Reference Woosley, Langer and Weaver1993, Reference Woosley, Langer and Weaver1995; Dessart et al. Reference Dessart, Hillier, Livne, Yoon, Woosley, Waldman and Langer2011; Drout et al. Reference Drout2011; Cano Reference Cano2013; Lyman et al. Reference Lyman2014; Taddia et al. Reference Taddia2014). This brings into question the importance of single WR stars as progenitors of SNe Ib/c at solar metallicity. However, the role of single stars at super-solar metallicity may be significant given their relatively low final masses (Figure 2).
2.2. Surface properties
WR stars have large convective cores, being close to the Eddington limit, and rapidly lose the outer helium-rich layers by WR winds. This makes them almost chemically homogeneous. Therefore, stellar evolution models predict that WR stars evolve systematically bluewards on the HR diagram (e.g., Georgy et al. Reference Georgy, Ekström, Meynet, Massey, Levesque, Hirschi, Eggenberger and Maeder2012; Yoon et al. Reference Yoon, Gräfener, Vink, Kozyreva and Izzard2012b; Eldridge et al. Reference Eldridge, Fraser, Smartt, Mound and Crockett2013), in contrast to the case of the evolution of hydrogen-rich stars which evolve redwards in general. The surface composition of chemical elements also evolves. First, as the residual of the hydrogen envelope is removed by winds, they evolve from WNL type to WN type. As they lose more mass, the products of helium burning including carbon and oxygen begin to appear at the surface, to become WC and WO stars (Figure 3). The general consensus is that WR stars from sufficiently high initial masses evolve according to the following order: WNL → WN → WC → WO.Footnote 2
Evolution of the chemical composition at the surface of a 30-M⊙ helium star at Z = 0.02, with the WR mass-loss rate by Nugis & Lamers (Reference Nugis and Lamers2000). The calculation was terminated at the end of core neon burning.
In this scenario, WR stars should become more compact as they evolve from WNL to WO. Indeed, WNL and WO stars in our galaxy have lowest and highest surface temperatures, respectively, in agreement with the theoretical prediction (Hamann et al. Reference Hamann, Gräfener and Liermann2006; Sander et al. Reference Sander, Hamann and Todt2012). But stellar evolution models have great difficulty in explaining many of the surface properties of WR stars. In particular, the observed WR stars are found to have much larger radii and lower surface temperatures than what the evolutionary models predict (e.g., Hamann et al. Reference Hamann, Gräfener and Liermann2006; Crowther Reference Crowther2007; Sander et al. Reference Sander, Hamann and Todt2012). The reason for this discrepancy is not well understood yet. Inflation of the envelope with a density inversion is observed in WR star models near the Eddington limit in hydrostatic equilibrium (Ishii, Ueno, & Kato Reference Ishii, Ueno and Kato1999; Petrovic, Pols, & Langer Reference Petrovic, Pols and Langer2006), but this is still not sufficient to fit observations as seen in Figure 4. A recent suggestion is that the observationally implied inflation of WR stars may result from density inhomogeneities and the consequent enhancement of opacity in the sub-surface convective layer (Gräfener, Owocki, & Vink Reference Gräfener, Owocki and Vink2012).
Evolution of massive helium stars at solar metallicity compared to the observed Wolf–Rayet stars in our galaxy on the Hertzsprung–Russel diagram. The WR mass-loss rate prescription by Nugis & Lamers (Reference Nugis and Lamers2000) was adopted in the evolutionary models. The initial mass for each evolutionary track is marked by the label in the left-hand side, and the final mass is indicated in the parenthesis. The thick grey lines mark the evolutionary stage where the surface mass-fraction of carbon is higher than 0.2. The star symbol denotes the end point of the evolution, which is the end of core neon burning. This figure is a reproduction of Figure 3 in Yoon et al. (Reference Yoon, Gräfener, Vink, Kozyreva and Izzard2012b) with permission from Astronomy & Astrophysics, © ESO.
This envelope inflation affects the bolometric correction, making WR stars fairly luminous in the optical (M V ≲ −4). If the optical luminosities of the observed WR stars represented those of SN Ib/c progenitors at the pre-SN stage, the previous search for an SN Ib/c progenitor in pre-SN images would have been successful (Maund & Smartt Reference Maund and Smartt2005; Maund, Smartt, & Schweizer Reference Maund, Smartt and Schweizer2005; Crockett et al. Reference Crockett2007; Smartt Reference Smartt2009; Eldridge et al. Reference Eldridge, Fraser, Smartt, Mound and Crockett2013). As of today, only one tentative identification has been reported with the SN Ib iPTF13bvn (Cao et al. Reference Cao2013). All of the other searches for SN Ib/c progenitors have failed, even for the case with a very deep detection limit (M V ≳ −4.3; Crockett et al. Reference Crockett2007; Eldridge et al. Reference Eldridge, Fraser, Smartt, Mound and Crockett2013). This result has often been interpreted as evidence for binary star progenitors (Crockett et al. Reference Crockett2007; Smartt Reference Smartt2009).
It should be noted that the majority of the observed WR stars must be on the helium main sequence, which is still far from the final evolutionary stage. After core helium exhaustion, the evolution of the core in a WR star is dominated by neutrino cooling and undergoes rapid Kelvin–Helmholtz contraction. With a sufficient amount of helium in the envelope, this would lead to further expansion of the helium envelope due to the so-called mirror effect. However, single WR stars would rapidly lose helium in the envelope as implied by the high mass-loss rate, and the overall radius would gradually decrease as the stellar evolution models predict. At the pre-SN stage, many WR stars would tend to become very hot, and optically faint like WO stars despite their very high bolometric luminosities (Yoon et al. Reference Yoon, Gräfener, Vink, Kozyreva and Izzard2012b). This means that the non-detection of most SN Ib/c progenitors in the previous attempts does not necessarily exclude single WR progenitors, and other constraints like ejecta masses of SNe Ib/c should also be taken into account to better understand the nature of SNe Ib/c progenitors.
2.3. Helium
The production of He i lines is found to depend both on the total He mass (Hachinger et al. Reference Hachinger, Mazzaili, Taubenberger, Hillebrandt, Nomoto and Sauer2012) and on the helium distribution in the envelope (Dessart et al. Reference Dessart, Hillier, Livne, Yoon, Woosley, Waldman and Langer2011, Reference Dessart, Hillier, Li and Woosley2012a). Non-thermal excitation and ionisation of helium also play the key role for the formation of helium lines in SNe Ib (Lucy Reference Lucy1991; Woosley & Eastman Reference Woosley, Eastman, Ruiz-Lapuente, Canal and Isern1997; Dessart et al. Reference Dessart, Hillier, Li and Woosley2012a; Hachinger et al. Reference Hachinger, Mazzaili, Taubenberger, Hillebrandt, Nomoto and Sauer2012). This does not only require presence of helium in the progenitors, but also strong chemical mixing between helium in the envelope and radioactive 56Ni produced in the innermost region of the SN ejecta (Dessart et al. Reference Dessart, Hillier, Li and Woosley2012a; Hachinger et al. Reference Hachinger, Mazzaili, Taubenberger, Hillebrandt, Nomoto and Sauer2012). We still do not know exactly how much helium is needed for SNe Ib. This limit must depend on the degree of mixing of helium and nickel, which may in turn depend on the detailed structure of the progenitor and the energy and asymmetry of the explosion. Many authors simply assume a certain amount of helium (e.g., 0.5–0.6 M⊙) as the lower limit for SN Ib progenitors (e.g., Wellstein & Langer Reference Wellstein and Langer1999; Yoon, Woosley, & Langer Reference Yoon, Woosley and Langer2010; Georgy et al. Reference Georgy, Ekström, Meynet, Massey, Levesque, Hirschi, Eggenberger and Maeder2012). Recently, Hachinger et al. (Reference Hachinger, Mazzaili, Taubenberger, Hillebrandt, Nomoto and Sauer2012) suggested 0.14 M⊙ as the maximum possible amount of helium that can be hidden in the SN spectra, based on a spectroscopic study of several SN Ib/c with relatively low inferred ejecta masses.
In the most recent single star models (Georgy et al. Reference Georgy, Ekström, Meynet, Massey, Levesque, Hirschi, Eggenberger and Maeder2012), the total amounts of helium in SN Ib/c progenitors range from 0.28 to 2.2 M⊙. This is significantly higher than the proposed limit of 0.14 M⊙ by Hachinger et al. In fact, helium mass as low as 0.14 M⊙ is very difficult to achieve with stellar evolution models. Woosley et al. (Reference Woosley, Langer and Weaver1993) found that a 60-M⊙ star can become a 4.25-M⊙ SN Ib/c progenitor with a WR mass-loss rate much higher than nowadays adopted, but even in this extreme case, the remaining helium mass was as large as 0.18 M⊙. The reason for this difficulty is largely related to the dynamical adjustment of the stellar structure of WR stars with mass loss. As shown in Figure 5 as an example, the size of the helium-burning convective core in a WR star decreases as the WR star loses mass by winds (Figure 5), and therefore some amount of helium can remain unburned until the end of core helium burning even if more than half of the initial mass is lost. The residual helium could be completely removed with efficient mass loss during the later evolutionary stages. The current models predict, however, that the effect of mass loss during the post helium burning phases is relatively minor mainly because of the relatively short evolutionary time. We discuss the problem of helium in SNe Ib/c progenitors in Section 3.4 in more detail.
Evolution of the internal structure of a 30-M⊙ helium star, for which the Nugis and Lamers’ WR mass-loss rate was adopted. The helium-burning convective core is marked by the hatched lines. The black solid line marks the surface of the star. The calculation was terminated at the end of core neon burning.
The mass fraction of helium in the outermost layers can also play an important role for the early time light curves and spectra of SNe Ib/c. Dessart et al. (Reference Dessart, Hillier, Livne, Yoon, Woosley, Waldman and Langer2011) showed that if the helium mass fraction is sufficiently large (~ 0.9), He i lines can be produced without the contribution of non-thermal processes for several days after the shock breakout, while no helium lines are seen for a low helium mass fraction (≲ 0.5) even with a total helium mass of about 1 M⊙. Therefore, He i lines during the early epoch of an SN Ib/c will provide an important constraint on the progenitor. Recent single star models in the literature predict that helium mass fraction at the surface of SN Ib/c progenitors is below 0.4 except for a limited initial mass range above the critical mass for WR star progenitors (e.g., Meynet & Maeder Reference Meynet and Maeder2003, Reference Meynet and Maeder2005; Georgy et al. Reference Georgy, Ekström, Meynet, Massey, Levesque, Hirschi, Eggenberger and Maeder2012), in contrast to the case of binary star models that predict the majority of SN Ib/c progenitors have a surface helium mass fraction higher than 0.9 (Section 3.4). Given that the total amount of helium is also systematically smaller in single star models than in binary star models as discussed below, this implies that single star evolution is probably prone to SNe Ic.
2.4. Rotation
Super-luminous supernovae (SLSNe) and very energetic explosions like GRBs can be driven by rapid rotation. The most commonly invoked mechanisms for these events include the collapsar scenario (Woosley et al. Reference Woosley, Langer and Weaver1993; MacFadyen & Woosley Reference MacFadyen and Woosley1999) and the magnetar scenario (e.g., Wheeler et al. Reference Wheeler, Yi, Höflich and Wang2000; Burrows et al. Reference Burrows, Dessart, Livne, Ott and Murphy2007; Kasen & Bildsten Reference Kasen and Bildsten2010; Woosley Reference Woosley2010). So far, all of the supernovae associated with GRBs belong to Type Ic (Woosley & Heger Reference Woosley and Heger2006; Hjorth Reference Hjorth2013), and many SLSNe are also found to be SNe Ic. While the collapsar scenario still remains most popular to explain GRBs (Woosley & Bloom Reference Woosley and Bloom2006), the magnetar-driven explosion is nowadays the most invoked mechanism for the SLSNe Ic (e.g., Chomiuk et al. Reference Chomiuk2011; Dessart et al. Reference Dessart, Hillier, Waldman, Livne and Blondin2012b; Inserra et al. Reference Inserra2013; Nicholl et al. Reference Nicholl2013; Mazzali et al. Reference Mazzali, McFadyen, Woosley, Pian and Tanaka2014). The contending mechanism for SLSNe Ic is the pair-production instability (e.g., Barkat, Rakavy, & Sack Reference Barkat, Rakavy and Sack1967; Gal-Yam Reference Gal-Yam2009; Kozyreva et al. Reference Kozyreva, Blinnikov, Langer and Yoon2014).
It is still a matter of debate which evolutionary channels of SNe Ib/c progenitors can lead to rotation-driven explosions like GRBs and SLSNe-Ic. Observations indicate that the majority of massive stars on the main sequence are rapid rotators, where the necessary condition for both collapsar and magnetar mechanism could be fulfilled if they retained the angular momentum until the pre-collapse stage (e.g., Heger, Langer, & Woosley Reference Heger, Langer and Woosley2000). However, massive stars may undergo angular momentum redistribution via mass loss due to stellar winds and/or binary interactions, and the transport of angular momentum (Maeder & Meynet Reference Maeder and Meynet2000; Heger et al. Reference Heger, Langer and Woosley2000; Hirschi, Meynet, & Maeder Reference Hirschi, Meynet and Maeder2004; Heger, Woosley, & Spruit Reference Heger, Woosley and Spruit2005; Petrovic et al. Reference Petrovic, Langer, Yoon and Hger2005b; Yoon et al. Reference Yoon, Woosley and Langer2010). The angular momentum transfer may occur on a dynamical timescale in convective layers by convection. In radiative layers, rotationally-induced hydrodynamic instabilities like the shear instability and Eddington–Sweet circulations may transport angular momentum (Maeder & Meynet Reference Maeder and Meynet2000). Dynamo actions may also occur in radiative layers according to the so-called Tayler–Spruit dynamo theory (Spruit Reference Spruit2002), which may cause strong magnetic torques across differentially rotating layers.
Theoretical studies indicate that, without magnetic fields, angular momentum transport is severely inhibited by the chemical stratification across the boundary between the stellar core and the hydrogen envelope (μ-barrier; Meynet & Maeder Reference Meynet and Maeder1997; Heger et al. Reference Heger, Langer and Woosley2000). Single star progenitors of SNe Ib/c can thus retain a significant amount of angular momentum until the pre-SN stage, even though most of the initial angular momentum is lost by stellar winds (Heger et al. Reference Heger, Langer and Woosley2000; Hirschi et al. Reference Hirschi, Meynet and Maeder2004): the predicted amounts of angular momentum in the cores are much more than what neutron stars can have at the break-up velocity, and enough to produce a long GRB within the collapsar scenario (Woosley Reference Woosley1993). This means that almost all SN Ib/c progenitors have enough angular momentum to form GRB/SLSN-Ic progenitors. Given that rapid rotation is only one necessary condition for collapsar/magnetar production, this should not necessarily lead to the conclusion that non-magnetic models predict too many GRBs and SLSNe-Ic compared to the observation. However, because such exotic explosions belong to a subset of SNe Ib/c, the result of non-magnetic models implies that GRBs and SLSNe-Ic should occur more frequently at higher metallicity as ordinary SNe Ib/c do, if mass loss by winds provided the main evolutionary path for their progenitors. Contrary to this expectation, observations indicate that low-metallicity is preferred for both GRBs and SLSNe-Ic (e.g., Modjaz et al. Reference Modjaz2008; Graham & Fruchter Reference Graham and Fruchter2013; Lunnan et al. Reference Lunnan2014).
Magnetic torques can easily overcome the hindrance by the chemical stratification to the transport of angular momentum. Magnetic models with the Tayler–Spruit dynamo predict that single WR stars rotate too slowly to produce a magnetar/collapsar (Heger et al. Reference Heger, Woosley and Spruit2005). This is consistent with the fact that GRBs and SLSNe-Ic are very rare. Magnetic models also better explain the spin rates of young millisecond pulsars.
Several authors have questioned the validity of the Talyer–Spruit dynamo theory (Zahn, Brun, & Mathis Reference Zahn, Brun and Mathis2007; Gellert, Rüdiger, & Elstner Reference Gellert, Rüdiger and Elstner2008) and we still cannot draw any solid conclusion on which case between magnetic and non-magnetic models better represents the reality. However, it is not only massive stars but also intermediate- and low-mass stars that provide evidence for very efficient transport of angular momentum in the radiative layers. Such examples include slow rotation of isolated white dwarfs (Suijs et al. Reference Suijs, Langer, Poelarends, Yoon, Heger and Herwig2008), the radial velocity profile in the Sun (Eggenberger, Maeder, & Meynet Reference Eggenberger, Maeder and Meynet2005), and recent asteroseismic results of low-mass stars (Eggenberger, Montalbán, & Miglio Reference Eggenberger, Montalbán and Miglio2012; Cantiello et al. Reference Cantiello, Mankovich, Bildsten, Christensen-Dalsgaard and Paxton2014). Our tentative conclusion is that some strong braking mechanism like the Tayler–Spruit dynamo is actually working in stars, and that magnetic models may better explain recent observations in general. The role of magnetic fields on the evolution of stars still remains a very challenging subject of future study. Some other mechanisms like baroclinic instability (Fujimoto Reference Fujimoto1993) and pulsational instabilities (Townsend & MacDonald Reference Townsend, MacDonald, Bresolin, Crowther and Puls2008) may also play an important role for the transport of angular momentum, but have not been extensively studied for massive stars yet.
3 BINARY STAR MODELS
3.1. Binary evolution towards an SN Ib/c
The majority of massive stars form in binary systems (e.g., see Sana et al. Reference Sana2012, for a recent observational analysis on the population of binary systems). A large fraction of them are believed to experience binary interactions during the course of their evolution, mainly due to the increase of stellar radius. Once the more massive star (the primary star) fills the Roche lobe in a binary system, mass transfer to the less massive star (the secondary star) begins. Mass transfer can be unstable if the mass ratio of the stellar components (i.e., q = M 2/M 1 where M 1 and M 2 are the masses of the primary and secondary stars, respectively) is sufficiently small. Unstable mass transfer will lead the binary system to a contact phase, which may eventually make the stellar components merge to become a single star. Although binary mergers are related to many important topics like stellar rotation, peculiar SNe and long GRBs (Fryer & Heger Reference Fryer and Heger2005; de Mink et al. Reference de Mink, Sana, Langer, Izzard and Schneider2014; Justham, Podsiadlowski, & Vink Reference Justham, Podsiadlowski and Vink2014), here we focus our discussion on non-merging systems that can produce ordinary SNe Ib/c. Recent analyses also indicate that the fraction of stable binary systems is much higher than previously believed (Kobulnicky & Fryer Reference Kobulnicky and Fryer2007; Sana et al. Reference Sana2012), and thus the event rate of SNe Ib/c can be well explained by binary progenitors (Kobulnicky & Fryer Reference Kobulnicky and Fryer2007; Smith et al. Reference Smith, Li, Filippenko and Chornock2011).
In the literature, mass transfer is often categorised into Case A, Case B, and Case C, depending on the evolutionary stage of the primary star when it fills the Roche lobe (Kippenhahn & Weigert Reference Kippenhahn and Weigert1967; Lauterborn Reference Lauterborn1970), as the following:
• Case A mass transfer : mass transfer during the main sequence.
• Case B mass transfer : mass transfer during the helium core contraction phase.
• Case C mass transfer : mass transfer during the core helium burning and later evolutionary stages.
Some binary systems may undergo multiple mass transfer phases, depending on the initial orbital periods and masses of the stellar components. The mass transfer phases that follow Case A/B mass transfer are often denoted as the following:
• Case AB mass transfer : mass transfer from the primary star that has previously undergone the Case A mass transfer, during the helium core contraction phase.
• Case BB mass transfer : mass transfer from the primary star that has previously undergone Case B mass transfer, during the late evolutionary stages (mostly after core helium exhaustion for SN Ib/c progenitors).
• Case ABB mass transfer : mass transfer from the primary star that has previously undergone Case AB mass transfer, during the late evolutionary stages (mostly after core helium exhaustion for SN Ib/c progenitors).
Helium stars as SN Ib/c progenitors can be made via Case B/AB mass transfer as illustrated in Figure 6. The initial mass of such a helium star corresponds to the helium core mass (M He-core) of the primary star at the onset of Case B/AB mass transfer. For Case B systems, M He-core can be given by a well-defined function of the zero-age main sequence (ZAMS) mass of the primary star as shown in Figure 7.
Evolutionary paths of a massive binary system towards a Type Ib/c supernova. The bifurcation points and the end points of the evolution are marked by square boxes.
The helium core mass at the terminal age of the main sequence as a function of the initial mass for single stars. Based on non-rotating models without overshooting.
The evolution of the helium stars produced via Case B/AB mass transfer largely depends on their masses. Stellar evolution models indicate that Case BB/ABB mass transfer occurs when the primary star becomes a helium giant if the helium star mass is initially less than about 3.5–4.0 M⊙, depending on the adopted mass-loss rate and metallicity. More massive helium stars do not interact anymore with the secondary stars after Case B/AB mass transfer, but can still lose mass further by winds. WR winds may be induced if the helium star mass is sufficiently high (≳ 10 M⊙) but the mass-loss rate from less massive helium stars is not well constrained observationally because such relatively low-mass helium stars have been rarely observed (see Sections 3.3 and 3.9 below for more discussions).
It is not only the primary star, but also the secondary star that can produce an SN Ib/c. In a close binary system, the primary star will leave a compact star remnant if it explodes as an SN Ib/c via Case B/AB/BB/ABB mass transfer, or if it becomes a white dwarf via Case BB/ABB mass transfer (see Figure 6). Unless the binary system is unbound by a strong neutron star kick, it will form a common envelope after the core hydrogen exhaustion in the secondary star. A short-period binary system consisting of a helium star plus a compact star (white dwarf, neutron star, or black hole) will be produced after the common envelope ejection. Explosion of the helium star will then produce an SN Ib/c.
Note also that Figure 6 still does not depict all the possible binary paths for SNe Ib/c, and there may exist other relatively rare channels. For example, some authors found that with Case A mass transfer, the SN order can be reversed for a limited parameter space: the secondary star first explode as an SN Ib/c, followed by SN Ib/c explosion of the primary star as a helium star in isolation or in a compact binary system with a neutron star companion, depending on the impact of the neutron star kick (Pols Reference Pols1994; Wellstein, Langer, & Braun Reference Wellstein, Langer and Braun2001).
The contribution of each evolutionary path to the total production of SNe Ib/c may depend on several physical parameters. They include the so-called mass accretion efficiency (i.e, the ratio of the accreted mass onto the secondary star to the transferred mass from the primary star), the specific angular momentum of any matter that is not accreted on the secondary star but lost from the binary system, distribution of neutron star kick velocities, and the common envelope ejection efficiency (e.g., Podsiadlowski, Joss, & Hsu Reference Podsiadlowski, Joss and Hsu1992). It is beyond the scope of this review to discuss all the details regarding binary population with respect to SNe Ib/c, and readers are referred to Podsiadlowski et al. (Reference Podsiadlowski, Joss and Hsu1992), Izzard, Ramirez-Ruiz, & Tout (Reference Izzard, Ramirez-Ruiz and Tout2004), Eldridge, Izzard, & Tout (Reference Eldridge, Izzard and Tout2008); Eldridge, Langer, & Tout (Reference Eldridge, Langer and Tout2011); Eldridge et al. (Reference Eldridge, Fraser, Smartt, Mound and Crockett2013), as well as the contribution by de Mink in this issue. Here, it may be sufficient to say that the dominant channel to SNe Ib/c in binary systems is the Case B/BB, among others (Podsiadlowski et al. Reference Podsiadlowski, Joss and Hsu1992). In the sections below, we focus on the detailed properties of SN Ib/c progenitors predicted from evolutionary models.
3.2. An example of binary models
To model the evolution of a binary system, we have to consider the change of the orbit due to stellar winds, mass transfer and/or gravitational wave radiation, and mass exchange between the stellar components via mass transfer. To investigate the effect of rotation, angular momentum exchange between stars and the orbit via tidal synchronisation and the spin-up effect of the secondary during the mass transfer phases should also be followed (see Langer Reference Langer2012, for a recent review).
Many evolutionary models of massive binary stars have been presented in the literature, but only a limited number of studies aimed at detailed investigation of the structure of SNe Ib/c progenitors near/at the pre-SN stage (Woosley et al. Reference Woosley, Langer and Weaver1995; Wellstein & Langer Reference Wellstein and Langer1999; Yoon et al. Reference Yoon, Woosley and Langer2010; Eldridge et al. Reference Eldridge, Fraser, Smartt, Mound and Crockett2013). Before we summarise the main results of these studies, we give an example for the evolution of relatively low-mass SN Ib/c progenitors, which is very different from that of massive WR stars.
The evolution of an SN Ib/c progenitor having M ZAMS = 16 M⊙ in a Case BB system is illustrated in Figures 8 and 9. After Case B mass transfer, the primary star becomes a hot and compact helium star. The surface hydrogen and helium mass fraction at this stage is about 0.28 and 0.7, respectively and a small amount of hydrogen of about 0.05 M⊙ is still retained in the outermost layer. As a result, the convective helium burning core can grow with hydrogen shell burning even though the total mass somewhat decreases due to mass loss by winds (Figure 9). This is contrasted to the case of mass-losing pure helium stars where the convective helium burning core shrinks in size in terms of the mass coordinate (Figure 5). During the post-helium burning stages, the helium envelope rapidly expands and Case BB mass transfer is initiated when carbon burning begins in the core (Figures 8 and 9). The SN explosion will occur when the surface temperature becomes fairly low (logT eff ≃ 4.1, Figure 8) while the star is still undergoing Case BB mass transfer. This is in stark contrast to the case of massive WR star progenitors that evolve bluewards throughout and explode when they become very hot (logT eff > 5K; Figure 4). The helium envelope expansion makes this binary progenitor bright in the optical bands compared to the case of WR progenitors, as discussed below (Section 3.7). Of course, more massive progenitors having M ZAMS ≳ 30 will become a WR star even in binary systems after Case B/AB transfer, and evolve like a single WR star thereafter.
Evolution of a binary system consisting of 16 M⊙ plus 14 M⊙ stars with the initial period of 5 d. on the Hertzsprung–Russel diagram. The evolutionary tracks of the primary and secondary stars are marked by dark-blue and red colours, respectively. The adopted mass-loss rate for helium stars is given by Equation (1), reduced by a factor of 5 (f w = 5). The initial and final points of each track are marked by the filled circle and the star symbol, respectively.
Evolution of the internal structure of the primary star in a binary system consisting of 16 M⊙ plus 14 M⊙ stars with the initial period of 5 d. Convective layers are marked by green hatched lines, and semi-convection layers by red dots. The surface of the star is indicated by the black solid line. The blue and pink colour shading marks net energy gain or loss from nuclear energy generation and neutrino emission.
3.3. Mass loss and final mass
As mentioned above, one of the biggest uncertainties in the evolution of SN Ib/c progenitors is the mass-loss rate of naked helium stars. The mass-loss rate of WR stars (logL/L⊙ ≳ 5) is relatively well known, but less luminous helium stars have not been well studied observationally. Several authors therefore used extrapolated values of the Nugis and Lamers rate or the Langer rate (see Figure 1) for the whole possible range of helium star mass (Woosley et al. Reference Woosley, Langer and Weaver1995; Eldridge et al. Reference Eldridge, Izzard and Tout2008, Reference Eldridge, Fraser, Smartt, Mound and Crockett2013). On the other hand, Braun (Reference Braun1997) and Wellstein & Langer (Reference Wellstein and Langer1999) used a significantly reduced mass-loss rate for logL/L⊙ < 4.5 as the following:
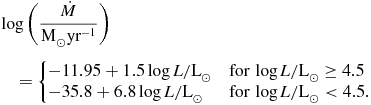 \begin{eqnarray}
&&\log \left(\frac{\dot{M}}{\mathrm{M_\odot yr^{-1}}}\right) \nonumber \\
&&\quad =\left\lbrace \begin{array}{@{}l@{\quad }l@{}}- 11.95 + 1.5 \log L/\mathrm{L_\odot } & \text{for}\, \log L/\mathrm{L_\odot } \ge 4.5 \\
- 35.8 + 6.8 \log L/\mathrm{L_\odot } & \text{for}\, \log L/\mathrm{L_\odot } < 4.5. \end{array}\right.
\end{eqnarray}
\begin{eqnarray}
&&\log \left(\frac{\dot{M}}{\mathrm{M_\odot yr^{-1}}}\right) \nonumber \\
&&\quad =\left\lbrace \begin{array}{@{}l@{\quad }l@{}}- 11.95 + 1.5 \log L/\mathrm{L_\odot } & \text{for}\, \log L/\mathrm{L_\odot } \ge 4.5 \\
- 35.8 + 6.8 \log L/\mathrm{L_\odot } & \text{for}\, \log L/\mathrm{L_\odot } < 4.5. \end{array}\right.
\end{eqnarray}
Here the WR mass-loss rate for logL/L⊙ ⩾ 4.5 is given by Hamann et al. (Reference Hamann, Koesterke and Wessolowski1995). The prescription for less luminous helium stars (logL/L⊙ < 4.5) is based on the observations of extreme helium stars by Hamann et al. (Reference Hamann, Schoenberner and Heber1982). Figure 1 indicates that the simple extrapolation of the WR mass-loss rate down to logL/L⊙ < 4.5 may lead to a significant overestimate even with the Nugis and Lamers rate, which is about 10 times lower than that of Hamann et al. (Reference Hamann, Koesterke and Wessolowski1995) for logL/L⊙ ⩾ 4.5.
Given that the stellar wind mass-loss rates of massive stars were usually overestimated before the late-90s (see Section 2.1 above), mass-loss rates reduced by a certain factor (f w) compared to that of Equation (1) were applied for some binary models of Wellstein & Langer (Reference Wellstein and Langer1999, f w = 2) and for all the models of Yoon et al. (Reference Yoon, Woosley and Langer2010, f w = 5or10). Note that the case of f w = 10, for which the mass-loss rate becomes comparable to the Nugis and Lamers rate with logL/L⊙ ⩾ 4.5 , is still compatible with the observation of extreme helium stars of logL/L⊙ < 4.5 (Figure 1). The caveat is that the extreme helium stars in the figure are giant stars at a pre-white dwarf stage, having masses of only about 0.8 M⊙ (Jeffery & Hamann Reference Jeffery and Hamann2010), and cannot represent ordinary SN Ib/c progenitors.
On the other hand, the quasi-WR (qWR) star HD 45166 is currently one of the most promising observational counterparts of relatively low-mass helium stars on the helium main sequence (Section 3.9). Its mass is about 4.2 M⊙ with a surface helium mass fraction of 0.5 and surface luminosity of logL/L⊙ = 3.75. This star is likely on the helium main sequence. The estimated mass-loss rate gives a better agreement with the extrapolated value of the Nugis and Lamers rate than the mass-loss rates of extreme helium stars of Hamann et al. (Reference Hamann, Schoenberner and Heber1982). But we still have only one sample for such relatively low-mass helium stars in the core helium burning phase, and cannot make a solid conclusion on which mass-loss prescription is best suited for our purpose. As shown in Figure 10, however, this uncertainty does not make a great difference in terms of the final masses.
The final mass of SN Ib/c progenitors via Case B/BB mass transfer as a function of the initial mass, for different helium star mass-loss rates. Here f w denotes the reduction factor that are applied to the mass-loss rate given by Equation (1): f w = 10 and 20 roughly corresponds to solar and SMC metallicity, respectively. The presented results are based on the full binary models by Wellstein & Langer (Reference Wellstein and Langer1999) for f w = 1 and the binary models and pure helium star models by Yoon et al. (Reference Yoon, Woosley and Langer2010) for the others. The boundary line between Case B and BB systems is marked by the dashed line. The data with M ZAMS ⩽ 25 M⊙ in Yoon et al. (Reference Yoon, Woosley and Langer2010) is based on the full binary evolution calculations but it is based on pure helium star models for M ZAMS > 25 M⊙ assuming that the pure helium star was produced via Case B mass transfer from the primary star with the corresponding ZAMS mass in a binary system. See Yoon et al. (Reference Yoon, Woosley and Langer2010) for more details. The result with the WR mass-loss rate by Nugis & Lamers (Reference Nugis and Lamers2000) at solar metallicity from unpublished binary star models (S.-C. Yoon, in preparation) is marked by the green dashed line, for which the boundary for Case B and BB shifts to about M ZAMS = 15 M⊙.
The predicted final masses of SN Ib/c progenitors that undergo Case B/BB mass transfer are given by Figure 10. The models in the figure, for which the considered initial period of the orbit ranges from 4 to 7 d, were taken from Wellstein & Langer (Reference Wellstein and Langer1999) and Yoon et al. (Reference Yoon, Woosley and Langer2010). In Wellstein & Langer (Reference Wellstein and Langer1999), conservative mass transfer (i.e., the mass accretion efficiency β, which is the ratio of the transferred matter from the primary to the accreted matter onto the secondary, equals to 1.0) was assumed and rotation was not taken into account. Yoon et al. (Reference Yoon, Woosley and Langer2010) considered the effects of rotation, with which β is self-regulated by the interplay between the mass transfer from the primary star and the mass-loss enhancement due to rotation from the secondary star that is spun-up by mass and angular momentum accretion. These models indicate β ≃ 0.7 for Case A mass transfer and β = 0.0 ~ 0.8 for Case B mass transfer, respectively.
For Case B systems, the final masses converge to about 3.15 M⊙ with f w = 1.0 and gradually increases with increasing M ZAMS for f w = 5 and 10. The result with the Nugis and Lamers rate is comparable to that with f w = 10. For M ZAMS ≲ 18 M⊙, helium stars produced by Case B mass transfer undergoes Case BB mass transfer during carbon burning and later phases. Consequently the final masses for Case BB systems decrease more rapidly from this point with decreasing M ZAMS, and the lower boundary of the ZAMS mass for SN Ib/c progenitors becomes about 12.5 M⊙, below which the primary star becomes a white dwarf.
In a Case A system, the primary star loses a significant fraction of the initial mass on the main sequence, and the helium core mass at the end of core hydrogen burning becomes lower than the corresponding Case B system. This makes the lower limit of ZAMS mass for SNe Ib/c shift to about 16 M⊙ for Case A systems (Wellstein & Langer Reference Wellstein and Langer1999; Yoon et al. Reference Yoon, Woosley and Langer2010). Very short orbits (typically P init < 5d) are required for Case A systems, and their contribution to the SNe Ib/c rate from binary systems may be smaller by about a factor of 3–4 than that of Case B systems (cf. Sana et al. Reference Sana2012).
These minimum ZAMS mass limits for SNe Ib/c (i.e., 12.5 and 16 M⊙ for Case B and Case A, respectively) are significantly higher than for SNe IIP from single stars, which is about 8 to 9 M⊙ (Smartt Reference Smartt2009; Ibeling & Heger Reference Ibeling and Heger2013). Note that binary interactions can make this limit for SN IIP lowered even down to about 4 M⊙: for example, mergers of 4 M⊙ plus 4 M⊙ star would make a 8-M⊙ SN IIP progenitor. Therefore, the stronger association of SNe Ib/c with younger stellar populations than SNe IIP in their host galaxies (e.g., Anderson et al. Reference Anderson, Habergham, James and Hamuy2012; Kelly & Kirshner Reference Kelly and Kirshner2012; Sanders et al. Reference Sanders2012) is in qualitative agreement with the binary scenario.
According to the recent analyses of SN light curves (Drout et al. Reference Drout2011; Cano Reference Cano2013; Lyman et al. Reference Lyman2014; Taddia et al. Reference Taddia2014), SNe Ib/c have typically ejecta masses of 1–6 M⊙Footnote 3. This means that, assuming the remnant mass of 1.4 M⊙, the final masses of ordinary SNe Ib/c range from 2.4 to 7.4 M⊙ at least. If some amounts of helium were hidden in these analyses as argued by Piro & Morozova (Reference Piro and Morozova2014), the actual final mass would be somewhat higher. This observation is not compatible with the case of f w = 1 in Figure 10, which predicts too low ejecta masses on average. The results with lower mass-loss rates give a better agreement: stars of M ZAMS = 14–35 M⊙ can explain the observed ejecta mass range with f w = 10 and the Nugis and Lamers rate for example. Lyman et al. (Reference Lyman2014) also gives a similar conclusion from the comparison of their stellar population model with the observation.
The effect of different values of f w can be regarded as the metallicity effect, because both observations and theories indicate that WR mass loss becomes stronger for higher metallicity (Vink & de Koter Reference Vink and de Koter2005; Crowther Reference Crowther2007; Gräfener & Hamann Reference Gräfener and Hamann2008). The result in Figure 10 implies that SN Ib/c ejecta should be systematically more massive for lower metallicity, which can be tested by observations. If there were a certain mass cut for the boundary between successful SN explosion and black hole formation in terms of the final mass, this metallicity dependence of final masses would lead to gradual decrease of the SN Ib/c rate for decreasing metallicity (cf. Boissier & Prantzos Reference Boissier and Prantozs2009; Arcavi et al. Reference Arcavi2010). For example, if M f = 8 M⊙ were the lower limit for BH formation, we would not expect an SN Ib/c explosion from M ZAMS ≳ 40 M⊙ at solar metallicity (f w ~ 10) and M ZAMS ≳ 25 M⊙ at SMC metallicity (f w ~ 20), respectively.
3.4. Helium
As discussed in Section 2.3, the amount of helium retained in progenitors may be one of the key factors that make the difference between SNe Ib and SNe Ic. As shown in Figure 11, helium mass varies from 0.1 to 1.9 for the considered range of ZAMS mass and mass-loss rates in Case B/BB systems. Helium mass (M He) as a function of M ZAMS has a local maximum at M⊙ ~ 17 to 18 M⊙ for f w = 1 and 5, and at M⊙ ~ 30 M⊙ for f w = 20, respectively. The rapid decrease of M He as M ZAMS approaches 12 M⊙ results from Case BB mass transfer, while the gradual decrease of M He with increasing M ZAMS is the effect of the increasing mass-loss rate.
Upper panel: The total amounts of helium that are retained until the pre-SN stage in SN Ib/c progenitors via Case B/BB mass transfer, as a function of the initial mass for different loss rates of helium stars. Here f w denotes the reduction factor that are applied to the mass-loss rate given by Equation (1) (see the figure caption of Figure 10). The NL rate means the WR mass-loss rate by Nugis & Lamers (Reference Nugis and Lamers2000). The data were taken from Wellstein & Langer (Reference Wellstein and Langer1999) for f w = 1, Yoon et al. (Reference Yoon, Woosley and Langer2010) for f w = 5, 10 and 20, and unpublished models by Yoon (in prep.) for the NL rate. Lower panel: The corresponding ratios of the helium to ejecta mass. Here we assumed that the remnant neutron star mass is 1.4-M⊙. See Figure 10 for the corresponding final mass.
It is important to note that, even for the case of very strong mass loss (i.e., f w = 1), the amounts of helium at the pre-SN stage are significantly greater than the upper limit of M He = 0.14 M⊙ for SNe Ic that was suggested by Hachinger et al. (Reference Hachinger, Mazzaili, Taubenberger, Hillebrandt, Nomoto and Sauer2012), except for the extreme Case BB case at around M ZAMS = 12.5–13.5 M⊙. Therefore, both single and binary star models cannot fulfil the condition of low amounts of helium for SN Ic. This might mean that, in reality, the chemical mixing between helium and nickel in SN ejecta is not as efficient as considered by Hachinger et al. (Reference Hachinger, Mazzaili, Taubenberger, Hillebrandt, Nomoto and Sauer2012) for most SNe Ic (cf. Dessart et al. Reference Dessart, Hillier, Li and Woosley2012a) such that more helium could be hidden Such inefficient mixing is not usually supported by observations (e.g., Hachinger et al. Reference Hachinger, Mazzaili, Taubenberger, Hillebrandt, Nomoto and Sauer2012; Cano, Maeda, & Schulze Reference Cano, Maeda and Schulze2014; Taddia et al. Reference Taddia2014)Footnote 4, but we need a systematic study on how the mixing efficiency via the Rayleigh–Taylor instability depends on the pre-SN structure of SNe Ib/c progenitors to resolve this issue.
Mass loss from helium stars is another uncertain factor that should be better understood. In particular, some helium stars can closely approach the Eddington limit during the final evolutionary stages if the mass is high enough. This might make the surface layers unstable to cause rapid mass eruption (cf., Maeder et al. Reference Maeder, Georgy, Meynet and Ekström2012; Gräfener & Vink Reference Gräfener and Vink2013), thus removing most of helium in the envelope shortly before the SN explosion as evidenced by many SNe Ib/c (Foley et al. Reference Foley, Smith, Ganeshalingam, Li, Chornock and Filippenko2007; Wellons, Soderberg, & Chevalier Reference Wellons, Soderberg and Chevalier2012; Gorbikov et al. Reference Gorbikov.2014; Gal-Yam et al. Reference Gal-Yam2014).
Eldridge et al. (Reference Eldridge, Langer and Tout2011) assumed a certain value of the ratio of the helium mass to the ejecta mass (M He/M ejecta) as the demarcation criterion between SN Ib and SN Ic. Because the chemical mixing between helium and nickel plays an important role for having helium lines in SN spectra, using M He/M ejecta instead of M He may be appropriate because a lower value of M He/M ejecta means that helium can be more easily shielded from the gamma-ray photons produced in the innermost nickel-rich layer of the SN ejecta. Interestingly, Figure 11 indicates that M He/M ejecta does not depend on the adopted mass-loss rate (hence on metallicity) as strongly as M He does. This is because, for a lower mass-loss rate, the final mass and the CO core mass become higher and compensate the higher helium mass. This has important consequences in the prediction of SN Ib/c rate as a function of metallicity as discussed in Section 3.6 below.
If relatively low-mass helium star progenitors in binary systems have helium masses of about 1–1.5 M⊙ in their envelopes as the most recent models predict, this may lead to an early plateau phase due to helium recombination for several days as shown by Dessart et al. (Reference Dessart, Hillier, Livne, Yoon, Woosley, Waldman and Langer2011). This prediction has recently been tentatively confirmed with the early-time light curve of SN Ib 2006lc (Taddia et al. Reference Taddia2014). Even in the absence of non-thermal effects, helium lines will also be observed during this phase, given that the mass fraction of helium in the envelope is very high (~ 0.98; see Section 2.3).
On the other hand, SN Ib/c progenitors with a compact star companion (see Figure 6) may undergo very strong mass transfer after core helium exhaustion, because these systems have a small mass ratio and short orbital period. Most of the helium envelope can be stripped off in this case, and very little helium will be left at the pre-SN stage (Pols & Dewi Reference Pols and Dewi2002; Dewi et al. Reference Dewi, Pols, Savonije and van den Heuvel2002; Ivanova et al. Reference Ivanova, Belczynski, Kalogera, Rasio and Taam2003). This evolutionary channel has been often invoked to explain SNe Ic having low ejecta masses and fast declining light curves (e.g., Nomoto et al. Reference Nomoto, Yamaoka, Pols, Heuvel, Iwamoto, Kumagai and Shigeyama1994), including some ultra-faint SNe Ic (Tauris et al. Reference Tauris, Langer, Moriya, Podsiadlowski, Yoon and Blinnikov2013). The frequency of such events would be rare compared to ordinary SNe Ib/c, and its quantitative prediction heavily depends on the uncertain parameters related to the common envelope efficiency and neutron star kick.
3.5. Hydrogen
Case B/AB mass transfer in a binary system stops when the hydrogen envelope of the primary star is almost stripped off, but it does not completely remove hydrogen. The amount of hydrogen remaining in the outermost layers of the helium core immediately after the mass transfer phase is typically 0.05–0.1 M⊙. Yoon et al. (Reference Yoon, Woosley and Langer2010) found that the final amount of hydrogen at the pre-SN stage is a function of the progenitor mass as the following. At solar metallicity, which roughly corresponds to the case with f w = 5. . .10 in Figures 10 and 11 (see also Figure 1), no hydrogen will be left for helium stars having final masses of M f ≳ 4. . .4.4 M⊙. For the case of M f ≲ 3 M⊙, Case BB/ABB mass transfer becomes efficient enough to completely remove hydrogen. For the final mass range in-between, the remaining hydrogen until SN explosion will be about 10−4. . .10−2 M⊙. On the other hand, the models with the Nugis and Lamers mass-loss rate at solar metallicity lose all the hydrogen in the envelope for the whole mass range (Eldridge et al. Reference Eldridge, Fraser, Smartt, Mound and Crockett2013; S.-C. Yoon, in preparation). Therefore, in principle, the signature of hydrogen in SN Ib/c progenitors can indirectly constrain the mass-loss rate from helium stars if we have good information about the metallicity in the vicinity of the SN site.
This small amount of hydrogen can be easily detected in the early time spectra of the resulting SN (Spencer & Baron Reference Spencer and Baron2010; Dessart et al. Reference Dessart, Hillier, Livne, Yoon, Woosley, Waldman and Langer2011), in which case it will be identified as an SN IIb (cf. Chornock et al. Reference Chornock2011). These progenitors have relatively small radii (R = 8. . .50R⊙) compared to the yellow-supergiant SN IIb progenitors (e.g., Maund et al. Reference Maund, Smartt, Kudritzki, Podsiadlowski and Gilmore2004; Van Dyk et al. Reference Van Dyk2014) produced via Case C mass transfer (Podsiadlowski et al. Reference Podsiadlowski, Hsu, Joss and Ross1993; Claeys et al. Reference Claeys, de Mink, Pols, Eldridge and Baes2011), and may belong to the compact category of SN IIb (Chevalier & Soderberg Reference Chevalier and Soderberg2010). Some authors argue that several SNe classified as Type Ib also have weak hydrogen absorption lines at high velocity (Deng et al. Reference Deng, Qiu, Hu, Hatano and Branch2000; Branch et al. Reference Branch2002; Elmhamdi et al. Reference Elmhamdi, Danziger, Branch, Leibundgut, Baron and Kirchner2006). Therefore, whether the explosion of a helium star having a thin hydrogen layer may be recognised as SN IIb or SN Ib depends on the details of the SN observation.
The progenitor mass range for which a thin hydrogen layer is present at the pre-SN stage becomes widened and the total amount of remaining hydrogen increases with decreasing metallicity. The ratio of SN Ib/c to SN IIb rate should decrease with decreasing metallicity (Figure 12).
The predicted supernova types according to the initial mass and metallicity of primary stars in Case B/BB binary systems, based on the result presented in Figures 10 and 11. Here M He = 0.5 and M He/M ejecta = 0.45 are adopted for the demarcation condition between SN Ib and SN Ic, for the upper (CASE I) and lower (CASE II) panels, respectively. The red dashed line denotes the critical limit for BH formation, assuming that M f > 8.0 M⊙ does not results in a neutron star (NS) remnant. Note that the figure provides only a qualitative prediction and the numbers that determine each boundary are subject to significant modification depending on the adopted assumptions.
3.6. Supernova types
From the above discussion, we can make a crude prediction on the SN types from Case B/BB mass systems as summarised in Figure 12. With Case AB/ABB systems, each boundary in the figure would simply shift to a higher M ZAMS. For example, the lower limit of M ZAMS for SN Ib/c from Case B/BB systems is about 12.5 M⊙, while it is about 16 M⊙ for Case AB/ABB systems. Because we still do not have any clear demarcation between SN Ib and SN Ic in terms of the progenitor structure (Section 3.4), ad hoc assumptions of M He = 0.5 M⊙ (CASE I) and M He/M ejecta = 0.45 (CASE II) were made for the upper and lower panels, respectively.
Several interesting predictions can be made from this figure, which should be tested in future observations. These predictions are only relevant for ordinary SNe Ib/c and those associated with GRBs or SLSNe-Ic are not considered here.
• For CASE I, the ratio of SN Ic to SN Ib rate from binary systems would decrease with decreasing metallicity in good agreement with Arcavi et al. (Reference Arcavi2010) and Modjaz et al. (Reference Modjaz, Kewley, Bloom, Filippenko, Perley and Silverman2011), and SN Ic is hardly expected at sufficiently low metallicity. By contrast, this ratio would not necessarily decrease for decreasing metallicity with CASE II, unless there existed a mass cut of M ZAMS for BH formation (M cut). If SN Ib/c progenitors with a sufficiently high final mass could not produce an ordinary SN Ib/c, the SN Ic rate would significantly decrease with decreasing metallicity even with CASE II.
• For CASE II, SNe Ic with hydrogen or SNe IIc are expected to occur at sufficiently low metallicity (cf. Elmhamdi et al. Reference Elmhamdi, Danziger, Branch, Leibundgut, Baron and Kirchner2006). Dessart et al. (Reference Dessart, Hillier, Li and Woosley2012a) indeed showed that SNe IIc can be produced if helium is effectively shielded from radioactive nickel.
• The SN Ib/SN IIb ratio would decrease with decreasing metallicity for both cases, which is in good agreement with the recent observation by Arcavi et al. (Reference Arcavi2010).
• Comparison of Figures 10 and 12 implies that both the initial and final masses of SNe Ic progenitors would be systematically higher than those of SN Ib progenitors, regardless of the adopted demarcation criterion of helium. This prediction is in qualitative agreement with SN observations (Cano Reference Cano2013; Lyman et al. Reference Lyman2014; Taddia et al. Reference Taddia2014) and the stronger association of SNe Ic with younger stellar population than SNe Ib in the host galaxies (e.g., Anderson et al. Reference Anderson, Habergham, James and Hamuy2012; Kelly & Kirshner Reference Kelly and Kirshner2012; Sanders et al. Reference Sanders2012).
• For CASE II, the average ejecta masses would increase following the order of SN Ib, IIb and Ic at sufficiently low metallicity.
• The average ejecta masses of SN Ib/c would increase with decreasing metallicity. This effect would be more dramatic for SNe Ic than for SNe Ib (see Figure 10).
• The comparison of Figures 10 and 12 indicates that for CASE II, the maximum final mass of SN Ib (and IIb) would be limited to a fairly small value (about 7.0 M⊙ with the assumed value of M He/M ejecta = 0.45) even for very low metallicity.
3.7. Surface properties and the progenitor candidate of iPTF13bvn
As explained in Section 3.2, a relatively low-mass helium star progenitor of SN Ib/c in binary systems undergo rapid expansion of its envelope during the carbon burning phase and later stages. This envelope expansion becomes stronger for a lower mass star for which the carbon-oxygen core becomes more compact, following the mirror effect (Yoon et al. Reference Yoon, Woosley and Langer2010, Reference Yoon, Gräfener, Vink, Kozyreva and Izzard2012b; Eldridge et al. Reference Eldridge, Fraser, Smartt, Mound and Crockett2013). Within the framework discussed in Section 3.6, therefore, SNe Ib progenitors would have a more extended envelope than SN Ic progenitors for most cases, which may in turn lead a more luminous early plateau in the consequent SN (Dessart et al. Reference Dessart, Hillier, Livne, Yoon, Woosley, Waldman and Langer2011).
The extended envelope at the pre-SN stage can make an SN Ib/c progenitor fairly bright in the optical. The expected visual magnitude is about −4 to −5 for the progenitors having final masses of 3–5 M⊙ (Yoon et al. Reference Yoon, Gräfener, Vink, Kozyreva and Izzard2012b; Bersten et al. Reference Bersten2014; Eldridge et al. Reference Eldridge, Fraser, Mound and Smartt2015; Kim, Yoon, & Koo Reference Kim, Yoon and Koo2015). With an O-type star companion, the visual brightness would be even higher (MV ≃ −6 to −7). By contrast, WR star progenitors (M ZAMS ≳ 30 M⊙) from both single and binary stars have much higher bolometric luminosities, but the expected high surface temperatures at the pre-SN stage result in fainter visual brightness (i.e., M V ≃ −3; Yoon et al. Reference Yoon, Gräfener, Vink, Kozyreva and Izzard2012b; Groh et al. Reference Groh, Meynet, Georgy and Ekstroem2013a) in most cases, which would make them more difficult to directly identify in pre-SN images as discussed in Section 2.2.
Recently, Cao et al. (Reference Cao2013) have reported the tentative identification of the progenitor of the SN Ib iPTF13bvn. The estimated absolute magnitudes of the object in the optical range from − 5.0 to − 7, depending on the filters, adopted extinction values, and photometry methods (Cao et al. Reference Cao2013; Bersten et al. Reference Bersten2014; Eldridge et al. Reference Eldridge, Fraser, Mound and Smartt2015). Groh, Georgy, & Ekstroem (Reference Groh, Georgy and Ekstroem2013b) argued for a single star progenitor with initial masses of 31–35 M⊙ based on the non-rotating models of the Geneva group. Unlike more massive stars that become WO stars at the end, these models end their lives as WN stars having relatively thick helium envelopes with surface temperatures of about logT eff ~ 4.6. The predicted optical magnitudes (~ − 5.5) agree with the observation, but the final mass (~ 11 M⊙) seems to be too high, compared to the estimated ejecta mass of the SN (~ 1.9–2.3 M⊙; Fremling et al. Reference Fremling2014; Bersten et al. Reference Bersten2014) that supports the binary scenario. The optical brightness of the progenitor candidate can also be explained by a binary progenitor having an initial mass of 10–20 M⊙ (Bersten et al. Reference Bersten2014; Eldridge et al. Reference Eldridge, Fraser, Mound and Smartt2015). If future observations find evidence for the companion star that survives the SN explosion, it will directly confirm a binary star origin of SNe Ib for the first time.
3.8. Rotation
Massive stars in a close binary system before mass transfer are likely to be synchronised with the orbit because of the short tidal interaction timescale. After Case B/AB mass transfer, the orbit becomes too wide to keep the tidal synchronisation, and the final rotation velocity of the primary star is mainly determined by the amount of angular momentum that is retained after the mass transfer phase. Binary evolution models including the effects of rotation indicate that SN Ib/c progenitors via Case B/AB mass transfers are slow rotators as they lose mass and angular momentum (Wellstein Reference Wellstein2001; Yoon et al. Reference Yoon, Woosley and Langer2010; Langer Reference Langer2012). Both models with and without magnetic torques due to the Tayler–Spruit dynamo (see Section 2.4 for the discussion on angular momentum redistribution inside stars) predict that the surface rotation velocity of naked helium stars on the helium main sequence after the mass transfer phase is only about 1.0–10.0kms−1.
The specific angular momentum in the innermost region of 1.4 M⊙ that would collapse to a neutron star significantly according to the prescription of angular momentum transfer (Yoon et al. Reference Yoon, Woosley and Langer2010). Models without the Tayler–Spruit dynamo predict that neutron stars from SNe Ib/c in binary systems would almost reach the critical rotation. This means that the majority of SN Ib/c progenitors in binary systems would also be good progenitor candidates for magnetars/collapsars without the Talyer–Spruit dynamo, which cannot be easily reconciled with observations. Models with the Tayler–Spruit dynamo predict that the specific angular momentum of the collapsing core would be comparable to those of single star models (i.e., j ~ 1014cms−1) and the resultant neutron stars would be rotating at a period of several milliseconds.
As in the case of single stars, therefore, binary models with the Tayler–Spruit dynamo do not predict magentar/collapsar progenitors for energetic SNe and/or long GRBs via the standard Case B/BB/AB/ABB systems (Yoon et al. Reference Yoon, Woosley and Langer2010) under normal circumstances. At sufficiently low metallicity, however, mass accreting stars in Case B mass transfer systems may be spun up to undergo the chemically homogeneous evolution, which may end up as a GRB (Cantiello et al. Reference Cantiello, Yoon, Langer and Livio2007). SN Ib/c progenitors in very close binary systems consisting of a helium star and a low-mass main-sequence star/compact object (cf. Figure 6; Section 3.2) may experience strong tidal interaction, given that the orbital period can be as short as 0.1 d in this case (e.g., Dewi et al. Reference Dewi, Pols, Savonije and van den Heuvel2002; Ivanova et al. Reference Ivanova, Belczynski, Kalogera, Rasio and Taam2003; Izzard et al. Reference Izzard, Ramirez-Ruiz and Tout2004; van den Heuvel & Yoon Reference van den Heuvel and Yoon2007; Detmers et al. Reference Detmers, Langer, Podsiadlowski and Izzard2008; Podsiadlowski et al. Reference Podsiadlowski, Ivanova, Justham and Rappaport2010). Some of these systems may produce unusually rapid rotators even within the framework of the Tayler–Spruit dynamo, but more detailed evolutionary studies are needed to make a meaningful conclusion on this. The fact that host galaxies of broad-lined SNe Ic and GRBs are found to be systematically overdense compared to other galaxies of the Sloan Digital Sky Survey might be an indication for the importance of the binary channel for producing rapidly rotating progenitors to produce these events (Kelly et al. Reference Kelly, Filippenko, Modjaz and Kocevski2014).
3.9. Observational counterparts
WR stars in binary systems are excellent observational counterparts for SN Ib/c progenitors during the post Case B/AB mass transfer phase, for logL/L⊙ ≳ 5.0 (van der Hucht Reference van der Hucht2001). Relatively low-mass helium stars (logL/L⊙ < 5.0) in binary systems are only rarely observed. This is probably because such helium stars on the helium main sequence are very hot and faint in optical bands (see Figure 8) and because many of them have bright OB-type companion stars.
As mentioned above (Section 3.3), the best observational counterpart of binary SN Ib/c progenitors with logL/L⊙ < 4.5 is the qWR star HD 45166 (van Blerkom Reference van Blerkom1978; Willis & Stickland Reference Willis and Stickland1983; Steiner & Oliveira Reference Steiner and Oliveira2005; Groh, Oliveira, & Steiner Reference Groh, Oliveira and Steiner2008): the primary is a helium rich 4.2-M⊙ star with R ≃ 1.0R⊙ and the secondary is a 4.8-M⊙ main-sequence star, in a 1.596-d orbit (Steiner & Oliveira Reference Steiner and Oliveira2005). This system was probably produced via unstable Case B/AB mass transfer and the consequent common envelope phase. This star gives important information about the mass-loss rate from such a relatively low-mass helium star as discussed in Section 3.3. WR 7a is another qWR star (Schwartz et al. Reference Schwartz, Persson and Hamann1990; Pereira et al. Reference Pereira, Machado, Landaberry and da Conceicao1998; Oliveira, Steiner, & Cieslinski Reference Oliveira, Steiner and Cieslinski2003). No companion of this star has been found so far. Radial periodicity of 0.204 d has been reported, and if this is related to binarity, its companion should be a low-mass main-sequence star (M ≲ 1.0 M⊙) or a compact object. To our knowledge, no estimate of the wind mass-loss rate from this star has been reported yet.
There also exist candidates for evolved helium giant stars beyond core helium exhaustion. They include υ Sgr, KS Per and LSS 4300 (Dudley & Jeffery Reference Dudley and Jeffery1993). Among these, the υ Sgr system has been best studied (e.g., Frame et al. Reference Frame, Cottrell, Gilmore, Kilmartin and Lawson1995; Saio Reference Saio1995; Koubský et al. Reference Koubsk’y, Harmanec, Yang, Netolický, Netolick, Škoda, Šlechta and Korčáková2006; Netolický et al. Reference Netolický, Bonneau, Cehsneau, Harmanec, Koubsk, Mourard and Stee2009; Kipper & Klochkova Reference Kipper and Klochkova2012). The mass, surface temperature, and bolometric luminosity of the hydrogen-deficient primary of this system are M ≈ 3.0 M⊙, T eff ≈ 11800 K and logL/L⊙ ≈ 4.6. It also shows radial pulsation of a 20-d period (Saio Reference Saio1995), and evidence for mass transfer and a circumbinary disk (Netolický et al. Reference Netolický, Bonneau, Cehsneau, Harmanec, Koubsk, Mourard and Stee2009), which agrees well with the Case BB mass transfer scenario (Schönberner & Drilling Reference Schoenberner and Drilling1983). Therefore, these systems can provide useful information about the progenitor evolution as well as their circumstellar environments immediately before SN explosion. The visual magnitude of this star is M V = −4.73 ± 0.3 (Kipper & Klochkova Reference Kipper and Klochkova2012), which is consistent with the model predictions discussed in Section 3.7.
3.10. Companion stars
The companion stars of binary progenitors of SNe Ib/c will survive the SN explosion and may be found in some young SN remnants (e.g., Kochanek Reference Kochanek2009; Koo et al. Reference Koo2011). There may be several types of companion stars: main-sequence stars of early to late types, compact objects like white dwarfs, neutron stars and black holes, and helium stars (Section 3.1; Figure 6). In terms of stellar population, the most common type (i.e., more than 30% of all binary SN Ib/c progenitors) may be relatively high mass stars (O/B type) on the main sequence that underwent stable Case B/BB/AB/ABB mass transfer (e.g., Podsiadlowski et al. Reference Podsiadlowski, Joss and Hsu1992; Eldridge et al. Reference Eldridge, Fraser, Smartt, Mound and Crockett2013). These massive companion stars accrete mass and angular momentum via stable mass transfer to be spun up to the critical value (Wellstein et al. Reference Wellstein, Langer and Braun2001; Petrovic et al. Reference Petrovic, Langer, Yoon and Hger2005b; Cantiello et al. Reference Cantiello, Yoon, Langer and Livio2007; Yoon et al. Reference Yoon, Woosley and Langer2010; Langer Reference Langer2012; de Mink et al. Reference de Mink, Langer, Izzard, Sana and de Koter2013). At solar metallicity, however, they will lose angular momentum again via stellar winds after the mass transfer phase, and the rotation velocity shortly after the SN explosion depends on how much mass is lost by winds until that time. Models by Yoon et al. (Reference Yoon, Woosley and Langer2010) indicate that the surface rotation velocity will be about 300–450 kms−1 for surviving companion of M 2 ≈ 17–20 M⊙. By contrast, more massive stars loses mass and angular momentum very quickly: a 48-M⊙ companion star would be slowed down to about 60 kms−1 at the pre-SN stage. The transferred mass to the secondary star is enriched with the ashes of hydrogen burning compared to the initial composition (de Mink et al. Reference de Mink, Pols, Langer and Izzard2009; Langer Reference Langer2012). The surface composition of the surviving secondary star after the SN explosion should be therefore marked by the enhancement of helium and nitrogen. The models of Yoon et al. (Reference Yoon, Woosley and Langer2010) give typically the mass fractions of helium and nitrogen of about 0.35 and 4.3 × 10⁻³ (i.e., 4.3 times the solar value) at the surface of surviving companion stars, respectively.
4 CONCLUSIONS
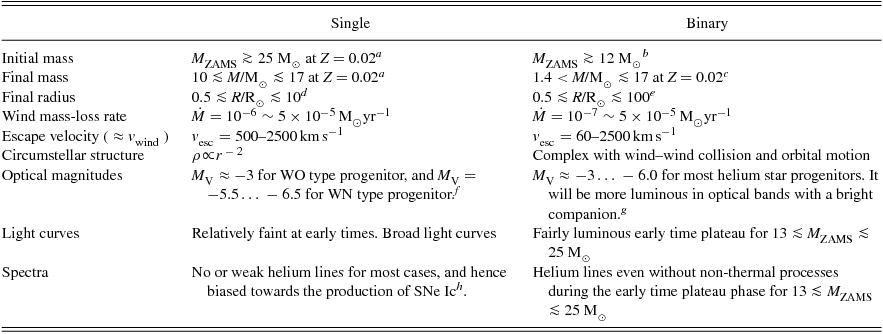
We summarise the main predictions of single and binary star models for ordinary SN Ib/c progenitors in Table 1.
Main predictions of single and binary star progenitors models for SNe Ib/c at solar metallicity.
aMeynet & Maeder (Reference Meynet and Maeder2003).
bWellstein & Langer (Reference Wellstein and Langer1999), Yoon et al. (Reference Yoon, Woosley and Langer2010) and Eldridge et al. (Reference Eldridge, Fraser, Smartt, Mound and Crockett2013).
cBased on the result presented in Figure 10 and Yoon et al. (Reference Yoon, Woosley and Langer2010) (in the figure, f w = 10 roughly corresponds to Z = 0.02). See also Eldridge et al. (Reference Eldridge, Langer and Tout2011).
dGroh et al. (Reference Groh, Meynet, Georgy and Ekstroem2013a, Reference Groh, Georgy and Ekstroem2013b).
eYoon et al. (Reference Yoon, Woosley and Langer2010, Reference Yoon, Gräfener, Vink, Kozyreva and Izzard2012b) and Eldridge et al. (Reference Eldridge, Fraser, Smartt, Mound and Crockett2013, Reference Eldridge, Fraser, Mound and Smartt2015).
fYoon et al. (Reference Yoon, Gräfener, Vink, Kozyreva and Izzard2012b) and Groh et al. (Reference Groh, Meynet, Georgy and Ekstroem2013a, Reference Groh, Georgy and Ekstroem2013b).
gYoon et al. (Reference Yoon, Gräfener, Vink, Kozyreva and Izzard2012b), Bersten et al. (Reference Bersten2014), Eldridge et al. (Reference Eldridge, Fraser, Mound and Smartt2015) and Kim et al. (Reference Kim, Yoon and Koo2015).
Many of WR progenitors would end their lives as a WO type star that is relatively faint with optical filters (M V ≈ −3; Yoon et al. Reference Yoon, Gräfener, Vink, Kozyreva and Izzard2012b; Groh et al. Reference Groh, Meynet, Georgy and Ekstroem2013a). Binary systems with a sufficiently high initial mass of the primary star can produce WR progenitors of which the properties would be very similar to those of single WR stars, but the presence of the companion star would result in rather complex structures of the circumstellar medium and the SN remnant (Koo et al. Reference Koo2011). Compared to the single star case, the detectability of WR progenitors can be significantly enhanced with a luminous early type companion.
However, given the preference for lower masses of the initial mass function, the majority of binary progenitors should have several unique properties that are very different from WR progenitors. Their final masses at the pre-SN stage are systematically lower (M f ≃ 1.4–6M⊙ for M ZAMS ≃ 12–25M⊙) than those of WR progenitors (M f > 10 M⊙). This agrees well with the recent ejecta mass estimates of ordinary SNe Ib/c (M ejecta = 1–6 M⊙; Drout et al. Reference Drout2011; Cano Reference Cano2013; Lyman et al. Reference Lyman2014; Taddia et al. Reference Taddia2014). The current binary model predictions are also consistent with the observational facts that the association of the SN locations in their host galaxies with young stellar populations becomes stronger following the order of SN II, SN Ib and SN Ic (Sections 3.3 and 3.6), which is usually interpreted within the single star scenario in the literature (e.g., Anderson et al. Reference Anderson, Habergham, James and Hamuy2012; Kelly & Kirshner Reference Kelly and Kirshner2012; Sanders et al. Reference Sanders2012).
Despite their relatively low masses, the detectability of binary progenitors in optical bands is not necessarily lower than single WR star progenitors. To the contrary, a significant fraction of binary progenitors should have very high visual luminosities because relatively low-mass helium stars can rapidly expand during the late evolutionary stages, and/or because many of them would have luminous companion stars (Yoon et al. Reference Yoon, Gräfener, Vink, Kozyreva and Izzard2012b; Eldridge et al. Reference Eldridge, Fraser, Smartt, Mound and Crockett2013, Reference Eldridge, Fraser, Mound and Smartt2015).
The SN models by Dessart et al. (Reference Dessart, Hillier, Livne, Yoon, Woosley, Waldman and Langer2011) indicate that early time light curves and spectra would have the critical information about the nature of SN Ib/c progenitors. In particular, the plateau phase due to helium recombination at early times and He i lines formed with thermal processes during this phase would be strong evidence for a relatively low-mass helium star progenitor having an extended helium envelope. As demonstrated by several recent observations (e.g., Soderberg et al. Reference Soderberg2008; Modjaz et al. Reference Modjaz2009; Corsi et al. Reference Corsi2012; Maeda et al. Reference Maeda, Katsuda, Bamba, Terada and Fukazawa2014), the progenitor size can also be best constrained by early-time SN light curves including shock breakouts. We therefore conclude that observations of early-time light curves and spectra will be an excellent probe into the nature of SN Ib/c progenitors.
There still exist many unsolved problems and related future topics that should be addressed.
• A caveat in the above conclusions is that the predictions summarised in Table 1 are mostly based on the models at solar metallicity. The final masses of single star progenitors at super-solar metallicity can become as low as 5 M⊙, depending on the adopted mass-loss rate (Figure 2; Meynet & Maeder Reference Meynet and Maeder2005). This value is within the ejecta mass range of ordinary SNe Ib/c by Cano (Reference Cano2013) and Lyman et al. (Reference Lyman2014), although it still cannot explain SNe Ib/c having ejecta masses lower than about 3.5 M⊙. Given that the final amounts of helium must also be smaller than in the case of solar metallicity (Figure 11), the contribution from super-solar metallicity single stars might be particularly significant for SNe Ic (cf., Prieto, Stanek, & Beacom Reference Prieto, Stanek and Beacom2008; Boissier & Prantzos Reference Boissier and Prantozs2009; Modjaz et al. Reference Modjaz, Kewley, Bloom, Filippenko, Perley and Silverman2011).
• Although the SN Ib/c event rate implies the dominant role of binary systems for the production of SNe Ib/c (Smith et al. Reference Smith, Li, Filippenko and Chornock2011; Eldridge et al. Reference Eldridge, Fraser, Smartt, Mound and Crockett2013), more direct evidence for binary progenitors comes from SNe Ib/c ejecta masses (M ejecta; Sections 3.3 and 3.6). Precise estimates of SN ejecta masses can give one of the best constraints for progenitor models. The uncertainties related to the effects of asymmetry of the explosion, mixing of chemical compositions in the SN ejecta and the presence of helium on the estimates of M ejecta using SN light curves should be clarified in the near future (cf. Dessart et al. Reference Dessart, Hillier, Li and Woosley2012a; Piro & Morozova Reference Piro and Morozova2014; Wheeler, Johnson, & Clocchiatti Reference Wheeler, Johnson and Clocchiatti2014).
• The question on how much helium can be hidden in SN Ic spectra is another critical test case for SN Ib/c progenitor models (Sections 2.3, 3.4 and 3.6; Figure 12). Recent observations indicate very low helium mass (< 0.14M⊙) in the ejecta (Hachinger et al. Reference Hachinger, Mazzaili, Taubenberger, Hillebrandt, Nomoto and Sauer2012; Taddia et al. Reference Taddia2014). This cannot be easily accommodated to the current model predictions that most SN Ib/c progenitors have M He > 0.2. This conflict may be due to our lack of proper knowledge on the mass-loss rate from helium stars (in particular during the post-helium burning phase; Section 3.4) but a rigorous estimate of helium masses for a large sample of SNe Ib/c is highly required to resolve this issue. The ratio of SN Ic to SN Ib is another important constraint for progenitor models, which should be better estimated in the future. Several authors reported that the Ic to Ib ratio is about 2 (e.g., Smartt Reference Smartt2009; Li et al. Reference Li2011), but Modjaz et al. (Reference Modjaz2014) point out that many SNe Ib had been misclassified as SNe Ic, suggesting a lower value.
• As discussed in Section 3.6, future observations on SN Ib/c and SN IIb properties and their relative frequencies as a function of metallicity (e.g., Prieto et al. Reference Prieto, Stanek and Beacom2008; Boissier & Prantzos Reference Boissier and Prantozs2009; Modjaz et al. Reference Modjaz, Kewley, Bloom, Filippenko, Perley and Silverman2011; Graham & Fruchter Reference Graham and Fruchter2013) would greatly help to clarify the role of mass loss from helium stars in the evolution of SN Ib/c progenitors. It would be particularly important to investigate how the ejecta masses of SNe Ib/c and the ratio of SN Ib/SN Ic rate systematically depend on metallicity.
• In the discussions above, we did not address progenitors of broad-lined SNe Ic (SNe Ic-BL), simply because we do not have a good clue on what makes them. The association of long GRBs and some SNe Ic-BL (e.g., Woosley & Heger Reference Woosley and Heger2006) implies the importance of rapid rotation, and attempts have been made to explain long GRBs, SNe Ic-BL and super-luminous SNe Ic within the single framework of the magnetar scenario (e.g., Mazzali et al. Reference Mazzali, McFadyen, Woosley, Pian and Tanaka2014). Binary star models including rotation do not predict any particular parameter space where unusually rapid rotation in the core can be realised from the standard Case B/BB/AB/ABB channels for SNe Ib/c (Petrovic et al. Reference Petrovic, Langer, Yoon and Hger2005b; Yoon et al. Reference Yoon, Woosley and Langer2010), except for the so-called chemically homogeneous evolution induced by mass accretion at low metallicity (Cantiello et al. Reference Cantiello, Yoon, Langer and Livio2007). Future studies should investigate more carefully the evolution of some specific binary systems where the condition of rapid rotation for magnetars can be rather easily fulfilled compared to the standard channels, such as binary systems consisting of a helium star plus a compact object in a very tight orbit (Figure 6; Section 3.8).
ACKNOWLEDGEMENTS
The author is grateful to Norbert Langer, Stan Woosley, Luc Dessart, Hyun-Jeong Kim, Bon-Chul Koo, Götz Gräfener, Jorick Vink, Wonseok Chun, Thomas Tauris, Rob Izzard, Alexandra Kozyreva, and John Hillier for their contribution to this work and fruitful collaboration, and John Eldridge, Maryam Modjaz, Philipp Podsiadlowski, Ken’ichi Nomoto, Keiichi Maeda, Selma de Mink and Cyril Georgy for helpful discussions. This work was supported by Basic Science Research (2013R1A1A2061842) program through the National Research Foundation of Korea (NRF) and by Research Resettlement Fund for the new faculty of SNU.