


Introduction
Deep holes have been drilled into glaciers to obtain samples (Langway, 1958, p. 337; Miller, 1958; Reference NyePatenaude and others, 1959; Reference Ragle, Ragle, Hansen, Gow and PatenaudeRagle and others, 1960; Reference Kamb and ShreveKamb and Shreve, 1963[a], [b]; Reference Shreve and KambShreve and Kamb, 1964; Reference Gow, Gow, Ueda and GarfieldGow and others, 1968), to determine ice thickness (Reference LangwayMathews, 1959, p. 448−50; Reference LaChapelleLaChapelle, 1965, p. 609−12), to locate englacial and subglacial streams, to measure temperatures (Reference Ward and OrvigWard and Orvig, 1953, p. 160) and closure rates, and to determine the variation with depth of the component of How velocity perpendicular to the hole. This last is essential for testing proposed flow laws for glacier ice, for evaluating the constants in these laws, and for determining the velocity of slip of the glacier on its bed.
The first hole intended for determining flow velocity at depth was drilled by Louis Agassiz in the Unteraar Gletscher around 1840 (Reference ForbesForbes, 1859, p. 55). Since then bore holes for this purpose have been made in Austria on the Hintereisferner (Reference Blümcke and HessBlümcke and Hess, 1909; Reference Hess and GutenbergHess, 1933, p. 42−43), in Switzerland on the Jungfraufirn (Reference PerutzPerutz, 1949, 1950; Reference Gerrard, Gerrard, Perutz and RochGerrard and others, 1952), in Alaska on Malaspina Glacier (Reference SharpSharp, 1953, 1958, p. 638−41) and Taku Glacier (Miller, 1958), in Canada on Saskatchewan Glacier (Reference MathewsMeier, 1960, p. 28−32), Athabasca Glacier (Reference Savage and PatersonSavage and Paterson, 1963; Reference Paterson and SavagePaterson and Savage, 1963[b]; Reference Savage and PatersonSavage and Paterson, 1965), and Salmon Glacier (Reference LangwayMathews, 1959), and in Norway on Austerdalsbreen (Reference MeierMembers of the Cambridge Austerdalsbre Expédition, 1958, p. 398; Reference WardWard, 1961).
Setting. Blue Glacier (Figure 1 is an active valley ice stream 4.3 km2 in area that flows from accumulation basins high on the north-eastern shoulder of Mount Olympus, Washington (lat. 47° 48’ N., long. 123° 42’ W.). The climate is strongly maritime, with heavy precipitation and moderate temperatures both summer and winter (Reference LaChapelleLaChapelle, 1965, p. 616−19). More detailed descriptions of the environment, budget, geometry, and structure of Blue Glacier have been given by Reference KambKamb (1959, p. 1893−94), Reference Allen, Allen, Kamb, Meier and SharpAllen and others (1960), Reference Sharp, Sharp, Epstein and VidziunasSharp and others (1960), Reference LaChapelleLaChapelle (1965), and Reference CorbatóCorbató (1965).
Blue Glacier. Positions of bore holes in August of each year through 1961 shown by open circles; positions in August 1962 shown by solid circles. Base map front American Geographical Society (1960).
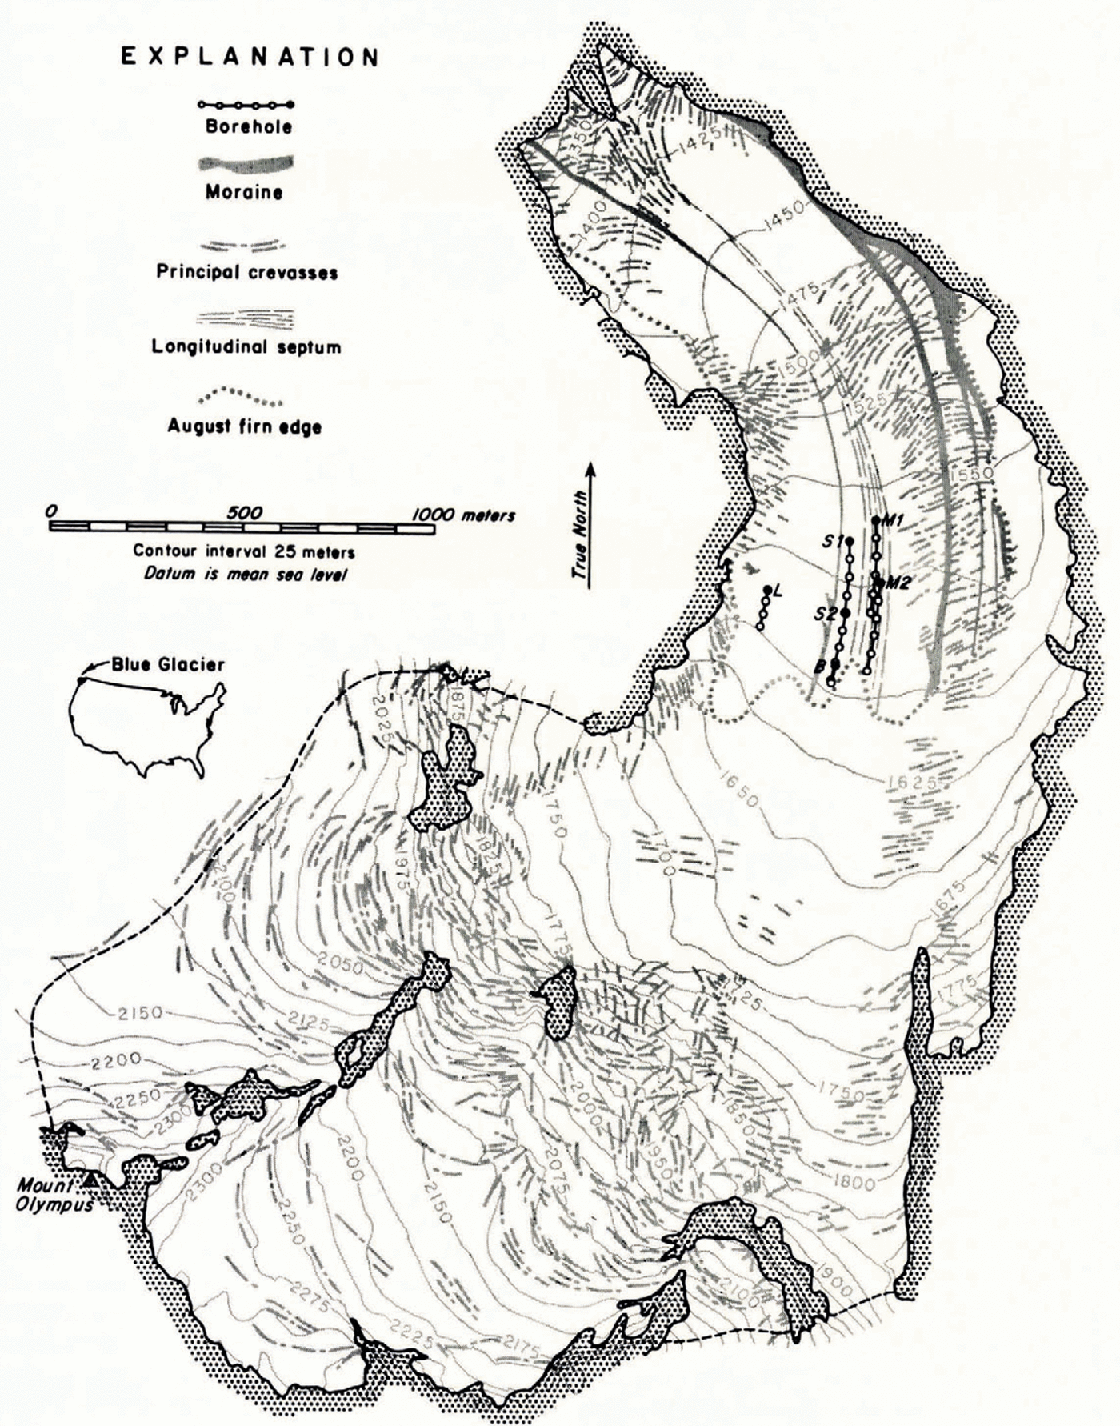
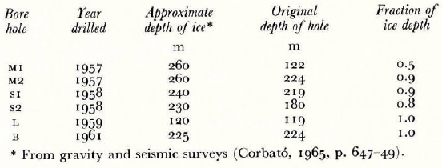
Bore holes. The investigations described in this paper were conducted on lower Blue Glacier during the summers of 1957 through 1962. Six deep holes were drilled, aluminum pipes were placed in them, and annual inclinometer surveys were made (Figure 1; Tables I and II). Holes subsequently bored by Reference Kamb and ShreveKamb and Shreve (1963[a], [b]; ,1966) are not treated.
Data on Blue Glacier bore holes
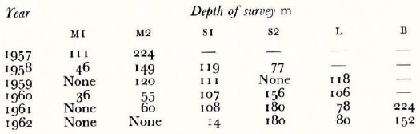
Inclinometer surveys in Blue Glacier bore holes
Holes M1, M2, S1, S2, and B were drilled near the firn edge in a reach of relatively uniform surface slope, where the longitudinal strain-rate and the ablation rate were expected to be small. Holes M1 and M2 were drilled in 1957 on, it was intended, a single flow line near the center-line of the glacier, where the surface velocity and depth of the ice were known to be greatest. These holes were unintentionally located in the “longitudinal septum”, an atypical structural feature not recognized until later (Reference Allen, Allen, Kamb, Meier and SharpAllen and others, 1960, p. 609). Holes S1 and S2, drilled in 1958, and B, drilled in 1961, were therefore placed on a flow line west of M1 and M2, so as to be in the structurally typical ice midway between the longitudinal septum and the west medial moraine.
Bore hole L was placed near the west valley wall, where the ice depth is only about 120 m, the surface slopes approximately 10 deg, and the surface velocity deviates about 45 deg to the west of the line of steepest slope.
Equipment and procedures
The holes on lower Blue Glacier were made by electrically powered thermal drills, termed “hotpoints”. Power was supplied through a single-conductor cable, and the return connection was made through the bore-hole pipe. The holes were bored vertically rather than perpendicular to the glacier surface. Drilling proceeded 24 h a day until completion of a hole. Then the power wire was broken at a low-strength joint in the hotpoint and pulled from the pipe.
Rocks or dirt in the ice were not a serious problem in lower Blue Glacier. Of 15 bore holes started between 1957 and 1964 only one (a few meters from S2) was stopped by an impenetrable obstacle at shallow depth, two (MI and B) were terminated by hotpoint failure, and the remainder by very slowly penetrable (less than 0.3 m h−1) material at depth.
On rare occasions during drilling, the bore-hole pipe fell free for distances of 0.1 to 2 m, sometimes at depths exceeding 150 m (also observed on Athabasca Glacier by Reference Savage and PatersonSavage and Paterson (1963, p. 4522), on upper Blue Glacier by E. R. LaChapelle, and on South Cascade Glacier by M. F. Meier, personal communication from LaChapelle). Simultaneously, water level in the hole usually dropped as much as several meters, or sometimes overflowed, but within an hour returned to the normal level a few centimeters below the surface. No unusual quantity of air bubbled from the hole during these events.
Deformation of the pipes was determined by means of repeated inclinometer surveys (Table II). Readings were usually taken at intervals of 7.5 m. Approximately at the time of survey, the position of the top of each pipe was determined by standard surveying methods from permanent survey points established on bedrock.
Although the pipes remained free in their holes during the first summer, by the following summer they were tightly gripped not only near the surface, but also over most, if not all, of their lengths. This was indicated by the fact that they were pulled down into the ice as much as 4 m each year (Table III), presumably because of the lengthening of the holes by flow of the glacier, an effect that increases with depth. This phenomenon has not, to our knowledge, been reported from other glaciers. Indeed, Reference Savage and PatersonSavage and Paterson (1963, p. 4523−24) report that their pipes in Athabasca Glacier appeared to be seized in the upper 30 m of the bore holes but not at greater depths.
Pull-down of pipes into ice
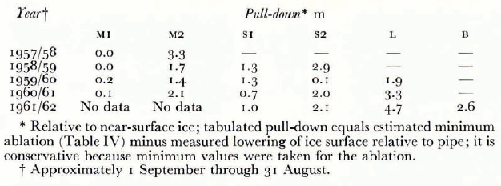
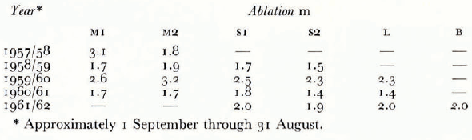
Estimated minimum ablation at wore holes
Pipe. Except in hole B, 3 m lengths of aluminum pipe (internal diameter 35 mm, external diameter 42 mm) threaded with regular taper pipe-thread plumber's dies were used. They were joined with commercial aluminum taper-thread couplings (external diameter 51 mm, length 51 mm) and were scaled with various commercial thread sealants, of both hardening and non-hardening types. None prevented leakage into the pipe at depths greater than about 100 m. In hole B, specially prepared 2.4 m lengths of the same pipe joined by welded-on straight-thread couplings and sealed with quick-setting thiokol rubber were used in a partly successful attempt to prevent leakage (Reference ShreveShreve, 1963).
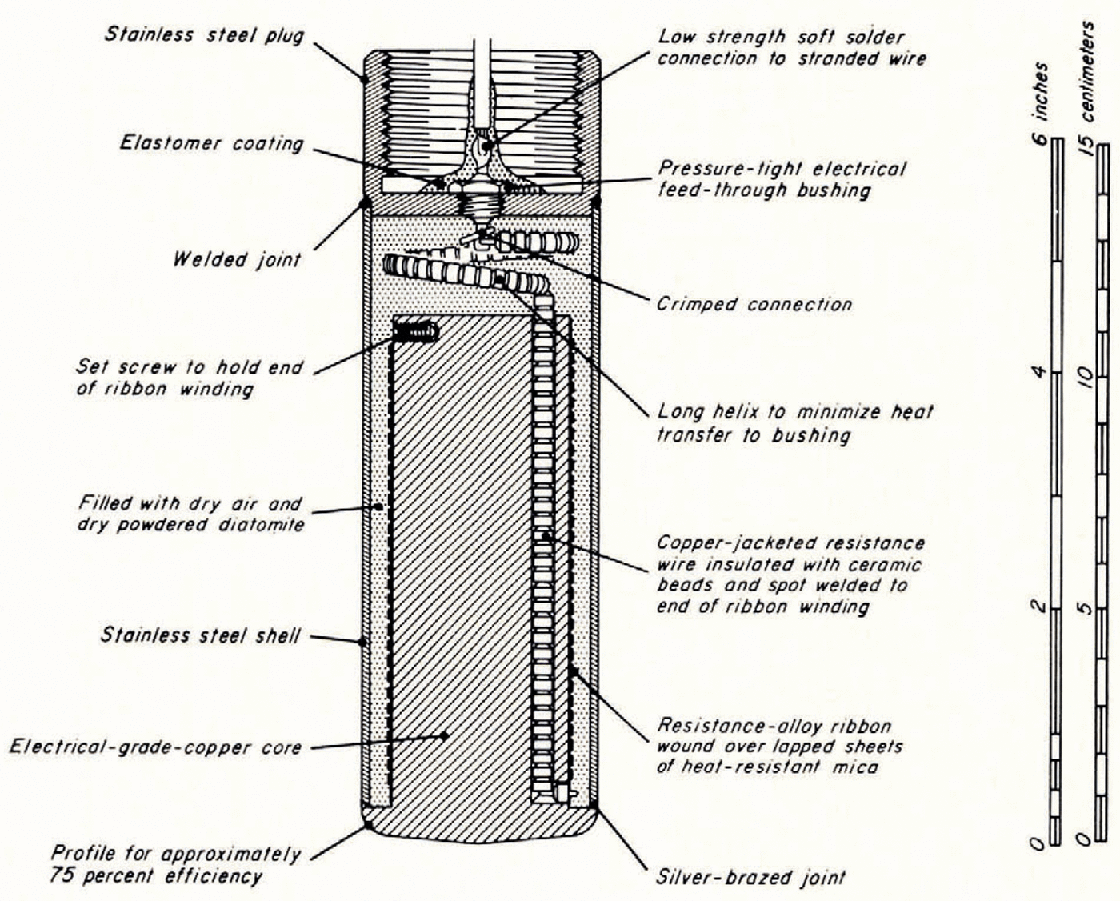
Drilling hotpoints. Bore holes M1 and M2 were made with 51 mm hotpoints of an early design that burned out at power inputs greater than 1.6 kW, although more than 2 kW was available, and that at 1.6 kW had an average operating lifetime of only about 24 h and an efficiency (Reference WardWard, 1961, p. 535; Reference ShreveShreve, 1962, p. 157) in normal operation of only 0.34, hence a maximum drilling speed of only 3 m h−1. These deficiencies impelled a general review and detailed analysis (Reference ShreveShreve, 1962; see also Reference WardWard, 1961) of the design and operation of thermal drills. The desirability of using existing equipment, materials, methods, and experience dictated improvement of the previously used design, rather than development of a radically new one. The first improved hotpoints were used on the glacier in 1958, 1959, and 1961. From this experience the design shown in Figure 2 evolved. The core is short and thick, to minimize the temperature of the resistance wire and the mica insulation. The front of the hotpoint is blunt, to increase efficiency (Reference ShreveShreve, 1962, p. 160). The helical winding is made of flat strip rather than round wire and is grounded to the core at the high-temperature end, to minimize the mechanical, thermal, and electrical stress on the mica and eliminate the need for a coating of refractory cement, which shortens shelf life by causing intergranular corrosion of the winding. Before assembly the insulating powder is baked for 24 h at high temperature to drive off adsorbed water vapor that otherwise would promote corrosion of the winding and decomposition of the mica. The unusual geometry of the brazed joint between core and shell allows for differential expansion in the heat of brazing (unlike the hotpoint of Reference StaceyStacey, 1960, p. 785), to prevent separation during cooling that would allow the hotpoint to leak.
Longitudinal cross-section of drilling hotpoint.
Hotpoints of this design were used by Reference Kamb and ShreveKamb and Shreve (1963[a], [b], 1966) in 1962, 1963, and 1964 to bore 9 more holes in Blue Glacier. In normal operation at a power input of 2.1 kW they have an efficiency of 0.75 (higher efficiency being undesirable in a hotpoint) and a drilling speed of 9 m h−1. Their operating lifetime at 2,5 kW is considerably greater than 1 000 h, and their shelf life is at least 5 years. None has burned out, changed resistance, or leaked. These improvements in equipment and technique mean that a hole 120 m deep bored in 1964 required only 15 man-hours and involved one inexperienced field assistant working as other jobs permitted, whereas a similar hole bored in 1957 required more than 100 man-hours and involved the entire party of seven men working full time.
Pipe-thawing hotpoints. The bore-hole pipes were initially filled with antifreeze solution, but by the following summer and every summer thereafter they were invariably blocked with ice, sometimes at depths as great as 200 m. Mechanical removal was possible near the surface but impractical at greater depths. Special 33 mm pipe-thawing hotpoints were therefore constructed following the principles developed for the boring hotpoints. In the pipe-thawing hotpoint, however, the frontal surface has an inefficient profile and a larger diameter than the body of the hotpoint. This permits the hotpoint to melt its way back up the pipe should ice form above it. In addition, the temperature of the core relative to the shell is thermostatically regulated, thereby temporarily protecting the heating element when the hotpoint enters air-filled sections of the pipe.
Inclinometers. Inclinations up to 26 deg were measured with. single-shot photographic inclinometers loaned by the Parsons Survey Company, South Gate, California. These instruments fit inside a watertight cylindrical aluminum case 30 mm in external diameter and 0.9 m in length which is lowered into the bore-hole pipe (internal diameter 35 mm) on a nylon hand-line to a predetermined depth (subsequently corrected for stretch in the line).
Deviations greater than 26 deg were measured with acid bottles which fit into the regular inclinometer case. Normally hydrofluoric acid was used; but on one occasion “Jello” gelatin dessert was successfully utilized. At best, acid bottles give only approximate results, because large empirically determined corrections for the rather erratic effects of the meniscus are necessary, and no indication of the direction of inclination is obtained.
Thermal anomalies
A temperate glacier (Reference AhlmannAhlmann, 1948, p. 66) is at the melting temperature throughout, except for a relatively thin surface layer transiently chilled in winter. Such a glacier is not isothermal, however, because increasing pressure with depth causes a temperature decrease of about 6 x 10⁻⁴ deg m−1. No direct measurements of temperature have as yet been made in lower Blue Glacier, but based on its environment and on observations of temperature and water content of the firn in the accumulation basins (Reference LaChapelleLaChapelle, 1959, p. 446 47), it should be temperate.
In truly temperate glaciers melt water formed by thermal boring should not refreeze, and, as expected, pipes in bore holes in the Malaspina and Blue Glaciers have remained free for days after boring ceased. Similarly, except for winter freezing near the surface, ice would not normally be expected to form inside bore-hole pipes in temperate glaciers. In fact, however, ice has formed repeatedly in bore-hole pipes, not only in Blue Glacier, but also in other presumably temperate glaciers.
Ice in bore-hole pipes. Bore holes may be drilled with the pipe wet, that is, filled with water or antifreeze solution, or dry, that is, assembled with water-tight joints and filled with air. Because of the lower pressure inside the pipe, however, any water that leaks into a dry pipe freezes. This happened in holes M1 and M2, in which the pipes were sunk dry but leaked rapidly. Within a week after drilling they were lined with 2 to 3 mm of ice, yet both were subsequently pulled to the surface, cleared, and replaced in the hole without difficulty, indicating little external freezing.
In an attempt to avoid internal freezing, holes S1, S2, and L. were drilled wet. Pipes S1 and S2 were filled with water during drilling, and 2 to 4 kg of common Table salt plus 61 of undiluted ethylene glycol antifreeze were added at the top. Pipe L was filled section-by-section with antifreeze solution (40% ethylene glycol and 60% water) as drilling progressed No ice formed in these pipes either during emplacement or for at least a week afterwards. except possibly in S2, but by the following year it had formed in S1 and S2 not only near the surface but also in irregularly distributed patches as deep as 200 m. This is far below the possible depth of penetration of winter cold, even along the highly conductive aluminum pipe. Evidently the salt and antifreeze were largely flushed from the pipes during the winter. Similar behavior has been observed by Reference Savage and PatersonSavage and Paterson (1963, p. 4522) in pipes in Athabasca Glacier.
In subsequent years ice blockages were regularly present in all the pipes, although addition of ethylene glycol was continued each year through 1960. From 1960 onward, therefore, the pipes were cleared by means of the pipe-thawing hotpoints. Despite considerable variation from pipe to pipe and from year to year, the gross pattern of blockages was fairly consistent. Down to 10 to 20 m the pipes were invariably solidly frozen, doubtless by winter cold. Below this level to about 100 to 150 m they were usually clear (except for L) At greater depths, however, they generally contained a highly irregular, discontinuous lining of ice up to a centimeter thick interspersed with apparently randomly located solid plugs. The lining was normally thickest immediately beneath the plugs, and was often entirely missing through long stretches above them. The plugs were usually one to two meters long, with sharply defined tops and ill-defined bottoms. Substantial quantities of air commonly were trapped beneath them, particularly in 1962. when far more air and much less ice were present in the pipes than in previous years.
Pipe L. consistently contained greater amounts of ice than the others. Moreover, in 1961 and 1962, but not in 1960, it began to refreeze in several places, apparently near the pipe joints, immediately after the pipe-thawing hotpoint passed, and had to be reopened daily even though the water level within it was maintained higher than the local surface of the glacier. The antifreeze placed in L in 1959 must account for the near absence of ice and lack of refreezing in 1960. If so, it must have been flushed out during the following winter, perhaps as a result of a probable break in the pipe at 78 m during that period.
The only other pipe that behaved similarly was S2, which refroze immediately after being cleared in 1960 but not in 1961 and 1962. In 1958, within a couple of days after being emplaced wet. but without antifreeze, this pipe was blocked at a depth of 77 m, presumably by ice. This is puzzling, because just a few days earlier the pipe stood undisturbed in the hole for three days while the generator was being repaired, then moved on downward normally when boring was resumed, which indicates no external seizure.
Causes of freezing in pipes. Evidently chilling by winter cold and leakage into initially dry-pipes cannot be the only causes of freezing in Blue Glacier bore-hole pipes. Although a full explanation cannot be given, three possibilities merit analysis. These are water-Table changes in the glacier, residual subfreezing zones from the ice fall, and contamination by antifreeze.
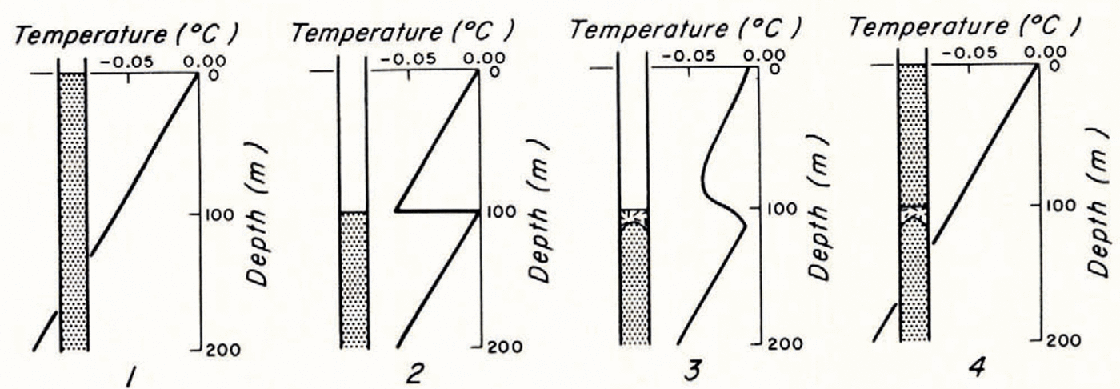
Water-Table changes. At the height of the ablation season, water level in the bore holes, and hence the water Table in the ice, lies within a few centimeters of the glacier surface. In winter, however, when cold weather cuts off the supply of melt-water, the water Table must fall to great depths. If it and the water inside the pipe fell relatively quickly to a new level and there remained steady, freezing would occur just below the new level both inside and outside the pipe by the mechanism indicated diagrammatically in Figure 3. At the same time all ice above the new level, including any previously formed higher in the pipe, would warm up to the new pressure-melting temperature. When the water Table subsequently rose, the melting required to restore the original temperature would be distributed through a large volume of ice, only a tiny fraction of which would be that just formed inside the pipe. The net effect, for a fluctuation of sufficient magnitude and duration, would be the formation of an ice plug having the observed sharply defined top and ill-defined bottom. Successive fluctuations are highly likely, and would explain the random location of the plugs and the air trapped beneath them.
Formation of ice plug in pipe as result of change in water Table. Step 1: Pipe is full of water; temperature is everywhere at pressure-melting point. Step 2: Water Table suddenly drops to 100 m; freezing of pore water raises temperature to new pressure-melting point below 100 m; presence of freezable undrained pore water above 100 m would make temperature there slightly greater than shown. Step 3: Conduction to subfreezing ice above new water Table causes freezing of flat-topped plug in pipe. Step 4: Water Table returns to old level; melting distributed throughout ice lowers temperature to old pressure-melting point without destroying ice plug.
The volume of ice formed would be approximately cΔθ/H times the volume warmed up, where Δθ is the change in temperature and c (= a kJ kg−1) deg−1) and H (= 340 kJ kg−1) are the specific heal capacity and the specific latent heat of fusion of ice. Under hydrostatic conditions Δθ would be roughly 6 x 10⁻⁴deg per meter of water-Table lowering, assuming complete drainage of the pore water. To freeze a solid plug 1 m long inside the pipe in two weeks would require a drop of about 100 m in the water-Table. An additional drop of 25 m would be required for each 10−4 m3 of undrained freezable pore water remaining in each m3 of ice. These requirements could account for the observed absence of ice at intermediate depths in the pipes. Doubling the length of the plug would require only an additional week. Water-Table changes thus appear to be a mechanism that can explain many of the observed blockages.
Residual subfreezing zones. Water-Table changes cannot, however, explain the rapid re-freezing in S2 and L while they were being cleared, unless pressures outside the pipes were almost impossibly large during some part of the year. Thus, it is necessary to consider the possibility that the lower Blue Glacier, near S2 and L, at least, is not truly temperate, but is, as our field colleagues say, somewhat “intemperate”.
The degree of “intemperance” at S2 in 1960 and at L. in 1961 and 1962 can be estimated from the maximum rate of refreezing, which was roughly 1 mm in more than 12 but less than 24 h. Adaptation of formulas given by Reference Carslaw and JaegerCarslaw and Jaeger (1959, p. 294−95, 262) leads to the formula

in which θ is the temperature of the cold ice relative to the local pressure-melting point as zero, y (= 0.5772…) is Euler's constant, κ (– 1.2 × 10⁻⁶ m2 s−1) is the thermal diffusivity of the ice, R (= 25 mm approximately) is the radius of the hole, and the small effect of the pipe has been neglected. Substituting the observed rate of refreezing gives θ between –0.19 and –0.35 deg. The temperature in the coldest parts of S2 in 1960 and of L. in 1961 and 1962 was therefore approximately –0.3°C, well below any reasonable pressure-melting effect for the depths involved.
One possibility is that these cold zones might have formed by deep penetration of winter chilling and of sub-freezing snow into the ice as it passed, highly crevassed, through the ice fall. These zones would correspond approximately to the dark-band ice of the internal ogives (Reference Allen, Allen, Kamb, Meier and SharpAllen and others, 1960, p. 609−12, 622−23; Reference Kamb and ShreveKamb and Shreve, 1963[b]). Observed surface velocities suggest that a minimum of 35 years would be required for the zones to travel the kilometer from the ice fall to S2 and L. While en route they would be thinned and tilled by longitudinal compression and the normal decrease of How velocity with depth. They would therefore have an average thickness of no more than 15 m, and hence a thermal characteristic time of less than 2 years. This means that in less than 35 years the cold zone should, for all practical purposes, be in thermal equilibrium with the intervening zones of unchilled ice.
If no pore water were present, the equilibrium temperature would be the average temperature of ice leaving the ice fall, disregarding the fraction of a degree rise due to the work done in deforming the ice. The initial temperatures of the cold zones would almost certainly be higher than the minimum monthly mean temperature at the ice fall, which may be estimated at about –6°C from data given by Reference LaChapelleLaChapelle (1965, p. 617). Thus, the lowest likely temperature in the vicinity of S2 and L is about –3°C.
The presence of pore water, even in small amounts, would raise this minimum drastically. Only 4% pore water in the intervening zones of temperate ice would provide sufficient latent heat to raise the equilibrium temperature to the pressure-melting point. The sensible heat conducted through the ice and, except near large channels such as moulins, that carried by melt water is negligible by comparison. Thus, warming of the cold zones above the average temperature of the ice leaving the ice fall is controlled primarily by the unknown small amount of pore water trapped in or percolating through the intervening temperate zones.
Direct evidence bearing on the minimum temperature of the cold zones is provided by eight holes bored to the glacier bed in 1962, 1964, and 1965 approximately 0.5 km up-glacier from S2 and L (Reference Kamb and ShreveKamb and Shreve, 1963[a], [b], 1966; Reference Shreve and KambShreve and Kamb, 1964). These holes were uncased and showed no signs of refreezing during she two to three weeks they were under observation; hence, the rate of refreezing could have been no more than 3 mm in 2 weeks. Substituting this rate into Equation (1) gives –0.05°C as the coldest possible temperature, well above the – 0−3°C found for the coldest parts of s2 and L. Thus, the possibility of significant zones of cold ice at S2 and L is vanishingly small unless winters on Mount Olympus were much colder, or crevassing in the ice fall was more extensive, or pore water in the temperate zones was less abundant during 1920−25 than during 1945−50.
Contamination by antifreeze. Another possibility is that refreezing in S2 and L was caused by leakage of antifreeze into the ice surrounding the hole followed by dilution of the antifreeze remaining in the pipes. This would account for the apparent localization of refreezing near the pipe joints. The observed rate of refreezing in pipes filled with ethylene glycol and water would occur if the volume concentration of antifreeze remaining in the pipes were only 1 percentage point less than that in the ice, that is, if it were 1% inside and 2% outside, or 9% inside and 10% outside.
Surprisingly small amounts of antifreeze in ice cause substantial drops in temperature. Suppose that pure temperate ice with initial porosity σ0 and temperature θ 0 is suddenly saturated with ethylene glycol in water at concentration E0. Melting will occur and the temperature will drop until the diluted solution attains equilibrium with the ice. Conservation of ethylene glycol, conservation of heat, and the relation between temperature and concentration respectively require that

where σ ≪ and E, σ and θ are the final concentration, porosity, and temperature, α is a constant (= 0.31 deg per per-cent ethylene glycol by volume) and c and H are the heat capacity and the heat of fusion of ice. Elimination of E and σ then gives the quadratic equation

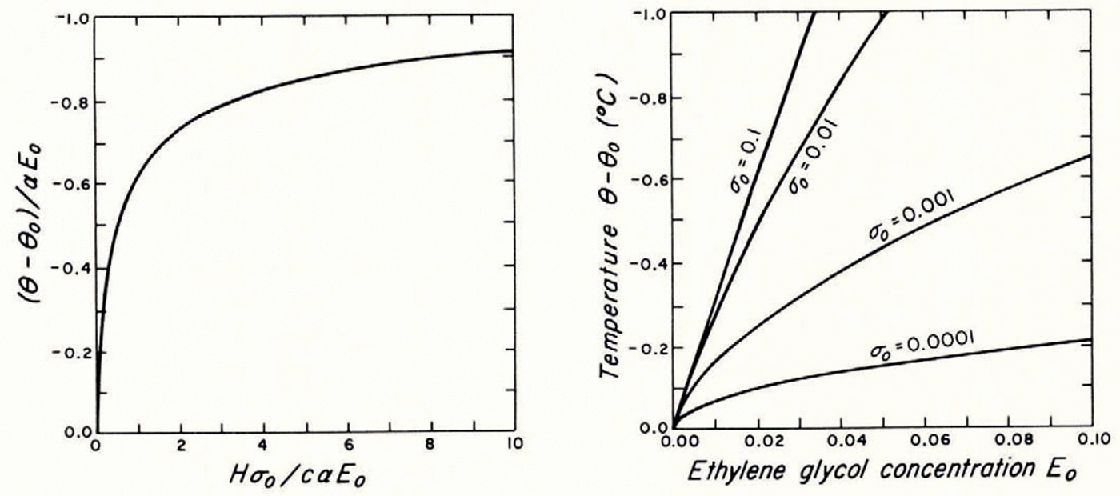
whose solution is plotted in Figure 4. If the initial porosity of the ice is 0.001, the incoming antifreeze need have a concentration of only 3% in order to cause the temperature to drop to –0.3 deg; and, if the porosity is 0.01 or more, the concentration need be only about 1% to produce the same temperature drop.
Temperature drop θ – θ 0 caused by suddenly saturating ice of porosity σ0 with antifreeze at concentration E0. Left-hand diagram: Any solute, where α a is the temperature drop at equilibrium per unit increase in concentration, and c and H are the heat capacity and heat of fusion of ice. Right-hand diagram: Curves for ethylene glycol as the solute.
Small amounts of antifreeze or other solutes, such as salt, will also cause large increases in the apparent heat capacity of the ice, particularly at temperatures near the melting point (Reference Dickinson and OsborneDickinson and Osborne, 1915, p. 67−73). Suppose an infinitesimal quantity of heat dQ per unit mass is supplied to ice of porosity σ at temperature θ which is saturated with antifreeze of concentration E Then, taking σ ≪ and differentiating (2a),

from which by eliminating dE and dσ, the apparent heat capacity ca is
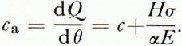
If σ were 0.001 and E were 3% ethylene glycol, so that the initial temperature were –0−3°C it would require more than three times as much heat to raise the temperature 0.1°C than if the ice were uncontaminated. If σ were 0.01 and E were 1%, it would require nine times as much.
Whether the actual permeability of the ice, leaks in the pipe, and fluctuations of the water Table are in fact sufficient to produce contamination enough to cause the observed freezing is unknown. Nevertheless, these observations and considerations together with the fact that ice flow is strongly temperature-dependent (Reference GlenGlen, 1955, p. 528−32) suggest that antifreeze should never be put into holes intended for deformation or temperature studies if there is the slightest chance that it will escape into the ice.
Interpretation of bore-hole motion
Bore holes are not wholly ideal for study of englacial deformation. The hole and the pipe affect flow of the surrounding ice; and, more important, the motion of the pipe does not generally correspond exactly to that of the ice. Because the hole changes in length as the glacier flows, the relatively inextensible pipe must slip lengthwise in it. Thus, observations of pipe motion give the two components of ice velocity perpendicular to the hole, but not the component parallel to it, so that equations giving ice deformation in terms of pipe motion will involve unmeasured quantities that must be determined separately.
Coordinates and notation. Two coordinate systems are employed. For practical reasons, field measurements are made relative to a glacier-wide system; whereas, for simplicity, mathematical analysis is done in terms of local systems. The glacier-wide coordinates are fixed relative to permanent survey points established on bedrock. The local right-handed cartesian coordinates (x, y, z) will refer to distances in meters down-glacier, downward perpendicular to the surface, and horizontally from a conveniently located origin fixed in the glacier-wide system. These coordinates are the same as those used by Reference NyeNye (1957, p. 118) and by Reference Savage and PatersonSavage and Paterson (1963, p. 4524). The x, y, and z components of the ice velocity will be denoted by u, v, and w, which in general will be functions of x, j, z, and time t. Similarly, the position and velocity of the bore hole will be denoted by x b, z b and u b, w b, which will be functions only of y and t. The velocities u b, w b correspond to the μ x, μ z of Reference Savage and PatersonSavage and Paterson (1963, p. 4525).
In the general formulas it is convenient to write xi for x, y, z, ui for u, v, w, x bα for x b, z b and xbx for u b, w b. The italic subscripts i, j, and k will assume the values 1, 2, 3, and the Greek subscripts α and β values the 1, 3. Summation over the ranges of repeated alphabetic indices will be understood, except as otherwise stated. Finally, as is customary, the Kronecker delta ∂ij equals 1 when i = j and 0 when i ≠ j
Single bore hole. Each inclinometer survey determines the inclination and azimuth of the bore hole as functions of the distance s down the pipe. Because the hole is nowhere perpendicular to the y, or x 2, axis, these functions and the coordinates x b and z b can be found as functions of y rather than s by straightforward integration, elimination of s, and transformation of axes from the glacier-wide system to the (x, y, z) system.
Let li(x 2, l) be the downward-directed direction cosines of the bore-hole axis; and let dλ(t) be an infinitesimal distance downward along the hole from a point at constant depth x 2 to a neighboring point moving with the ice. Then, in terms of the motion of the ice the velocity duλi of the neighboring point relative to the point at x 2 is
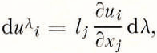
and in terms of the motion of the pipe it is

in which D/Dt, the substantive derivative, is defined by
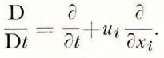
Eliminating duλi between (4a) and (4b), multiplying both sides by li, simplifying by means of the relationship lili = 1, which means liDli/Dt = 0, eliminating dλ by means of the combined Equations (4a) and (4b), and finally using Equation (4c) and the fact that the li are functions only of x 2, gives the required equations connecting the velocity derivatives and the observed inclinations,

Only two of these three equations (for i = 1, 2, 3) are independent, because only two of the direction cosines are independent. These equations are exact; but approximations will have to be made in calculating li, ∂li/∂ti and ∂li/∂x 2 from the observational data, which, of necessity, were obtained only at discrete points in time and space.
In terms of the strain rate  and the rotation rate
  Equations (5) become

The terms involving  and u 2 represent the rates of tilting as observed at a fixed depth x 2 that are caused respectively by rotation of the ice, by deformation of the ice, and by translation of the ice which carries differently tilted parts of the hole to the level of observation.
A simple illustration of the use of these equations is provided by the Jungfraufirn bore-hole experiment described by Reference Gerrard, Gerrard, Perutz and RochGerrard and others (1952) and later reinterpreted by Reference NyeNye (1957, p. 128−32). Assuming, with Nye, plane incompressible flow and uniform longitudinal strain-rate r, the derivatives and direction cosines become ∂u 1/∂x 2 = r, 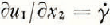 , ∂u 2/∂x 1 = 0, ∂u 2/∂x 2 = −r, l 1 = sin θ, l 2 = cos θ, l 3 = 0, and, substituting in Equation (5),

Reference Gerrard, Gerrard, Perutz and RochGerrard and others (1952, p. 554) omitted the terms involving r and v; whereas Reference NyeNye (1957 p. 130) included the term involving r but omitted the one involving r. All three terms are significant, however, particularly when the tilt and curvature of the hole become large, as shown in Figure 5.
Shear strain-rate across planes parallel to glacier surface versus depth perpendicular to surface for Jungfraufirn bore-hole experiment. Short-dashed curves: Apparent strain rate causing pipe to tilt. Long-dashed curves: Apparent strain-rate corrected for longitudinal strain-rate r – n.14 per rear, assumed everywhere uniform. Solid curves: Apparent strain rate corrected for longitudinal strain-rate and for velocity 0 if curved pipe perpendicular to surface. Curves computed using means of initial and final values for averages, taking first différences for derivatives, and assuming plane strain and velocity v = – r (h–y), where h is the depth of the ice. The large discrepancy between the two years suggests that the longitudinal strain-rate may inflict decrease with depth.
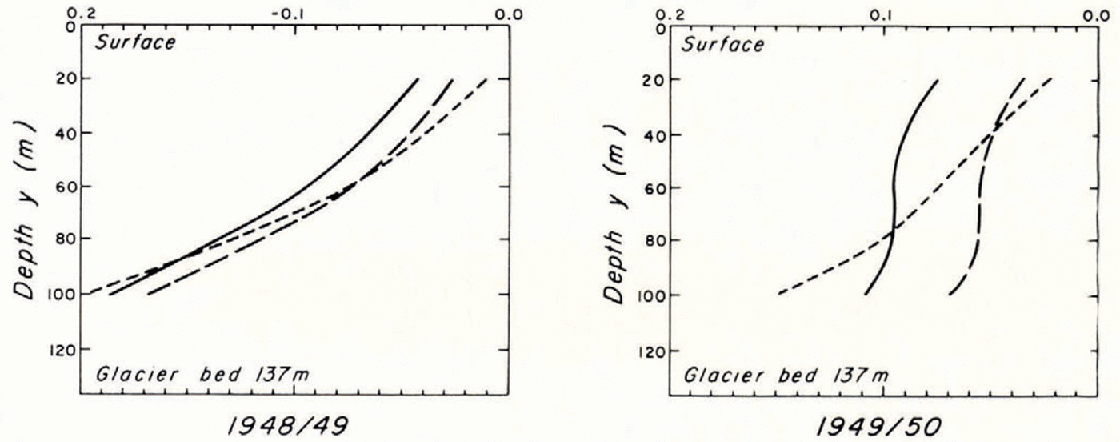
The discrepancy found by Reference NyeNye (1957, p. 131) between the average strain rates in 1948/49 and those in 1949/50 is increased by inclusion of the term involving v. A possible explanation is that, instead of being uniform, the longitudinal strain-rate decreases with depth, as observed on lower Blue Glacier and by Reference Savage and PatersonSavage and Paterson (1963, p. 4534−35) on Athabasca Glacier. Differentiating Equation (7) with respect to time and assuming  and r, and hence v, vary only with depth and not with time, leads to the differential equation

Thus in principle, if three successive surveys are made of a single bore hole, the variation with depth of v and, by substitution in Equation (8), of the longitudinal strain-rate r may be found by numerical integration if the surface value of either v or r is known. In practice. however, (he second derivatives of tan θ in Equation (8) require extremely accurate measurements of θ, particularly near the surface, where the angles change slowly. Another difficulty in the case of the Jungfraufirn bore hole is that the ice and firn in the uppermost 20 m are not incompressible (Reference Gerrard, Gerrard, Perutz and RochGerrard and others, 1952, p. 553).
The equations of Reference Savage and PatersonSavage and Paterson (1963, p. 4525) can be derived from Equation (5) by integration. The velocity u bx of the bore hole is given by
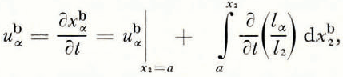
in which a is some fixed depth and the superscript b on the variable of integration indicates that the path of integration follows the bore hole. Expanding the derivative in the integrand in Equation (9a), substituting from Equation (5) to eliminate the derivatives with respect lo time, and combining and cancelling terms gives

This may be simplified by means of the chain rule,
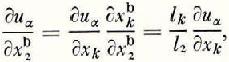
to
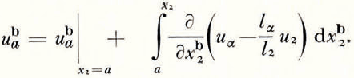
Performing the integration and eliminating the constant terms by means of the requirement that u bx = 0 when ui = 0 gives finally
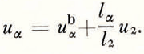
With the appropriate change of notation and time interval this result is identical to the equations of Reference Savage and PatersonSavage and Paterson (1963, p. 4525).
Reference Savage and PatersonSavage and Paterson (1963, p. 4525) state that the derivatives ∂uα/∂x 2 (in long notation, ∂u/∂y and ∂w/∂y may be determined by numerical differentiation in Tables of uα(x 2) computed from the bore-hole data by means of Equation (9e). The derivative actually determined by this procedure is ∂uα/∂xb 2 not ∂uα/∂x 2 because the symbol ui(x 2) represents the velocity of the ice at the bore hole, that is, ui(x 2) is really ui(x b1, x 2, x b3), so that changes in x 2 necessarily entail changes in x 1 and x 3, unless the hole is parallel to the x 2 axis. The correct formula is given by Equation (9c),
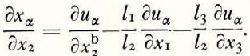
The correction terms in Equation (10) are negligibly small for Savage and Paterson's bore holes in Athabasca Glacier; but they would not be negligible for, say, initially vertical holes in steeply inclined, strongly compressing ice, as at the base of an ice fall.
Multiple bore holes. Let a, b, and c denote three bore holes located infinitesimal distances apart; and let dx abα(x 2, t) and dx acα(x 2, t) be the vectors from a point at depth x 2 on a to the points at the same depth on b and c. Then the difference between the ice velocities at the two ends of dx abα can, as in the derivation of Equation (5) be expressed independently in terms of the motion of the ice and in terms of the motion of the pipes,
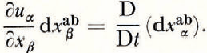
When expanded, this relationship gives two independent equations (for α = 1, 3) in the four derivatives ∂uα/∂xβ,

which can be solved for two of the derivatives, given the other two and u 2. Taking holes a and c rather than a and b gives two more independent equations identical to Equations (12) except that c replaces b. Provided the two vectors connecting the holes are not parallel or antiparallel and preferably are as nearly at right angles as possible, these Four equations are independent and, again given u 2, can be solved for all four derivatives. Alternatively, the same results can be obtained by first finding uα at the holes by means of Equation (9e) and using Equations (11) instead of (12).
In terms of the components  and
and  of the strain-rate and the rotation rate Equation (12) becomes

The terms involving , and u 2 are the rates of change in the vector from one hole to the other caused respectively by rotation of the ice, by deformation of the ice, and by translation of the ice which carries differently separated parts of the bore holes to the level of observation.
Limitations and approximations. Equations (4) through (13) are exact relationships that assume nothing about the velocity field except that it and its first derivatives are continuous. Observation of the motion of a single bore hole provides two independent relationships among v and the nine derivatives of the velocity components. With two holes an infinitesimal distance apart the number of independent relationships increases to four; and with three or more it increases to six. Thus, interpretation of bore-hole motion in terms of deformation in the ice requires independent information about v and from three to as many as seven of the velocity derivatives. Fortunately, such information is commonly available. For example, the ice can usually be assumed incompressible, in which case the velocity components satisfy the additional relationship uii = 0. As another example, the bore hole can often be placed in a position of symmetry or near-symmetry of How, so that some of the derivatives are zero or negligibly small, as perhaps best exemplified by the 1954 bore hole on Saskatchewan Glacier (Reference MathewsMeier, 1960, p. 28). Finally, some quantities can be estimated from their observed surface values in conjunction with simple geometric requirements, as in the formula

(Reference Savage and PatersonSavage and Paterson, 1963, p. 4525, 4533−34) in which subscripts s and b indicate quantities at the surface and bed respectively, h is ice depth, and α is the angle in the xy-plane from the x-axis to the glacier bed.
Although the equations are exact, they apply only approximately to real bore holes, not only because the effect of the pipe on the ice and the motion of the pipe relative to the ice are somewhat uncertain, but also because application to real bore holes requires approximation of instantaneous values by averages and of differentials by differences. This means that spatial and temporal variations in the velocity of the ice must be small in the intervals over which the averages and differences are taken. Thus, the spacing of holes and the intervals between measurements are governed by the two opposing requirements that they should be as short as possible in order to approximate the infinitesimal quantities in the theory and that they should be as long as possible in order to minimize the effects of measurement errors.
Deformation
Unfortunately, the number and pattern of ice blockages and pipe breakages in the Blue Glacier bore holes make it impossible to realize fully the advantages originally intended in the placement and depth of the holes and in the long period of observation, Hole B, for example, was drilled at the initial location of S2 to provide independent measurements of deformation three years apart at the same points in space; but blockage of S2 by ice in 1959 and of B by a jammed cable in 1962 prevented any comparison. Other similar examples can be inferred from Table II. Nevertheless, the data available are sufficient to demonstrate certain real and artificial anomalies in the deformation, to delineate the spatial variation of the longitudinal strain-rate, and to elucidate the flow law of the ice in the vicinity of the Blue Glacier bore holes.
Estimates and computations. The computations were carried out by means of a computer program which was tested using artificially generated data. For computations involving a single hole the origin of the local coordinates was placed at the point, here termed the surface point, where the hole intersected the surface in the first year, and the x-axis was directed through (he position of the surface point of the same hole in the second year. For computations involving a pair of holes, on the other hand, the origin was placed at the position of the surface point of one of the holes in the first year, and the x-axis was directed through the position of the surface point of the other hole in the same year. Observed angles, distances, and glacier-wide coordinates were converted to direction cosines and, using trapezoidal integration, coordinates in the local system. These were then substituted into the equations using linear interpolation where necessary, means of initial and final values for averages, and first differences for derivatives. The vertical components of velocity v and strain-rate ∂v/∂y were calculated from Equations (14) taking v s between zero and –2 m/year (measured, using a more exact value makes negligible difference in the final results), v b = 0, and h = 250m (Reference CorbatóCorbató, 1965, p. 648). The horizontal bend in the flow lines was taken into account by making ∂u/∂z = – ∂w/∂x = –0.03 per year (Figure 1). The longitudinal strain-rate ∂u/∂x was then computed from Equations (12) and the transverse strain-rate ∂w/∂z from the assumption of incompressibility. The remaining four derivatives ∂v/∂x ∂v/∂z, ∂u/∂y and ∂w/∂y were then calculated by solving Equation (5) assuming ∂v/∂x and ∂v/∂z constant with depth and adjusting them so as to make the shear strain-rate components  and
and  at the surface. Finally, the six independent components of the strain-rate tensor were calculated from their definitions in terms of the nine velocity derivatives.
Anomalous deformations. Several apparent anomalies in deformation were directly traceable to gross errors in the inclinometer readings. These were usually due to wrong compass bearings apparently caused by sticking of the needle on its pivot. Such readings were discarded if they were isolated and could be checked by interpolation or extrapolation against observations from two other years. An example that was not discarded is shown in Figure 6. In the plot of annual displacement in the x-direction against depth y the curves for 1960/61 and 1961/62 swing in opposite directions at a depth of approximately 55 m. This suggests the possibility that a bad reading was taken in 1961 at about this depth. In this case the anomaly could not be eliminated by discarding only a single reading, perhaps because of additional errors introduced by the unavoidable use of acid bottles at this depth in 1962.
Average ratle of displacement of bore hole L at depth, relative to surface point. Origin of coordinates at position of surface point in first year of observations; x-axis directed through position of surf ace paint in second year. Rates of displacement calculated by subtracting velocity of surface point from velocities of points at given depths. Sideward displacement near surface in 1959/60 and 1960/61 is due to initial placement of hole on side of low ridge on glacier. Other waviness in curves probably is due to errors in inclinometry and is typical of all the holes. Dashed portions of curves indicate depths at which azimuths are unknown became acid bottles were used in 1962. Curves are plotted within 0.05 m/year of points calculated at 5 m intervals in depth.

Other anomalous waviness in the curves in Figure 6, particularly evident in the xz projection because of foreshortening, is doubtless due to chance fluctuations in accumulation of the normal small random errors in placement, operation, and reading of the inclinometer. Similar errors in location of the surface points of the holes would not affect Figure 6 but could cause erroneous longitudinal strain-rates. Reference Savage and PatersonSavage and Paterson (1963; Reference Paterson and SavagePaterson and Savage, 1963[a]) have discussed both kinds of error in detail. In as much as their field equipment and methods were almost identical to those used on Blue Glacier, the errors in the results should be about the same.
One anomaly shown in Figure 6 is real, however, and is peculiar to hole L. This hole, unlike the others, was drilled on the east slope of an elongate ridge on the glacier surface (not well shown in Figure 1). Thus, the surface slope, and hence the shearing of the hole near the surface, at the initial position of L was in a direction roughly 45° to the right, looking down-glacier, of the direction of the surface flow lines, which are only slightly influenced by such a local feature. By 1961 L had been carried into relatively level ice. These circumstances are most clearly reflected in the xz projection in Figure 6.
Hole L is the only one surveyed twice to near the bed. Tn 1959/60 (he velocity of flow 100 m perpendicularly below the surface and 10 m above the bed was 18.3 meters per year, compared to 32.5 meters per year at the surface. Thus, 56% of the surface velocity was caused by deformation in the basal 10% of the ice and by sliding on the bed.
Longitudinal strain-rate. The pairs M1–M2, S1–S2, and S2–B were intentionally placed to permit direct measurement of longitudinal strain-rates at depth (Figure 7). The only comparable measurements are those of Reference Savage and PatersonSavage and Paterson (1963, p. 4523, 4534−35) on Athabasca Glacier. Although the strain-rates measured on Blue Glacier are small, and hence subject to relatively large observational errors, their consistency both within and between pairs of holes over the five years suggest that the trends shown are real. Moreover, trials with artificial data demonstrate that these trends are not artifacts of the data-reduction process.
Variation of longitudinal strain-rate with depth. Extensional strain-rates are positive. Strain-rate becomes more compressional at depth because glacier bed becomes more steep-sided and flat-bottomed in down-glacier direction in region of bore holes. Curves are plotted within 0.005 per year of points calculated at 5 m intervals in depth.
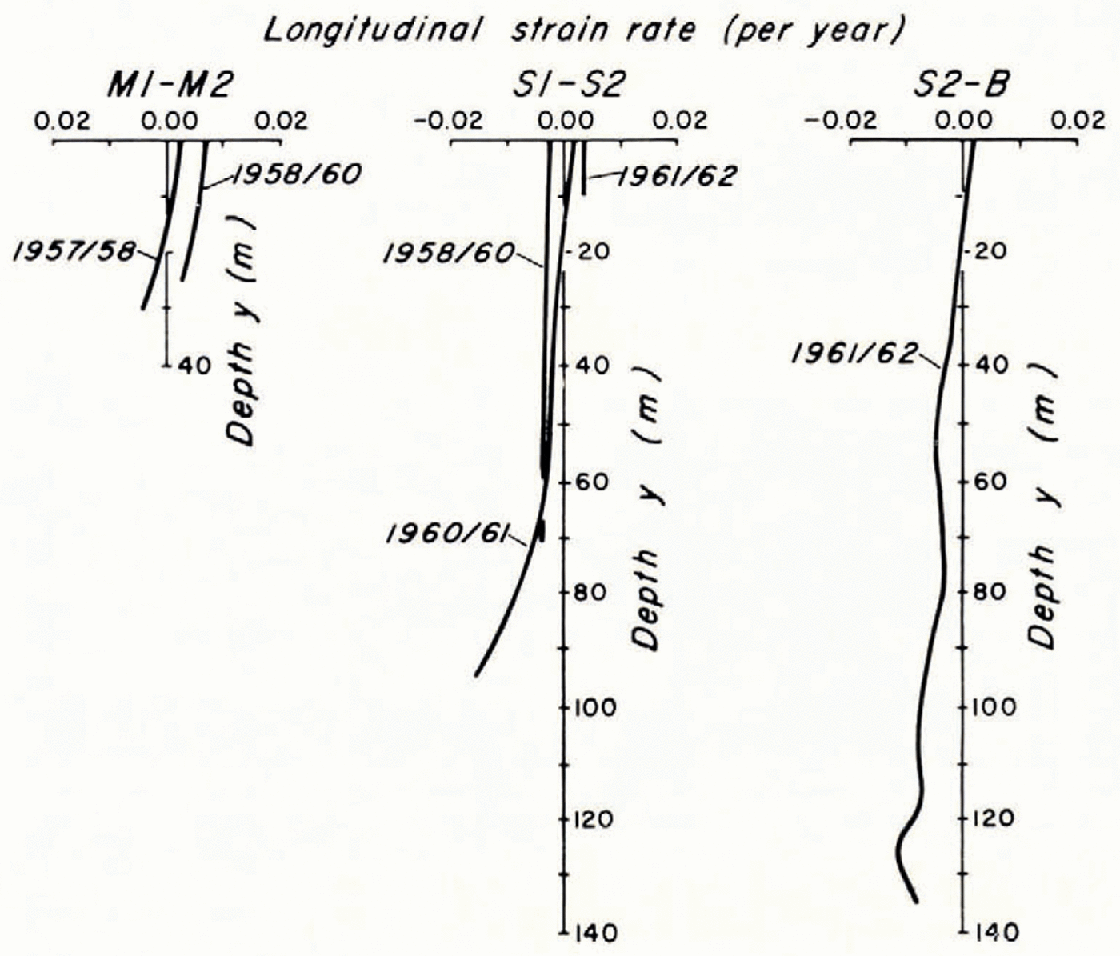
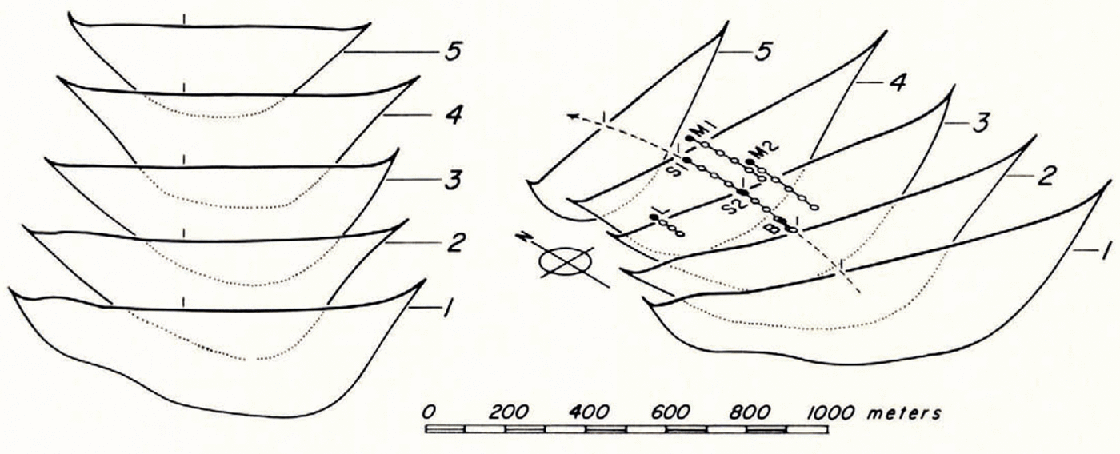
Figure 7 shows that in the vicinity of the bore holes the longitudinal strain-rate at the surface becomes more extensional down-glacier. This agrees with the fact that the holes were drilled in a gentler reach between two slightly steeper ones (Fig. 1). Furthermore, in all cases the longitudinal strain-rate becomes more compressional at depth. Inasmuch as the ice is essentially incompressible and the vertical strain-rate  in the area of the bore holes, as estimated from Equation (14), is almost certainly between zero and 0.01 per year, the transverse strain rate
  must become more extensional at depth. This agrees with the fact that the cross-section of the glacier bed in the region of the bore holes becomes slightly more steep-sided and flat-bottomed down-glacier (Figure 8). Thus, the observed longitudinal strain-rates accord with the geometry of the glacier.
Transverse cross-sections of glacier in region of bore holes. Left; Successive cross-sections bused on conclusions of Reference CorbatóCorbotó (1965, p. 648). Rigid: Isometric view showing relative positions of cross-sections and bore holes. Arrow shows direction of flow.
Flow law of ice. On the basis of experiments byReference GlenGlen (1952, p. 113; see also 1955; 1958), Reference MillerNye (1953, p. 478−80) has suggested that to good approximation glacier ice is isotropic and incompressible and deforms according to the flow law

in which n and A are constants, the effective strain-rate  is given by
  and the effective shear stress τ by τ 2 = ½τijτij where
  and τij are the strain-rate and deviatoric-stress tensors and, as before, summation from 1 to 3 over repeated italic subscripts is understood.
Under these assumptions corresponding components of and τ ij are proportional, that is,

(Reference MillerNye, 1953, p. 478), where μ is the viscosity of the ice. Substituting in Equation (15a) and taking logarithms shows that under this flow law μ varies with according to the equation

Thus, Nye's generalization of Glen's results requires that points on a log-log plot of viscosity as a function of effective strain-rate will lie on a straight line of slope –(n–1)/n
If ice were Newtonian viscous, that is, if μ were independent of strain-rate, n would be 1, the straight line would be horizontal, and A would be twice the viscosity. If, on the other hand, ice were perfectly plastic, n would be infinite, the line would slope downward to the right at 45°, and A would be the yield stress. The actual behavior of ice undergoing glaciological strain-rates is intermediate between these two extremes; laboratory experiments (Reference GlenGlen, 1952, p. 113; 1955 P· 528, 530; 1958, p. 260; Reference Butkovich and LandauerButkovich and Landauer, 1958, p. 322) and glacier observations (Reference Gerrard, Gerrard, Perutz and RochGerrard and others, 1952, as reinterpreted by Reference NyeNye, 1957, p. 128−32; Reference MillerNye, 1953, p. 485, 486; Reference LangwayMathews, 1959, p. 453; Reference MathewsMeier, i960, p. 43−45; Reference Paterson and SavagePaterson and Savage, 1963[b], p. 4542), including those from Blue Glacier (Fig. 9, which supersedes the preliminary results previously published by Reference ShreveShreve, 1961, p. 531), give values of n of the order of 3 to 4.
Viscosity versus effective strain-rate. Symbols: Calculated at 5 m intervals far depths and years for which longitudinal strain-rates either known or negligible. Athabasca Glacier: Temperate or near-temperate, n = 4.2 (assumed), A = 2.1 bar yeart/n (Reference Paterson and SavagePaterson and Savage 1963[b], p. 4541−42). Glen's experiments: -0.02°C, n = 4.2, A = 1.6 bar yeart/n·(Reference NyeNye, 1957, p. 129). Tunnel contraction: −0.8 to 0.0°C, n = 3.07, A = 1.77 bar yeart/n" {Reference MillerNye, 1953,p. 485). Blue Glacier; Probably temperate, n = 3.3, A = 1.2 bar yeart/n, line fitted by eye.
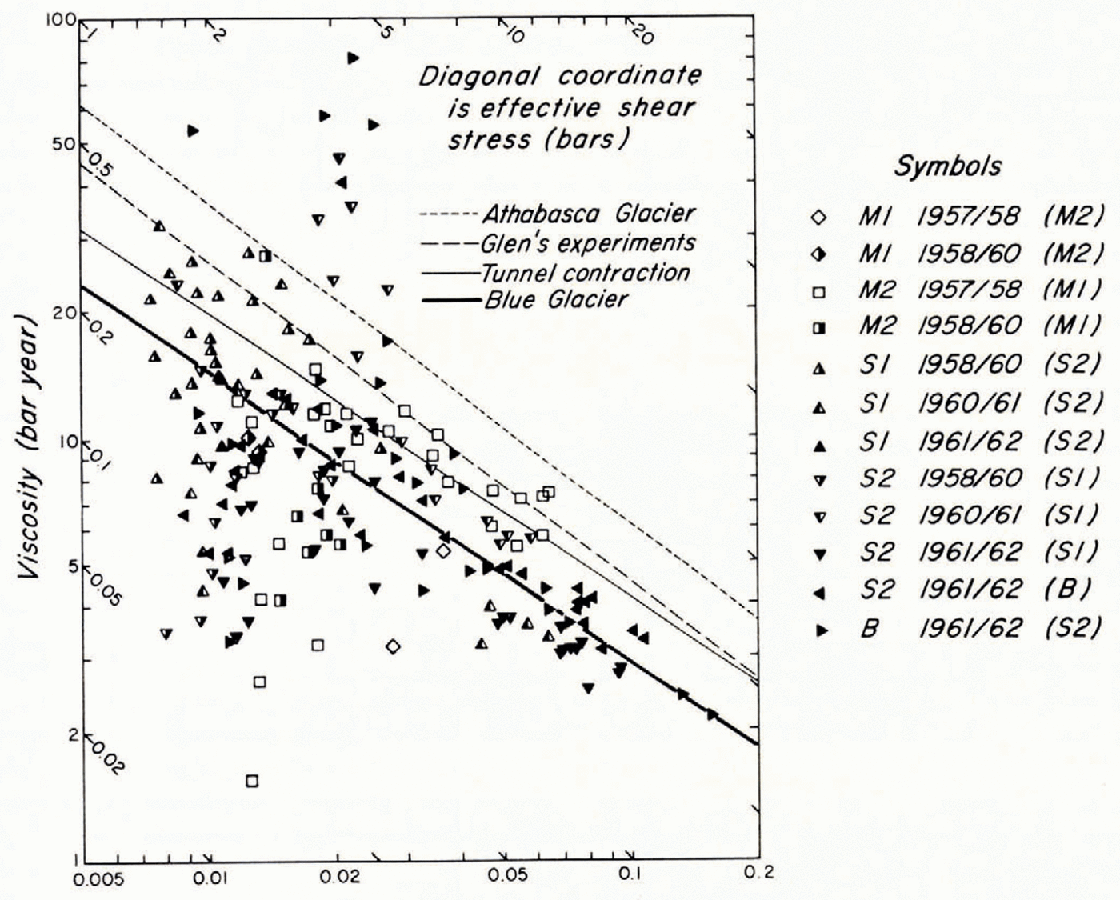
The unconventional procedure of plotting viscosity, rather than effective shear stress, against effective shear strain-rate was introduced by Reference Kamb and ShreveKamb and Shreve (1966) because it requires estimates of a minimum of unobserved quantities. The viscosity plotted in Figure 9 was computed from Equation (15b) using τ 12 and  , which are the components that can be determined most accurately. The other components of the stress, which cannot ordinarily be independently estimated, are not needed.
The stress τ 12 was estimated from the approximate relationship (Reference Paterson and SavagePaterson and Savage, 1963[b], p. 4539)

where ρ(= 9 × 10² kg m−3) is the density of ice, g (= 9.8 m s−2) is the acceleration due to gravity, α s is the slope of the glacier surface, and a, b, and h are the area, the perimeter in contact with the bed, and the maximum depth of a transverse cross-section of the glacier in the vicinity of the bore holes. The “shape factor” C (= 0.56 for the Blue Glacier holes) is an adaptation of the engineering concept of hydraulic radius in open-channel flow; it reduces to the correct value in the two special eases for which the stress is known theoretically, namely, the infinitely wide plane bed (C = 1) and the semicircular cylindrical bed (C = 1/2).
A straight line fitted by eye to the points in Figure 9 gives n = 3.3 and A = 1.2 bar year1/n. These values are no more than rough estimates, however, not only because of the large scatter in the data but also because of the way random measurement errors are reflected on the diagram. First, because the plot is logarithmic, equal deviations from the best line represent equal relative, rather than absolute, errors, whereas the actual absolute errors probably increase with increasing strain-rate much less than proportionally. Second, because both viscosity and effective strain-rate are functions of  , errors in the two quantities are correlated; at low effective strain-rates, in which the longitudinal strain-rate is dominant, errors
  in displace points vertically above or below the best line, whereas at high rates, in which
  is dominant, they displace them at 45°, nearly parallel to the best line. Both effects combine to cause the apparent decrease in scatter with increasing strain-rate in Figure 9.
The results of other investigations are included in Figure 9 for comparison with those from Blue Glacier. In the range of strain-rates covered the lines all have similar slopes, but the viscosities found for Blue Glacier are about half those found in the other studies. This discrepancy could be caused by differences in the methods used to reduce the observations and to estimate the stresses, by differences between the actual behavior of ice and the How law embodied in Equation (15) (Reference GlenGlen, 1958, p. 261), or by differences in the temperature, texture. fabric, foliation, and purity of the ice (Reference MillerNye, 1953, p. 487). Considering the large uncertainties involved in most of these possibilities, the discrepancy does not seem serious.
Acknowledgements
The National Science Foundation provided the principal financial support for this study. The University of California, Los Angeles, furnished additional support; and the UCLA Campus Computing Network granted the necessary computing time on its IBM 360/75. The National Park Service graciously gave permission for work on the glacier, and personnel of Olympic National Park aided the project in numerous ways. The late William R. Fairehild, of Angeles Flying Service, Port Angeles, Washington, an extraordinarily courageous and skillful pilot, provided superb logistical support. William Parsons, of the Parsons Survey Company, South Gate, California, kindly supplied inclinometers. Curtis Bauman and Charles R, McKinney gave valuable help in the design and construction of hotpoints. Clarence R. Allen contributed both unpublished seismic survey data and much selfless personal effort to the project. Our field colleagues, too numerous to mention individually, unstintingly spent many hours, often under cold, wet, windy conditions, helping with the hotpoint drilling, the theodolite observations, and the inclinometer surveys



