1 INTRODUCTION
Among the ~ 200 known low-mass X-ray binaries (LMXBs; Liu, van Paradijs, & van den Heuvel Reference Liu, van Paradijs and van den Heuvel2007) that consist of a compact star (either a neutron star or a black hole) accreting via a disk from a low-mass Roche-lobe-filling companion, there is a class called ultra-compact binaries. Unlike the majority of LMXBs, in which the companions are ordinary, hydrogen-rich stars, the companions in ultra-compact binaries have extremely low mass and are hydrogen-poor and/or degenerate (Nelson, Rappaport, & Joss Reference Nelson, Rappaport and Joss1986; Yungelson, Nelemans, & van den Heuvel Reference Yungelson, Nelemans and van den Heuvel2002). While there is a minimum orbital period around 80 min set by the size of a Roche-lobe-filling companion for ordinary LMXBs (Paczynski & Sienkiewicz Reference Paczynski and Sienkiewicz1981; Rappaport, Joss, & Webbink Reference Rappaport, Joss and Webbink1982), ultra-compact binaries can evolve to ultra-short orbital periods of few minutes (Podsiadlowski, Rappaport, & Pfahl Reference Podsiadlowski, Rappaport and Pfahl2002; Nelson & Rappaport Reference Nelson and Rappaport2003). The ultra-compact LMXBs represent an extreme outcome of stellar and binary evolution. They may be a significant source of low-frequency gravitational waves (e.g., Nelemans, Yungelson, & Portegies Zwart Reference Nelemans, Yungelson and Zwart2001; Ruiter et al. Reference Ruiter, Belczynski, Benacquista, Larson and Williams2010), are likely progenitors of ‘black widow’ pulsar systems (e.g., Benvenuto, De Vito, & Horvath Reference Benvenuto, De Vito and Horvath2014), and may end up like PSR J1719–1438, a pulsar with a high-density, planet-mass companion (Bailes et al. Reference Bailes2011).
Most of the known ultra-compact binaries were discovered directly from orbital signals in their X-ray emission (e.g., van Haaften, Voss, & Nelemans Reference van Haaften, Voss and Nelemans2012; Cartwright et al. Reference Cartwright, Engel, Heinke, Sivakoff, Berger, Gladstone and Ivanova2013; and references therein). Indirect evidence, such as X-ray and/or optical spectral features (Juett, Psaltis, & Chakrabarty Reference Juett, Psaltis and Chakrabarty2001; Nelemans et al. Reference Nelemans, Jonker, Marsh and van der Klis2004; Wang Reference Wang2004) or low optical-to-X-ray flux ratios (Deutsch, Margon, & Anderson Reference Deutsch, Margon and Anderson2000; Bassa et al. Reference Bassa, Jonker, in’t Zand and Verbunt2006; in’t Zand, Jonker, & Markwardt Reference in’t Zand, Jonker and Markwardt2007), has also led to a number of candidate ultra-compact systems. For such candidates, we still require verification of their ultra-compact nature through detection of some periodic modulation. With that, the properties of the binary systems can then be determined (e.g., Wang & Chakrabarty Reference Wang and Chakrabarty2004). The modulation need not be of X-rays: in an ultra-compact binary, the companion star is tidally locked such that rotation is synchronous with the orbit. As a result, the inner surface of the companion is heated by strong X-ray emission from the central compact star, and as the visible area of the heated surface varies as a function of orbital phase, both potentially resulting in orbital modulation of the optical flux.
We thus have conducted time-resolved imaging observations of several candidate systems. The orbital periods of the LMXBs 4U 1543–624 and 2S 0918–549 were reported previously (Wang & Chakrabarty Reference Wang and Chakrabarty2004; Zhong & Wang Reference Zhong and Wang2011), with both candidates initially identified on the basis of their X-ray spectral features by Juett et al. (Reference Juett, Psaltis and Chakrabarty2001). In Wang & Chakrabarty (Reference Wang and Chakrabarty2004), the orbital period of 4U 1543–624 was determined to likely be 18.2 min, revealed by the flux modulation with a fractional semi-amplitude of 8% at optical r′ band. However, this periodicity has not been confirmed through independent observations. Given that X-ray binaries are often highly variable, we wished to ascertain whether the 18.2 min period identified previously was in fact the orbital period, or if it was some other temporary modulation of the stellar brightness. We therefore carried out a second epoch of time-resolved photometry of the binary in 2008, for the purpose of confirming the periodicity and examining the stability of the modulation. In this paper, we report the results from our observation.
2 OBSERVATION AND DATA REDUCTION
The optical imaging observation was carried out on 2008 July 24, using the Raymond & Beverly Sackler Magellan Instant Camera (MagIC) on the 6.5-m Magellan/Clay telescope at Las Campanas observatory in Chile. Unlike most MagIC observations, we used a new CCD detector for these observations that had a very fast readout to maximise observing efficiency. The detector was a 1024 × 1024 pixel E2V CCD, offering a field of view of 40 arcsec with a pixel scale of 0.037 arcsec per pixel. A Sloan r′ filter was used for imaging. In total, we obtained 121 × 60s images of the 4U 1543–624 field. The total time span was approximately 140 min. During the observation, the seeing conditions were not stable, varying from ≃ 0.55 arcsec in the beginning to ≃ 0.75 arcsec at the end of the observation.
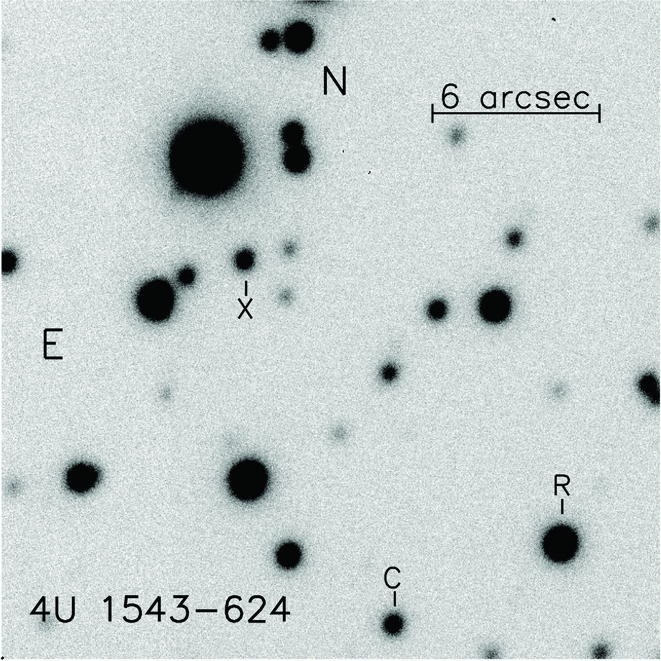
For the reduction of the data, we used standard procedures within iraf. The raw images were bias subtracted and flat-field corrected. Magnitude measurements of the target and nearby sources were obtained using the point spread function (PSF) photometry tasks from iraf's daophot package. An example image is shown in Figure 1. In order to eliminate any systematic variations, we used differential photometry relative to a non-variable, bright star (star R in Figure 1). We also examined another non-variable star which has a similar brightness to that of 4U 1543–624 to verify our results (the same star, star C in Figure 1, as was used in Wang & Chakrabarty Reference Wang and Chakrabarty2004). No standard stars were observed during the night. For flux calibration, we analysed r′ images of the X-ray binary SAX J1808–3658 taken on the same night, and used a few isolated stars in the field with calibrated photometry from the Gemini South Telescope observations that were reported in Wang et al. (Reference Wang, Bassa, Cumming and Kaspi2009).
r′-band image of the 4U 1543–624 field. The X-ray binary target, check star, and bright reference star are marked by X, C, and R, respectively.

3 RESULTS
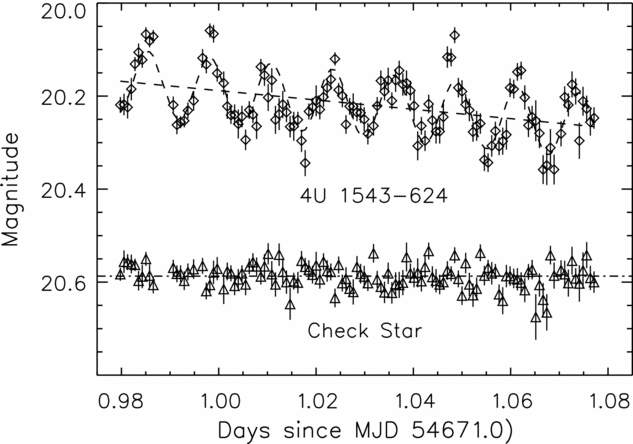
The final r′-band light curve of 4U 1543–624 is shown in Figure 2. For a comparison, the light curve of the check star is shown in the same figure. As can be seen, periodic flux modulation from the LMXB is clearly visible. The amplitude was approximately 0.1 mag: highly significant compared to a rms deviation of 0.026 mag of the light curve of the check star. In addition, a downward trend appears in the light curve of the binary.
Optical r′ light curve of 4U 1543–624. Periodic modulation is clearly visible. For a comparison, the light curve of an in-field check star is also shown. The best-fit function of a sinusoid plus a linear decay is shown as the dashed curve, and the linear decay is indicated by the dashed line.
Since the modulation is sinusoidal-like (see also Wang & Chakrabarty Reference Wang and Chakrabarty2004), we first used a simple sinusoid to fit the light curve. A systematic uncertainty of 0.026 mag, the standard deviation of the light curve of the check star, was added in quadrature with the photometric uncertainties. The best-fit was found to have χ2 = 197 for 117 degrees of freedom (DoF) at period P = 18.32 ± 0.09 min. Then, a linear function was added to the sinusoid, which gave a much improved χ2 = 123 for 116 DoF. From this, we conclude that the linear trend is highly significant. The best-fit parameters are P = 18.20 ± 0.09 min, semi-amplitude mh = 0.070 ± 0.004 mag, and a linear decay of 7.0 ± 0.8 × 10⁻⁴ mag min−1. The best-fit function and the linear decay component are shown in Figure 2.
After the downward trend was removed, the data were folded at the best-fit period of P = 18.20 min. The final folded light curve is shown in Figure 3. As can be seen, although there are several outliers, probably due to either intrinsic flux variations or photometry under the unstable observing conditions, the overall light curve shape is symmetric and well described by the sinusoid. The time at the maximum of the sinusoidal fit (phase 0.5) was MJD 54671.00545 ± 0.00028 (Dynamical Time) at the solar system barycentre.
Top panel: The folded r′-band light curve of 4U 1543–624 after the downward trend was removed. The (blue) dashed curve represents the best-fit sinusoid (χ2 = 123 for 116 DoF). The (red) dotted curve is an example of the model fit when d = 10 kpc and i = 82° (χ2 = 142 for 118 DoF). Bottom panel: The residuals of the observed data points from the best-fit sinusoid. For clarity, two cycles are shown.
4 DISCUSSION
From our time-resolved photometry, we have confirmed the presence of the sinusoidal modulation in optical emission of 4U 1543–624, which was previously reported by Wang & Chakrabarty (Reference Wang and Chakrabarty2004). The best-fit period is 18.20 ± 0.09 min, the same as that previously obtained in 2003 August. The semi-amplitude was 0.07 mag, slightly lower than in 2003, but consistent within the uncertainties. Such stability over five years strongly supports the orbital origin for the modulation, indicating that this is in fact an ultra-compact binary. Unfortunately, the uncertainty on the period is large, approximately 0.5%, preventing us from phase-connecting the two light curves; otherwise a more accurate periodicity could be obtained (see, e.g., Wang et al. Reference Wang, Breton, Heinke, Deloye and Zhong2013).
During our observation, we have also detected a brightness decay of ~ 0.1 mag over 2.3 h. The average magnitude was from 20.17 mag in the beginning of our observation to 20.27 mag at the end, with an absolute uncertainty of 0.04 mag from flux calibration. Comparing to the average magnitude of 20.42 mag in 2003, the source was 0.15–0.25 mag brighter in 2008. If the downward trend had continued, the binary would have been back to 20.42 mag in another 4 h. However, this decay was not seen before, and could be related to the accretion activity in the binary system. Many ultra-compact binaries are known to exhibit substantial X-ray flux variations (Cartwright et al. Reference Cartwright, Engel, Heinke, Sivakoff, Berger, Gladstone and Ivanova2013) which would have consequent changes for the flux of the irradiated companion (although no strong X-ray variability has been reported for 4U 1543–624). We thus checked the X-ray data of the binary, taken by the All Sky Monitor onboard the Rossi X-ray Timing Explorer over the time of our optical observation, but did not find any evidence for significant X-ray variability. We also note that it is possible to have a systematic variation in the optical brightness of an ultra-compact LMXB at a time scale different than the binary period, without any accompanying change in the X-ray intensity (e.g.,Chakrabarty et al. Reference Chakrabarty, Homer, Charles and O’Donoghue2001).
The sinusoidal-like orbital modulation arises because of X-ray heating of the inner surface of a companion star in an LMXB. The modulation amplitude partly depends on binary inclination i and the temperature of the heated surface (e.g., Arons & King Reference Arons and King1993), and thus light-curve fitting can provide constraints on the parameters of a binary system, such as i and source distance d (see, e.g., Wang et al. Reference Wang, Breton, Heinke, Deloye and Zhong2013). However, in order to fully explore the allowed parameter space for a binary and determine the parameters with certainty, simultaneous multi-band light curves are needed, as the multiband flux measurements can help establish the temperature range for the heated surface, which would constrain source distance in a certain range. Given the single band of photometry for 4U 1543–624, we were only able to explore possible values for i by using a simple analytic model proposed by Arons & King (Reference Arons and King1993). Below we provide the estimation of the temperature for the heated surface of the companion and the light-curve fitting in Section 4.1.
The values of i obtained from the fitting strongly depend on d, which is uncertain. Wang & Chakrabarty (Reference Wang and Chakrabarty2004) estimated d ~ 7 kpc by assuming that mass transfer in the binary is driven by gravitational radiation. Recently, Madej et al. (Reference Madej, Garcia, Jonker, Parker, Ross, Fabian and Chenevez2014) have pointed out that this binary could be in an ultra-luminous state (Gladstone, Roberts, & Done Reference Gladstone, Roberts and Done2009), because of its spectral similarities to other ultra-luminous X-ray sources. If this were the case, the binary would be accreting near the Eddington limit and would be at a distance of 30–40 kpc: well out in the Galactic halo. However, we show below in Section 4.2 that the binary properties are largely inconsistent with such a large distance when considering the flux of both the companion star and the accretion disk.
4.1 Light curve fitting
The companion star in the binary was estimated to have mass M 2 ≃ 0.03 M ⊙ and radius R 2 ≃ 0.03 R ⊙ (Wang & Chakrabarty Reference Wang and Chakrabarty2004). The effective temperature of the heated side of the companion is estimated as the following. Cartwright et al. (Reference Cartwright, Engel, Heinke, Sivakoff, Berger, Gladstone and Ivanova2013) obtained a luminosity range (2–10 keV) of 4.6–6.8 × 1036d 27 erg s−1 for this binary, where d 7 is the source distance in units of 7 kpc, and Madej et al. (Reference Madej, Garcia, Jonker, Parker, Ross, Fabian and Chenevez2014) derived a slightly higher but similar luminosity (0.1–10 keV) of 7.6 × 1036 erg s−1 from their 2012 Chandra observation. We used the latter value as the source luminosity. The binary separation is Db ≃ 1.8 × 1010 cm for an orbital period P = 18.2 min and a neutron star mass M ns = 1.4M ⊙. The fraction f of the X-ray photons received by the companion is f = (R 2/Db)2/4 ≃ 0.004. The effective temperature of the heated side is T = [f(1−η*)L X/πR 22σ]1/4, where σ is the Stefan–Boltzmann constant and η* is the albedo of the companion. The value for the latter is often assumed to be 0.5 (e.g., Arons & King Reference Arons and King1993), and thus T ≃ 64,100d 1/27 K, which we used in the following calculations. Because of uncertainties on the X-ray flux (although it is relatively stable; Cartwright et al. Reference Cartwright, Engel, Heinke, Sivakoff, Berger, Gladstone and Ivanova2013), the masses of the binary, and the albedo, the temperature value is rather uncertain. We found that η*, which can have values of 0.6–0.8 based on the results from modelling of emission from irradiated companions in radio pulsar binaries or LMXBs (e.g., see Stappers et al. Reference Stappers, van Kerkwijk, Bell and Kulkarni2001; Reynolds et al. Reference Reynolds, Callanan, Fruchter, Torres, Beer and Gibbons2007; Wang et al. Reference Wang, Breton, Heinke, Deloye and Zhong2013), causes the largest changes in T. For example, when η* = 0.8 (Wang et al. Reference Wang, Breton, Heinke, Deloye and Zhong2013), T ≃ 51 000 K, indicating ~ 20% uncertainty on T.
This is higher than the effective temperatures of most non-degenerate stars, but hot white dwarfs can have effective temperatures as high as 2 00 000 K, and at least 100 hydrogen-atmosphere white dwarfs have effective temperatures > 60 000 K (e.g., see the review by Sion Reference Sion2011). Despite its very low mass in comparison with the typical hot white dwarf, the surface properties of the companion to 4U 1543–624 may otherwise be quite similar.
As the visible area of the heated side varies as a function of the orbital phase, a modulation of f *[1 + sinisin(2πt/P)] arises, where t is time and f *∝(R 2/d)2T 3 is the flux from the irradiated side of the companion (see Arons & King Reference Arons and King1993 for details). We then added a constant flux component fc to account for the constant emission from the accretion disk, and assumed that the temperature of the non-irradiated side of the companion was 3 000 K, which is a value found from fitting optical light curves of very low-mass companions in pulsar binaries (see Stappers et al. Reference Stappers, van Kerkwijk, Bell and Kulkarni2001; Reynolds et al. Reference Reynolds, Callanan, Fruchter, Torres, Beer and Gibbons2007; note that emission from this cold side is negligible comparing to that from the accretion disk and the heated side). The modulation amplitude is then given by (f *sini)/(fc + f *) (Arons & King Reference Arons and King1993). In order to reproduce the observed modulation, d (since f *∝T 3d −2∝d −1/2), i, and fc are key parameters to be considered.
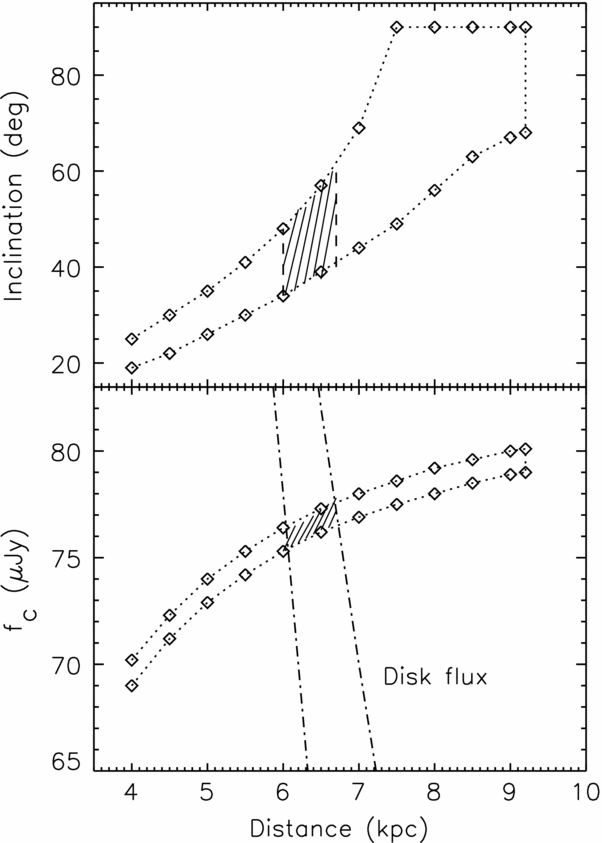
The hydrogen column density to the source is N H = 2.4 × 1021 cm−2 (Madej et al. Reference Madej, Garcia, Jonker, Parker, Ross, Fabian and Chenevez2014), which gives the extinction AV ≃ 1.34 (AV = N H/1.79 × 1021 cm−2; Predehl & Schmitt Reference Predehl and Schmitt1995), or A r′ = 1.13 (Schlegel, Finkbeiner, & Davis Reference Schlegel, Finkbeiner and Davis1998). We fit the dereddened light curve of 4U 1543–624 to obtain constraints on i and fc. The average magnitude was taken to be 20.22 mag (obtained from the linear decay component at the mean observing time of MJD 54672.02991): changing this slightly to account for the linear decay would shift fc up or down fractionally by the same amount (see the bottom panel of Figure 4). The fitting was very degenerate with distance, with a range of distances all having similar best-fit χ2 values (the minimum χ2 ≃ 124 for 118 DoF) up to d = 9.2kpc, beyond which no good fits could be obtained. The resulting i and fc value ranges (90% confidence) as a function of d are shown in Figure 4. The best-fit model light curve is virtually identical to the sinusoidal fit in Section 3, and thus is not displayed in Figure 3. From the fitting, we found that i is sensitive to distance, ranging from 19°–25° at 4 kpc to 63°–90° at 8.5 kpc, but fc remains in the range 70–80 μJy. When d > 8.5 kpc, the binary system is required to be nearly edge-on. The large χ2 values indicate that d ⩾ 10 kpc is extremely unlikely. In Figure 3, an example of the model light curves at d = 10 kpc is shown for comparison.
Derived value ranges at a 90% confidence level from light curve fitting (marked by diamonds and dotted curves) for inclination i (top panel) and constant disk flux fc (bottom panel) as a function of distance d, where η* = 0.5 was used (i.e., T ≃ 64,100d 1/27 K). In the bottom panel, the disk r′-band F ν ranges as a function of d, calculated from the standard accretion disk model (see Section 4.2), are shown by two dash–dot curves. The two dash–dot curves were set by using the corresponding i range at each distance in the top panel. By requiring that fc matches the disk flux F ν (i.e., the shaded region), d = 6.0–6.7 kpc (90% confidence) is found, which in turn constrains i = 34°–61° (indicated by the shaded region in the top panel).
4.2 Disk flux calculation
The binary has a compact accretion disk and the disk flux is sensitive to i at certain distances. Here, we considered the standard geometrically thin, optically thick disk model (see Frank, King, & Raine Reference Frank, King and Raine2002). The outer radius of the disk ro is approximately ro ≃ 1.1 × 1010 cm, limited to the tidal radius (90% of the neutron star's Roche-lobe radius; Frank et al. Reference Frank, King and Raine2002). The disk temperature was determined by including both viscous heating and X-ray irradiation (for the latter, see Vrtilek et al. Reference Vrtilek, Raymond, Garcia, Verbunt, Hasinger and Kurster1990); because of the strong X-ray emission from the neutron star, irradiation is the dominant heat source. The mass accretion rate  $\dot{M}$ in the disk was estimated from $L_{\rm X}=GM_{\rm ns}\dot{M}/R_{\rm ns}$, where the neutron star radius R ns was assumed to be 106 cm (at 7 kpc distance, $\dot{M} \simeq 3.8\times 10^{16}$ g s−1). The disk flux F ν at frequency ν is then given as (Frank et al. Reference Frank, King and Raine2002)
 $$\begin{equation*}
F_{\nu}= \frac{4\pi h\nu ^3\cos i}{c^2 d^2}\int ^{r_o}_{r_i}\frac{rdr}{e^{h\nu /k_BT_d}-1}\,
\end{equation*}
$$
$$\begin{equation*}
F_{\nu}= \frac{4\pi h\nu ^3\cos i}{c^2 d^2}\int ^{r_o}_{r_i}\frac{rdr}{e^{h\nu /k_BT_d}-1}\,
\end{equation*}
$$
where h is Planck's constant, kB Boltzmann's constant, and c the speed of light. The disk temperature Td is a function of the disk radius r, 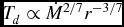 $T_d \propto \dot{M}^{2/7} r^{-3/7}$ (Vrtilek et al. Reference Vrtilek, Raymond, Garcia, Verbunt, Hasinger and Kurster1990), and ri is the inner disk radius (we set ri = 107 cm in our calculation, but note that the disk flux is not sensitive to ri as long as ri ≪ ro). We calculated the disk flux at the central wavelength (6 300 Å) of the r′ band over the same range of distance as considered in Figure 4, where we required that i(d) matched the constraints from Section 4.1. The possible range of F ν is shown by the two dash–dot curves in the bottom panel of Figure 4. Requiring the disk flux F ν to be consistent with fc from Section 4.1, we find d = 6.0–6.7 kpc and i = 34°–61° (90% confidence).
We note that the i value range is lower than that of 65°–82° obtained by Madej et al. (Reference Madej, Garcia, Jonker, Parker, Ross, Fabian and Chenevez2014) from their X-ray spectral fitting, but are consistent with the non-detection of any eclipses or dips at X-ray energies (which generally suggest i < 60°; Frank et al. Reference Frank, King and Raine2002). However, our results were calculated from simple analytic models for X-ray binaries and depend on parameters such as η* that were not robustly examined here. For example, if η* = 0.8 (i.e., T ≃ 51000d 1/27 K) is assumed, the above calculations will result in d ~ 5.2–6.0 kpc and i ~ 35–87°. In any case, our calculations clearly show that to produce the optical modulation seen in 4U 1543–624 at optical wavelengths, it is likely that d ⩽ 9 kpc, not supporting the suggestion that this binary is an ultra-luminous X-ray source. Instead, our fitting suggests d ~ 6.0–6.7 kpc. Following similar calculations presented here, future multi-band observations will certainly help our study of this ultra-compact binary by determining its distance and inclination.
ACKNOWLEDGEMENTS
We thank the anonymous referee for constructive suggestions. This research was supported by the National Natural Science Foundation of China (11373055) and the Strategic Priority Research Program ‘The Emergence of Cosmological Structures’ of the Chinese Academy of Sciences (Grant No. XDB09000000). A.T. acknowledges support from Chinese Academy of Sciences visiting Fellowship for Researchers from Developing Countries.