





1. Introduction
Gerlinde Kaltenbrunner, an Austrian mountaineer, once quit her promising alpine skiing career, because she did not like to continue competing against her friends.Footnote 1 Being unwilling to compete against friends, to the extent of ending a promising career that involves competitions, might be unique to Gerlinde Kaltenbrunner. However, it might also be that such discomfort reflects a more general pattern. Understanding how friendships and other forms of social ties influence individuals’ willingness to compete can be important in workplace settings, where social ties are a crucial determinant of both team atmosphere and broader company culture.
Workplace atmosphere and incentive structures are fundamental to modern organizations and are widely considered to be key drivers of organizational success (Dahlin et al., Reference Dahlin, Kelly and Moen2008, Alan et al., Reference Alan, Corekcioglu and Sutter2023, Erkut & Reuben, Reference Erkut and Reuben2024). Even though the importance of both is widely documented (Graham et al., Reference Graham, Grennan, Harvey and Rajgopal2022), less is known about the interplay between them. This is partly because it is difficult to isolate the determinants of workplace atmosphere, and partly because the direction of causality between incentive structures and workplace atmosphere can be ambiguous (Guiso et al., Reference Guiso, Sapienza and Zingales2015). Consider team managers who wish to improve company performance by fostering social ties among employees, and who incentivize effort via a competitive end-of-year bonus that is provided to the best performing team member. To help managers design effective policies in this context, our paper offers a more detailed understanding of the connection between social ties and willingness to compete. We provide causal evidence for how social ties affect individuals’ willingness to compete.
To test whether and how social ties influence individuals’ willingness to compete, we run an online experiment that allows us to manipulate the strength of and future expectations regarding social ties between individuals. In contrast to prior studies and laboratory work on the effects of social ties, we specifically design our experiment so as to disentangle two dimensions of social ties, following Granovetter (Reference Granovetter1973): whether individuals know each other, and whether they expect to encounter each other again. Both of these channels play important roles in designing workplace policies and managerial practices, such as team-building exercises and remote work options.
We structure our experiment in three main stages. In the first stage (Chat I), subjects engage in a chat. In the second stage, the Task stage, we measure the willingness to compete by offering a choice between a competitive incentive scheme and an incentive scheme based on individual performance. Afterwards, in stage three, subjects engage in another chat (Chat II). We vary the matching between the stages in two dimensions: (1) whether the Task stage involves the same group composition as the Chat I stage, and (2) whether the Task stage involves the same group composition as the Chat II stage. In total, this results in four different treatments: (i) a setting where subjects choose whether to compete against unknown subjects that they will also not meet again (No-Ties); (ii) a setting where subjects choose whether to compete against others they previously met in the Chat I stage of the experiment, but will not encounter again in the Chat II stage (Weak-Ties); (iii) a setting in which subjects choose whether to compete against unknown subjects that they will interact with afterwards (Future-Prospect); (iv) a setting in which subjects choose whether to compete against subjects they previously met and will encounter again in the subsequent chat (Weak-Ties w/Future-Prospect).
We find that, compared to anonymous strangers, subjects who feel closer to each other after the first chat and who expect to encounter each other again are less willing to compete against one another. When investigating the mechanisms behind this effect, we find that neither meeting after the competition (Future-Prospect) nor having met previously (Weak-Ties) separately explain the observed effect. Instead, we find that feeling close to the other person only reduces individuals’ willingness to compete if subjects expect to meet again after the competition.
We further investigate whether social ties are an accelerating (or mitigating) factor for the well-documented gender difference in selecting into competitive environments (Niederle & Vesterlund, Reference Niederle and Vesterlund2007). Several studies from the social cognition literature provide correlational evidence of a gender difference in the effect of social ties (Hall et al., Reference Hall, Gunnery and Horgan2016, Thomas & Fletcher, Reference Thomas and Fletcher2003, Schulte-Rüther et al., Reference Schulte-Rüther, Markowitsch, Shah, Fink and Piefke2008, Costa Jr et al., Reference Costa, Terracciano and McCrae2001, Chapman et al., Reference Chapman, Duberstein, Sörensen and Lyness2007, Weisberg et al., Reference Weisberg, DeYoung and Hirsh2011, Friebel et al., Reference Friebel, Lalanne, Richter, Schwardmann and Seabright2021). While our findings in the treatments without previous interaction show a significantly greater willingness to compete for men, which is consistent with the seminal study of Niederle and Vesterlund (Reference Niederle and Vesterlund2007) and many subsequent studies (Gillen et al., Reference Gillen, Snowberg and Yariv2019, Van Veldhuizen, Reference Van Veldhuizen2022), we do not find any significant gender differences in the treatments where subjects interacted before choosing the incentive scheme (Weak-Ties or Weak-Ties w/Future-Prospect).
Our work broadens the existing literature in various sub-fields. First, we contribute to the extensive literature investigating the effects of workplace atmosphere on organizational success. A positive workplace atmosphere is mainly associated with benefits for workers and organizational performance (Boyce et al., Reference Boyce, Nieminen, Gillespie, Ryan and Denison2015, Martinez et al., Reference Martinez, Beaulieu, Gibbons, Pronovost and Wang2015, Gartenberg et al., Reference Gartenberg, Prat and Serafeim2019, Guiso et al., Reference Guiso, Sapienza and Zingales2015). Less is known about the underlying mechanisms behind this, and how the atmosphere interacts with intra-organizational formal institutions (Graham et al., Reference Graham, Grennan, Harvey and Rajgopal2022, Erkut & Reuben, Reference Erkut and Reuben2024): first, because of the difficulty of isolating the factors that determine workplace atmosphere, and second, because of reverse causality concerns. It is well established that social ties among co-workers are a fundamental part of the workplace atmosphere. For example, Gächter et al. (Reference Gächter, Starmer and Tufano2025) study so-called group cohesion focusing on social relationships as factors of production. They examine the aggregate closeness of ties within a group as a summary metric for team social relationships and use experimental evidence to conclude that social ties matter for team production in weak-link coordination games (Gächter et al., Reference Gächter, Starmer and Tufano2015, Cialdini et al., Reference Cialdini, Brown, Lewis, Luce and Neuberg1997). We contribute to understanding how social ties interact with competitive incentive structures by providing causal evidence of the effect of social ties on individuals’ willingness to compete against each other. Since competitive incentive structures are common in organizations, understanding how social ties and preferences for competition interact is crucial for designing efficient workplace policies (Graham et al., Reference Graham, Grennan, Harvey and Rajgopal2022).
Second, we contribute to the literature on the importance of social ties for social decision-making beyond the intra-organizational context. The importance of social ties for understanding social decision-making has been widely recognized. An extensive literature provides evidence that social ties matter in various contexts, such as in relation to resource sharing, collective action, fair business dealings, and venture building (Akerlof, Reference Akerlof1982, Akerlof, Reference Akerlof1983, Becker, Reference Becker1974, Granovetter, Reference Granovetter1985, Coleman, Reference Coleman1984, Uzzi, Reference Uzzi1999, Abbink et al., Reference Abbink, Irlenbusch and Renner2006, Roberts & Sterling, Reference Roberts and Sterling2012). There is also a substantial experimental literature on the importance of social ties for economic behavior, for example, related to cooperation (Apicella et al., Reference Apicella, Marlowe, Fowler and Christakis2012), coordination and conflict (Reuben & Van Winden, Reference Reuben and Van Winden2008), trust and trustworthiness (Glaeser et al., Reference Glaeser, Laibson, Scheinkman and Soutter2000), bribery and corruption (Di Zheng et al., Reference Di Zheng, Schram and Doğan2021), norm enforcement (Goette et al., Reference Goette, Huffman and Meier2012), and conformity (Goette & Tripodi, Reference Goette and Tripodi2021). The latter demonstrates an important example of social proximity effects when the actions of group members are interdependent but not directly observable. Social ties have also been shown to matter in various contexts, such as for regional growth (Burchardi & Hassan, Reference Burchardi and Hassan2013), neighborhoods, charitable giving (Goette & Tripodi, Reference Goette and Tripodi2021), and professional relationships within and outside organizations (Sonnemans et al., Reference Sonnemans, Van Dijk and Van Winden2006). But social ties are not equally advantageous across all types of tasks, as there is a positive effect on coordination in games with strategic complements, but this effect is absent in games with strategic substitutes (Chierchia et al., Reference Chierchia, Tufano and Coricelli2020). We extend this literature by investigating the role of social ties in shaping willingness to compete. There is limited evidence on this intersection to date. In an early adolescent sample, Schneider et al. (Reference Schneider, Woodburn, del Pilar Soteras del Toro and Udvari2005) found descriptive evidence for a negative relationship between friendship and competition. They showed that boys exhibited stronger preferences for competition against their peers than girls. Meanwhile, the focus of adult studies in the context of friendships and competition has often been on the competition for romantic partners in particular (see Hibbard & Walton, Reference Hibbard and Walton2017, for a review).
The studies within the behavioral economics literature that are most closely related to ours include Muñoz-Herrera and Reuben (Reference Muñoz-Herrera and Reuben2024), Cornaglia et al. (Reference Cornaglia, Drouvelis and Masella2019), Mill and Morgan (Reference Mill and Morgan2022), and Schäfer (Reference Schäfer2023). Muñoz-Herrera and Reuben (Reference Muñoz-Herrera and Reuben2024) studied the choice of a partner in a trust game after different forms of communication and differently competitive environments. They found that a more personal relationship (formed in a free-form chat) led to inefficiencies in competitive environments. The ties that subjects formed in their experiment led to inefficient trading-partners, undermining the potential efficiency gains of competition. Cornaglia et al. (Reference Cornaglia, Drouvelis and Masella2019) examined the effect of group identity on individual behavior, looking into the effect of group membership on competition preferences. They manipulated group identity by adopting a minimal group paradigm and asking subjects to perform a problem-solving task either individually or in groups with chat communication. The subjects were then matched in in-group, out-group, or random pairs and participated in four different tasks that were similar in design but differed in how subjects were paid, similar to Niederle and Vesterlund (Reference Niederle and Vesterlund2007). They found that group membership stimulated pro-social attitudes toward other group members, and that subjects showed stronger competitiveness in in-group matchings than in out-group matchings or a control setting without group identity, echoing a large literature on group membership and social identity in various strategic contexts (Akerlof & Kranton, Reference Akerlof and Kranton2000, Chapman et al., Reference Chapman, Duberstein, Sörensen and Lyness2007, Charness et al., Reference Charness, Rigotti and Rustichini2007, Chen & Li, Reference Chen and Li2009, Chen & Chen, Reference Chen and Chen2011). In fact, they found that group membership amplified competitive behavior within the group already after initial interaction, without considering the prospect of repeated future interaction. Mill and Morgan (Reference Mill and Morgan2022) investigated auction bidding behavior in the lab between subjects describing themselves as either Republican or Democrat in the context of the US political system. They found more aggressive bidding behavior against out-group members compared to in-group members. Finally, Schäfer Reference Schäfer2023 examined the effect of real-world friendships on behavior in laboratory markets. He found that friendships have similar effects as mergers, namely, friendships between people that sell complementary goods decrease prices and increase efficiency, whereas friendships between people with substitute goods cause the opposite effects. These results are consistent with the directed altruism theory.
In contrast to Cornaglia et al. (Reference Cornaglia, Drouvelis and Masella2019), we abstract from group membership and focus on the effect of social ties for willingness to compete. The treatment in Cornaglia et al. (Reference Cornaglia, Drouvelis and Masella2019) included three elements: manipulation of group identity, interaction in a chat, and cooperation on a joint task. We abstract from manipulating group identity (to avoid potential countervailing effects). In contrast to Mill and Morgan (Reference Mill and Morgan2022), we focus on the willingness to compete (i.e., the choice to enter a competitive environment) instead of on competitive behavior in auction bidding. Furthermore, our paper explicitly focuses on the effect of social ties by also measuring the social closeness between subjects. Our findings complement all four of the closely related behavioral economics studies by highlighting the extensive margin effects of social ties on competitiveness. In contrast to the existing studies, we provide causal evidence for the underlying mechanisms of social ties by highlighting the crucial role of future interactions.
Third, we contribute to the extensive literature on preferences for competition. Personality traits or non-cognitive skills have often been shown to be stable predictors of education and labor market outcomes. Among those traits, competitiveness has received considerable attention following the seminal studies by Gneezy et al. (Reference Gneezy, Niederle and Rustichini2003) and Niederle and Vesterlund (Reference Niederle and Vesterlund2007). Several studies have shown a positive correlation between measures of competitiveness and labor market performance (Buser et al., Reference Buser, Niederle and Oosterbeek2014, Niederle, Reference Niederle2017), while other still-growing literature investigates the drivers of competitiveness. Numerous lab and field studies have discussed the role of gender and show that men are significantly more likely to select into competitive environments compared to women (e.g., Niederle & Vesterlund, Reference Niederle and Vesterlund2007, Gillen et al., Reference Gillen, Snowberg and Yariv2019).Footnote 2 Other studies deal with the role of socio-economic factors and socio-environmental factors (Gneezy et al., Reference Gneezy, Leonard and List2009, Cornaglia et al., Reference Cornaglia, Drouvelis and Masella2019, Booth et al., Reference Booth, Fan, Meng and Zhang2019). We contribute to this literature by exploring the relationship between social ties and willingness to compete. Most experimental lab studies on the determinants of willingness to compete focus on anonymous interactions. However, several studies following Bohnet and Frey (Reference Bohnet and Frey1999) have demonstrated the importance of relaxing this assumption for studying social decision-making. We identify social closeness and social ties as causal drivers of individuals’ willingness to compete.
Our results have important implications for managers who seek to design efficient work processes. Consider a manager looking for ways to reduce unproductive competition among co-workers. Our results demonstrate that the manager may see positive returns on investment in tie-forming activities such as team-building events, on-premises work schemes, and other office policies (Yang et al., Reference Yang, Holtz, Jaffe, Suri, Sinha, Weston, Joyce, Shah, Sherman, Hecht and Teevan2022). Now consider another manager who instead cares more about her employees participating in a promotion tournament for a leading role, and who is interested in maximizing participation in the tournament. Our results suggest that social ties among employees may have an undesirable effect for this manager. By designing office policies and organizing team-building events, she can affect social tie formation among co-workers and, in turn, the willingness of her workers to compete against each other. By making sure there is no interaction between the potential contestants after the competition, she can avoid reduced willingness to compete. Benson et al. (Reference Benson, Li and Shue2019) provide suggestive evidence that is in line with our results. They examine data from 131 U.S.-based firms with over 38,000 sales workers, of whom more than 1,000 were promoted to managerial roles. They argue that “promotions can be considered a tournament” (p. 2103) and observe that the promoted sales workers in the dataset tend to get rotated away to manage a different team than the one they were in before the promotion (this fits 76% of the examined promotions). Thus, companies strategically use cross-department promotion schemes to avoid potentially harmful encounters with former co-workers with existing social ties.
2. Experimental design and procedure
Using real-world data to study the causal impact of existing and future social ties is challenging, for at least two reasons. First, whether interactions between individuals in the real world occur or not is usually endogenous rather than randomly assigned. Second, whether interactions persist or are discontinued is also endogenous in real-world interactions. Examining the causal impact of such forms of social ties on any outcome is, therefore, almost impossible without exogenous manipulation. A highly controlled environment such as an (online) experiment where the experimenters randomly allocate participants in different treatments can address many of these endogeneity concerns. As previously shown, experiments are also a reasonable approach to measuring our outcome variable: the decision to enter a competition (see e.g., Gneezy et al., Reference Gneezy, Niederle and Rustichini2003, Niederle & Vesterlund, Reference Niederle and Vesterlund2007). In the following, we lay out the details of the experimental protocol.
At the beginning of the experiment and before reading the instructions, subjects state their gender.Footnote 3 Afterwards, a nickname is randomly allocated to each subject. This nickname guarantees that anonymity is preserved, but individuals are still recognizable to each other within the experiment. This nickname consists of a prefix Mr. or Ms. and the name of an animal.Footnote 4 Subjects in the experiment learn their nickname and the nicknames of the two other subjects they chat with during Chat I. After showing only the nicknames of the two other chat partners in Chat I, we elicit subjects’ closeness to each of the other two group members using the Inclusion of Other in the Self (IOS) scale.Footnote 5 On this scale, subjects indicate how close they feel toward each of the two other subjects on a 7-point scale represented by overlapping circles. In Chat I, subjects chat in groups of three for 10 minutes. There are no restrictions on what people can write, except that subjects are not allowed to reveal their real-world identities. Thirty seconds into the chat, a topic to discuss is proposed. After three minutes and then again after six minutes, another topic is proposed. The topics to discuss that appear on the screen are taken from Aron et al. Reference Aron, Melinat, Aron, Vallone and Bator(1997) and are a part of the validated method for increasing interpersonal closeness.Footnote 6 After 10 minutes, the chat closes automatically and subjects are again asked to fill out the IOS scale measuring the closeness to each of the other two subjects of Chat I.
In the Matching stage, the treatment variation takes place. Subjects receive the instructions for the subsequent stages and learn that the task consists of finding words in a letter grid. In particular, they learn the nicknames of the other two group members in the Task and Chat II stages. Depending on the treatment, these are unknown group members or members they are familiar with. Further, they learn that they can choose whether to do the task competitively or individually, and they see the resulting payoff rule for each of the two options.
The Task stage measures the primary outcome: subjects’ choice to compete or not. On the choice screen, subjects see the payoff rules of each option. Playing the task individually leads to the following payoff:
 \begin{equation*}
\Pi_{Individual} (s_i) = 3 \unicode{x20AC} + 10 \unicode{x20AC} - (0.05 \unicode{x20AC} \times s_i )
\end{equation*}
\begin{equation*}
\Pi_{Individual} (s_i) = 3 \unicode{x20AC} + 10 \unicode{x20AC} - (0.05 \unicode{x20AC} \times s_i )
\end{equation*} where si represents the number of seconds the individual needs to solve the task. If a subject fails to solve the task, it automatically ends after 200 seconds. Not solving it, therefore, leads to a payoff of  $3 \unicode{x20AC}$ in this stage. If a subject chooses competition, the payoff is calculated as follows:
 \begin{equation*}
\Pi_{Competition} (s_i, s_{-i}) =
\left\{\begin{array}{lll}
3 \unicode{x20AC} + n \times (10 \unicode{x20AC} - (0.05 \unicode{x20AC} \times s_i )) & if & s_i \lt s_{-i} \\
3 \unicode{x20AC} & if & s_i \gt s_{-i}
\end{array}\right.
\end{equation*}
\begin{equation*}
\Pi_{Competition} (s_i, s_{-i}) =
\left\{\begin{array}{lll}
3 \unicode{x20AC} + n \times (10 \unicode{x20AC} - (0.05 \unicode{x20AC} \times s_i )) & if & s_i \lt s_{-i} \\
3 \unicode{x20AC} & if & s_i \gt s_{-i}
\end{array}\right.
\end{equation*}where si represents the number of seconds the individual needs to solve the task and s −i denotes the number of seconds the fastest other subject who chose competition needs to solve the task. n depicts the number of participants who chose competition within the group of three.Footnote 7 The Task stage ends for a subject when the task is solved or after 200 seconds. The Task stage does not end for other group members if one competitor has already solved it. For that reason, we also obtain data on the performance of the losing subject and ensure that no information about the competitors’ performance can be inferred while solving the task.
In our design, subjects cannot force others into the competition, as each participant can choose to play individually instead. Therefore, when choosing competition, subjects indicate their willingness to compete against those players in the group who also chose competition. Further, by choosing to compete, subjects also increase the size of the prize accordingly, such that others’ expected payoffs remain the same when choosing competition or individual incentives. This design limits the externalities individuals impose on others when choosing competition. Although many real-world examples might also include externalities, the resulting effect of our design represents a lower bound on the overall effect. Based on the social preference literature, it is natural to assume that social ties matter for the willingness to impose a burden on other individuals. By excluding these kinds of externalities by design, we can focus more distinctly on the true change in willingness to compete.
Before subjects choose whether to play the letter grid task individually or competitively, they can look at an example of the game on two consecutive screens. This is meant to reduce the ambiguity for the subjects about what to expect. We store the extensive margin (whether and how often subjects check the example screen) and the intensive margin (how many seconds this screen is opened). Furthermore, subjects are again reminded of their match during the Task and Chat II stages. On the next screen, after choosing the payment scheme, subjects are asked to indicate their belief about the likelihood that the potential competitors will choose to compete. Each subject chooses an answer on a 6-point Likert scale from very unlikely to very likely for each of the two potential competitors (unincentivized).
While a timer runs down until the start of the letter grid task, subjects are either reminded that they will play individually or are informed about the nickname(s) of the other subject(s) in their three-person group who also chose competition. Afterward, the task starts: a letter grid with 10x10 letters is shown. Three German words are hidden and have to be found. We created four different letter grids, and it is randomized at the session level which letter grid is played. Subjects who chose to play individually are informed about their payoff afterward. Subjects who chose the competition are informed about their payoff and the nickname of the subject who won/lost the competition.
The IOS scale is again repeated before the Chat II stage. Each subject is now asked to state the level of interpersonal closeness to the two subjects they will be paired with in Chat II. Chat II lasts 10 minutes, and three new suggested topics are shown after 30 seconds, three minutes, and six minutes respectively.Footnote 8 After Chat II, subjects are again asked to fill out the IOS questions in regard to the other players in Chat II.
In the Covariates stage, to elicit risk preferences, the subjects then play the bomb task (Crosetto & Filippin, Reference Crosetto and Filippin2013) where 25 boxes are shown and subjects must tag the boxes. One box contains the bomb, and selecting this bomb leads to zero payoffs in this task. If the bomb box is not selected, subjects receive 20 Eurocents for every box selected. Feedback for the bomb task is provided immediately afterward. Subsequently, subjects individually answer seven questions related to cognitive ability. The questions are based on the Cognitive Reflection Test (CRT) of Toplak et al. Reference Toplak, West and Stanovich(2014). As we run the experiment online, we slightly change the wording of the questions to reduce the possibility of subjects finding the answers through online search engines. Each correctly answered question leads to a payoff of 50 Eurocent. Afterward, subjects are incentivized to correctly guess how many questions they answered correctly (they receive 1 Euro in the case of a correct guess), and subjects have to guess the rounded-up average of the number of correct questions of every other subject in the same session (subjects earn 1 Euro in case of a correct answer). At the end of the experiment, subjects see overall feedback on their earnings.
After the feedback screen, subjects are asked to answer a non-incentivized post-experimental questionnaire, including socio-economic questions, a short Big 5 questionnaire (Gosling et al., Reference Gosling, Rentfrow and Swann2003), and open questions about behavior in the experiment. Details on instructions and decision screens can be found in Appendix C.
Timeline
To summarize, Table 1 outlines the timeline of the different stages of our one-round experiment.
Timeline of the experiment

Treatments
The treatments differ in the matching between Chat I, the Task stage (either played individually or in competition), and Chat II. The two dimensions of the 2x2 factorial design differ in whether the groups of three are (1) identical in Chat I and the Task or (2) identical in the Task and Chat II, or both, or neither. The Weak-Ties w/Future-Prospect treatment has the same three group members in all stages. The No-Ties treatment has different group members in the Chat I, the Task and the Chat II stages. The other two interim treatments, Weak-Ties [Future-Prospect] have the same group composition in Chat I and the Task [the Task and Chat II]. Table 2 provides a treatment overview. Treatments are varied between sessions.
Treatment overview

Procedure
The experimental sessions were run between March and September 2021.Footnote 9 Fluent German-speaking subjects were recruited from the standard student subject pool of the University of Konstanz via hroot (Bock et al., Reference Bock, Baetge and Nicklisch2014). In total, 446 subjects (63.45 % female, 36.55 % male) participated in 25 sessions, usually with 18 subjects per session.Footnote 10 Table A.1 in the Appendix provides an overview over some descriptive statistics and averages of traits in the different treatments. The table further shows that there is no significant treatment differences between these covariates. The experiment lasted 60 minutes on average, including the online introduction and the post-experimental questionnaire. The subjects earned on average 13.82 Euros (sd = 5.38), including a show-up fee of 3.00 Euros. The subjects entered their bank details (IBAN) at the end of the experiment and received their earnings via bank transfer in the days following the session. To guarantee anonymity, the IBAN and the name were never stored in the same place as the experimental data. Matching groups were randomly formed with nine subjects in the No-Ties, Future-Prospect, and Weak-Ties treatments. The Weak-Ties w/Future-Prospect treatment had a matching group size of three.
3. Results
In this section, we present the main results of the experiment. We begin by briefly summarizing competition rates across all four treatments. Subsection 3.1 explores the relevance of interpersonal closeness in each treatment in more detail. Subsequently, to get a deeper understanding of the relevance of future prospects, Subsection 3.2 presents the difference between Weak-Ties w/Future-Prospects and Weak-Ties, along with the other treatment comparisons. Robustness checks are presented in Subsection 3.3. Unless stated otherwise, all presented standard errors are clustered at the matching group level.
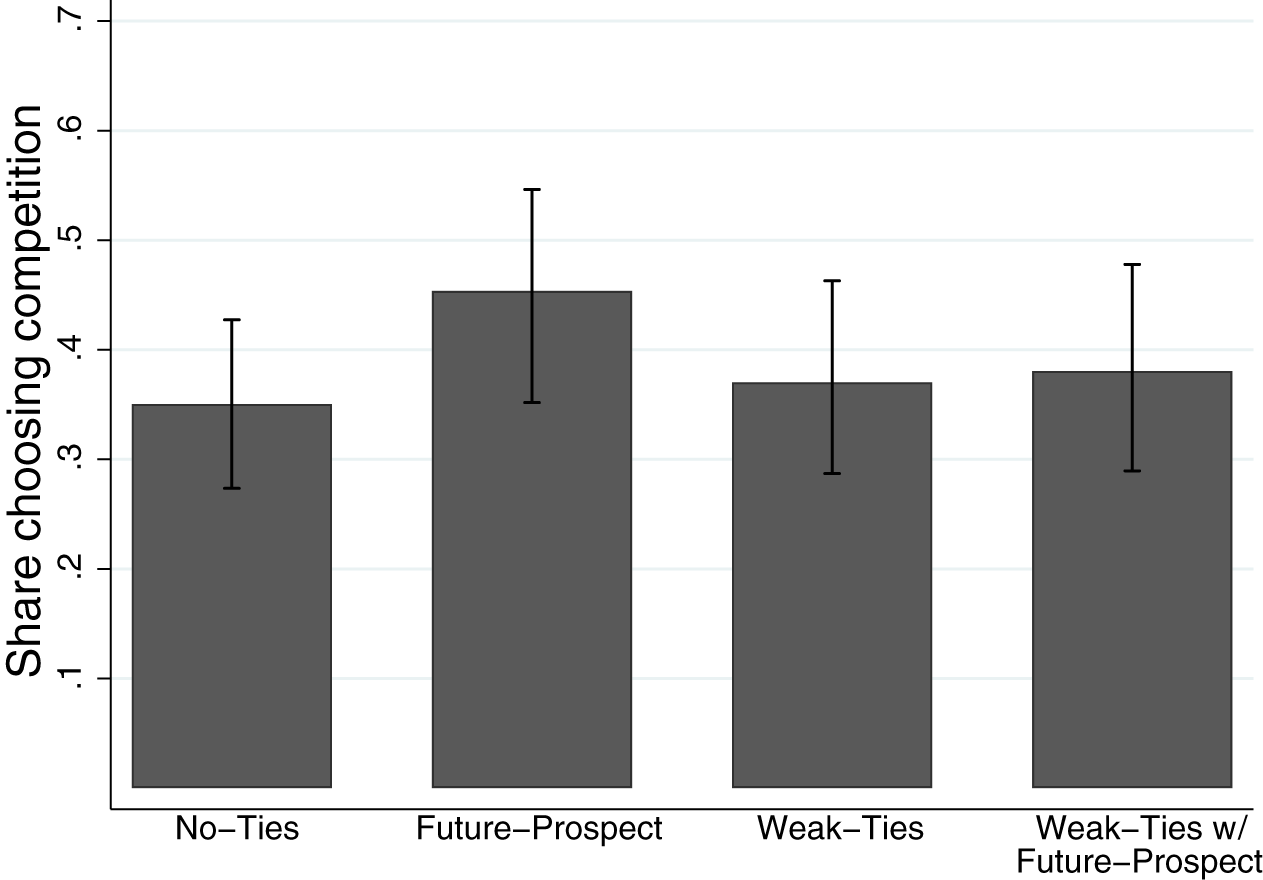
We first demonstrate why closeness measures are an integral part of the analysis. Figure 1 shows the percentage of participants who chose competition, without considering the heterogeneity in interpersonal closeness. Subjects interacted with potential competitors before the task in treatments Weak-Ties and Weak-Ties w/Future-Prospect, and after the task in treatments Future-Prospect and Weak-Ties w/Future-Prospect. In cases where participants chose whether to compete against those they interacted with, 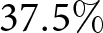 $37.5\%$ opted for competition. For those deciding to compete against participants they had not interacted with before, $40\%$ chose competition. This difference is not statistically significant. Similarly, there is no significant difference in those who chose competition between participants who met again after competition and participants who did not. One reason for this similarity could be that chatting for 10 minutes heterogeneously affects closeness. In further comparisons, we therefore take into account the heterogeneity in interpersonal closeness.
Share of subjects who chose competition across the four treatments

3.1. The effect of interpersonal closeness
By allowing the subjects to chat, we created the possibility of increasing the subjective closeness between the participants. Using an in-group/out-group design, Kranton and Sanders Reference Kranton and Sanders(2017) highlights substantial heterogeneity among individuals in terms of identification with the in-group. Some individuals show a strong response to the treatment, while others do not differentiate between in-group and out-group. Leveraging the participants’ responses on the IOS scale, we examine how Chat I influences closeness between the group members and explore the relationship between closeness and preferences for competition under the treatment conditions.
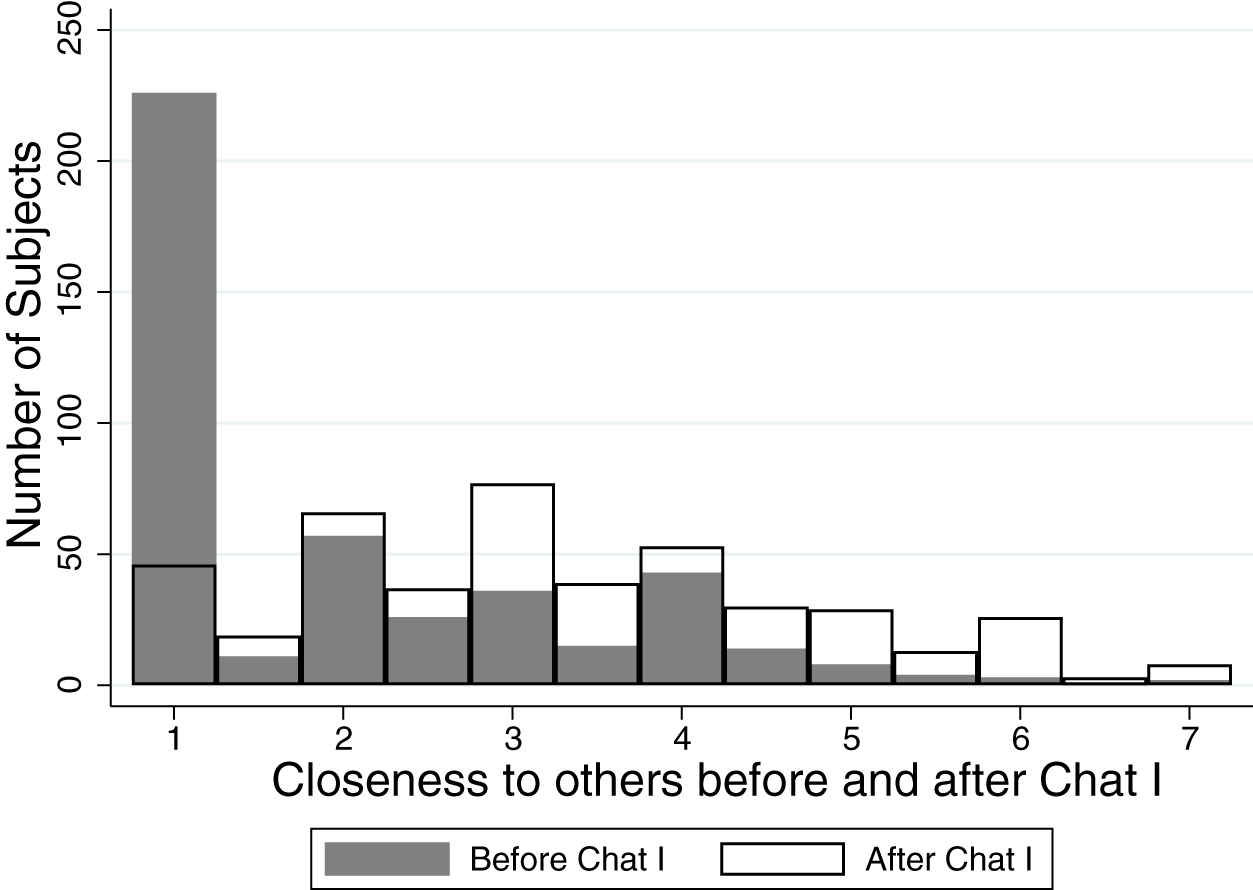
We begin by showing that the Chat successfully increased interpersonal closeness. Figure 2 illustrates the distribution of responses on the 7-point IOS scale just before and immediately after Chat I. Initially, most subjects tended to choose the lowest closeness rating (coded as 1) for both other group members, resulting in an average closeness of 1 for the majority of subjects. After Chat I, however, only a minority of participants selected the lowest point on the scale. On average, Chat I led to an increase of 1.22 points on the 7-point scale in subjects’ responses on the IOS scale (this increase is highly significant; see Section 4.2 for detailed information and covariates related to the increase in closeness).
Distribution of closeness to the other two group members right before and right after Chat I

To investigate the effect of closeness on preferences for competition, we calculate the difference in the average closeness to the other two group members right after and right before Chat I. We henceforth refer to this measure as the change in closeness, or Δ closeness. Figure A.1 in the Appendix illustrates the distribution of change in closeness for each treatment. Notably, the change in closeness is predominantly positive for a significant majority of subjects. There are no substantial differences across treatments in the impact of Chat I on the change in closeness to the group members, showing that the random allocation into the treatments worked well. In the remainder of this section, we split the data into two groups. Using a median split (which coincides with a mean split in our data), we create a binary variable indicating a high change in closeness or a low change in closeness through Chat I. This median split also allows us to represent the findings in the figures in a straightforward way.Footnote 11
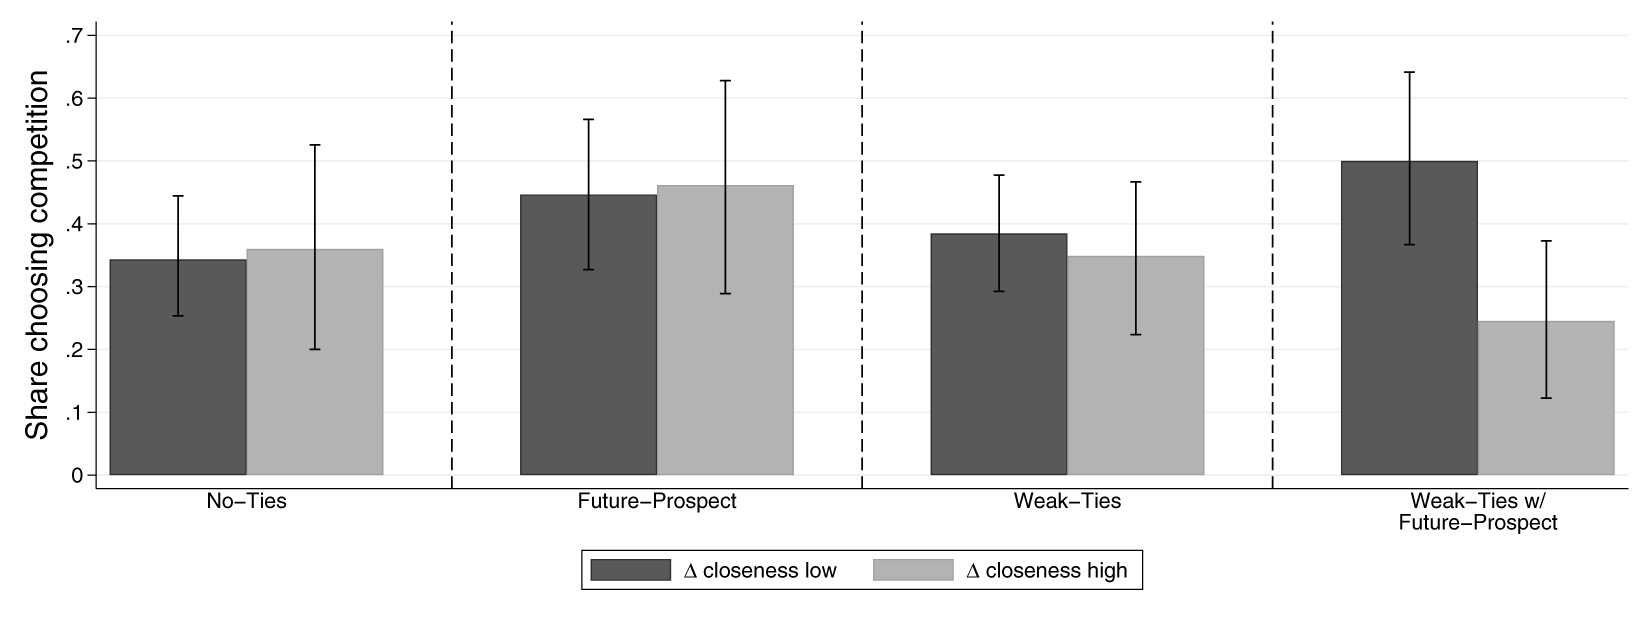
Figure 3 plots the relation between closeness and willingness to compete for each of the four treatments. The figures reveal that the difference between the groups with high and low change in closeness through Chat I is largest in the Weak-Ties w/Future-Prospect treatment. The regressions reported in Table 3 confirm that the difference in the share choosing competition between high and low change in closeness is significant in the Weak-Ties w/Future-Prospect treatment, and insignificant in the other treatments. As various research has shown a connection between willingness to compete and gender, and as the treatments are not perfectly counterbalanced on gender, we also include a gender dummy in the regressions reported in Table 3 (for more details on the role of gender in our setting, see Subsection 4.1). To control for potential differences in the initially indicated level of closeness before Chat I, columns (2), (4), (6), and (8) include it as a control. In general, a concern might be that subjects who tend to increase their subjective closeness more easily, are also in general more willing to compete. Table 3 shows, however, that this is not the case. Columns (1), (2), (3), and (4) show that the difference between high and low changes in closeness through Chat I in the No-Ties and Future-Prospect treatments is insignificant and close to zero. This is reassuring, as there is no reason to expect a direct effect in these two treatments: the change in closeness is measured for the two other participants in Chat I, but the potential competitors in the task are other participants that the subjects did not interact with before.
The effect of change in closeness via Chat I on the willingness to compete

Choosing competition over the four treatments

Notes: OLS regressions on choosing competition. Columns (1) and (2) contain data for the No-Ties treatment, columns (3) and (4) contain data for the Future-Prospect treatment, columns (5) and (6) contain data for the Weak-Ties treatment, and columns (7) and (8) contain data for the Weak-Ties w/Future-Prospect treatment. Δ closeness high has a value of 1 if Δ closeness is above the median, and 0 otherwise. Closeness before Chat I depicts the average level of closeness indicated on the IOS scale before Chat I. Male is a gender dummy. Num boxes opened (risk-loving)  $\in \{0, 1, ..., 25\}$ represents the number of boxes opened in the bomb-task to measure risk-loving behavior. Overconfidence is measured as the difference of the incentivized belief about the number of correct answers in the Cognitive Reflection Test and the actual number of correct answers. Standard errors are clustered at the matching group level and depicted in parentheses. Ignoring the matching groups and rerunning the regressions without clustering does not change the results qualitatively.
*** (**/*) significant at the 1% (5%/10%) level.
The third panel in Figure 3 and columns (5) and (6) in Table 3 show the effect of closeness on the willingness to compete in the Weak-Ties treatment. In this treatment, groups in Chat I and the Task stage remain unchanged; subjects are matched to new participants only after the task in Chat II. Here, one could expect that increased closeness toward the other participants through Chat I influences the willingness to compete against these participants. Our results do not support this claim. The share choosing competition out of all subjects who increased closeness at an above average level via Chat I (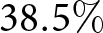 $38.5 \%$) is almost equal to, and not significantly different from, the share of those who did not increase their closeness above average via Chat I (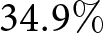 $34.9 \%$).
The only difference between the Weak-Ties and the Weak-Ties w/Future-Prospect treatment at the moment of competition choice is the knowledge that one will meet the same participants of the Chat I stage and the Task stage again in Chat II (Weak-Ties w/Future-Prospect) or not (Weak-Ties). Panel four of Figure 3 and columns (7) and (8) in Table 3 reveal that the increase in closeness in Chat I correlates strongly and significantly with the willingness to compete against the other participants of Chat I, the Task stage, and Chat II. While  $50 \%$ of those who did not increase their closeness above median via Chat I chose competition in the Weak-Ties w/Future-Prospect treatment, only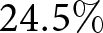 $24.5 \%$ of those who increased their closeness via Chat I strongly did so. Since closeness may correlate with other factors that affect choices whether to select into competition, we further add control variables into the regressions in Table 3 that are likely correlated with competition choices. As a proxy for the risk preferences of participants, we use the incentivized bomb-task (Crosetto & Filippin, Reference Crosetto and Filippin2013). For a general measure of (over)confidence in one’s ability we use the incentivized believed performance in a cognitive reflection test (CRT) minus the incentivized actual performance in this test. Columns (2), (4), (6), and (8) in Table 3 show that the effect of closeness remains unaffected by adding these controls and controls for gender or the level of closeness prior to Chat I. This finding shows that subjects who felt close to other participants and knew that they would interact with those participants again later were less willing to enter a competition against them than subjects who did not increase their closeness to the other participants. To complement our analysis in Table 3, we run a pooled regression by adding dummy variables for the different conditions and jointly add the controls over all treatments. The resulting coefficient plot is shown in Figure A.2 and supports the findings of Table 3. To test the robustness of our findings even further, we conduct additional robustness checks to show that adding the controls sequentially as well as including further control variables such as the beliefs about other’s performance in the cognitive reflection task and measures for the Big 5 personality traits do not affect the results (Table A.2, Table A.3, Table A.4, and Table A.5).
The results of the Weak-Ties w/Future-Prospect treatment align with previous findings in the literature, indicating that social ties decrease people’s willingness to compete against each other. Mill and Morgan Reference Mill and Morgan(2022) describe a connection between social ties, closeness, and competition behavior, finding that subjects exhibit less competitiveness toward others who identify with the same political party. However, the downside of such social tie identification is akin to experiments involving real friends and strangers in the laboratory (as conducted in several studies, e.g., Reuben & Van Winden, Reference Reuben and Van Winden2008, Cochard et al., Reference Cochard, Couprie and Hopfensitz2016). Since an experimenter cannot dissolve the friendship after the experiment in these cases, the data cannot elucidate the driving factors behind our finding.
3.2. Weak-Ties and Future-Prospect
The analyses in the previous subsection showed that the change in closeness only affects the probability to compete in the Weak-Ties w/Future-Prospect treatment. These within-treatment comparisons do not rule out the possibility that participants with certain unobserved traits select into stating a high difference in closeness to their other group members. To test this concern and further control for potential other difference in characteristics between treatments, we now regress the choice to compete jointly over two treatments. If the connection between closeness and willingness to compete in the Weak-Ties w/Future-Prospect treatment is solely driven by the effect of existing social ties, we would expect to find the same pattern in the Weak-Ties treatment. In the Weak-Ties w/Future-Prospect treatment, subjects know that they will stay in the same group composition in Chat II, while in the Weak-Ties treatment, they are informed that they will not interact within the same group after the Task stage. A similar reasoning applies to the comparison between Weak-Ties w/Future-Prospect and Future-Prospect. If the connection between closeness and willingness to compete is driven solely by the upcoming future prospects, we would expect to find the same pattern in the Future-Prospect treatment.
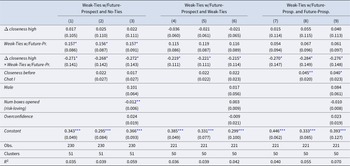
Columns (1) to (3) of Table 4 report the regression results of the difference in the effect of closeness between the No-Ties and the Weak-Ties w/Future-Prospect treatment. The regressions show that subjects with Δ closeness low increase their willingness to compete when in the Weak-Ties w/Future-Prospect treatment. For those with Δ closeness high, however, the share choosing competition is (weakly) significantly lower.
Probability of choosing competition
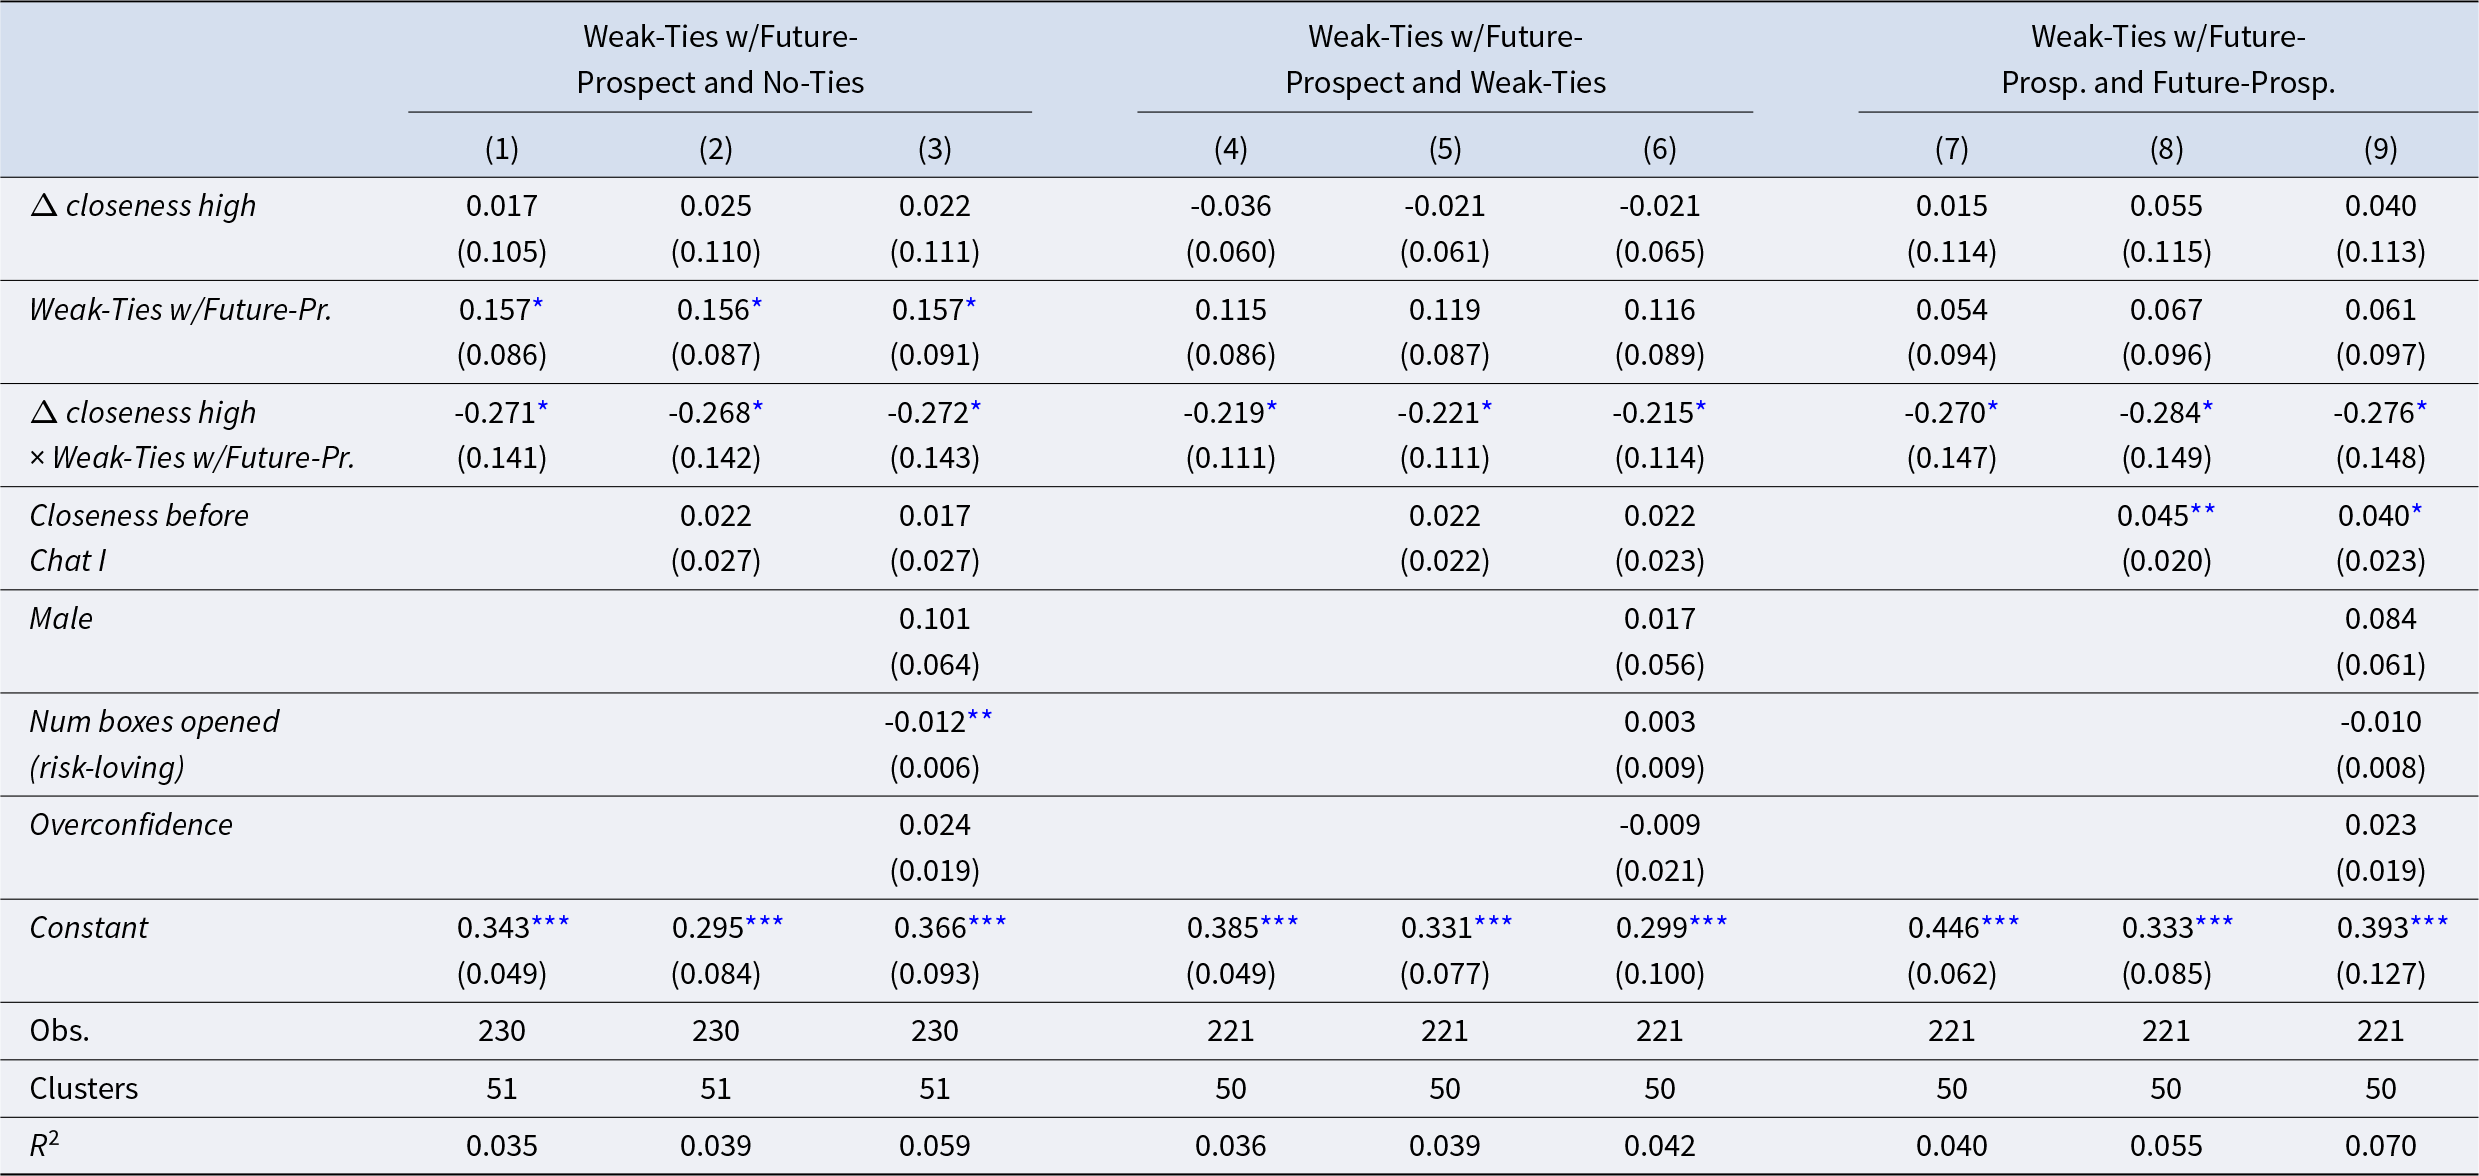
Notes: OLS regression on choosing competition. Data for the No-Ties and the Weak-Ties w/Future-Prospect treatment included in columns (1) to (3). Data for the Weak-Ties and the Weak-Ties w/Future-Prospect treatment included in columns (4) to (6). Data for the Future-Prospect and the Weak-Ties w/Future-Prospect treatment included in columns (7) to (9). Δ closeness high has a value of 1 if Δ closeness is above the median, and 0 otherwise. Weak-Ties w/Future-Prospect is a dummy variable that has the value 1 if the Weak-Ties w/Future-Prospect treatment is played and 0 if the Weak-Ties or the No-Ties treatment is played. Closeness before Chat I depicts the average level of closeness indicated on the IOS scale before Chat I. Num boxes opened (risk-loving)  $\in \{0, 1, ..., 25\}$ represents the number of boxes opened in the bomb-task to measure risk-loving behavior. Overconfidence is measured as the difference of the incentivized belief about the number of correct answers in the Cognitive Reflection Test and the actual number of correct answers. Standard errors are clustered at the matching group level and depicted in parentheses.
*** (**/*) significant at the 1% (5%/10%) level.
To explore the role of existing ties, Columns (4) to (6) of Table 4 report the regression results of the difference of the influence in closeness on competition choice in the case of Weak-Ties w/Future-Prospect and Weak-Ties. The influence of increased closeness to the potential competitors on competition choice in the Weak-Ties treatment is (weakly) significantly lower than in the Weak-Ties w/Future-Prospect treatment. Since the treatment difference was introduced after subjects filled out the IOS scale that we used to calculate the change in closeness, this comparison in the effect of closeness between Weak-Ties and Weak-Ties w/Future-Prospect can be considered causal.
To explore the role of future prospect, we also provide the regressions comparing the effect of difference in closeness between Weak-Ties w/Future-Propspect and Future-Prospect on the choice to compete in columns (7) to (9) of Table 4. These regressions show that the differential effect of change in closeness also exists between these two treatments.
This result remains unchanged after adding further controls – initial closeness, gender, risk preferences, and confidence – to the regression. To show that potential differences in the initial level of closeness do not matter for the result (as we investigate the influence of the change in closeness through Chat I), we include the answer to the IOS scale before Chat I in the regression of columns (2), (5), and (8). As gender is not perfectly balanced among treatments, and as previous literature has shown that gender influences the willingness to compete, we also control for gender in columns (3), (6), and (9). Similarly to before, as choosing to compete can also be driven by confidence and risk preferences, we further control for proxies thereof. Adding the further control variables does not affect the result and strengthens our argument that potentially non-random treatment allocations cannot explain the effect of interest (see Table A.6). Table A.6 also includes the non-incentivized Big 5 personality trait measures (Gosling et al., Reference Gosling, Rentfrow and Swann2003). The results show that among the Big 5, only the level of conscientiousness significantly correlates with the choice to compete in these two treatments. Section 3.3 shows that the finding is also robust to a more detailed measure of closeness instead of the binary measure used in this Section 3.
3.3. Robustness checks
The regression results presented in Sections 3.1 and 3.2 use median splits for the change in closeness. A potential concern is the sensitivity of the results to the specific definition of closeness that we use. To address this, we conduct various tests to assess the robustness of our findings. First, we visually investigate the robustness of our result for different thresholds. Figure A.4 illustrates that, while the number of observations with high closeness change decreases as the threshold increases, the overall trend remains consistent: the disparity in the share of subjects opting for competition between low closeness changes and high closeness changes is most pronounced in the Weak-Ties w/Future-Prospect treatment. Second, in Table A.7 we abstract from the median split and re-estimate Table 3 using the continuous closeness variable. We also show results for the differential effect of closeness between the Weak-Ties w/Future-Prospect and Weak-Ties treatment in Table A.8. Our conclusions remain unchanged.
Another concern might arise from subjects reporting exceptionally high initial closeness, possibly leading to a ceiling effect. Although we control for the initial level of closeness in Sections 3.1 and 3.2, we conduct a robustness check by excluding subjects reporting an initial closeness above 4.5. Excluding these subjects does not change the results qualitatively (see Table A.9 and Table A.10).
So far, we have defined closeness based on the average levels of closeness reported toward both other subjects on the IOS scale before and after Chat I. However, when deciding whether to compete, subjects are unaware of the specific choices made by each potential competitor in the group. Given that the potential competitors can be one or both of the other group members, the relevant metric for closeness appears to be the average of the closeness to each individual in the group. Gächter et al. Reference Gächter, Starmer and Tufano(2025) also look at closeness within a group via the IOS scale. They define closeness as the weakest link among all the links in the group. To assess the robustness of our findings under different definitions of closeness, we rerun the regressions and instead of using the average closeness toward both subjects, we use the (i) lower value of closeness and (ii) higher value of closeness. Table A.11 shows that the main result is qualitatively unaffected, even though the estimated coefficients are slightly smaller. To further investigate this issue, we distinguish between subjects reporting a similar closeness change to both group members and those reporting varying closeness changes toward the other group members. We classify closeness changes between the two subjects as similar if the difference in relation to both other group members is within one point on the 7-point scale. We find that our results are mostly driven by subjects with similar closeness changes in relation to both group members (see Table A.12 and Table A.13).
With our design, we chose a setting where choosing to compete did not impose externalities on other players. Subjects could opt into the competition, but they had no means to compel others to compete against them. If a subject knew that the other two group members had decided not to compete, they would be indifferent between competing and playing individually, as competition without an opponent would be equivalent to the individual incentive scheme in our design. To detect indifference, subjects were asked to rate, on a scale from 1 to 6, how likely they thought it was that each of the two other subjects would choose to compete (non-incentivized). We find that across all treatments, subjects were not indifferent between choosing competition and playing alone (Figure B.1). For further details on belief formation and the accuracy of beliefs, the interested reader is referred to Appendix B.
4. Further results
4.1. The role of gender
Following the seminal work by Niederle and Vesterlund Reference Niederle and Vesterlund(2007), a vast literature has documented a substantial gender difference in selecting into competitive environments (e.g., Gillen et al., Reference Gillen, Snowberg and Yariv2019). In the classical design, strangers can choose whether to compete in solving mathematical tasks. Building on this, recent studies investigate how social and environmental factors influence the observed gender gap. In a recent meta-analysis, Markowsky and Beblo Reference Markowsky and Beblo(2022) find a negligible gender gap in competition choices for verbal tasks. Hanek et al. Reference Hanek, Garcia and Tor(2016) explores the impact of competition size, while Ifcher and Zarghamee Reference Ifcher and Zarghamee(2016) examines the role of performance measures in observing gender differences. Our study contributes by relaxing a critical assumption of prior lab studies: the absence of social ties between subjects. By varying whether potential competitors are random strangers or individuals with prior interactions, and whether further interactions follow potential competition, our data can enhance the understanding of the environmental factors that mitigate the gender gap in choosing competition.
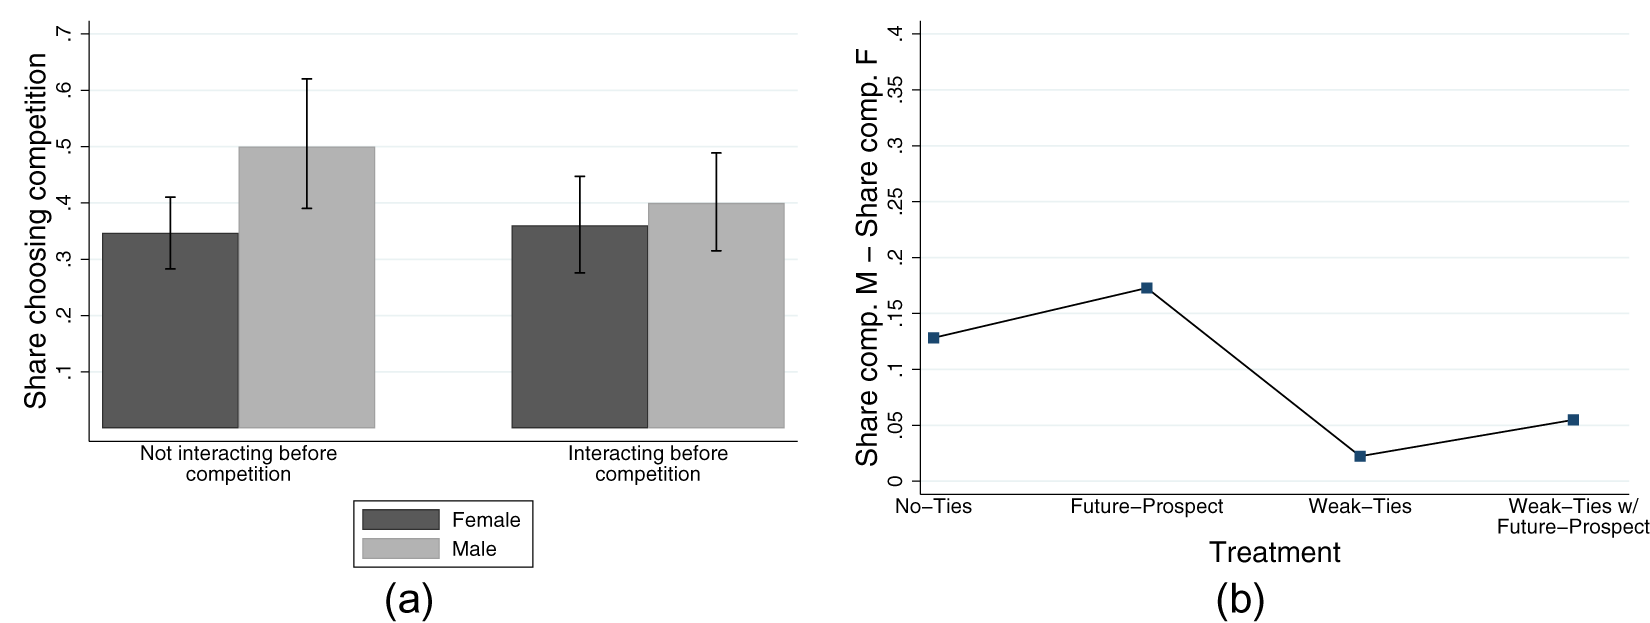
For each treatment  $i \in \{$No-Ties, Future-Prospect,Weak-Ties,Weak-Ties w/Future-Prospect $\}$ and gender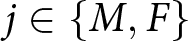 $j \in \{M,F\}$, we denote the share of subjects choosing competition as $x_i^j$. The difference in shares between male and female participants is denoted as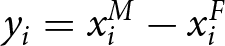 $y_i = x_i^M - x_i^F$.Footnote 12 Figure 4(a) presents a noteworthy pattern. In the Not interacting before competition treatments, we observe a significant gender difference in subjects’ competition choices. The proportion of men choosing competition is approximately 15 percentage points higher than that of women, a difference that is statistically significant at the five percent level. This result aligns with previous findings in the literature (e.g.,Niederle & Vesterlund, Reference Niederle and Vesterlund2007, Gillen et al., Reference Gillen, Snowberg and Yariv2019, Van Veldhuizen, Reference Van Veldhuizen2022).
Gender and choice to compete in different treatments. (a) Comparison between treatments with unknown and known competitors. (b) Gender difference in competition among all treatments

This result remains robust when controlling for risk preferences and overconfidence, following the approach of Niederle and Vesterlund (Reference Niederle and Vesterlund2007) (see Table A.14). Although Gillen et al. (Reference Gillen, Snowberg and Yariv2019), Van Veldhuizen (Reference Van Veldhuizen2022), and Lozano and Reuben (Reference Lozano and Reuben2025) demonstrate that gender differences in risk and overconfidence, once measurement error in covariates is properly accounted for, largely explain the observed gap, replicating this finding is beyond the scope of this article. Instead, our focus is on comparing the gender gap in competition choices across treatments, assuming measurement error plays a similar role in all conditions. In the Interacting before competition treatments, a different pattern emerges. The gender gap is much smaller (4 percentage points) and not statistically significant.Footnote 13 Controlling for risk preferences and overconfidence does not alter this conclusion (Table A.15). This result is consistent with our pre-registered hypothesis. However, the difference in gender gaps between the Not interacting before competition and Interacting before competition treatments is not statistically significant (p-value: 0.175). Figure 4(b) visualizes the differences for each treatment. The figure shows that the results in Figure 4(a) are not driven by one particular treatment. It also shows that meeting after the competition does not affect the gender difference in preferences for competition in any meaningful way. We therefore carefully interpret our findings as indicative evidence that the institutional setting plays a role for the observed gap in willingness to select in competitive environments.
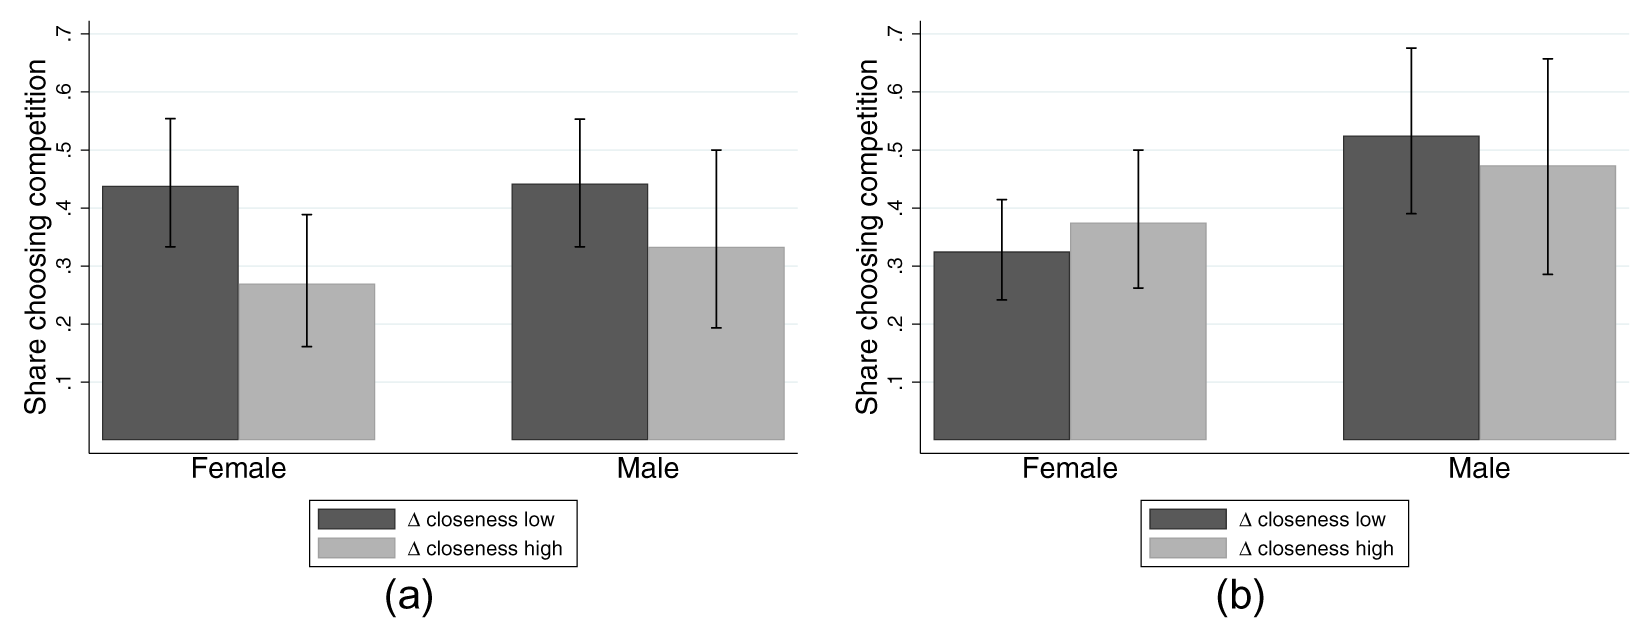
In the same way as in Section 3, we now extend our analysis by adding the closeness dimension. We provide three main results. First, we separately investigate the responses of male and female subjects to closeness. In Figure 5, we show the difference in preferences for competition between subjects that report low changes in closeness and subjects that report high changes in closeness, separately for both genders. In the Not interacting before competition treatments, neither male nor female subjects show any difference in preferences for competition between both groups (Panel 5b). In the Interacting before competition treatments, we find a significant difference between the groups for female participants, while the effect for male participants is also negative, but is smaller (Panel 5a). Second, the within-gender change in preferences for competition across treatments is also significant for females (p-value = 0.07), while it is insignificant for males. Third, the decreased gender difference in preferences for competition observed in Figure 4 is attributable to a decrease in willingness to compete for male subjects. We also show that our main result from the previous section, the decrease in competition choice as a response to meeting after the competition, is not a gender-driven effect (see Figure A.3).
Choice to compete in different treatments, split by gender of the participant. (a) Interacting before competition (Weak-Ties and Weak-Ties w/Future-Prospect). (b) Not interacting before competition (No-Ties and Future-Prospect)

4.2. Increasing closeness through chat I
The chat intervention significantly affects perceived closeness. To explore whether the endogenous content of Chat I correlates with the change in closeness, we combine the data from all treatments to test and validate the induced closeness via the Chat I stage (as the elicitation after Chat I was conducted before the treatment differences were announced). We coded the content of the conversations in each chat on multiple dimensions.Footnote 14 Table A.16 reports the results and shows that the change in closeness positively correlates with answering the questions proposed by Aron et al. Reference Aron, Melinat, Aron, Vallone and Bator(1997). So do other chat content dimensions such as positive sentiment, positive emotions, lack of negative emotions, and expression of agreement. Overall, these results confirm that the chat induced reasonable variation in closeness between subjects.
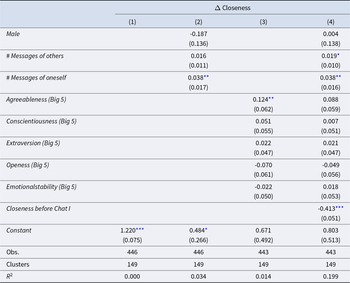
While the chat content correlates with closeness formation, we do not find that subjects’ personality affects closeness. To get a better understanding of the predictors of closeness formation, Table 5 reports the results of OLS regressions of correlates of the change in closeness across all treatments. The OLS regression in column (1) shows that the chat increases the stated closeness by 1.22 units on the 7-point IOS scale, which significantly differs from zero. The regression analyses in Table 5 further reveal that the intensity of the chat positively correlates with the increase in closeness to the other two group members of the chat. Examining the answers in the Big 5 questionnaire taken from Gosling et al. Reference Gosling, Rentfrow and Swann(2003), we can see in column (3) of Table 5 that individuals with higher Agreeableness scores show a significantly greater increase in stated closeness toward the other two members in Chat I. Including the stated closeness before Chat I as a control removes the significant correlation with the Big 5 measures. The personality traits of the other group members do not seem to have an impact on the increase in closeness. Regressing the other’s person personality traits on the change in closeness to this person renders only insignificant results (as shown in Table A.17 in the Appendix).
Change in closeness through Chat I and Big 5 personality traits

Notes: OLS regression of the difference in stated closeness to the two other group members after and before Chat I. # Messages of others counts the number of messages sent by the other two group members in Chat I. # Messages of oneself refers to the number of messages sent in Chat I by the respective individual. All Big 5 traits are coded 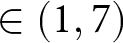 $\in (1,7)$ and measured via the short Big 5 questionnaire (Gosling et al., Reference Gosling, Rentfrow and Swann2003). Standard errors (in parentheses) are clustered at the Chat-I-group level.
*** (**/*) significant at the 1% (5%/10%) level.
4.3. Performance in the task
In addition to the choice of whether to compete, the experimental design also allows us to examine another outcome variable: the subjects’ performance in the Task stage. In this stage, participants were tasked with solving a letter grid, requiring them to identify three hidden words within a 10x10 letter matrix. We chose this task for several reasons. First, traditional tasks like number-adding were unsuitable for our online experiment conducted via z-Tree unleashed, as we could not reliably prevent subjects from using external tools. Trivia questions also presented challenges, given the difficulty in restricting subjects’ access to online search engines. By contrast, the letter grid task minimized opportunities for cheating. Second, we aimed to avoid strong correlations between performance and gender stereotypes or traits easily discernible through the chat. The time spent on examples (average of 14.03 seconds) and the number of times examples were viewed (average of 1.08 times) indicate that the task was generally easy to comprehend. Across treatments, there were no significant differences in these numbers (p > 0.1 for all comparisons). Table A.18 in the Appendix demonstrates that neither the total time nor the frequency of viewing examples correlates with the choice to compete. Additionally, the time taken to solve the task does not correlate with the time or frequency of viewing examples.
In Table 6, we show the results of regressions using the number of seconds needed to solve the task as dependent variable. One of four letter grids was randomly selected at the session level. We included letter-grid fixed effects in the regressions to account for varying difficulty. The regressions in Table 6 reveal a strong relationship between cognitive reflection, measured by the 7-item CRT (Toplak et al., Reference Toplak, West and Stanovich2014), and performance.Footnote 15 Subjects with higher CRT scores exhibit significantly better performance in the letter grid task. As the task required finding three German words in the letter grid, we also included a dummy variable indicating whether the participant was born in Germany. The regressions indicate no significant effect. Columns (1), (3), and (4) further regress performance on the choice to compete. If better-performing subjects choose competition more frequently, or if choosing competition leads to better performance in the task, we would expect a negative coefficient. Although the coefficient’s sign is negative, the standard errors indicate that this correlation is not statistically significant. Given our incentive structure, one might conjecture that participants who feel very close to other group members choose competition and intentionally perform poorly to boost the other players’ payoffs. However, the small and statistically insignificant coefficient for change in closeness suggests that this motivation is negligible in our setting.
Performance in letter grid task: Time needed to solve
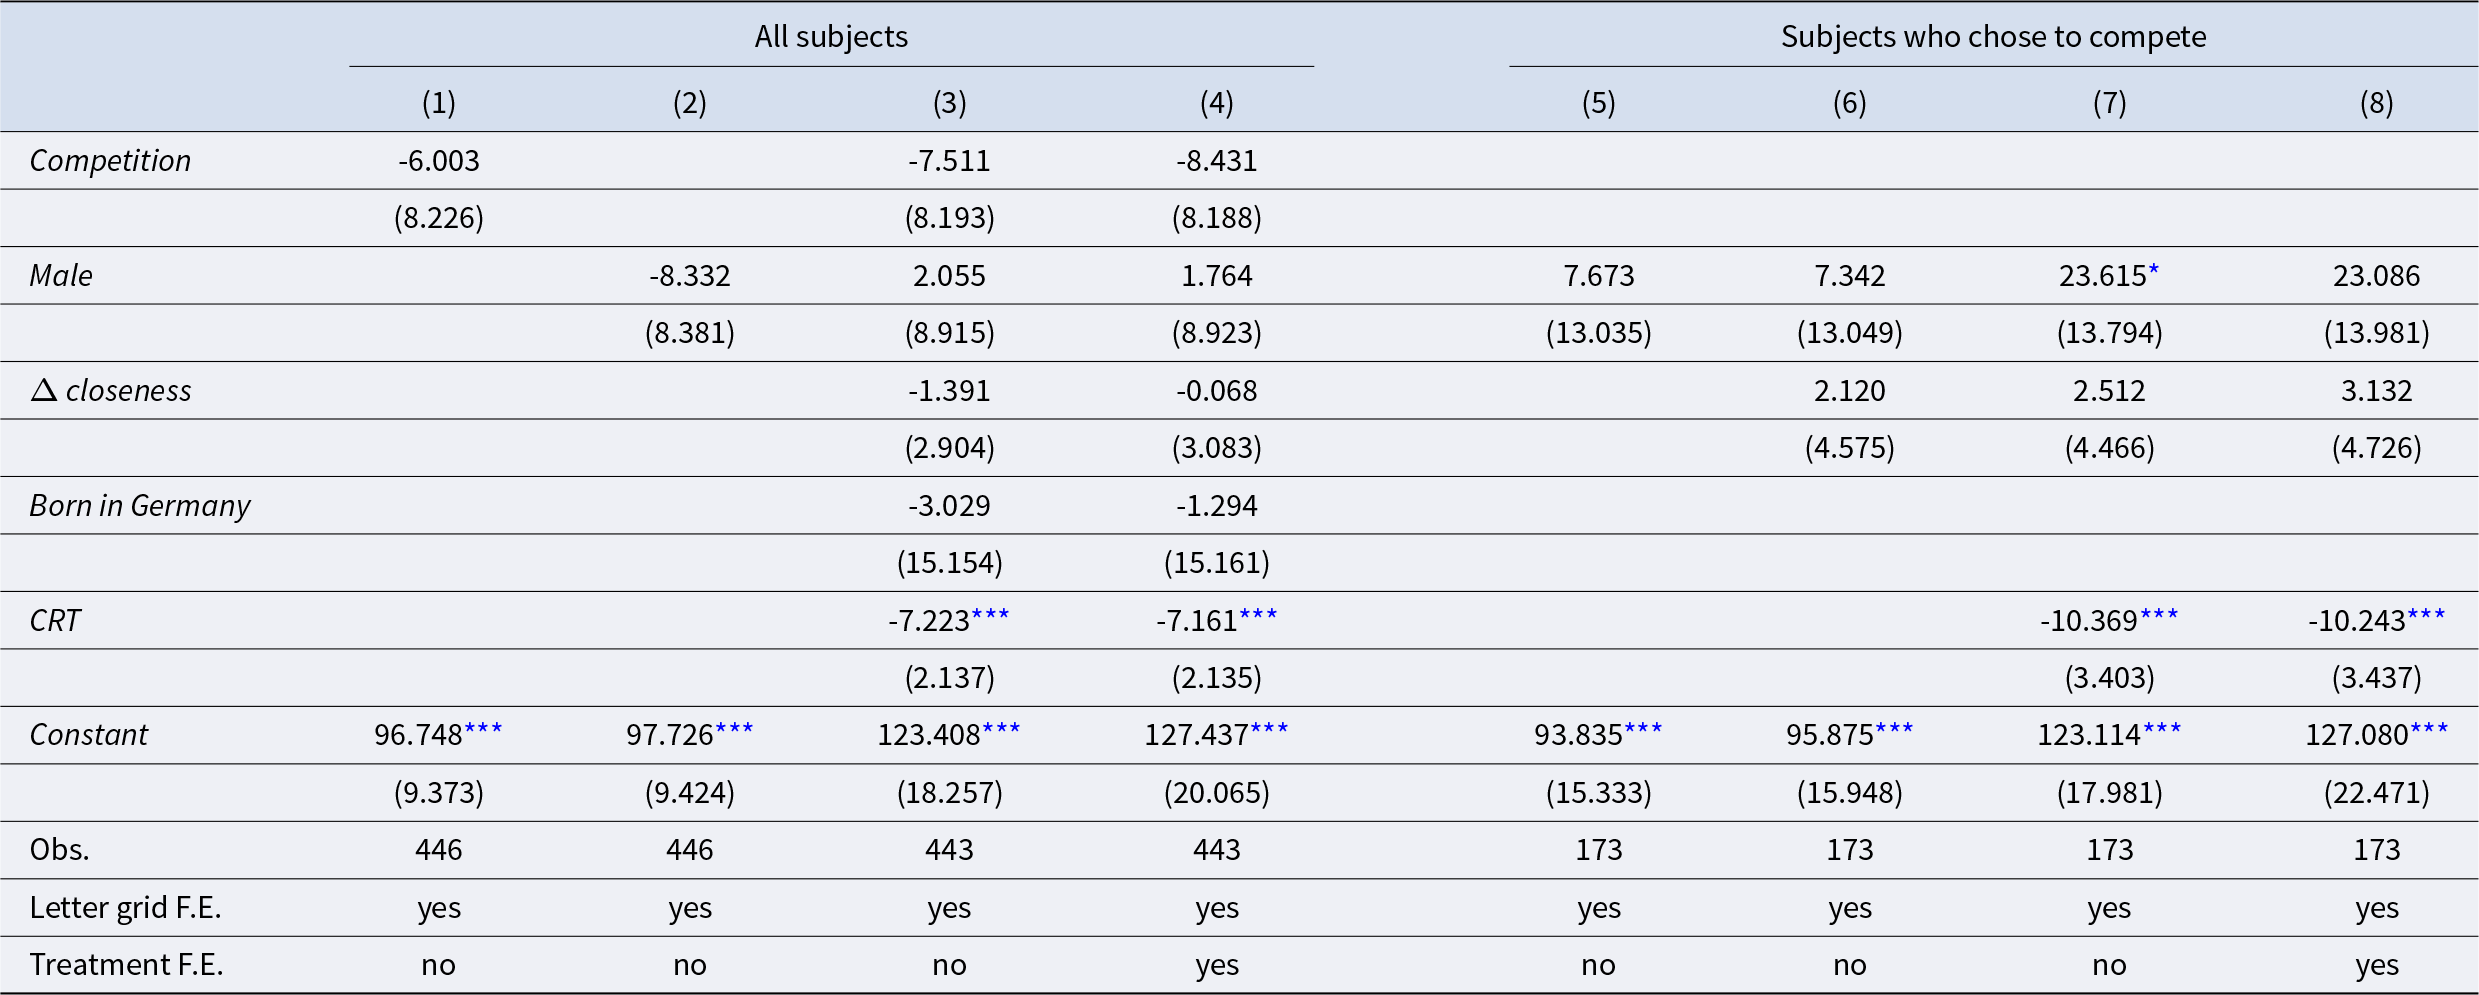
Notes: Tobit regressions. Dependent variable is the number of seconds needed to solve the letter grid task. The number is capped at 200 seconds. Columns (1)–(4) contain data of all subjects. Columns (5)–(8) contain data for the sub-sample of subjects who chose competition. Competition is a dummy variable with a value of 1 if the subject played the task in competition. Δ closeness depicts the change in average closeness through Chat I. CRT represents the number of correctly answered questions in the CRT ( $\in \{0,1,..,7\}$). born in Germany is a dummy variable that equals 1 if the subject indicated being born in Germany in the post-experimental questionnaire. One of four letter grids was randomly chosen to be played in a session. Fixed effects for the letter grid that was played are included in all columns, and columns (4) and (8) also contain treatment-fixed effects. Standard errors are depicted in parentheses.
*** (**/*) significant at the 1% (5%/10%) level.
5. Discussion and conclusion
We study the relationship between social ties and individuals’ willingness to compete. Anecdotal evidence suggests that individuals may be less willing to compete against their friends. We conducted an experiment to (i) test whether there is a causal relationship between social ties and willingness to compete and (ii) understand the underlying mechanisms behind the effect to derive relevant implications for the design of workplace policies.
Most studies on individuals’ willingness to compete have been conducted in a laboratory setting, involving anonymous agents. Since real-world interactions often occur between individuals who know each other and/or frequently interact with each other, complete anonymity is a strong assumption. Furthermore, several studies have shown that relaxing the anonymity assumption affects social decision-making in a meaningful way (e.g., Bohnet and Frey, Reference Bohnet and Frey1999). We use an experimental design tailored to manipulate social ties between individuals. In contrast to the previous literature, we design our experiment such that it allows us to isolate two important mechanisms behind the effect of social ties. Following the seminal study by Granovetter Reference Granovetter(1973), we differentiate between the reduced social distance between individuals and repeated interactions among individuals.
We compare individuals’ willingness to compete across four treatments. We find that individuals who form social closeness and anticipate future interactions exhibit a reduced willingness to compete with one another, compared to anonymous individuals. We establish that this effect cannot be attributed solely to existing social ties or solely to a future prospect of meeting again. Rather, the combination of future prospect and existing weak ties reduce the willingness to compete. Strategic monetary considerations do not drive this effect since the interaction after the competition is unincentivized. We also rule out ambiguity aversion to explain the effect since the potential competitors are known in both settings (Weak-Ties as well as Weak-Ties w/Future-Prospect). We further find that reduced social distance can be associated with a decrease in the gender gap in the willingness to compete. This finding is in line with several studies from the social cognition literature that provide evidence showing that social connections can affect gender differences (Costa Jr et al., Reference Costa, Terracciano and McCrae2001, Chapman et al., Reference Chapman, Duberstein, Sörensen and Lyness2007, Schulte-Rüther et al., Reference Schulte-Rüther, Markowitsch, Shah, Fink and Piefke2008, Weisberg et al., Reference Weisberg, DeYoung and Hirsh2011, Friebel et al., Reference Friebel, Lalanne, Richter, Schwardmann and Seabright2021).
Our results have important implications for managers seeking to design efficient workplace policies. Social ties can inform managerial policy in at least two ways. On the one hand, company policies can be tailored to strengthen social ties among co-workers, for example via team-building events, office policies, and limited remote work options that seek to influence social ties among co-workers (Yang et al., Reference Yang, Holtz, Jaffe, Suri, Sinha, Weston, Joyce, Shah, Sherman, Hecht and Teevan2022). Such policies can lead to less competitive behavior between employees. On the other hand, company policies are often set to prevent promoted workers obtaining leadership positions in the teams with which they have formed social ties (Benson et al., Reference Benson, Li and Shue2019). This can lead to more competitive behavior among employees in promotion tournaments.
Our results also contribute to a broader understanding of how social ties affect economic decision-making (Buser et al., Reference Buser, Niederle and Oosterbeek2014, among others). Social ties matter for social decision-making by affecting how much individuals care about others’ behavior and well-being (Uzzi, Reference Uzzi1999, Akerlof, Reference Akerlof1997). So far, the importance of social ties for economic behavior has been shown, for example, in the context of cooperation (Apicella et al., Reference Apicella, Marlowe, Fowler and Christakis2012, Harrison et al., Reference Harrison, Sciberras and James2011), trust and trustworthiness (Abbink et al., Reference Abbink, Irlenbusch and Renner2006), and norm enforcement (Goette et al., Reference Goette, Huffman and Meier2012). We extend this literature by adding the choice to compete as an outcome variable to this literature.
In addition, our results also add nuance to the various definitions of social ties and related concepts used in the literature. For example, we acknowledge that our approach to inducing social ties using the question-based methodology proposed by Aron et al. Reference Aron, Melinat, Aron, Vallone and Bator(1997) notably differs from the approach taken by Cornaglia et al. Reference Cornaglia, Drouvelis and Masella(2019), who use the minimal group paradigm and task to guide the chat. Furthermore, our inclusion of a future prospect of chatting again after the competition distinguishes our approach from Cornaglia et al. Reference Cornaglia, Drouvelis and Masella(2019), who use a single chat round. This may explain the discrepancies in the results. The discrepancy may arise because minimal groups hinge on similarity, whereas our approach to inducing social ties does not inherently imply greater similarity among closer participants. The discrepancy in findings may also arise due to the element of group identity, which is excluded in our design. Our studies in combination thus provide complementary insights into the ways social dynamics shape decision-making in such a context.
Our findings point to exciting new avenues for future research. Several studies suggest that competitive incentive schemes can have adverse effects. We suggest that fostering social ties may mitigate this effect, by reducing preferences for competition. However, future research could seek to test this directly, by investigating whether social ties reduce the chances of engaging in sabotage behavior, which is welfare-harming, different from our zero-sum competition. Another promising avenue would be to explore whether a causal relationship also exists the other way around, namely, from a given incentive structure to endogenous tie formation. Several studies highlight the importance of social networks for career success. If competitive incentive structures impact social tie formation, this could also have practical implications for designing workplace policies.
Supplementary material
The supplementary material for this article can be found at https://doi.org/10.1017/eec.2025.10016.
Replication Packages
To obtain replication material for this article, https://doi.org/10.17605/OSF.IO/K2JTA.
Acknowledgements
We would like to thank Fabian Dvorak, Urs Fischbacher, Ben Greiner, Rachel Kranton, Wladislaw Mill, Nikos Nikiforakis, Ernesto Reuben, Lise Vesterlund, Roberto Weber, the research groups at the Center for Behavioral Institutional Design, and the Thurgau Institute of Economics, and participants at several seminars, workshops and conferences for valuable comments. This study has been approved by the GfEW Institutional Review Board (No. q5YuGoi5). We gratefully acknowledge financial support from the Thurgau Institute of Economics at the University of Konstanz and Moritz Janas gratefully acknowledges financial support from Tamkeen under NYU Abu Dhabi Research Institute Award CG005.
Statements and Declarations
All authors declare that they have no conflicts of interest.








 Open access

