


INTRODUCTION
Radiocarbon dating has been applied to medieval manuscripts of parchment before in multiple studies (Bonani et al. Reference Bonani, Ivy, Wölfli, Broshi, Carmi and Strugnell1992; Carmi Reference Carmi2002; Donahue et al. Reference Donahue, Olin and Harbottle2002; Santos and García-Leon Reference Santos, Gómez-Martínez and García-León2010; Brock Reference Brock2013; Kasso et al. Reference Kasso, Oinonen, Mizohata, Tahkokallio and Heikkilä2021). The primary objective of these studies has been to provide an absolute date for a historical object lacking the needed contextual information to verify its age and to provide a timeline for the historical context of the information the manuscript contains. However, sampling cultural heritage material such as medieval manuscripts for radiocarbon dating can be challenging due to the limited sample sizes allowed. Using known-age material, Kasso et al. (Reference Kasso, Oinonen, Mizohata, Tahkokallio and Heikkilä2021) demonstrated that it is possible to obtain reliable radiocarbon dates of parchment samples down to 0.3 mg carbon targets for accelerator mass spectrometry (AMS), corresponding to typically ca. 3 mm2 area parchment sample sizes. This allows minimal sampling and prevents unnecessary destructive intervention to the object. In this study, we apply our previous method (Kasso et al. Reference Kasso, Oinonen, Mizohata, Tahkokallio and Heikkilä2021) to a large set of samples and evaluate our results from the viewpoint of the applicability of radiocarbon dating as an absolute dating method parallel to traditional methods in dating medieval manuscripts. Moreover, we address the challenges when working with fragmentary parchment material and underline the necessity of pre-screening material prior to sampling.
The Fragmenta membranea collection at the National Library of Helsinki, Finland, consists of ca. 9300 leaves of manuscript fragments from altogether ca. 1500 books. Since the late 20th century, these parchment fragments have been identified as the key sources of understanding the arrival and development of the medieval written culture in Finland and in the other Nordic countries (Heikkilä Reference Heikkilä and Heikkilä2010), but the chronological understanding of these fragments is still partially unclear. Radiocarbon dating provides a scientific parallel to the traditional palaeographical estimation of the ages of the fragments. Combining these methods can potentially narrow down the age range of manuscripts extensively, and help to produce a more reliable timeline for the historical developments and information these objects contain (Kasso et al. Reference Kasso, Oinonen, Mizohata, Tahkokallio and Heikkilä2021).
Despite the value of the Fragmenta membranea collection from a historical perspective, a key challenge in working with these fragments is their condition. To aid our understanding of the radiocarbon dating and to mitigate error in our analysis contributed by the occasionally poor condition and dirty state of the fragments, the role of parchment (collagen) preservation and potential contamination were also addressed non-destructively by using Fourier Transform Infra-Red (FTIR) spectroscopy. FTIR has been previously used in providing key information in regards to the chemical deterioration of parchment (Larsén et al. Reference Larsén, Vestergaard Poulsen Sommer, Mühlen Axelsson, Engel, Schirò, Larsén, Moussakova and Kecskeméti2011) and to study possible contaminants (D’Elia et al. Reference D’Elia, Gianfrate, Quarta, Giotta, Giancane and Calcagnile2007; Gianfrate et al. Reference Gianfrate, D’Elia, Quarta, Giotta, Valli and Calcagnile2007; Brock et al. Reference Brock, Dee, Hughes, Snoeck, Staff and Bronk Ramsey2018), from past conservation treatments or carbonates deriving from the lime bath associated with the manufacture and life-cycle parchment (Doherty et al. Reference Doherty, Alexander, Vnouček, Newton and Collins2021; Kasso et al. Reference Kasso, Oinonen, Mizohata, Tahkokallio and Heikkilä2021).
Additionally, the same reference parchment material used in Kasso et al. (Reference Kasso, Oinonen, Mizohata, Tahkokallio and Heikkilä2021) was investigated in this study both before and after the chemical pretreatment with FTIR to exclude faults in our preparation method. In order to study the possible impact of collagen preservation and contamination in our 14C results, the fragments were measured to obtain FTIR spectra and a subsequent comparison was made between the FTIR observations, the measured radiocarbon ages converted to calendar years and the paleographic estimates. We present our results in the light of the FTIR observations on collagen quality and contaminants and by emphasizing the role of statistical uncertainties and changes of atmospheric 14C contents during the last 1000 years. In wider context, our study aims to bring together both humanities and natural scientific methods in order to learn more about the material aspects of medieval parchment books that were used and produced in the northern edge of Europe.
MATERIALS AND METHODS
The objective of this study, the Fragmenta membranea manuscript fragments are originally dated with palaeographic and codicological methods, based on the style of writing, decoration, and preparation of parchment, relying on human eye and existing typologies about the chronological development of these features during the Middle Ages. Despite continuous scholarly research, the calendar-year estimates (Table 2) for most of these fragments are be wide and imprecise. Some exceptions occur, to mention the fragments of the printed Missale Aboense that have a very narrow and highly reliable reference dates of AD 1478–1488, as Missale Aboense is known to have been printed in Lübeck by Bartholomeus Ghotan in 1488 (Heikkilä Reference Heikkilä and Heikkilä2010). This timeframe also corresponds to our reference materials of AD 1471 and AD 1506 used also in Kasso et al. (Reference Kasso, Oinonen, Mizohata, Tahkokallio and Heikkilä2021). Therefore, we consider those samples also as suitable reference material to additionally monitor the quality of the process in our sample preparation. Overall, we aimed to date 14 different fragmentarily preserved book contexts, by sampling two to three leaves from the same context.
Medieval manuscripts were made with parchment, that is processed animal skin, and as a material it is extremely durable (Vnouček Reference Vnouček2005). Parchment consists almost entirely of collagen type I, a fibrous protein, and it can be impacted by oxidation and acid hydrolysis as deteriorative mechanisms that can, over time, lead to the parchment turning into a gelatin-like material (Larsén et al. Reference Larsén, Vestergaard Poulsen Sommer, Mühlen Axelsson, Engel, Schirò, Larsén, Moussakova and Kecskeméti2011). Consequently, already damaged fibers of the parchment are even more prone to deterioration (Larsén et al. Reference Larsén, Vestergaard Poulsen Sommer, Mühlen Axelsson, Engel, Schirò, Larsén, Moussakova and Kecskeméti2011). As a result, parchment may look like it is in good condition, but the mere physical appearance of parchment is not sufficient enough to evaluate the collagen preservation for further analysis, such as radiocarbon dating.
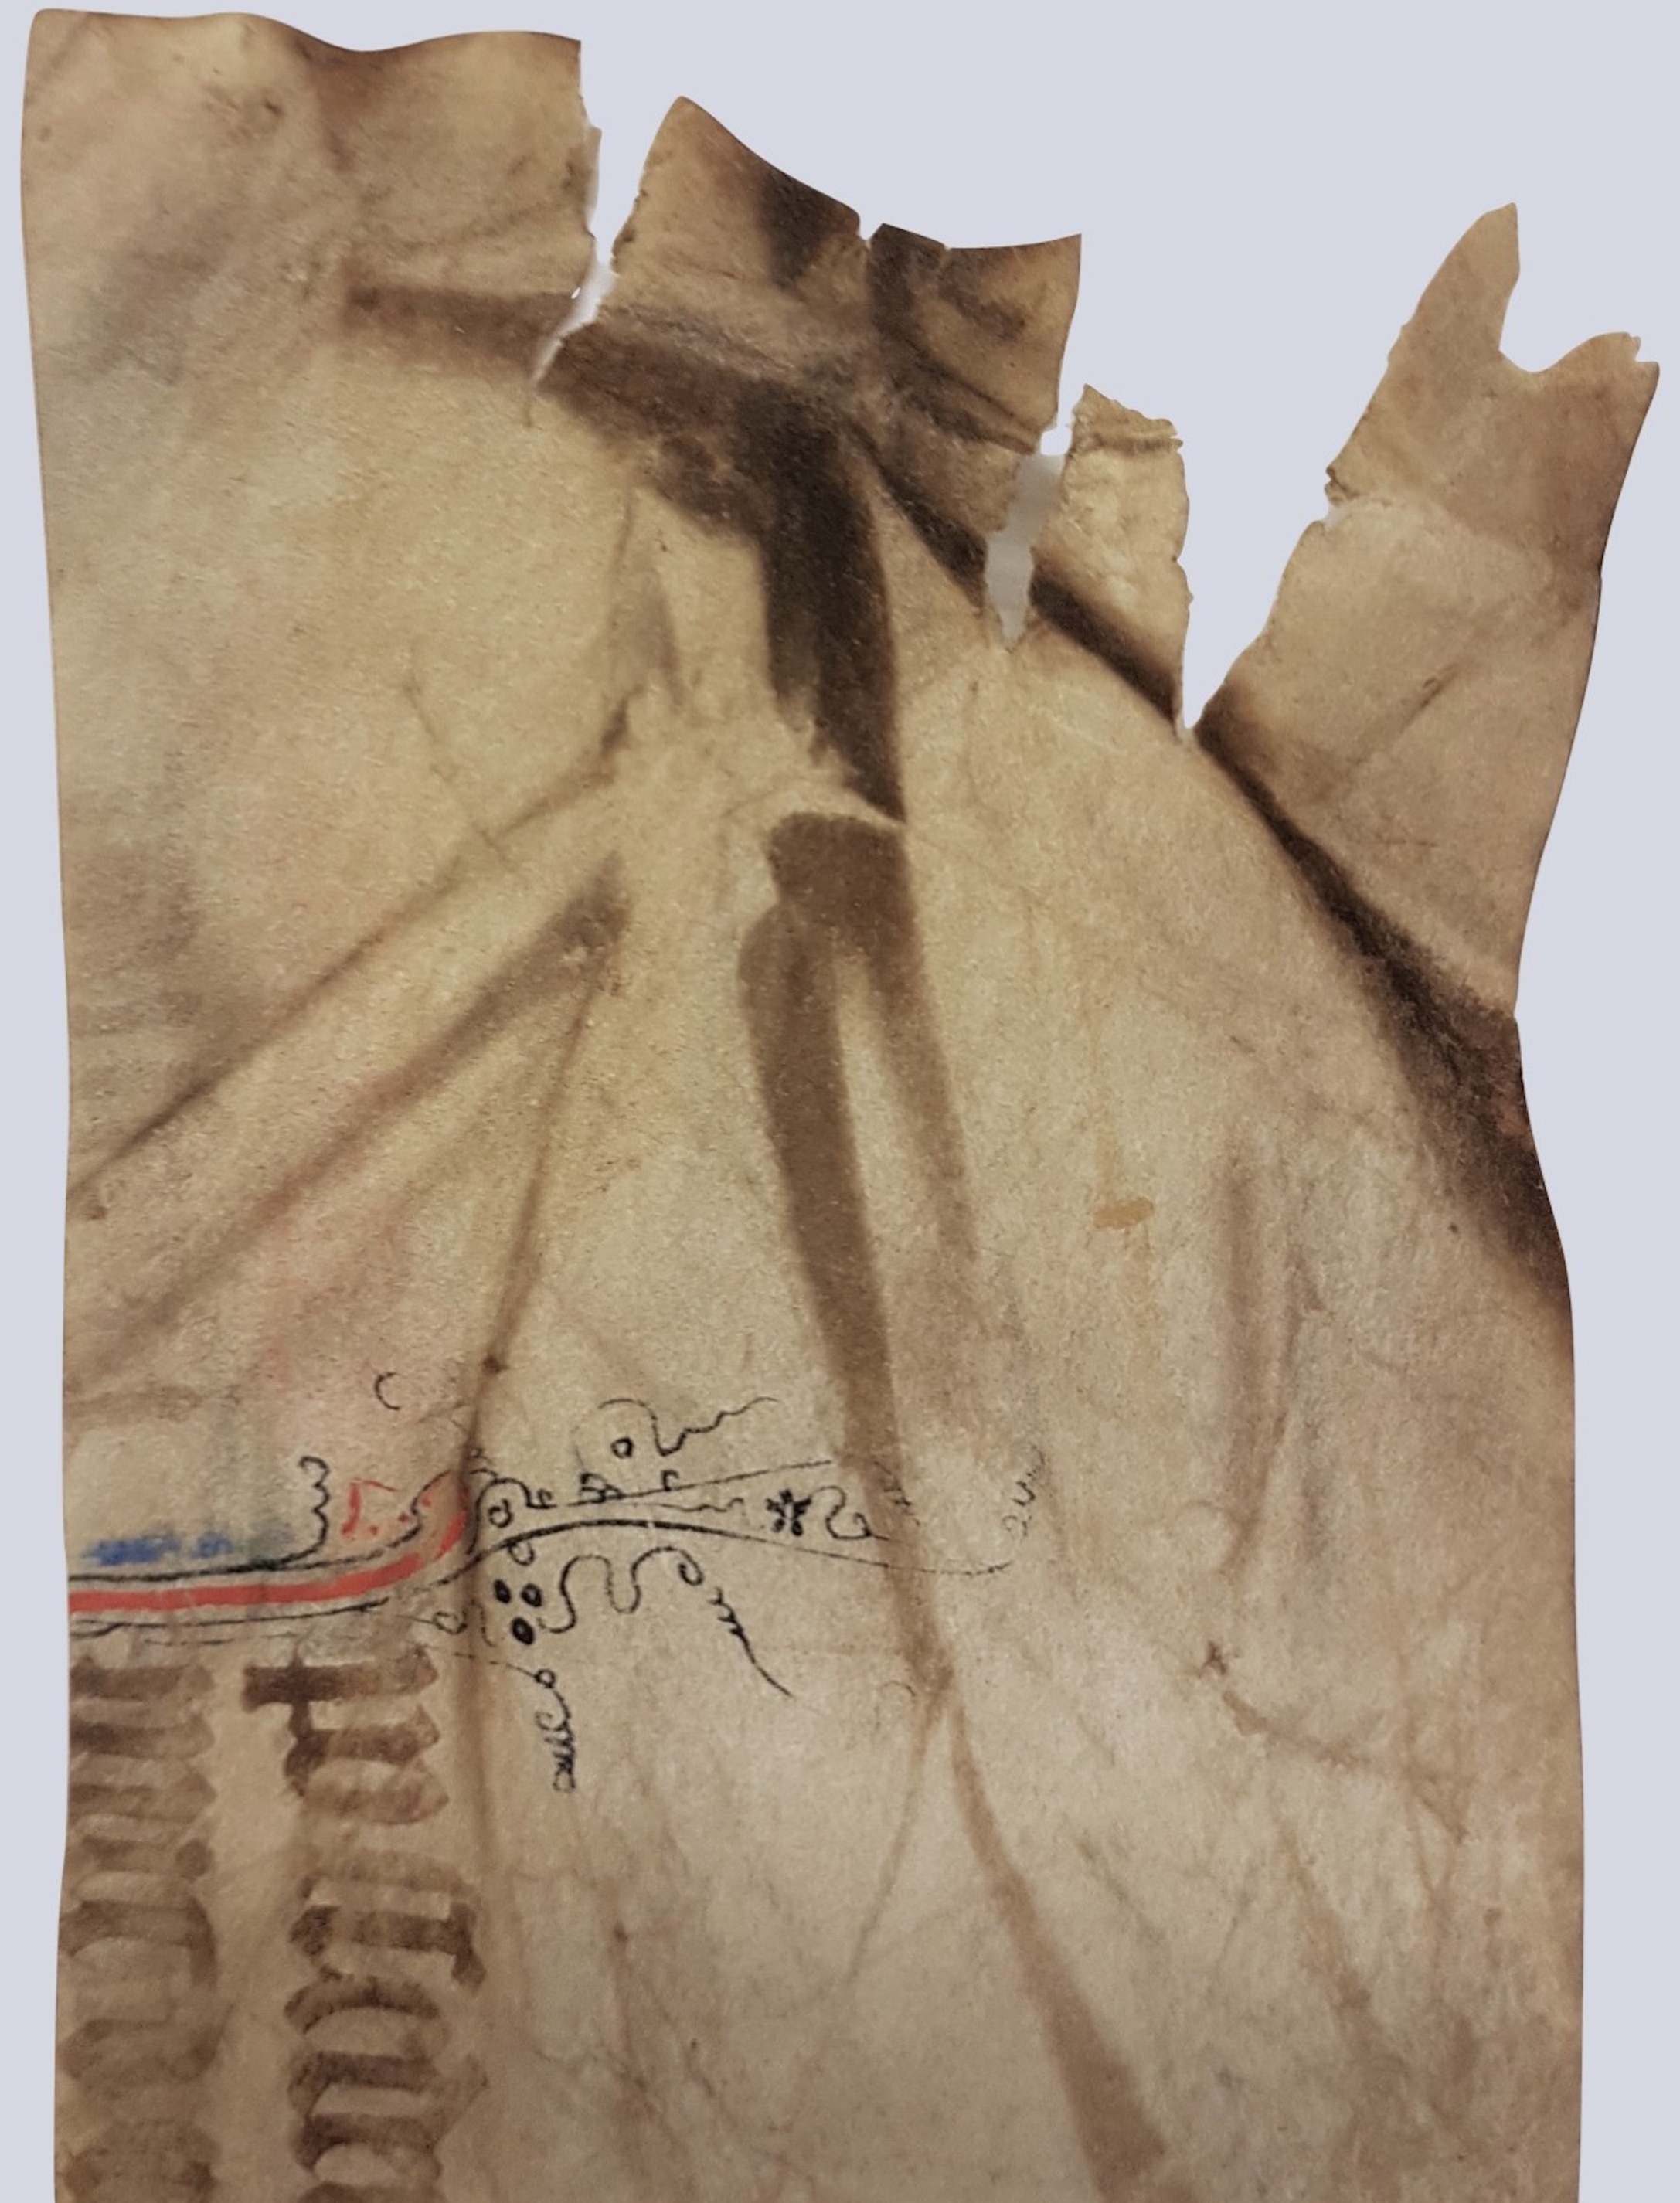
This might also be the case with the Fragmenta membranea. The fragments are in a variable condition, with some in excellent condition, some with clear visible marks and damage from their use and exposure to e.g., fire (see Figures 1 and 2). Both the challenges they have been subjected to over their long history and the possible side effects of recent conservation procedures may have jeopardized the integrity of the collagen in the fragments.
Sampled page of the Fragmenta membranea, F.m. VII.67, f. 7l. Helsinki, National Library.

The radiocarbon dating sample was taken from the upper left corner of the fragment. The area shows wear and tear, including discoloration.
In regard to sampling, this situation poses a challenge and brings forward a sampling paradox. In general, samples should not be taken from any areas of the parchment that would intervene or destroy the historical evidence and information of the manuscripts as historical objects. In addition to this, also aesthetical values should be considered when sampling a manuscript that in the future could be displayed. From the conservation and preservation point of view, it is easiest to and the most ethical to undergo sampling of already damaged areas, to avoid more impairment to the object. This, however, is not an ideal starting point from the perspective of the technical requirements of radiocarbon dating. Sampling damaged areas may result in samples that are not of the highest quality for the analytical purposes, and this must be considered throughout the interpretation of the results.
FTIR
FTIR measures the vibrational frequencies of the different bonds in each molecule when they absorb infrared radiation. Fourier transform refers to a mathematical technique that is used to convert spectral data from a time domain (interferogram) to a frequency domain (spectrum). FTIR therefore provides information about the various functional groups (e.g., –NH2, –OH, –COOH, C=O, etc.) present in molecules. The vibrational frequencies of functional groups are affected by the chemical environment, strength of the bond, masses of the atoms, in particular. FTIR can therefore also provide valuable structural information for each molecule. In the case of parchments, FTIR can be used to obtain structural information about the protein collagen and other possible compounds present in the samples. FTIR is a non-invasive analytical technique which does not require large sample quantities and extensive sample preparations, making it especially useful for delicate samples such as medieval manuscripts. However, here we would like to note that FTIR does not recognize elemental carbon i.e., carbon indigenous to a fire exposure.
Parchment sample from Italy AD 1506 (Kasso et. al, Reference Kasso, Oinonen, Mizohata, Tahkokallio and Heikkilä2021), acetone and the collagen reference (Sigma Aldrich ref. C7774) were measured with a Bruker Alpha ATR-FTIR spectrometer in absorbance mode (16 scans). During each measurement the sample size was selected such that the sample covered the ATR crystal (3 × 3 mm slice of parchment Italy AD 1506, ∼1 mg of collagen reference and a droplet of acetone). Aim of these measurements was to (a) verify capability of FTIR to identify collagen samples and (b) verify the impact of chemical pretreatment procedure on the parchment samples. For (b) the measurements were performed before and after the chemical pretreatment on the Italian reference samples of AD 1506. Additionally, all the chemically untreated Fragmenta membranea parchment samples (n = 35) were measured with Agilent 4300 Handheld FTIR spectrometer. The handheld spectrometer allowed in-situ measurements in the premises of the National Library to avoid transport damage of the invaluable parchment fragments. All the data was saved using the MicroLab PC software. The data was converted into csv files with Essential FTIR®. Finally, the data was analyzed with Rstudio 1.3.1073 (R version 4.0.2) using the ChemoSpec package (Hanson Reference Hanson2015). An example FTIR spectrum of parchment can be seen in Figure 3.
An example of parchment FTIR spectrum (sample I.31 A1). The relevant peaks are shown in the figure (Carşote et. al. Reference Carşote, Budrugeac, Decheva, Haralampiev, Miu and Badea2014; Hajji et. al. Reference Hajji, Seghrouchni, Lhassani, Talbi, Bouamrani and Yousfi2018).

A baseline correction was implemented on all of the spectra prior to analysis and principal component analysis (PCA) was implemented on the baseline corrected spectral absorbances. The PCA analysis aimed to identify components related to overall collagen preservation and contaminants. In addition, the following FTIR parameters were calculated from the individual spectra: A1, A2, A3, A1/A2, ACO3, and Δν (see Table 1 for explanations). The spectra were clustered based on all of the 35 principal components using the k-means clustering algorithm. The algorithm randomly places k centroids in the dataset and finds the nearest centroid for each observation based on squared euclidean distance. An observation is then assigned to a cluster k. Afterwards, new centroids are calculated based on the means of the observations in each cluster, and the aforementioned process is repeated until the algorithm reaches a local optimum (Gareth et al. Reference Gareth, Daniela, Trevor and Robert2013).
The calculated FTIR parameters.

List of the Fragmenta membranea manuscript fragments sampled in this study with their palaeographical age estimations, radiocarbon ages and their uncertainties as standard deviations (σ). Since comparison of the estimated paleographic ages and radiocarbon ages are not straightforward, the calendar-year calibrations are provided in Supplementary Information (Table S2) combined with subsequent detailed analyses based on 14C-date simulations.
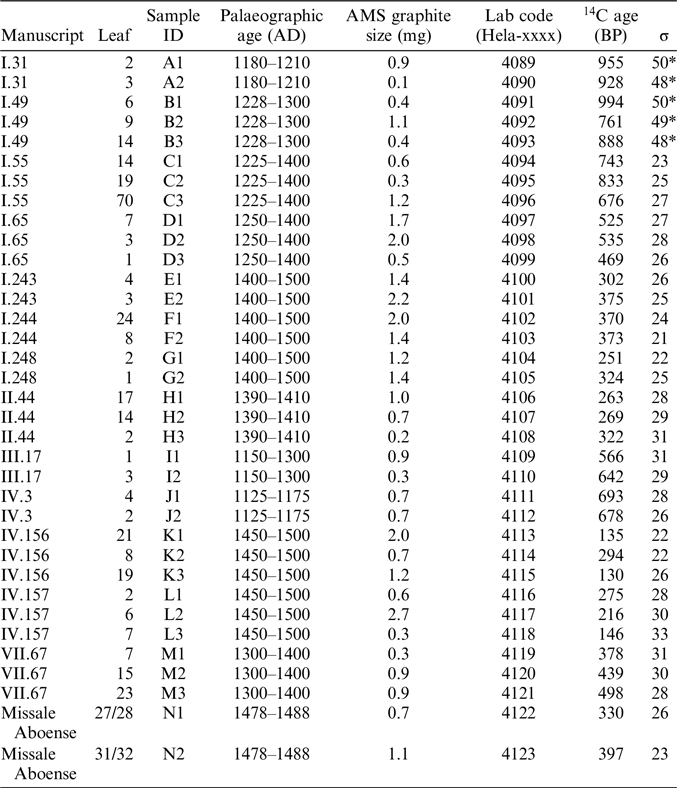
* The low statistical precision was related to slightly nonoptimal AMS characteristics for the measurement made with a different batch than the others.
Radiocarbon Dating
The complete preparation method of the samples for radiocarbon dating is described in detail in Kasso et al. (Reference Kasso, Oinonen, Mizohata, Tahkokallio and Heikkilä2021), but we present here a short description of the sample preparation.
Chemical pretreatment method:
-
1. Acetone wash in 45°C for 1 hr.
-
2. ABA: HCl (0.5M, 60 min); NaOH (0.1M, 30 min); HCl (0.5M, 2 hr).
(Rinsing thoroughly with MilliQ water between and after each step.)
-
3. Dry at room temperature overnight in a clean-room fume hood.
After pretreatment the sample was placed inside a pre-cleaned quartz tube sealed from the other end among 3 g of copper oxide grains. The tube was placed inside a larger pre-cleaned quartz tube which was evacuated to <0.1 mbar pressure and torch-sealed. The ampoule was placed in an oven for combustion in 900°C for at least four hours, generally overnight. The formed CO2 sample was cryogenically purified with liquid-N2 and cold (ca. –85°C) ethanol traps. The CO2 sample was subsequently converted to graphite with Zn and Fe catalysts (Slota et al. Reference Slota, Jull, Linick and Toolin1986) and pressed to an AMS target. Eventually, the 14C content was measured on the AMS graphite target with the Helsinki AMS facility (Tikkanen et al. Reference Tikkanen, Palonen, Jungner and Keinonen2004). Correction for isotopic fractionation to a value of –25‰ was made based on AMS-measured δ13C value. This method is referred to as the closed-tube-combustion (CTC) method and essentially follows method B of ASTM D6866-18 standard (ASTM 2018) dedicated to biofraction measurements of materials. The obtained 14C dates were converted to calendar years by using Oxcal software (Bronk-Ramsey Reference Bronk Ramsey2009) and IntCal20 calibration curve (Reimer et al. Reference Reimer, Austin, Bard, Bayliss, Blackwell, Ramsey, Butzin, Cheng, Edwards and Friedrich2020).
Concerning parchment itself, the eventual 14C content depends on the life span of the animal the parchment is made from as it records atmospheric 14C contents from that time period. Here, the uncertainty associated with that life span has been assumed to be within intrinsic uncertainties of the 14C method resulted from statistical uncertainties of measurements and calibration curve. Therefore, possible own age of parchment has not been taken quantitatively into account and we consider those of the life span of the animal and the manufacturing year to be essentially the same. This working assumption is supported by the historical fact that parchment was made near-exclusively of the skins of young animals, such as calves less than one year old (Fiddyment et al. Reference Fiddyment, Holsinger, Ruzzier, Devine, Binois, Albarella, Fischer, Nichols, Curtis and Cheese2015; Vnouček and Suchý Reference Vnouček and Suchý2012).
For Missale Aboense fragments the dating is already known within a 10-year time span (AD 1478–1488). For the other fragments the estimated manufacturing time span varies between 20 and 175 years (Table 2). However, due to the small own age, the true age is limited to very narrow time period. Therefore, to compare measured and estimated dates, we have simulated radiocarbon ages of estimated narrow true ages (of ∼1 yr) within the time span and compared their calendar year probability distributions (cpd) to the measured age cpd’s. In this way, we emphasize the role of statistical uncertainty of a 14C date and the uncertainty of the calibration curve to result in scattering in the eventual cpd’s of multiple measurements on the same sample. Differences between the cpd’s are evaluated with the Difference() command of OxCal.
RESULTS AND DISCUSSION
FTIR-Measurements
In Kasso et al. (Reference Kasso, Oinonen, Mizohata, Tahkokallio and Heikkilä2021) we successfully demonstrated the capability of the 14C method to provide correct calendar year dates down to 0.3–0.4 mg AMS graphite targets by measuring parchment samples produced in Italy and used for documents dated in AD 1484 and AD 1506. In this work, we took a revisit to the reference sample material of AD 1506 and the pretreatment process by comparing FTIR spectra of untreated and pretreated parchments to a collagen reference material and to a carbon-containing acetone used within the pretreatment protocol (Figure 4). Untreated parchment sample (Figure 4a) shows clear indication of carbonate peaks as remnants of the typical parchment manufacturing process. These carbonate peaks disappear after pretreatment protocol (Figure 4c). This in accord with the previous results by Kasso et al. (Reference Kasso, Oinonen, Mizohata, Tahkokallio and Heikkilä2021)—the pretreatment procedure seems to remove carbonate contamination effectively. Furthermore, pretreated parchment does not show any indications of acetone peaks (Figure 4b) that is the only carbon-containing substance used within the pretreatment. After pretreatment, the FTIR spectrum resembles closely to that of pure collagen reference (Figure 4d). We conclude that FTIR is a useful tool to monitor the sample pretreatment process of parchment since most of the sample material is collagen and that our sample pretreatment process is of efficient quality.
FTIR spectra of a parchment sample from Italy 1506: (a) before and (c) after pretreatment. Spectra of (b) acetone and (d) collagen reference samples are also shown. An unidentified peak at 700 cm–1 is observed in (c), which could originate from a contaminant or a fingerprint signal.

All of the Fragmenta membranea (for detailed results please see Supplementary information) samples show a typical collagen FTIR spectrum with clearly identified and quantified amide I, II, and III peaks (Table S1). In addition, the untreated samples show clear signs of carbonates. Furthermore, several samples show indications of contaminants particularly at wave numbers of 1200–900 cm–1. These are tentatively identified as calcium sulfates potentially originating from inks and gallic acid, in particular (Pronti et al. Reference Pronti, Perino, Cursi, Santarelli, Felici and Bracciale2018). As the gallic acid contains carbon (carbon mass fraction of 0.49), it may act as a potential contaminant, if younger ink is present relative to the manufacturing year of parchment. Overall, the FTIR spectra are consistent with the essential elements of the manufacturing process of parchment: collagen, carbonates and even ink can be found. This emphasizes the usability of the FTIR method in identifying the ingredients related to parchment and manuscript manufacture.
According to PCA, PC1 resembles the FTIR spectrum of collagen (Figure S2) and accounts for 92.5% of the data variance, and that the inclusion of additional principal components do not increase the cumulative percent variance significantly. Clearly seen carbonate peaks are mostly contained by PC3 and this accounts 2.9% of the data variability. Additional contaminants can probably be contained by PC2 and PC4 showing indications of doublet at ca. 1200–900 cm–1 observed in some fragments. These two components account only for 3.9% of the data variance. Thus, it seems that overall contamination issues even with the untreated samples are fairly limited (see Supplementary Information for discussion).
The clustering of the Fragmenta membranea FTIR data revealed three groups (see Figure 5) which were separated mainly by PC1 i.e., the collagen component. Cluster 2 had the highest amide absorbances, indicating higher collagen content, whereas the opposite is true for the samples in cluster 1. Most of the samples were in cluster 1, indicating that they were the least preserved. The level of collagen preservation seems to be moderate for cluster 3. However, all the samples showed clear collagen spectrum, as expected. For example, the sample I.31 A1 with least preserved collagen—and thus belonging to cluster 1—shows well identifiable collagen spectrum (Figure 3).
Score plot of the first two principal components with sample IDs and clustering shown in the figure. Overlapping points are not shown.

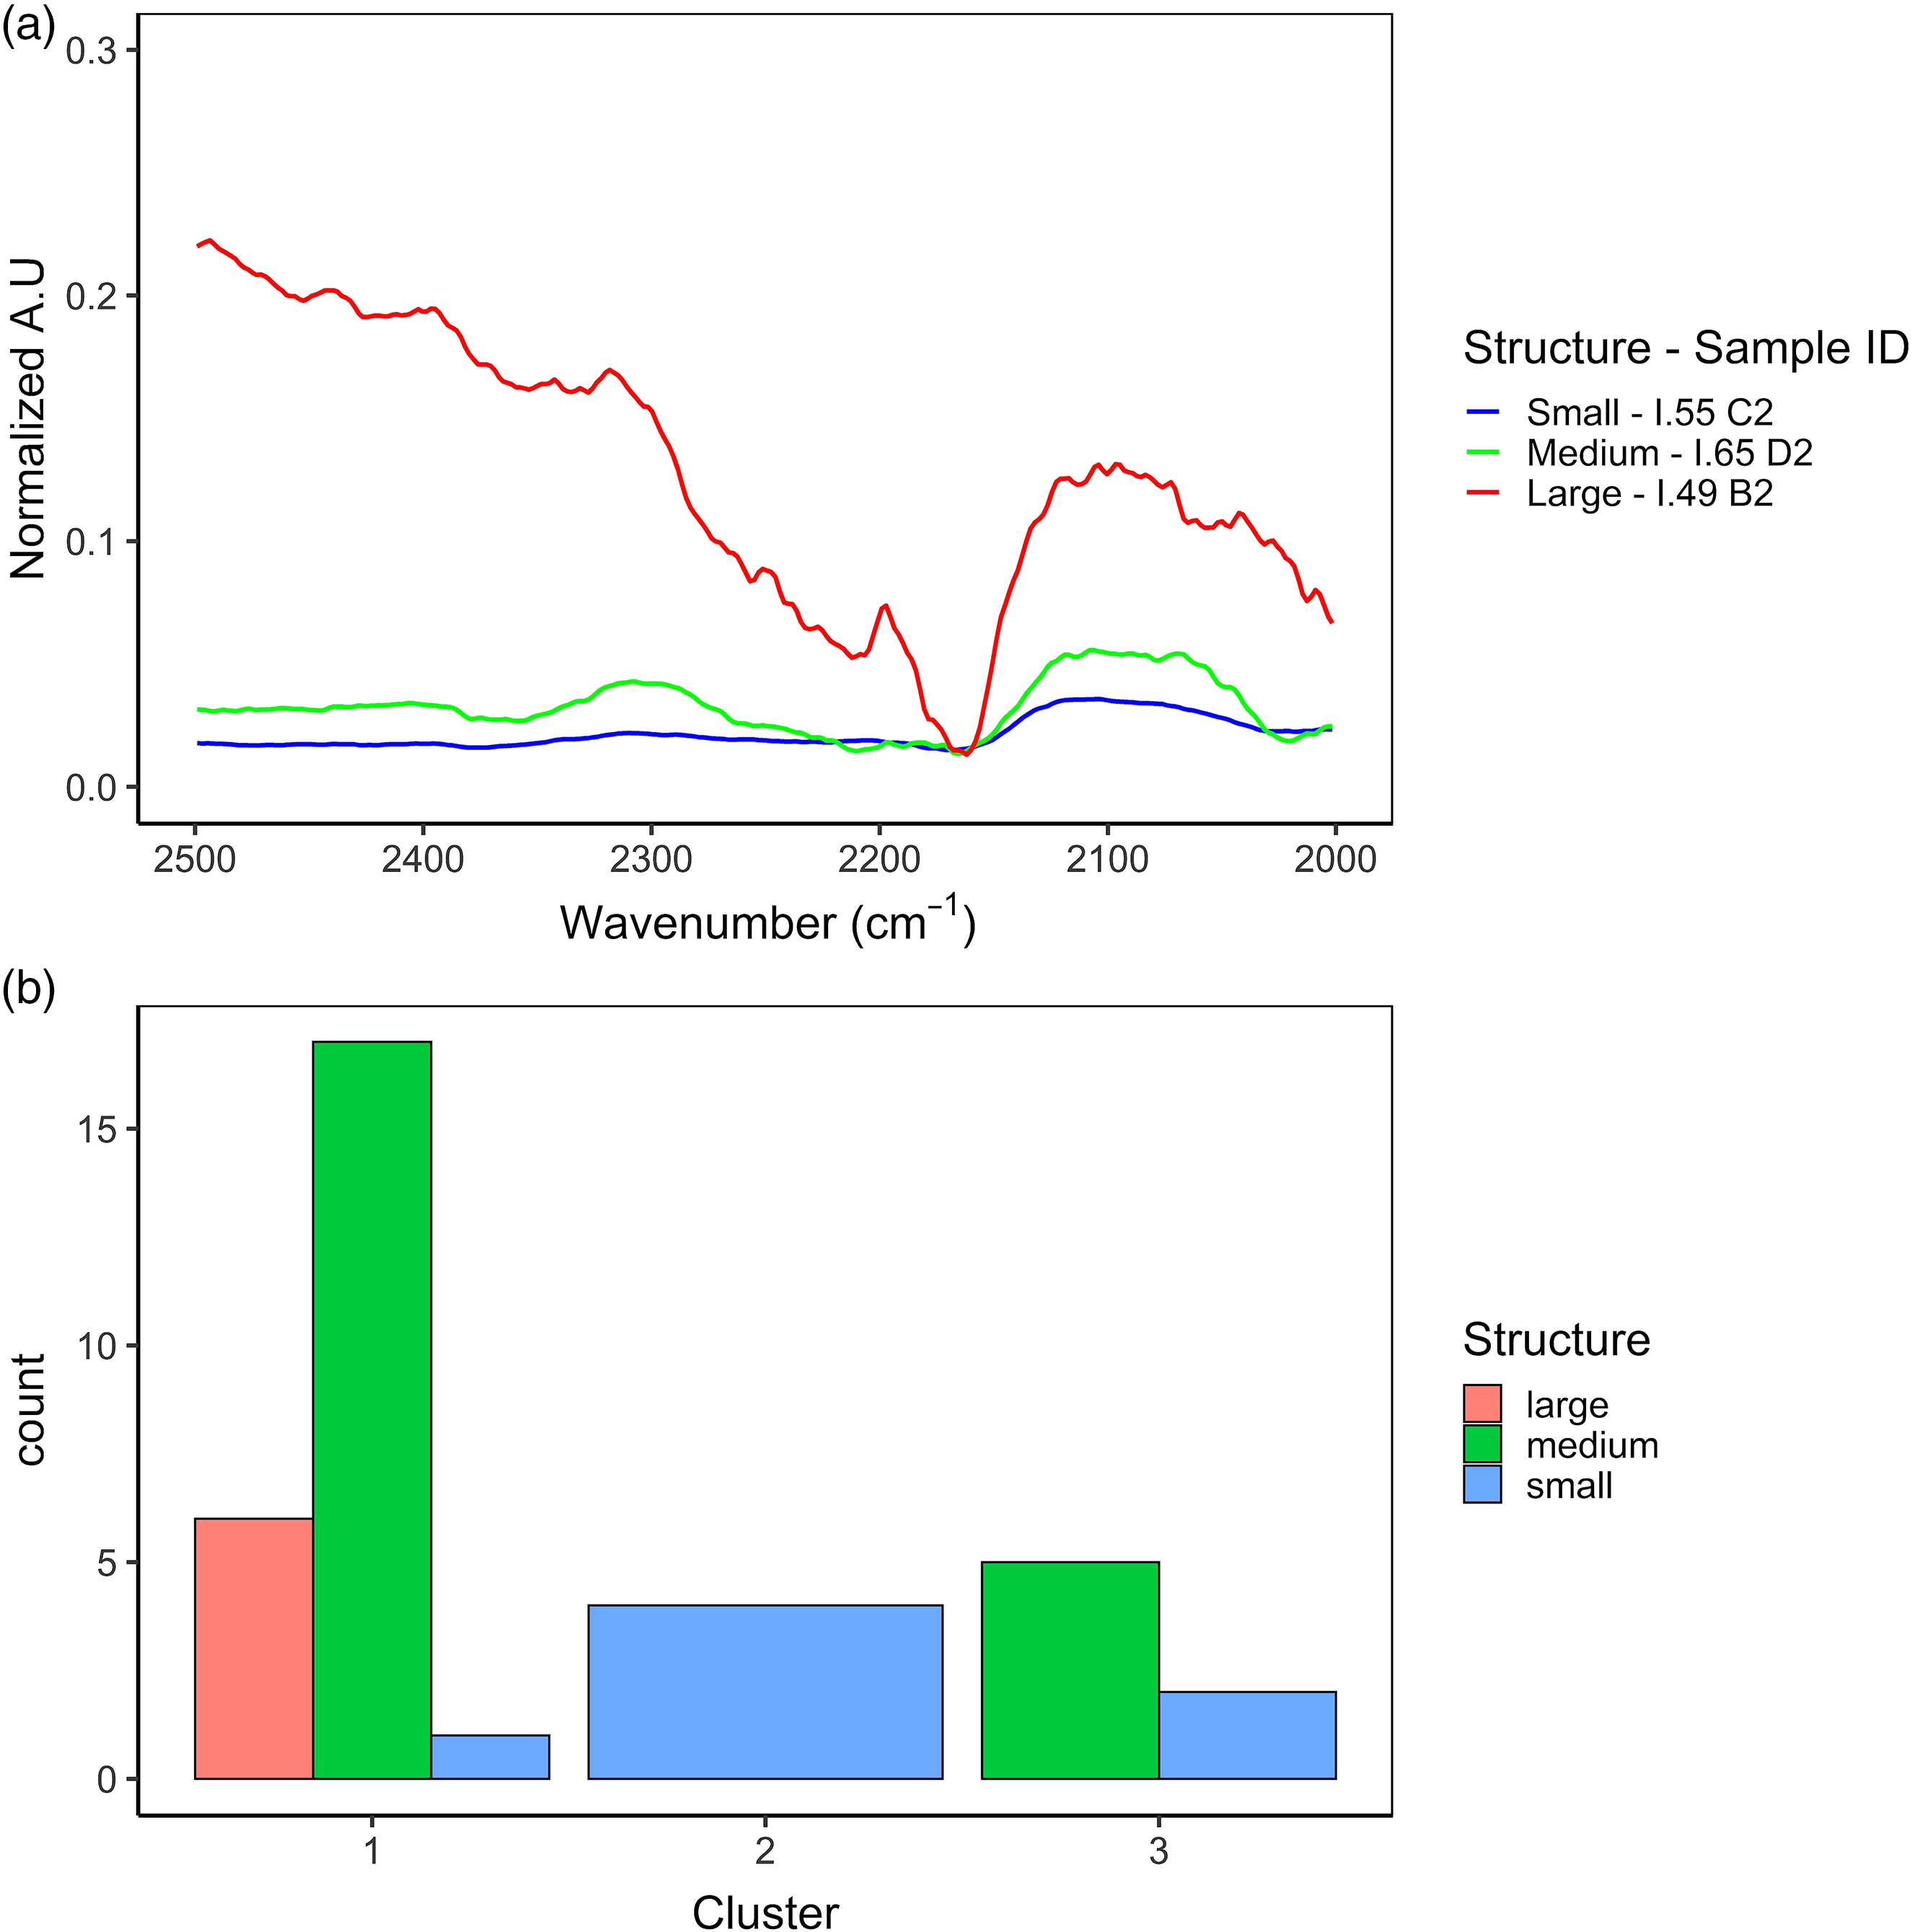
All of the spectra exhibited also peaks in the ca. 2500–2000 cm–1 region which indicate fire damage on the parchment (Bicchieri et al. Reference Bicchieri, Monti, Piantanida, Sodo and Tanasi2008). Figure 6 shows examples and the summary of the observed structures. Most of the samples in all clusters 1 and 3 exhibited medium structures within the 2500–2000 cm–1 region. Six of the samples in cluster 1 exhibited large structures. No other cluster exhibited large structures, possibly indicating that samples in cluster 1 were the most impacted by fire damage. Samples in cluster 2 only had small structures, indicating that they were the least impacted by fire damage. All of this seems consistent with observed collagen content in clusters 1 and 2 where the samples had the smallest and largest collagen content, respectively.
(a) Examples of peak structures in the 2500–2000 cm–1 region for each cluster; (b) histogram of qualitative magnitudes of these peak structures for the clusters.
Radiocarbon Datings of the Fragmenta Membranea
The results of the 14C analyses are provided in Table 2 (see also Supplementary Information for further details). Simulations (10 pcs) of the Missale Aboensis fragments by assuming a reference year AD 1483 and ±30 14C-year statistical uncertainty (σ) provide simulated radiocarbon ages spanning from 330 to 403 BP whereas the measures ages are 330 ± 26 BP (Hela-4122) and 397 ± 23 BP (Hela-4123). These simulations of one year yield to cpds spanning from mid-15th century AD to mid-17th century AD (Figure 7). The broad ranges and outliers illustrate the statistical nature of the radiocarbon dates due to experimental uncertainties and due to variation within the atmospheric 14C content over the years. Nevertheless, the two Missale Aboensis dates and particularly their combined date provides similar calendar year ranges as the simulations. The combined date of 368 ± 18 BP result in cpd with double peaks at 1455–1525 calAD and 1570–1630 calAD (95% confidence interval i.e., C.I.). This agrees nearly perfectly (Figure S6) with the cpd of the combined simulated dates of 1470–1525 calAD and 1575–1625 calAD (95% C.I.). It is likely that the first peak corresponds to the estimated manufacturing year of AD1478–1488 and the second is due to the unfortunate variation of the atmospheric radiocarbon content that allows it to be formed. This agrees with the observation of Kasso et al. (Reference Kasso, Oinonen, Mizohata, Tahkokallio and Heikkilä2021) for Italian parchments of AD 1484 and AD 1506 that our 14C process yields reasonably correct results. In addition, the results point out that simulations and at least duplicate analyses are required to understand the essence of the 14C data.
Results of Missale Aboensis dates and their comparison to 10 simulations of a year AD 1483. Missale sim = combined date of 10 simulations, Missale comb = combined date of Hela-4122 and 4123 (see Supplementary Information for additional discussion). The measured dates are highlighted with green.

Simulations and multiple measurements are essential also in understanding the 14C data measured for parchment samples with broader palaeographically estimated manufacturing time spans. Since true ages of parchment fragments are narrow within the estimated time span, it is suboptimal to compare directly the measured cpd to the estimated time span. Instead, one should be able to test whether one of the years would provide similar cpds, and even scattering, compared to multiple measurements. This can be obtained by simulating radiocarbon dates of selected calendar years within the time span, like performed for I.55 (Figure S8-9). In the case of I.55 samples, the calendar years of AD 1250–1275 (of the widest estimated span of AD 1225–1400) would more or less reproduce the measured and scattered cpds. The multiple 14C measurements from a parchment fragment allow for a possibility to look for these potential manufacturing years among the estimated time span or even beyond it.
In addition to the above-mentioned I.55, there are a couple of fragments for which the measurements marginally match the paleographically estimated time span. Particularly, for I.243 and I.244, whereas the estimated time span is AD 1400–1500 for both, simulations of the younger edge i.e., AD 1500 reproduces the observed cpds and scattering (Figures S16, S17). In addition, for III.17 the observed pattern is also reproduced by the younger edge of AD 1300 (estimated span AD 1150–1300, Figure S23).
However, for most of the cases (ca. 57%), the matching pattern is produced by simulations of either slightly older (I.31, I.49), slightly younger (I.65) or younger (I.248, II.44, IV.3, IV.156, IV.157 and VII.67) calendar age compared to the palaeographically estimated time span. Particularly, IV.156 and IV.157 are worth mentioning: the measured cpds scatter a lot and two of three dates are clearly younger compared to the estimated time span of AD 1450–1500 (Figure S27, S29). However, simulated radiocarbon dates of a calendar year AD 1660 still more or less reproduce the observed patterns (Figures S28, S30).
For such cases a question arises: can the parchment fragment really be so much younger than estimated? Historical evidence from these parchment fragments themselves reveal they cannot: according to markings within the fragments, they have been circulated as account book covers starting from AD 1580s, their content represents Catholic liturgy (not used in their area of origin since the 1530s) and also stylistically they are very typical of late fifteenth century. Therefore, we conclude that—in case of the IV.156 and IV.157 fragments—four out of six 14C ages are younger than expected. The VII.67 fragment belongs to the same category, although the direct evidence of the true age is somewhat more disputable. The observed cpds and their scatter could perhaps be explained by assuming a slightly younger manufacturing year of parchment of ca. AD 1450 instead of the estimated time span of AD 1300–1400, even though this appears rather unlikely on palaeographical grounds.
Originally, it was assumed that FTIR and radiocarbon data would correlate so that high signals of carbonate and organic compounds such as gallic acid or starch would result in older (fossil carbonate) or younger ages relative to the estimated ages, respectively. In addition, FTIR signal differences were assumed to be reflected in collagen quality and thus potentially in 14C ages. We do not see clear indications of these effects (see Supplementary Information) and there are nearly the same fraction of matches and mismatches in each cluster, even in the least-preserved cluster 1. In fact, there are cases in which FTIR data differs drastically indicating collagen quality issues and—in parallel—show high carbonate contamination in one of the untreated samples of the same fragment (IV.3, see Supplementary Information), but the measured 14C data overlap perfectly (Figure S25). Such observations indicate that the chemical pretreatment, as observed in Kasso et al. (Reference Kasso, Oinonen, Mizohata, Tahkokallio and Heikkilä2021) to be effective in removing carbonates, is indeed able to remove contaminants and produce representative quality and amount of collagen. Thus, in these cases the FTIR results of untreated samples and the eventual 14C data are thus decoupled from each other through chemical pretreatment, as they should. This supports our original results of the clean-room based process being effective (Kasso et al. Reference Kasso, Oinonen, Mizohata, Tahkokallio and Heikkilä2021).
However, cases like IV.156 and IV.157 fragments for which majority of 14C datings are indisputably too young require further attention. First, for IV.156, relatively large doublet peak at 1200–900 cm–1 is observed for a sample K2 potentially indicating sulfate from gallic acid-based ink. The corresponding measured cpd of Hela-4114, however, overlaps with the expected cpd if assuming the mid-range (AD 1475) of the estimated time span of AD 1450–1500 (Figure S27). Thus again, FTIR observation do not correspond to significantly younger contamination, whereas the samples K1 (Hela-4113) and K3 (Hela-4115) with smaller doublets result in clearly younger ages beyond the expected age range. So, other explanation should be considered that would involve contaminants that are not directly observed by FTIR. As FTIR requires observation of vibrational frequencies of molecules, we tentatively suggest that potential contaminant explaining such observations may be not molecular but atomic in its nature. A potential candidate for such contamination would be elemental carbon, for example, in a form of airborne ash from fires, oil lamps and candles. As the chemical pretreatment is essentially acid-alkali-acid treatment, it may not be effective enough to remove such contamination that could likely be younger, but naturally depending on the context and timing of fire with respect to the manufacturing year.
Although not capable of identifying elemental carbon, FTIR can provide indirect evidence on fire damage through observation of peak structures of ca. 2500–2000 cm–1 (Bicchieri et al. Reference Bicchieri, Monti, Piantanida, Sodo and Tanasi2008). Indeed, such structures are observed in all the FTIR spectra. Qualitative information on magnitudes of the structures (Figure 6b, Table S1) and their comparison to radiocarbon ages’ cpds reveal that ca. 2/3 of the samples corresponding to largest peak structures have also clearly younger ages compared to the palaeographically estimated manufacturing time spans. In comparison, for the samples of medium- and small-size peak structures, the fraction is less than ca. 1/3. In addition, the largest structures are found among the least-preserved samples of cluster 1 (Figure 6b). These observations indicate an essential role of fire damage, subsequent (slight) collagen degradation and associated contamination of probably elemental carbon. Such potential mechanism would also be related to a question of why parchment fragments were eventually ending up being book covers. Destruction of books by fires would possibly be a common explanation behind the fragment history, their visual appearance and the occasional observations of too young 14C ages.
However, the observed age differences for II.44, IV.3, IV.156 and IV.156 fragments (Figures S21, S25, S27-S30) can be nearly 200 calendar years. Such time difference would correspond to fairly large difference in 14C contents that are difficult to imagine coming only from contamination due to potential fires. As the 14C methodology presented here and in Kasso et al. (Reference Kasso, Oinonen, Mizohata, Tahkokallio and Heikkilä2021) seems to provide reasonably accurate and precise results for the annual and decadal reference parchments of the late 15th century AD, there seems to be no fundamental challenges within the method itself. So, there may also be other contributing factors that our analyses do not necessarily point out, including unknown chemically-bond contamination to partially degraded collagen or challenges in the palaeographic age estimations (Schniedewind Reference Schniedewind2005). Eventually, our study pinpoints the essential role of sampling to secure correct chronological results, since we obtained high-quality results for high-quality samples but face challenges for samples with poorer visual appearance.
CONCLUSION
In this work, we have presented a new insight to the Fragmenta membranea parchment collection of the National Library of Finland by combining Fourier Transform Infrared spectroscopy and radiocarbon dating. According to our studies, FTIR has proved itself as a valuable tool to obtain information on collagen preservation and contamination. Our chemical pretreatment process (Kasso et al. Reference Kasso, Oinonen, Mizohata, Tahkokallio and Heikkilä2021) removes the observed contaminants that originate from the typical parchment manufacturing process. The FTIR data obtained from untreated samples do not correlate with the observations based on the radiocarbon data. Eventually, our radiocarbon analyses yield to sensibly accurate and precise calendar-year probability distributions of the late 15th century AD parchment samples of annual and decadal temporal resolution. However, there are examples of too young 14C ages with respect to palaeographical and written evidence on the parchment fragments themselves that require even more detailed analyses on the source of discrepancies. We tentatively link them at least partly to fire damage, indicated by the visual appearance of the fragments and indirectly by FTIR, and to subsequent carbon contamination not removed by the chemical pretreatment. This emphasizes the role high-quality samples to start with.
Nevertheless, our work on Fragmenta membranea is a first wide-scale radiocarbon dating campaign of medieval manuscripts of parchment, paralleling the palaeographic temporal estimates. Particularly, we emphasize the importance of multitude 14C measurements on one context and backing up the analyses by simulations. Only then it is possible to understand the results of the 14C analyses in the midst of statistical uncertainties and variations of the atmospheric 14C content. For the future, we recommend the diagnosis and evaluation of the parchment material prior proceeding with destructive sampling to select high-quality samples and to design fitted chemical pretreatment procedures. FTIR is valuable in aiding data interpretation and problem-solving in the analysis process. The application of FTIR as a pre-screening method in radiocarbon dating of medieval manuscripts is a relatively easy to method and highly accessible especially with a hand-held FTIR device.
ACKNOWLEDGMENTS
The study is part of the Towards Reliable Dating of Medieval Parchments: Developing Traditional and Scientific Methods -project, funded by the Jenny and Antti Wihuri Foundation, and collaboration between the Laboratory of Chronology of the Finnish Museum of Natural History (LUOMUS) and the National Library of Finland.
Supplementary material
To view supplementary material for this article, please visit https://doi.org/10.1017/RDC.2022.81


 Open access