


1. Introduction
The onset of populating ageing and its implications for public finances has led policymakers across OECD countries to implement measures to curb early retirement among older workers (Banks et al., Reference Banks, Emmerson and Tetlow2018). One of the key policies to achieve this objective is raising the minimum eligibility age at which individuals can claim State Pension (SPe-age). Evaluation of such reforms have allowed researchers to identify whether such policy changes affect socioeconomic behaviour including labour supply and health (Carrino et al., Reference Carrino, Glaser and Avendano2020). A general finding is that individuals respond to such changes, e.g., in terms of work intensity, and that responses can be attributed to the strong social norms attached to reaching SPe-age (Cribb et al., Reference Cribb, Emmerson and Tetlow2016a).
Understanding such phenomena are important for determining whether policy objectives are likely to be met, particularly given that most reforms affect current prime age workers who are below SPe-age. Studies to date typically tend to be ex-post in nature and much fewer studies have sought to determine the effect of changes in eligibility ages on intended behaviour. Notable exceptions include Bottazzi et al. (Reference Bottazzi, Jappelli and Padula2006), Coppola and Wilke (Reference Coppola and Wilke2014) and De Grip et al. (Reference De Grip, Fouarge and Montizaan2013) who show that changes in SPe-age can affect the expected age of retirement (EAR) in Italy, Germany, and the Netherlands, respectively. Whereas the latter two studies evaluate a single reform, we build on this literature by studying the UK case which involved policymakers legislating and passing into law three separate State Pension Acts (SPAs) determining SPe-age in the space of seven years, which in the modern history of pensions in the UK is unprecedented.
In each of the three SPAs, different birth cohorts were affected to a varying degree, and it is therefore crucial to understand the extent to which individuals adjust their intended retirement age given variation in treatment intensity. While existing studies utilise variation in reform effects to identify behavioural changes, unlike countries such as Italy, the Netherlands, and Germany where occupational and state pensions are typically claimed at the same age, in the UK Defined Contribution (DC) pensions, which are the most common pension type, can be claimed at age 55 until April 2028 and at age 57 thereafter, whereas SPe-age is at least 65 for men and 60 for women born after 1950. Moreover, in the UK occupational pension income is the main source of retirement income, therefore understanding whether successive increases to SPe-age leads to consistent upward revisions in EAR across successively younger cohorts is a policy relevant empirical question.
Another motivation for studying the UK policy context is that compared to similarly advanced OECD economies, state pension is one of the lowest in terms of its generosity (OECD, 2021), and as highlighted compared to state pension, both occupational and private pension income are typically accessible much earlier in life. Therefore, from a comparative perspective understating individual’s behavioural response to a series of reforms which successively reduce state pension wealth serves as a useful case study for policymakers in countries considering further upward revisions to eligibility ages, regarding the lower limits to which this policy lever can be effective.
Our principal aims are to understand the extent which the 2007, 2011, and 2014 SPAs affected actual and intended retirement behaviour. To answer these questions, we use data from the United Kingdom Household Longitudinal Study, a large-scale representative household panel survey. Collectively, these Acts increased the pace of equalisation of SPe-age between men and women (the latter was historically five years lower) and raised the SPe-age of men and women up to 66 or 67, depending on their date of birth. The magnitude of these reforms is non-trivial, women and men born in certain cohorts saw their SPe-age increase by up to, respectively, 1.5 years and 1 year from one reform to the next. We also examine the role of household’s financial situation, proxied by individual pension membership, household income and housing tenure, in shaping current and future retirement decisions in response to the SPe-age reforms.
Our findings suggest that a one-year increase in SPe-age reduces the probability of retirement by 8.2 percentage points (pp) for men and 6.4 pp for women. Furthermore, the reductions are larger for individuals who are not an active member of their employer’s pension scheme and who do not own their home outright. Separately, our findings suggest that men do not adjust their EAR in response to SPe-age reforms and that women adjust downwards. These effects are driven by the younger cohorts born in the 1960s who are relatively far away from retirement. The findings suggest that the younger cohorts are more likely to report expecting to supplement their retirement income with paid employment; and such attitudes are correlated with individual characteristics including pension membership and housing tenure. In contrast, older cohorts born in the mid-1950s adjust their EAR as they approach SPe-age.
The rest of the is paper is set out as follows. Section 2 briefly discusses the academic and policy literature. Section 3 summarises the main features of the UK pension system. Section 4 describes the United Kingdom Household Panel Survey. Section 5 describes the methodology used and Section 6 presents estimation results. Section 7 discusses the implications of our findings and Section 8 concludes.
2. Literature review
Reforms to SPe-age have allowed researchers to identify the effect of age-eligibility criteria on retirement behaviour. Early studies found that a large proportion of individuals exit the labour market at the minimum (full) state pension eligibility age, underlining the importance of social norms (see Kohli et al., Reference Kohli, Rein, Guillemard and van Gunsteren1991; Börsch-Supan et al., Reference Börsch-Supan, Schnabel, Kohnz and Mastrobuoni2004; Wise, Reference Wise2004; Atalay and Barrett, Reference Atalay and Barrett2015; Gruber et al., Reference Gruber, Kanninen and Ravaska2022). More recently, studies have analysed the effect of age-related reforms on a variety of outcomes including physical and mental health, applications for retirement benefits, and insurance take up (Card et al., Reference Card, Dobkin and Maestas2008; Carrino et al., Reference Carrino, Glaser and Avendano2020; Giusta and Longhi, Reference Della Giusta and Longhi2021; Kanabar et al., Reference Kanabar, Nivalainen and Järnefelt2024).
The availability of cross-country harmonised data such as the Survey for Health Ageing and Retirement in Europe (SHARE) has allowed researchers to exploit variation both across and within countries to estimate treatment effects (see inter-alia Kolodziej and García-Gómez, Reference Kolodziej and García-Gómez2019; Ciani et al., Reference Ciani, Delavande, Etheridge and Francesconi2023). Despite varying institutional arrangements defining individual social security and marginal tax rates across countries, a general finding in the literature is that reforms to SPe-age impact the retirement decision even when financial incentives are relatively low, as is the case in the UK (Cribb et al., Reference Cribb, Emmerson and Tetlow2016a; Coile et al., Reference Coile, Cribb, Emmerson and O’Brien2025). Using UK microdata Cribb et al. (Reference Cribb, Emmerson and O’Brien2022) find that a reform to increase SPe-age from 65 to 66 led to a 7.4 pp and 8.5 pp increase in employment rates of men and women in affected cohorts, respectively. Importantly, full-time workers, the self-employed, lower educated, and those living in relatively more deprived areas responded more strongly to the reform. Recent evidence focussing solely on women’s labour supply behaviour suggest that credit constraints are a key mechanism in explaining response behaviour to UK SPe-age reforms (Coile et al., Reference Coile, Cribb, Emmerson and O’Brien2025).
The effects of changes in SPe-age on individual earnings and income depend on individual’s ability or desire to work. Various factors including individual’s lifetime occupation and caring responsibilities have been shown to be important in determining labour supply at older ages (Wise, Reference Wise2004; Carrino et al., Reference Carrino, Glaser and Avendano2020). Such findings have implications for policy, for example if changes to SPe-age lead to higher poverty rates. Kuitto et al. (Reference Kuitto, Madia and Podesta2023) analyses the effect of state pension reform on pension adequacy and old age poverty in 14 advanced economies and finds that while most public pension systems perform reasonably well in reducing the risk of poverty, particular groups such as those working in platform/gig-economy jobs and separately those with fragmented careers, often women, are at higher risk of old age poverty. In UK, a recent set of studies suggests that reforms to women’s and men’s SPe-age lead to short-run increases in absolute poverty levels of 6.4 pp and 14 pp, respectively; however, these disappeared once individuals became eligible for state pension (Cribb and Emmerson, Reference Cribb and Emmerson2019; Cribb and O’Brien, Reference Cribb and O’Brien2022).
Alongside evaluating the effect of SPe-age reforms on actual retirement behaviour, a key aim of our study is understanding whether reforms influence future labour supply intentions as measured by individual’s EAR. The evidence to date suggests that even with a long lead-in time between reform announcement and implementation date, as was the case for women in the UK, among affected cohorts, we nevertheless observe a decline in living standards, as measured by absolute poverty levels even if only for a relatively short period of time. In the case of men, while the period of adjustment was much shorter given the date at which the policy was announced, they too did not adjust their labour supply, saving or consumption decisions such that short-term poverty levels among affected cohorts also increased (Cribb and Emmerson, Reference Cribb and Emmerson2019).
While existing research analyses observed behaviour, the bulk of the impact of SPe-age reforms will take place in the future, pushing up eligibility ages further than those currently studied. Moreover, the nature of the reforms implies that a greater proportion of future cohorts will be affected, and importantly in the case of the UK, the period between the announcement and implementation date is shorter than was the case for the 1995 SPA, which predominantly affected women. For these reasons, our study makes an important contribution to a relatively scant literature on the effect of reforms on future labour supply intentions with respect to one of the main outcomes targeted, namely the retirement age.
Expectation’s data has been shown to play an important role in explaining major decisions including the decision to retire (see inter-alia Bernheim, Reference Bernheim and Wise1989; Manski, Reference Manski2004). Disney and Tanner (Reference Disney and Tanner1999) using the UK Retirement History Survey compare expected versus actual retirement ages and find that most individuals reported their EAR to be the SPe-age at the time. Moreover, these individuals subsequently retired at that age highlighting (i) the accuracy of expectations data in predicting subsequent retirement and (ii) the strong cultural norms associated with reaching SPe-age.
Crawford et al. (Reference Crawford, Cribb, Emmerson and Simpson2020) and Cribb (Reference Cribb2023) use the GB Wealth and Assets Survey covering the sample period 2006–18 to examine changes in EAR among cohorts affected by SPe-age reforms. Their analysis, while descriptive in nature, shows a general shift to later retirement ages, particularly with respect to the SPe-age set out in the 2011 and 2014 reforms. Crawford et al. (Reference Crawford, Cribb, Emmerson and Simpson2020) find that certain types of individuals such as the self-employed and those with tertiary-level education were more likely to report a higher EAR. The authors base the majority of their analysis regarding EAR on pooled data and do not control for SPe-age; moreover, their regression estimates imply that time effects are driving their results (Crawford et al., Reference Crawford, Cribb, Emmerson and Simpson2020, pp. 42). We also note that the authors report the likelihood of observing upward versus downward revisions to EAR is roughly equal from 2014 onwards among sample respondents. Building on their work, we explicitly control for SPe-age and individual-level, time-invariant unobserved heterogeneity using a fixed-effects estimator. The latter may be important in the context of modelling changes in retirement behaviour, for example, reflecting work identity or gender roles, which may differ across cohorts (Giusta and Longhi, Reference Della Giusta and Longhi2021).
Given the importance of retirement expectations in determining future labour supply on the one hand, and the strong connection between reaching SPe-age and ceasing or reducing paid work on the other there exists limited international evidence analysing how changes in SPe-age affect EAR. One exception is Bottazzi et al. (Reference Bottazzi, Jappelli and Padula2006) who evaluate a set of Italian reforms to raise SPe-age by five years and led to women’s (men’s) EAR to increase by three (two) years, noting higher educated individuals responded relatively more strongly.Footnote 1 Similarly, De Grip et al. (Reference De Grip, Fouarge and Montizaan2013) find that individuals affected by the increase in SPe-age from 65 to 66 (66 to 67) in the Netherlands adjusted their EAR by 3.6 (10.8) months compared to individuals with an eligibility age of 65, and this change was driven by highly educated females who also reported higher levels of pension wealth. However, the extent of adjustment to EAR was related to individual’s work capacity and insurance contribution history, suggestive of an income effect. Coppola and Wilke (Reference Coppola and Wilke2014) analyse a reform similar to the one evaluated by De Grip et al. (Reference De Grip, Fouarge and Montizaan2013), except in the context of Germany and find that lower educated individuals did not adjust their EAR in response to an increase in the SPe-age.
A recent set of studies investigate the information channels which inform individual retirement expectations. Ciani et al. (Reference Ciani, Delavande, Etheridge and Francesconi2023) using survey data spanning 10 European countries finds official announcements as opposed to implementation, and separately, online search is important for influencing individual beliefs. Alongside how individuals search for information the authors find proximity to the event of interest is important. Specifically, once an announcement has been implemented individuals’ do not expect future reforms to SPe-age. Using the same dataset, Bucher-Koenen et al. (Reference Bucher-Koenen, Ferrari and Pettinicchi2019) also study pension reform announcement dates and find that it is higher-educated individuals who are more responsive in terms of their future expected labour supply.
Notably, the majority of these studies are based on European countries for whom eligibility ages for state and occupational pension are tied, and the generosity of state pensions is relatively high versus the UK implying the financial incentives arising from any changes to SPe-age is also greater. A unique feature of the UK pension system is that state pension eligibility age is approximately a decade later than DC pension eligibility age. Understanding whether reforms to the former can influence future retirement expectations in such a system, whether this varies by subgroup and controlling for limitations in existing UK-focussed research is critical for improving policymakers understanding of whether reform objectives are likely to be realised.
3. Pension policy in the UK
The UK pension system consists of three pillars. The first pillar, State Pension, was introduced in 1948 and reformed in April 2016 to a single tier flat rate scheme based on a pay-as-you-go funding structure. Individuals who reached SPe-age prior to this date remain under the ‘old’ system which has two tiers: a flat rate basic pension and an additional pension related to earnings.Footnote 2 Our sample contains individuals affected by both systems. While state pension eligibility ages were set at 60 (65) for women (men) in 1948, following various reform by 2014 these have risen across successive cohorts to reach 67 for individuals born in the early 1960s and later. On the other hand, the eligibility age for receipt of DC pensions was increased in 2010 from 50 to 55 and is set to rise further to 57 in 2028. In the case of individuals belonging to Defined Benefit pension schemes, eligibility ages vary significantly across schemes and are generally more closely aligned to SPe-age.
State pension
The level of state pension an individual receives depends on the number of ‘qualifying years’ of National Insurance Contributions and an individual’s date of birth.Footnote 3 In terms of its generosity in the 2018/19 tax year which coincides with the end of our sample period, the maximum state pension benefit a single individual can receive under the single tier system is £164.35 per week, replacing around 28.4% of average pre-retirement earnings (OECD, 2021).Footnote 4 This figure is low by European standards; however, expenditure on state pensions is non-trivial totalling £93.8 billion or just under 5% of GDP in the tax year 2017/18 (OBR, 2018). Evidence suggests around 1.1 out of a total of 11.81 million single pensioners aged 65 and over rely on their State Pension as their sole source of income (Independent, 2017). Additionally, due to uprating rules state pension now constitutes an increasing proportion of total retirement income among low- and middle-income households (Cribb, Reference Cribb2023).
Occupational and private pensions
Occupational pensions are a voluntary form of retirement saving in the form of DC or Defined Benefit (DB) type schemes; individuals are taxed on receipt of income and not at time of contribution. Occupational (and private) pensions play an important role in providing income in retirement given that the level of state pension is relatively low in the UK (OECD, 2021). For example, average net replacement rates increase from 28 percent (state pension alone) to 62.2 percent after accounting for the presence of an occupational pension; and over 60% of pensioners expect to receive income from such a source (DWP, 2015; OECD, 2017).
Private pensions are an alternative form of voluntary retirement saving. These schemes usually take the form of a DC pension and are treated in the same way as occupational pensions from a tax perspective.Footnote 5 Individuals must be aged at least 55 before they are eligible to claim.
The widespread availability and uptake of occupational pensions since the 1950s and the fact that the UK labour market has historically been made up of employees implies the proportion of individuals who have a personal pension is higher among the self-employed; a group we exclude from our analysis.Footnote 6 Separately, it is therefore crucial to control for the presence of an occupational pension given our sample composition.
3.1. State pension age reform
Between 1948 and 5 April 2010, the eligibility age for state pension for women and men remained fixed at 60 and 65, respectively. A series of SPAs were legislated in 1995, 2007, 2011, and 2014 each of which made significant changes to first pillar pension provision. One of the primary changes made in the 1995 SPA was to equalise the SPe-age across genders by March 2020. Importantly, except for the 1995 Act, treatment intensity varied according to individual’s date of birth. The 2007 Pension Act raised the SPe-age for both men and women to 66 between 2024 and 2026, to 67 between 2034 and 2036, and to 68 between 2044 and 2046.
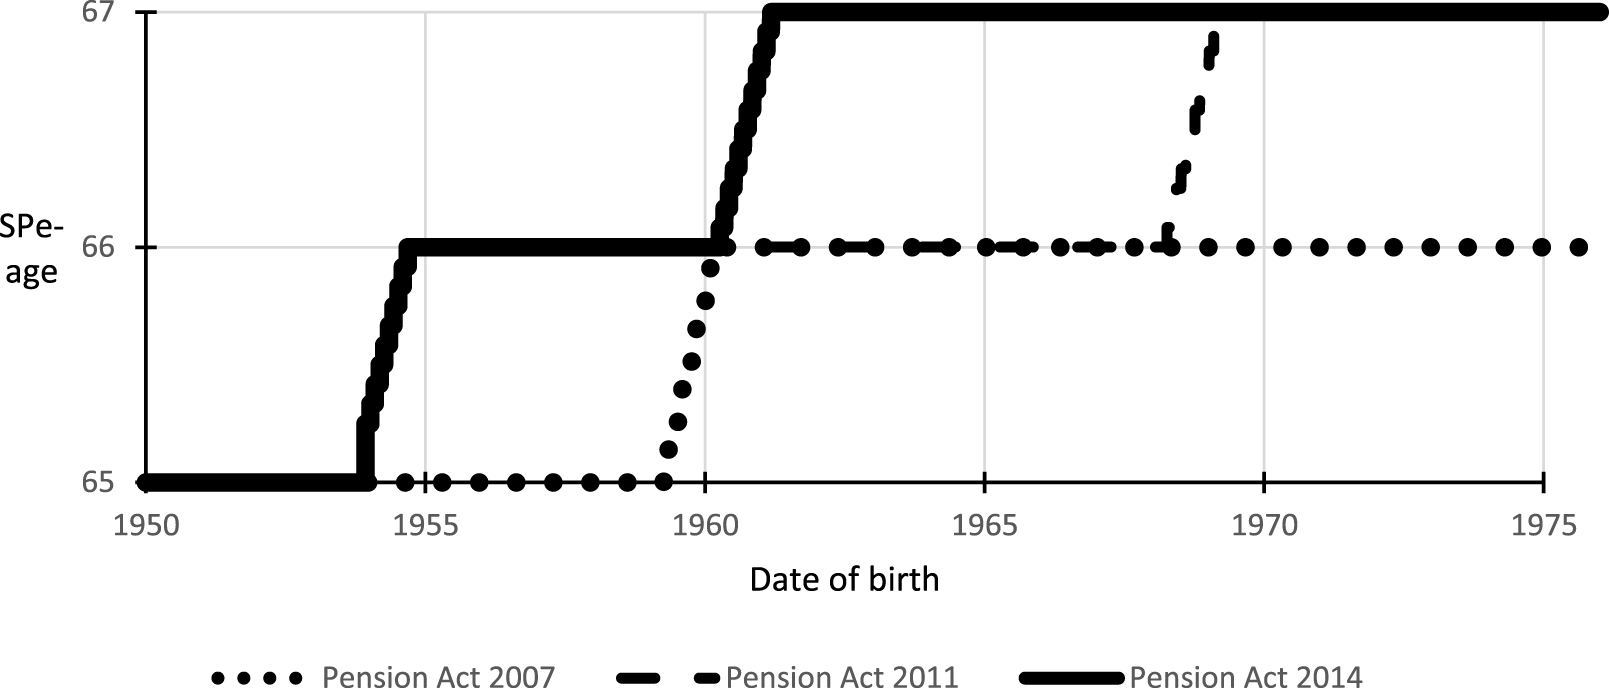
Given our sample data span the period 2010–20 our analysis relates to the changes in eligibility age implied in the 2011 and 2014 Act (to aid interpretation we include eligibility ages under the 2007 Act) which are summarised in Figures 1 and 2 by gender.
UK State Pension Acts and men’s SPe-age. Notes: SPe-age is the official state pension eligibility age in the UK under the 2007, 2011, and 2014 State Pension Acts conditional on individual’s date of birth. For each new pension act, the SPe-age by date of birth is either increased or hold constant. In the latter case curves can coincide.

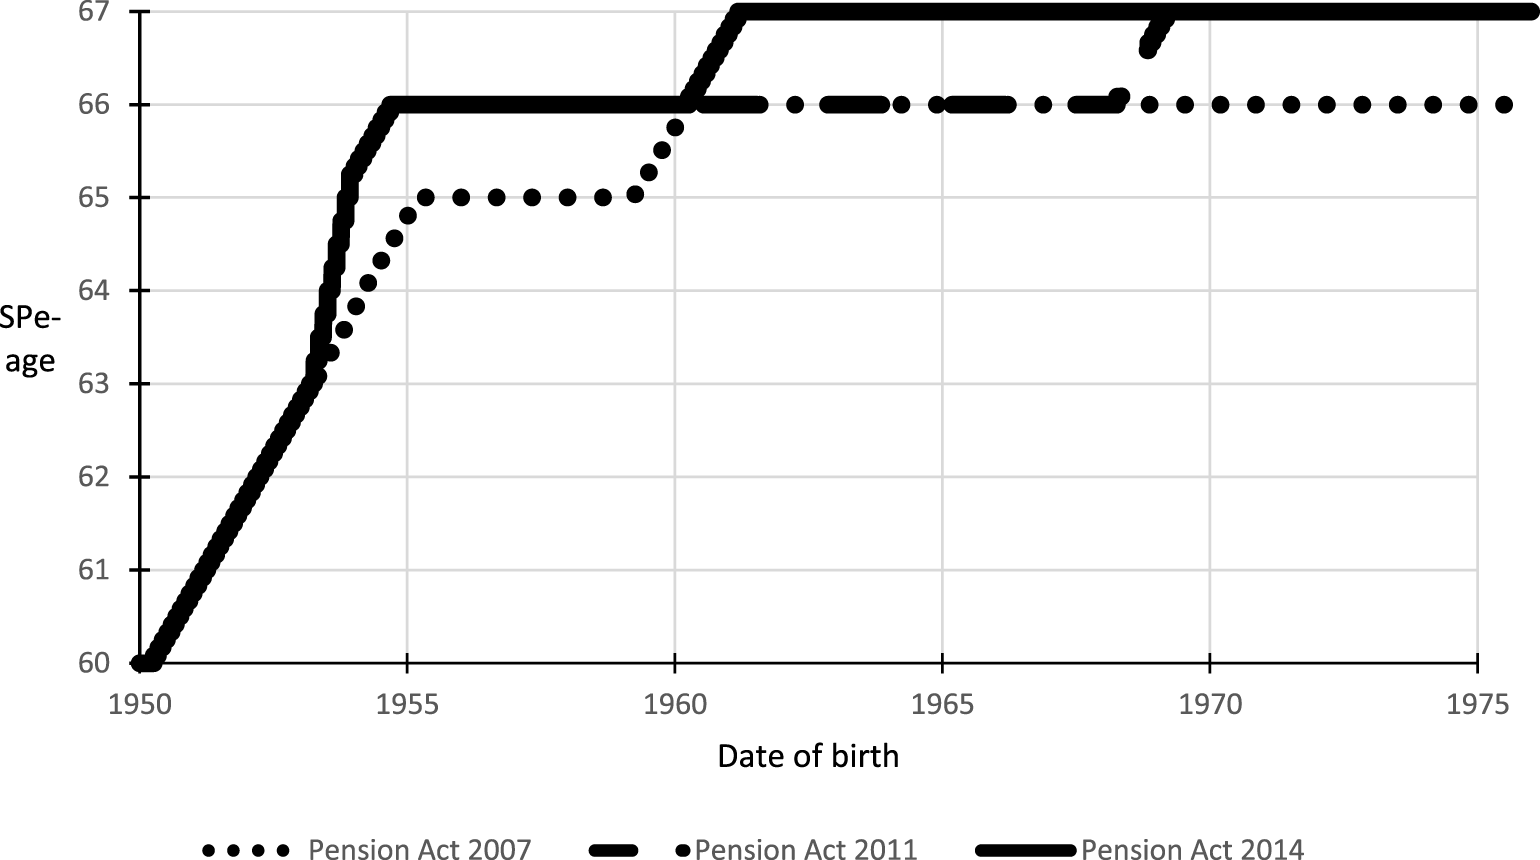
UK State Pension acts and women’s SPe-age. Notes: SPe-age is the official state pension eligibility age in the UK under the 2007, 2011, and 2014 State Pension Acts conditional on individual’s date of birth. For each new pension act, the SPe-age by date of birth is either increased or hold constant. In the latter case curves can coincide.

Figures 1 and 2 show the increase in SPe-age under each reform is not uniform by or within gender and varies by an individual’s exact date of birth and the date of survey interview. Online Appendix A contains permanent links to the original SPAs.
The 2011 Pension Act, which became law on the 3rd of November 2011, bought forward the equalisation of female SPe-age to November 2018 17 months earlier than initially planned. The increase in the SPe-age from 65 to 66 for men and women was also brought forward from 2024–26 to between March 2019 and October 2020. The 2011 reform was non-trivial in its scope: estimates suggest 5 million individuals were affected (Thurley, Reference Thurley2017). In terms of the salience of the Acts, the nature of the reforms meant they received significant media attention (Parliament, 2016). Google trends analysis (see online Appendix B) highlights that individuals increased online search activity relating to key terms associated with state pension age around the time the changes were first announced, and during key stages of the legislative process in the UK (readings in the House of Commons and House of Lords).
The 2014 Pension Act became law on the 14 May 2014 and brought forward the increase in SPe-age to 66, and separately the increase from 66 to 67 by 8 years to between 2026 and 2028 compared to 2034–2036 as originally legislated in the 2007 Pension Act.Footnote 7 Under the 2007 State Pensions Act, which predates our sample period, the SPe-age was legislated to increase from 67 to 68 between 2044 and 2046 and this was left unchanged; however, the 2014 SPA legislated to review SPe-age at least once every 5 years.
3.2. Pension-related reforms
3.2.1. Abolishment of mandatory retirement age
Until October 2011 individuals who desired to work past the age of 65 were required permission from their employer, leading to excess retirements at this age (Lain Reference Lain2017). In 2011, the Employment Equality Regulations (EER) reduced employer powers with respect to retirement decisions in the effort to address age-related discrimination. This reform did not lead to an increase in employment rates among affected cohorts, though data show there has been a general increase in labour force participation among the age group 65 and over since the early 2000s (ONS, 2018c).
Our identification approach relies on comparing changes in retirement behaviour among older individuals in our sample who experience smaller changes in their SPe-age compared to younger counterparts whose change is larger. Given its nature and the sample selection criteria used for analysis purposes, the 2011 EER reform affects all birth cohorts in the same way, and hence we do not expect it to influence the impact SPe-age has on retirement behaviour and EAR in a differential and systematic way across age groups. Coile et al. (Reference Coile, Cribb, Emmerson and O’Brien2025) find no evidence to suggest that UK employers dismiss workers at SPe-age and find that instead retirement behaviour is driven by individual’s own characteristics. The principal reasons include strong cultural norms of reaching eligibility age, the presence of social security and in particular the role played by occupational pensions in the UK system and, the lack of financial incentives from reaching SPe-age, e.g., the absence of an earnings test (Kohli et al., Reference Kohli, Rein, Guillemard and van Gunsteren1991; Disney and Tanner, Reference Disney and Tanner1999; Blundell et al., Reference Blundell, Bozio and Laroque2013). We note that if the reform to EER affected actual or expected retirement ages this would be relatively more visible in our estimates based on our male sample given the historic differences in SPe-age by gender. This contrasts with evidence from the United States, which found a positive effect on participation rates following the introduction of a similar policy (von Wachter, Reference von Wachter2009).
3.2.2. Auto Enrolment
To increase occupational pension coverage and retirement saving among low earners, the UK government in April 2012 introduced Auto Enrolment (AE), a policy whereby employees are automatically enrolled into a workplace pension. Evidence shows that such nudge behaviour has been effective in terms of changing individuals’ savings behaviour and minimising opt out; analysis covering the early phase of rollout suggests AE has been successful in meeting its original objectives, but issues remain such as increasing contribution rates to meaningful levels (Cribb and Emmerson, Reference Cribb and Emmerson2016; Cribb et al., Reference Cribb, Hood and Joyce2016b; DWP, 2017; ONS, 2018b).Footnote 8
A priori it is unclear whether AE which was rolled out on 1 October 2012 and fully implemented by February 2018 interacted with the SPe-age reforms in terms of affecting retirement behaviour or EAR by age. The nature of AE rollout which depended on firm size, timing of the SPe-age reforms, and outcomes of interest means that given our data, it is not possible to separately identify AE effects. For example, by the end of the rollout period younger sample members are more likely to be affected by AE due to lifecycle and cohort effects, and higher levels of pension wealth even from a relatively low level, ceteris paribus, may lead to individuals lowering their EAR. Nevertheless, the levels of implied pension wealth at retirement given the groups targeted by the reform is low, especially for those in our sample who are already midway through their career.
3.2.3. Pension freedoms
The UK government also made significant changes to the way in which contributions to DC pensions can be accessed. Until March 2015 individuals could draw down up to 25 percent of their pension pot (tax free) as a lump sum and annuitize the remainder of their savings. Following the introduction of the Pensions Schemes Act (PSA) 2015 at age 55 individuals with DC pensions are free to use their retirement savings as desired. In terms of the potential impact on the groups we compare, older individuals can access their pension wealth (if held in DC form) earlier compared to younger counterparts and this could influence their actual and/or expected retirement behaviour; nevertheless, the reform itself affected all individuals in the same way. One possibility is that given it came into effect soon after the 2014 SPA, which introduced further increases to SPe-age, the 2015 PSA could have mitigated upward revisions to EAR. For example, if individuals were likely to be liquidity constrained, the policy reform meant this would no longer be the case and ceteris paribus induce individuals to retire earlier or at the same age as initially planned.
Thurley (Reference Thurley2017) summarises the impact of the 2015 PSA on individuals and shows that the introduction of the reform led to significantly more individuals drawing down their pension pot before age 65. Most of these early withdrawers had relatively small pension pots (<£30,000) and the number of annuities being taken out fell sharply as drawdown became the norm. Evidence suggests that given the cohort to which these individuals belonged most did not consider their DC pension as their main source of retirement income (the majority reported DB and State Pension), and that individuals accessed their pension pots while still in employment (FCA, 2018).
3.3. Other state benefits
Individuals may be eligible to receive state benefits depending on their individual and household circumstances. This includes support for living costs, care/disability costs, and housing. If the generosity of such sources of income were increased this could offset behavioural changes to observed and planned future labour supply, consumption, or savings in response to SPe-age reforms. For this to be true individuals would have to perceive such a change to benefit income as permanent and similarly for reforms to SPe-age. During the sample period no such benefits were adjusted upwards above inflation to offset the reduction in state pension wealth due to SPe-age reforms.
4. Data
The analysis uses the secure version of the United Kingdom Household Panel Study (UKHLS) covering the period 2010–20 (University of Essex, Institute for Social and Economic Research, 2023). UKHLS collects annual data (fieldwork takes place over 24 months) on a range of individual and household economic and sociodemographic characteristics. Our analysis is based on two samples, one to estimate the effect of SPe-age on retirement and the other to estimate the effect of SPe-age on individual’s EAR. We next describe the sample conditions imposed to derive the datasets used for analysis.
4.1. Retirement sample
We select individuals born between 1950 and 1975, aged between 50 and strictly below state pension eligibility age at the time of their wave 2 interview (2010–11), and who report being in employment. Self-employed individuals are excluded. The sample conditions applied imply that individuals are aged 50–61 at the first wave of observation. We follow individuals until they either reach SPe-age, retire from the labour market, attrit or reach the end of the sample period. The final wave of data used for analysis purposes is wave 10 and corresponds to January 2018 to May 2020.Footnote 9 Individuals must be observed in at least two consecutive waves to be included in the sample. Thus, the analysis sample is an unbalanced panel with individuals being followed in consecutive survey waves, re-entry into the sample is not permitted.
In online Appendix C, we detail the number of men and women who belong to single year birth cohorts in our data. We note that the majority of respondents were born between 1950 and 1960. In light of the reforms depicted in Figures 1 and 2, and given the birth cohorts in the sample, respondents are affected by both the 2011 and 2014 SPA. For the majority (minority) of sample respondents, individuals SPe-age will be dictated by the 2007 (2011) SPA which was law at the time of their first interview. Identification of SPe-age reform on retirement behaviour is achieved by exploiting variation both across and within individuals; the nature of the reforms implies we are comparing differences in outcome behaviour between groups who are relatively more affected by the cumulative impact of the reforms, namely relatively younger individuals versus older counterparts. Specifically, depending on when an individual is interviewed which could be at any point between 2010 and 2020, will determine their SPe-age. In the case of men, the minimum (maximum) change in eligibility age within an individual in our data is 0 (1) years. Across individuals, the lowest (highest) eligibility age is 65 (67). For women the equivalent statistics are 0 (1.5) years and age 60 (67).
Research shows that a variety of indicators have been used in empirical studies to define whether an individual is retired (Denton and Spencer, Reference Denton and Spencer2009; Cribb, Reference Cribb2023). Consistent with existing studies our definition is based on an individual’s economic status being reported as retired and when asked, an individual perceives themself as being retired (Coile and Gruber, Reference Coile and Gruber2001; Nishimura et al., Reference Nishimura, Oikawa and Motegi2018). Alternatively, retirement may be defined as being non-employed (Cribb et al., Reference Cribb, Emmerson and Tetlow2016a); a definition we use as a robustness check (online Appendix D).
Figures 3 and 4 plot retirement rates among individuals aged 60–66 based on our sample data across the period 2011–20, by gender.
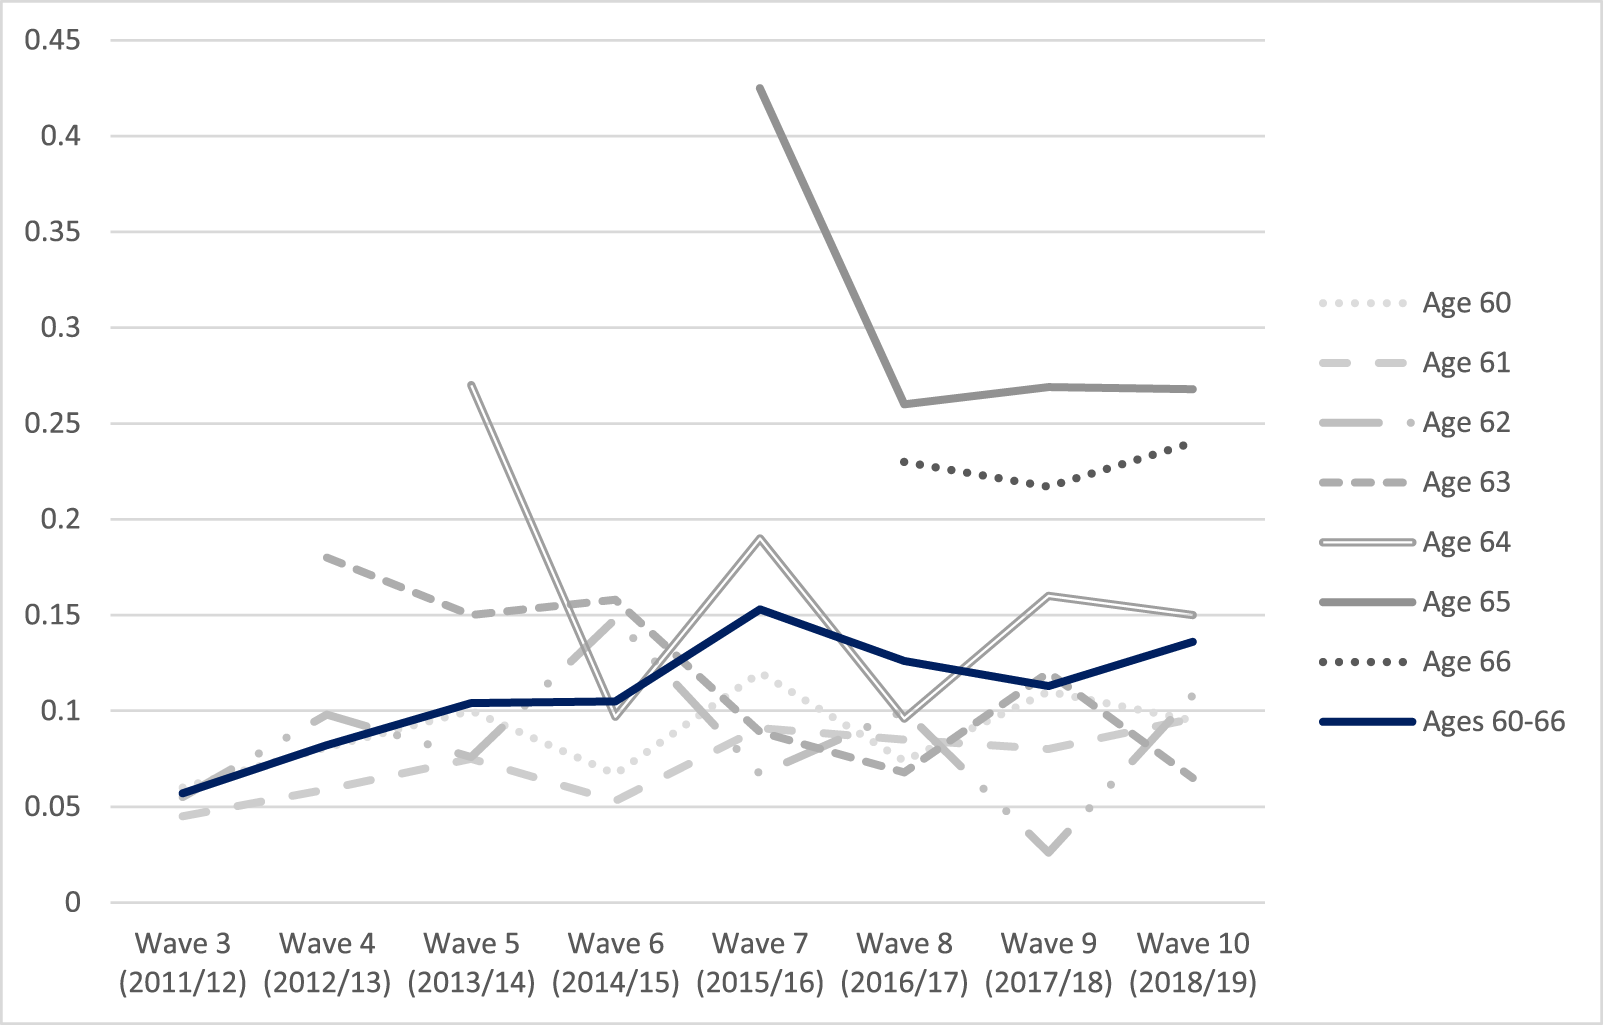
Male retirement rates by age between 2011 and –2019. Notes: Retirement rates across survey waves by single ages and ages 60–66. N = 3664. Source: Understanding society waves 3 (2011/12)-10 (2018/19). University of Essex, Institute For Social And Economic Research (2023). Understanding Society: Waves 1–13, 2009–2022 and harmonised BHPS: waves 1–18, 1991–2009: secure access. [data collection]. 16th edition. UK data service. SN: 6676, doi: http://doi.Org/10.5255/ukda-sn-6676-16.

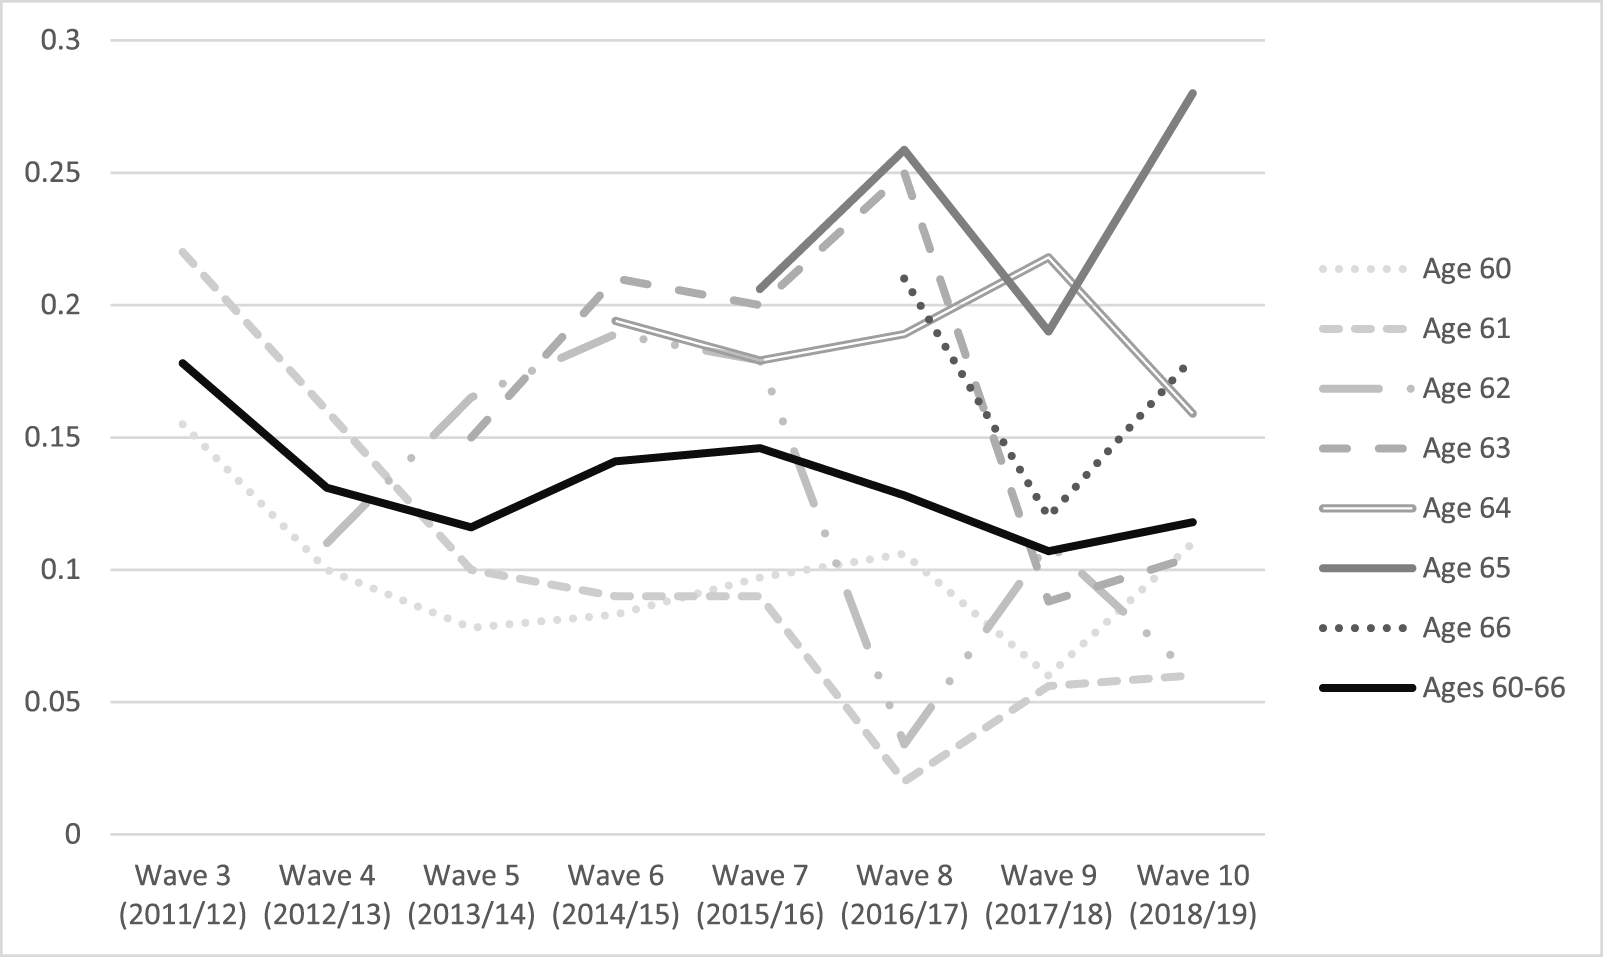
Female retirement rates by age between 2011 and 2019. Notes: Retirement rates across survey waves by single ages and ages 60–66. N = 3816. Source: Understanding society waves 3 (2011/12)-10 (2018/19). University of Essex, Institute for Social and Economic Research (2023). Understanding Society: Waves 1–13, 2009–2022 and harmonised BHPS: waves 1–18, 1991–2009: secure access. [data collection]. 16th edition. UK data service. SN: 6676, doi: http://doi.Org/10.5255/ukda-sn-6676-16.

We observe a decline in retirement rates across survey waves at ages 60–63 among women and a corresponding increase at ages 64 and above. In the case of men, we observe a sharp fall in retirement at ages 63–65. By including the average rate across all ages, we observe that as the sample of men ages across the survey waves, a greater proportion of individuals report retirement at a given age. On the other hand, in the case of women we observe a downward trend in the retirement rate across all age groups.
Figures E1 and E2 in the online Appendix E plots the SPe-age prevailing at a given survey wave among individuals at the same ages analysed in Figure 3 and 4. The general pattern is clear and shows SPe-age rising for individuals at the same age across increasingly younger generations, especially in the case of women. While there is a general flat and mildly downward trend in retirement rates among men in their early 60s; the sample composition implies around half the sample is not yet SPe-age by the end of the analysis period. On the other hand, we observe declines in the proportion of women retiring in their early 60s across the sample period, consistent with the fact SPe-age was rising from a historic base of 60.
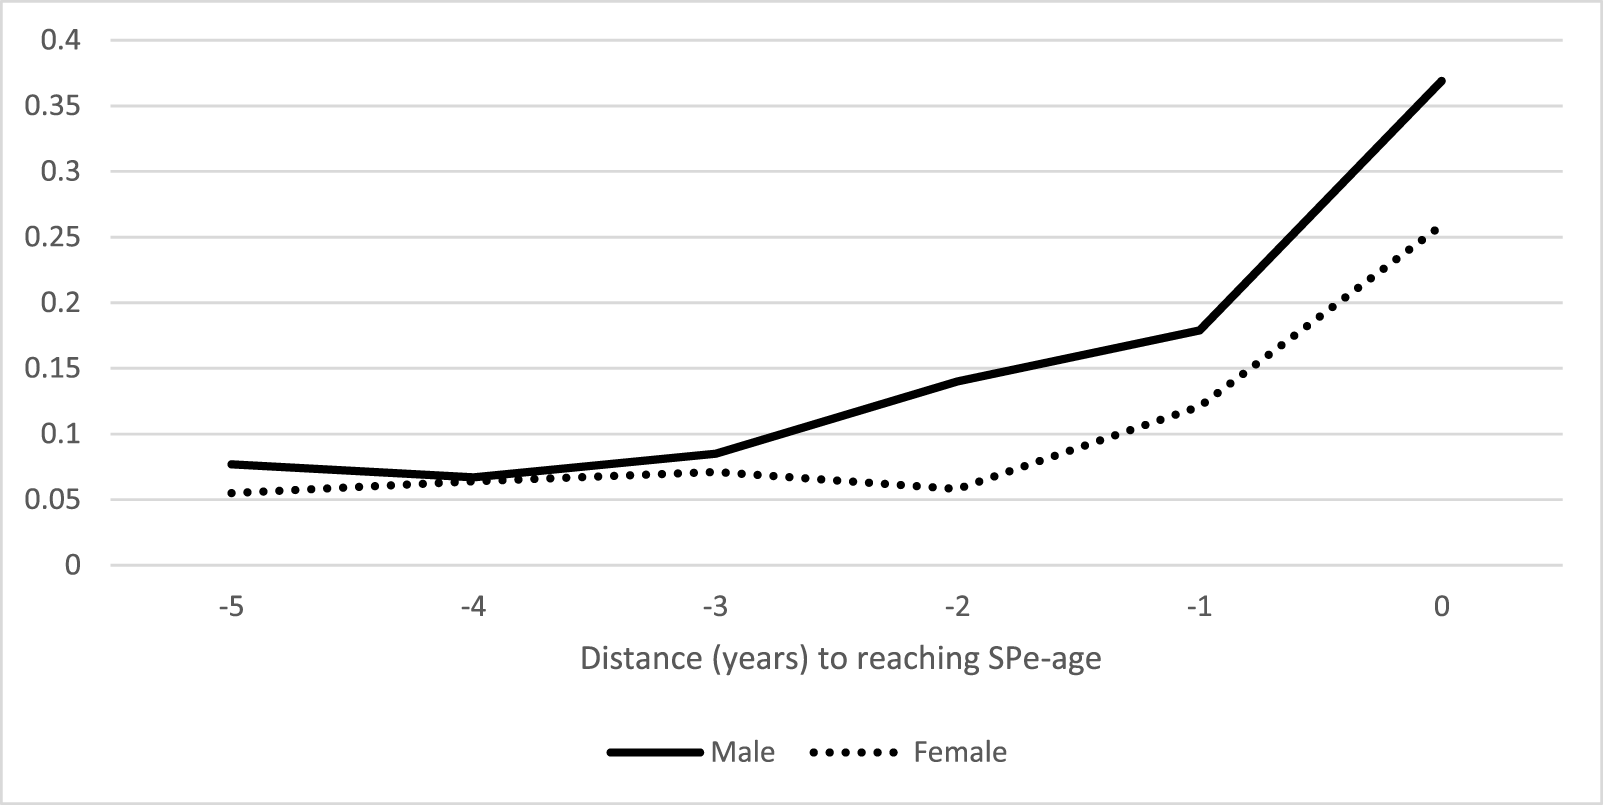
Finally, we plot the annual probability of an individual retiring up to five years prior to reaching SPe-age. In some sense, the information in Figure 5 summarises individuals’ actual behaviour in light of the information described in Figures 3, 4, E1 and E2. Across both men and women, we observe a clear trend upwards in the retirement probability, particularly in the two years prior to reaching eligibility age. We separately note that the retirement probability observed among men in the five years prior to SPe-age is higher than that for women.
Distance to SPe-age and retirement probability by gender. Notes: Sample based on individuals aged 50–61 at wave 2 of UKHLS. Nmales = 3330 and nfemales = 3736. Source: University of Essex, Institute for Social and Economic Research. (2024). understanding society: waves 1–14, 2009–2023 and harmonised BHPS: waves 1–18, 1991–2009: secure access. [data collection]. 17th edition. UK data service. SN: 6676, doi: http://doi.Org/10.5255/ukda-sn-6676-17.

4.2. Retirement expectations sample
When analysing how individual’s EAR responds to changes in SPe-age, we follow previous research and assume that individuals perceive the term ‘retirement’ to correspond to a significant reduction in labour supply at the intensive or extensive margin (Banks and Smith, Reference Banks and Smith2006; Blundell et al., Reference Blundell, Bozio and Laroque2013). UKHLS fields a ‘retirement planning’ module at each survey wave which asks individuals for their subjective expectation of events and situations associated with retirement. The question regarding EAR is worded as follows:
‘There is a lot of policy interest in how people are planning for their long term future and retirement. At what age do you expect you will retire or will consider yourself to be retired?’
Respondents provide an integer value or can respond ‘don’t know’.Footnote 10 The retirement planning module is age-triggered: only individuals aged 45, 50, 55, 60, and 65 at time of their survey interview and who consider themselves not retired are eligible to answer.Footnote 11, Footnote 12 The routing of the module directly informs our sampling strategy. We select individuals who are aged 45, 50, and 55 who are observed for the first time at waves 2–5, we refer to this as the period (t) observation. The nature of the retirement planning module is such that individuals are next fielded the same set of questions regarding their preparation for retirement 5 years later (period (t + 1)), in terms of our sample this implies individuals are aged 50, 55, or 60 (at waves 7–10 of the UKHLS). We therefore construct 2-wave balanced panels over the sample period 2010–20.
For identification purposes, we exploit variation both across and within individuals depending on the timing of their survey interview; the nature of the reforms implies we are comparing differences in behaviour between groups who were relatively more affected by the cumulative impact of the reforms, namely relatively younger individuals versus older counterparts. Specifically, individuals in period (t) belong to birth cohorts 1954–70. We include a breakdown of observations by single year birth cohort in online Appendix F. Depending on timing of the survey interview, either the 2007, 2011, or 2014 SPA will be law in period (t). In period (t + 1) SPe-age will follow the rules as set out in the 2014 SPA, thus for a small number of individuals whose first interview takes place towards the end of period (t) there will be no ‘within variation’. Among men the minimum (maximum) variation in SPe-age within an individual is 0 (1). Across men the equivalent statistic is 65 (67) years. For women, the equivalent statistics are 0 (1.5) years and 63.91 (67), respectively. In addition to the age condition, to be included in the sample for estimation purposes individuals must report being in employment (employees) in both waves.
Before analysing how EAR changes over time among our sample of individuals, we first plot the average EAR among individuals aged 45, 50, and 55 at waves 2–5 of UKHLS (2010/11–2014/2015) by gender in period (t) and the average SPe-age prevailing at the time of the survey interview for each age group.
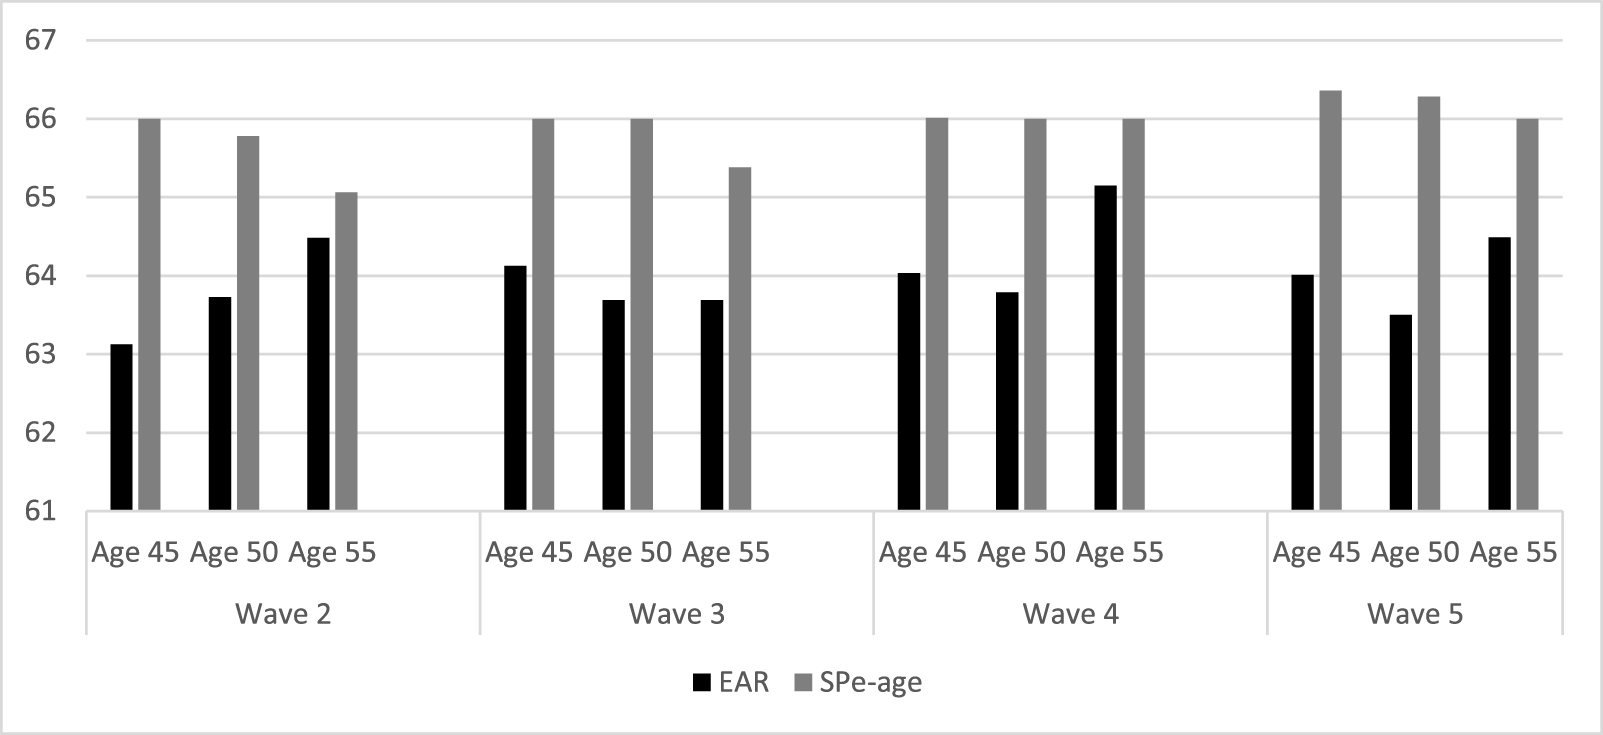
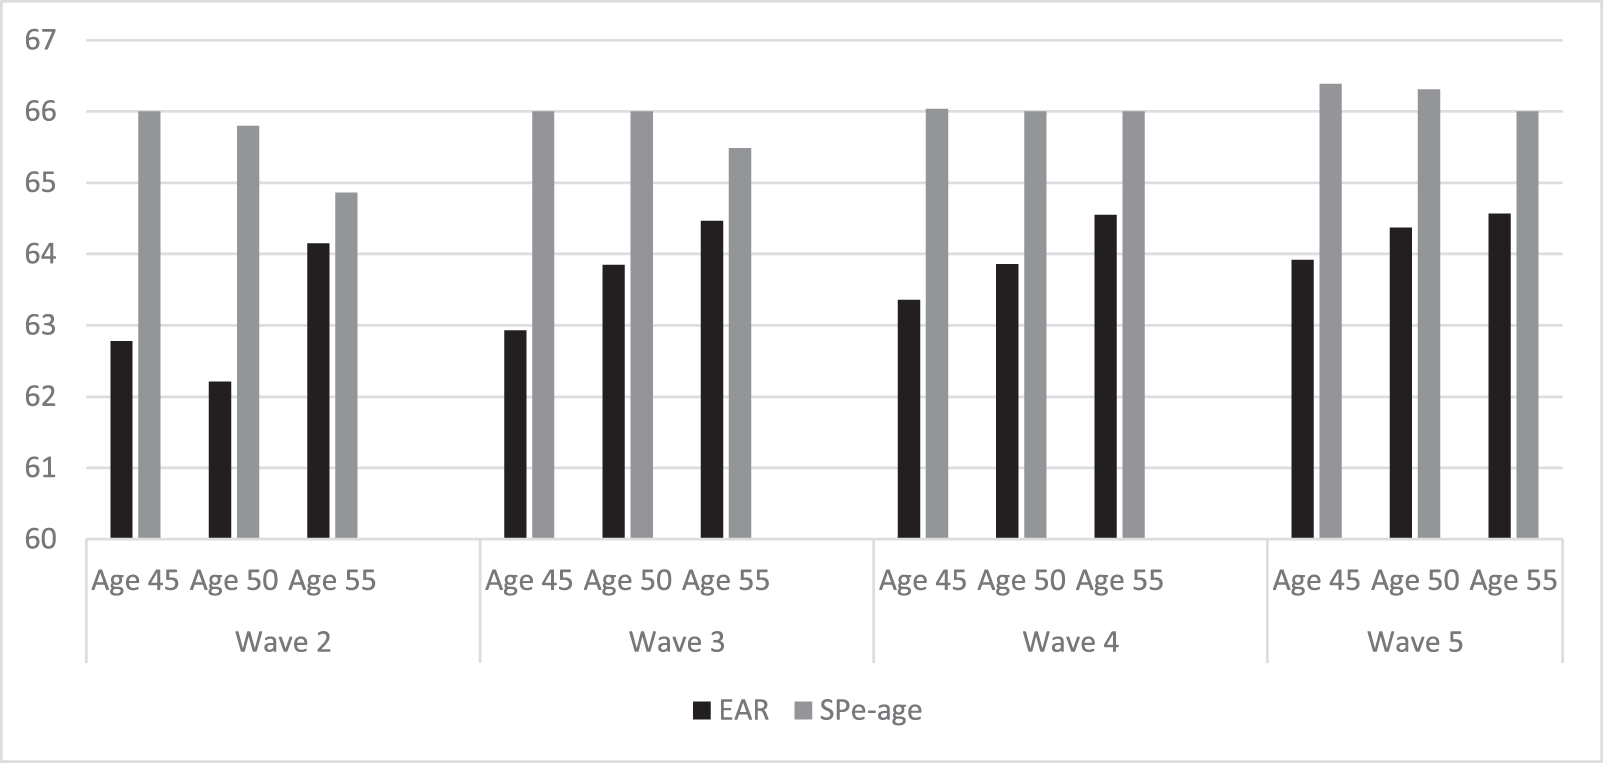
Figures 6 shows that across successive survey waves we observe an increase in EAR among men aged 45 at the time of their period (t) interview and in general the absolute level of EAR reported is higher among men aged 55. For women we observe a clear trend upwards in EAR across all age groups at each survey wave. Similar to men, the EAR is highest among women aged 55. It is important to note that the trends in Figures 6 and 7 do not disentangle time and cohort effects nor do they consider changes in EAR for the same individual over time. For reference we plot side-by-side individual’s EAR and their SPe-age, by construction SPe-age declines across successively older age groups at a given survey wave and rises among successively younger birth cohorts. Notably, we observe SPe-age at the time of the survey is consistently higher than EAR for both men and women, particularly among those aged 45 and surveyed earlier in the sample period. On the other hand, the equivalent gap among 55-year-olds is relatively smaller. Despite EAR increasing, particularly among women across successively younger birth cohorts at the same age, the change does not close the gap with SPe-age which itself is increasing for the same cohorts.
EAR and SPe-age among men aged 45, 50, and 55 in waves 2–5 of UKHLS (2010/11-2014/15). Notes: Sample based on individuals aged 45, 50, and 55 who report their EAR at waves 2–5 of UKHLS. N = 833. Source: University of Essex, Institute for Social and Economic Research. (2024). Understanding Society: Waves 1–14, 2009–2023 and harmonised BHPS: waves 1–18, 1991–2009: secure access. [data collection]. 17th edition. UK data service. SN: 6676, doi: http://doi.Org/10.5255/ukda-sn-6676-17.

EAR and SPe-age among women aged 45, 50, and 55 in waves 2–5 of UKHLS (2010/11-2014/15). Notes: Sample based on individuals aged 45, 50, and 55 who report their EAR at waves 2–5 of UKHLS. N = 1153. Source: University of Essex, Institute for Social and Economic Research. (2024). understanding society: waves 1–14, 2009–2023 and harmonised BHPS: waves 1–18, 1991–2009: secure access. [data collection]. 17th edition. UK data service. SN: 6676, doi: http://doi.Org/10.5255/ukda-sn-6676-17.

4.3. Sample descriptives
Online Appendix G describes the key economic and sociodemographic characteristics used in the analysis. Online Appendix H provides summary statistics for the sample used in both parts of the analysis. Due to the sample conditions imposed the average age of individuals at the first wave of observation used in the retirement analysis is slightly higher than that reported among individuals in the EAR analysis (in the case of men [women] 54.40 versus 49.21 [54.23 versus 49.27], respectively). In terms of sample composition, from an identification perspective (holding interview date fixed) this implies we have a disproportionately larger percentage of younger individuals in the EAR sample whose SPe-age when initially observed is relatively higher and experience greater changes in their SPe-age over the sample period versus individuals used in the retirement analysis.
5. Empirical models
5.1. Modelling retirement
To understand how the likelihood of transitioning from employment to retirement changes in response to increases in SPe-age, we estimate the following regression by gender using a fixed effects estimator:
 \begin{equation}{R_{it}} = {\beta _0} + {\beta _1}SPe - ag{e_{it}} + {{\boldsymbol{\beta }}_2}{{\boldsymbol{X}}_i}*SPe - ag{e_{it}} + {\varphi _t} + {\theta _i} + {\epsilon_{it}},\end{equation}
 where  $i$ denotes individual, $t$ the year of observation. Equation (1) states that individuals’ probability of being retired in a given survey wave is affected by their SPe-age, which is a continuous variable reflecting the SPe-age at the time of the survey interview, and whose effect can vary with individual and household level covariates ( ${\boldsymbol{X}}$). Also, calendar year fixed effects ( $\varphi $) and an individual fixed effect $\theta $ are controlled for.
Given our unbalanced panel setup and as shown in Figures 1 and 2, to identify SPe-age effects we exploit variation in treatment intensity at individual level which is induced by the respective SPA in law at the time of an individual’s survey interview. By using a fixed effect estimator, this implies individuals who experience a change in their SPe-age over the sample period and are observed to transition from employment to retirement contribute to the identification of the treatment effect. Separately, including fixed effects in (1) allows us to control for time-constant, individual-level unobserved heterogeneity. In the context of modelling retirement transitions this may include factors such as work preferences and gender norms which likely vary across cohorts (Giusta and Longhi, Reference Della Giusta and Longhi2021).
The covariates are measured in the first wave an individual is observed to avoid issues of simultaneity or reverse causation. The individual fixed effects control for initial age or any time-invariant covariate (including  ${\boldsymbol{X}}$ separately) which may influence the retirement decision. Because of social norms, income effects and low rates of state pension deferral (see Kanabar and Simmons, Reference Kanabar and Simmons2016), and the importance of a state pension for retirement income, we expect the SPe-age to negatively affect the probability of retirement. Standard errors are clustered at the individual level.
In addition to the direct effects of SPe-age on retirement probabilities, we are interested in whether socioeconomic characteristics influence retirement behaviour in response to the SPe-age reforms. For example, individuals who own their home or have sufficiently high levels of occupational pension wealth may consider such assets as a substitute for state pension wealth/income, which in turn influences how responsive they are to a reduction in this type of wealth due to the reform(s). We therefore interact SPe-age with an indicator for whether an individual is a member of their employer’s occupational pension plan, their housing tenure, and household income. The latter characteristics relate to the fact that empirical literature shows retirement decisions are typically made at the household level (Coile, Reference Coile2016; Kruse, Reference Kruse2021). Including interaction effects also allows us to understand whether certain at-risk groups who are more likely to be disproportionately reliant on state pension as their main source of retirement income exhibit differential response behaviour with respect to their EAR given reforms to SPe-age.
5.2. Modelling retirement expectations
Figures 1 and 2 demonstrate the change to SPe-age is gradual and the degree to which individuals are affected varies significantly by SPA. Importantly, the magnitude of changes differs by date of birth in different calendar years. The complex relationship between SPe-age on the one hand, and calendar time and birth cohort, on the other, makes it difficult to use standard econometric frameworks typically used to estimate causal effects.Footnote 13 This is compounded further by the fact that retirement expectations data are collected only once every five years. Therefore, like the approach taken to model retirement, we model changes in the EAR using a fixed effects estimator. We estimate the following equation by least squares for each gender:
 \begin{equation}EA{R_{it}} = {\alpha _0} + {\alpha _1}SPe - ag{e_{it}} + {{\boldsymbol{\alpha }}_2}{{\boldsymbol{X}}_i}*SPe - ag{e_{it}} + {\gamma _t} + {\eta _i} + {\xi _{it}}\end{equation}
 Our dependent variable is  $EAR$ and the variable $SPe - age$ is the eligibility age given individual’s date of birth and date of their survey interview. We include an identical set of individual and household level controls ( ${\boldsymbol{X}}$) used to model retirement.Footnote 14 For the same reasons discussed in the previous subsection, we only include the values recorded at period (t) and similarly these are interacted with SPe-age. Time fixed effects are denoted by $\gamma $ and individual fixed effects by $\eta $.
The key coefficient of interest is the effect of SPe-age on EAR (which depends on  ${\boldsymbol{X}}$). If the effect is positive (negative) this indicates that the EAR rises (falls) for a given increase in the SPe-age. If individuals adjust their EAR with the same number of years as the rise in their SPe-age, then the effect is equal to one. If the effect is equal to zero, this would be consistent with individuals either having perfect foresight or being ‘naïve’ with respect to announced changes to SPe-age.
Our methodological approach identifies reform effects for the reasons outlined in the previous subsection. Namely, we exploit exogenous variation induced by the various SPAs which imply individuals aged 45, 50, and 55 face different SPe-age depending on the timing of their period (t) interview. Given all interviews are spaced 5 years apart, the 2014 Pension Act is in place at period (t + 1). The reforms are as such that the magnitude of treatment effects varies across individuals. For example, the maximum difference between minimum eligibility ages across two consecutive Acts is 1 (1.5) year(s) for men (women).
The composition of our sample and timing of survey interviews implies that a minority of survey respondents (around 20% of men and women) will experience no change in minimum eligibility ages between two consecutive periods. While these individuals do not contribute to the estimation of the treatment effect we identify, they can and do change their EAR between observation periods (upward by on average 0.253 and 0.324 years among men and women, respectively). Online Appendix I reports, by gender, the average change in EAR by (1) changes in SPe-age between two consecutive periods and (2) birth cohort (in both cases we abstract from the calendar time at which the survey interviews took place). The findings show a clear negative relationship between the change in EAR and single year birth cohort for both men and women. We do not observe a clear relationship in the case of (1). Nevertheless, from an identification perspective by using a fixed effects estimator we control for such individuals from a modelling perspective and can estimate the marginal effect of a change in SPe-age on EAR. Separately, including such individuals in our sample allows us to identify a common trend in EAR.
Evidence based on comparative European data available in SHARE suggests individuals adjust their retirement intentions at the time policy announcements are made rather than when they are implemented (Ciani et al., Reference Ciani, Delavande, Etheridge and Francesconi2023). In order to determine whether similar behaviour is observed in the UK, which operates a relatively less generous state pension system than European counterparts, we test for so-called anticipation effects one year ahead of the implementation date. Another possibility is that individuals and indeed particular subgroups are slow to adjust their expectations to retirement policy announcements, for example due to information asymmetries or lack of engagement with financial decision-making which has been shown to lead to poor levels of retirement preparedness (Lusardi and Mitchell, Reference Lusardi and Mitchell2007). We therefore test for reform effects one year post the implementation date and accounting for individual’s survey interview (see online Appendix J).
6. Estimation results
We present our main findings in two parts, the first focuses on how variation in SPe-age affects the probability of retirement and the second on how SPe-age affects individual’s EAR.
Our estimates (see Table 1 columns 1 and 3) imply a one-year increase in SPe-age leads to a reduction in the probability of retirement of 8.2 pp for men and 6.4 pp for women. After controlling for individual occupational pension membership, household income and housing tenure (all interacted with SPe-age), columns 2 and 4 show that for a one-year increase in SPe-age the probability of retirement decreases by 15.9 pp for men and by 13.3 pp for women who belong to the reference group, i.e., those in the bottom income tertile, rent their home and are not active members of their employers’ occupational pension plan.
Retirement and SP eligibility age (SPe-age) effects

*** Notes: , **, *, refers to significance at the 1%, 5%, and 10% level, respectively. Base categories: 2010, bottom tertile of income distribution, renter (and other), and individuals who are not a member of their current employer pension scheme, all interacted with state pension eligibility (SP-e). Year fixed effects are controlled for. F-test results refer to test outcome at the 1% level. Source: University of Essex, Institute for Social and Economic Research (2023). Understanding Society: Waves 1–13, 2009–2022 and Harmonised BHPS: Waves 1–18, 1991–2009: Secure Access. [data collection]. 16th Edition. UK Data Service. SN: 6676, doi: http://doi.org/10.5255/UKDA-SN-6676-16
Our findings underline the importance of interacting key covariates with SPe-age to understand differential response behaviour in light of SPe-age reform (F-test reported in the bottom row of Table 1). Among men, the findings show that the effect of SPe-age on the probability of retirement is lower in absolute terms for individuals who report being active members of their employer’s pension scheme. We find a similar result for women albeit in this case the effect estimated is only marginally significant. The findings also show that conditional on SPe-age, individuals who own their home outright are more likely to retire. Finally, a similar moderating effect is found for women belonging to households in the top tertile of the income distribution.
Table 2 reports our findings analysing SPe-age reforms on individual EAR. Identical to Table 1 we report results based on a basic and extended specification, by gender. Columns 1 and 2 of Table 2 show no evidence to support that reforms to minimum eligibility ages affect men’s EAR. Separately, we note that men who report owning their home (with a mortgage) are more likely to revise down their EAR down relative to those living in rented accommodation in response to an increase in their eligibility age.
Expected age of retirement age (EAR) and state pension eligibility age (SPe-age)

*** Notes: , **,*,ᶧ refers to significance at the 1%, 5%, and 10% level, respectively. Base categories: 2010, bottom tertile of income distribution, renter (and other) and individuals who are not a member of their current employer pension scheme interacted with state pension eligibility age (SPe-age). Year fixed effects are controlled for. F-test results refer to test outcome at the 1% level. Source: University of Essex, Institute for Social and Economic Research (2023). Understanding Society: Waves 1–13, 2009–2022 and Harmonised BHPS: Waves 1–18, 1991–2009: Secure Access. [data collection]. 16th Edition. UK Data Service. SN: 6676, doi: http://doi.org/10.5255/UKDA-SN-6676-16
Our findings imply that women adjust their EAR down in response to increases in SPe-age. The findings reported in Column 3 of Table 2 which refers to the base specification imply that for a single year increase in SPe-age, women’s EAR declines on average by about 0.9 years. After controlling for socioeconomic characteristics in the extended specification, our main findings hold. Specifically, it is those women who are active members of their employer’s pension that adjust their EAR downwards to an extent that this approximately offsets the adjustment made by women belonging to the base group. Finally, we note that those women living in households belonging to the middle tertile of the income distribution are, on average, more likely to report a decline in their EAR for a given change in eligibility age. We return to this unexpected finding of a downward EAR adjustment in Section 7.
6.1 Sensitivity analysis
Empirical research suggests individuals may not adjust their future retirement expectations at the time reform to state pension eligibility age becomes law but when it is first announced (see inter-alia Ciani et al., Reference Ciani, Delavande, Etheridge and Francesconi2023; Bucher-Koenen et al., Reference Bucher-Koenen, Ferrari and Pettinicchi2019). The nature of the reforms meant both Acts received media attention (Parliament, 2016), online Appendix B shows increased online search activity in relation to state pension age around key dates associated with the legislative process. For example, the draft legislation which underpinned the 2011 SPA was first announced in the House of Commons in 2010 and subsequently discussed in the House of Lords in January 2011 before becoming enshrined in law in November 2011. Alternatively, due to inertia or lack of engagement with financial and retirement decision-making individuals may adjust their intended behaviour at some point after the reform has become law.
To assess the speed at which individuals adjust their behaviour in response to SPe-age policy reforms, we estimate an alternative regression specification by gender which includes the SPe-age 12 months prior, at the time of and 12 months following the time of the survey interview.Footnote 15 In this way, it is possible to assess which eligibility age it is that influences EAR.
In contrast to recent studies using European data (see inter-alia Ciani et al., Reference Ciani, Delavande, Etheridge and Francesconi2023), and consistent with the findings in Table 2 we find mild evidence that women adjust their EAR down in response SPe-ages which became law 1 calendar year ahead of the survey interview and the respective SPA in place at the time (see online Appendix J). Among women who belong to their employer’s workplace pension scheme and separately residing in a household in the middle tertile of the income distribution, we see a larger decrease in EAR for a given change in SPe-age relative to the base group.
In case of the men, we find in terms of the temporal proximity to the implementation date, none of the eligibility ages dominate or affect the change in individual’s EAR over time.
7. Discussion
Our main findings show that among treated cohorts higher SPe-age leads to a reduction in the probability of retirement consistent with empirical evidence (Giusta and Longhi, Reference Della Giusta and Longhi2021; Cribb et al., Reference Cribb, Emmerson and O’Brien2022). A second major finding, and the focus of our discussion relates to our findings on retirement expectations. In this case, we find that despite SPe-age reform influencing actual retirement among men, it has no effect on EAR. In the case of women, we observe a downward adjustment to EAR in response to SPe-age reform, which is driven by women who are members of their employer’s occupational pension scheme.
These findings contrast with studies evaluating the effect of SPe-reforms on EAR in Italy, the Netherlands, and Germany (Bottazzi et al., Reference Bottazzi, Jappelli and Padula2006; De Grip et al., Reference De Grip, Fouarge and Montizaan2013; Coppola and Wilke, Reference Coppola and Wilke2014). One potential reason for the difference in findings is that the relative generosity of state pension in the UK is low, replacing only 28% of pre-retirement earnings and one of the lowest among all OECD countries (OECD, 2021). Therefore, the reduction in state pension wealth arising from reforms(s) is lower in the UK, put another way the financial incentives are weaker. This also underlines the importance of occupational pensions in supplementing retirement income which have been shown to contribute over 40% of the replacement rate (OECD, 2018).
Table 3 shows the change in individuals’ EAR between the periods they are observed in the data by age, and shows the downward adjustment in EAR, as shown in Table 2, is driven by younger individuals and those who are members of their employer’s pension scheme. Indeed, we note that in contrast to men, among women aged 45 when first observed who are not members we observe, on average, an upward adjustment to EAR of around two-thirds of a year. Table 3 highlights older sample members are more likely to revise their EAR upwards, particularly if they do not have an occupational pension. Online Appendix K reports estimates of a regression specification which includes a triple interaction effect between age at first interview, SPe-age and pension membership status at first interview. The estimates imply that for a one-year increase in SPe-age, 45- and 50-year-old individuals with an occupational pension revise their EAR down by between 0.86 and 1.25 years compared to 55-year-old non-member counterparts.
Change in individuals ERA between t-1 and t by age group and pension membership status

Notes: Figures correspond to mean changes in EAR by age at first wave of observation. Source: University of Essex, Institute for Social and Economic Research. (2024). Understanding Society: Waves 1–14, 2009–2023 and Harmonised BHPS: Waves 1–18, 1991–2009: Secure Access. [data collection]. 17th Edition. UK Data Service. SN: 6676, doi: http://doi.org/10.5255/UKDA-SN-6676-17
The role of occupational pensions in providing retirement income is set to increase since October 2012 when Auto Enrolment (AE) into a workplace pension became the default, alongside demographic changes such as the rise in female labour force participation across successively younger cohorts. For example, the proportion of women (men) in our (EAR) sample born in the 1950s who report not being active member of their employer’s pension is 19% (13%), whereas for those born in the 1960s the equivalent statistic is 11% (10%). However, while successfully boosting pension coverage AE alone is unlikely to address the policy issue of pension adequacy, an issue we return to in a latter part of the discussion. One explanation for our finding of downward EAR adjustment is that younger individuals auto enrolled into a workplace pension perceive that they will have sufficiently high pension wealth/income, accessible from age 55 or 57, such that they can retire earlier relative to older counterparts who are closer to retirement itself. Indeed, empirical evidence and our own findings show labour supply adjustment is more common closer to the SPe-age itself, possibly due to individual’s taking steps to understand their level of pension income or having more accurate information regarding their level of total pension wealth at SPe-age (Geyer and Welteke, Reference Geyer and Welteke2021). Importantly, we note response behaviour is not stronger among individuals belonging to lower income households who typically have lower levels of pension wealth.
There exists limited empirical evidence based on UK microdata which investigates the effect of SPe-age reform on individual saving behaviour among future cohorts of retirees. One exception is Johnson (Reference Johnson2001) who analyses female saving behaviour in response to the 1995 SPA and concludes the lack of adjustment in household saving rates among women affected by the reform relative to those unaffected is suggestive of myopic behaviour. He suggests that women could not have anticipated the reform and the way it was phased in instead suggesting the lack of adjustment was due to individuals perceiving the event to be sufficiently ‘far off’. In the reforms we analyse, the period between the announcement and implementation date is much shorter compared to the legislated changes to SPe-age in the 1995 reform which did not come into effect until April 2010 implying that, ceteris paribus, individuals may adjust on some margin particularly older age groups who are closer to SPe-age. To shed further light on this issue using our sample data we analyse changes in EAR by SPe-age given individual’s interview date.
Table 4 shows that the level and change in EAR observed across our sample period and hence successive SPAs in place is below the SPe-age itself. Given the balanced panel approach we follow, we split responses by the SPA in place at the time of the period (t) interview. The majority of period (t) responses were recorded when either the 2007 or 2011 Pension Act was in operation, whereas at the second observation the 2014 Pension Act was law. Irrespective of observation those with lower SPe-age refer to older cohorts. Based on these selected common SPe-ages, our sample data highlight the lack of responsiveness in EAR to changes in, and relative to, SPe-age particularly among the youngest cohorts in our sample. However, we also note that irrespective of gender, individuals with a lower SPe-age and hence older sample members generally report a higher EAR compared to younger individuals in both time periods (except for those whose SPe-age is 66–67 in the first period they are observed). Such findings tentatively suggest that individuals adjust their EAR albeit very slowly and closer to SPe-age. We also note that the difference in EAR for a given SPe-age is not dissimilar by gender.
Average EAR for selected state pension eligibility ages (SPe-ages)

Notes: Figures correspond to mean expected age of retirement (EAR) for two specific SPe-ages in the first and second period an individual is observed in the balanced panel. Source: University of Essex, Institute for Social and Economic Research (2023). Understanding Society: Waves 1–13, 2009–2022 and Harmonised BHPS: Waves 1–18, 1991–2009: Secure Access. [data collection]. 16th Edition. UK Data Service. SN: 6676, doi: http://doi.org/10.5255/UKDA-SN-6676-16
We also find that a higher proportion of younger cohorts expect to receive income from an occupational pension, and separately, that almost halve of individuals in our sample expect to engage in paid employment in retirement. Arguably, the former suggests that occupational pension is ex-ante perceived to facilitate early retirement given DC pensions can be claimed at age 55 (rising to 57 in April 2028) in the UK, over a decade before reaching SPe-age. Such features of the UK retirement system may well lead to individuals becoming overly optimistic with respect to planned retirement age.
Online Appendix L shows a strong interaction effect between pension membership and SPe-age, and whether an individual intends to engage in paid employment in retirement.Footnote 16 In the case of men, we note pension membership leads to a decline in the probability of an individual expecting to engage in paid work during in retirement, whereas for women we find the opposite effect holds. Similarly, we find contrasting results in the case of homeownership status by gender, in the case of men (women) those in rented accommodated are significantly less (more) likely to engage in paid work during retirement for a given change in SPe-age. Empirical evidence suggests a return-to-work conditional on being retired among English men is relatively more prevalent among certain groups in England including the highly educated, those with a spouse in the labour market and in better health; and in most cases reflects a lifestyle rather than financial decision (Kanabar, Reference Kanabar2015). Platts et al., (Reference Platts, Corna, Worts, McDonough, Price and Glaser2019) using the British Household Panel Study and UKHLS finds that among recent retirees 25% unretire within the first five years of retirement. An important distinction in the context of this study is that our findings relate to individual’s expectations regarding future retirement and the possibility of continuing or taking up work in retirement, rather than realised labour market transitions post initial retirement.
Our results show that while SPe-age plays an important role in explaining the actual age at which individuals retire, from a financial perspective the contribution of State Pension itself to total retirement income is relatively low (with the exception of low income households see Cribb, Reference Cribb2023) compared to occupational pensions and thus individuals may be overly optimistic in their EAR and/or slow to adjust, especially if the event is sufficiently ‘far off’ to revise their EAR upward consistent with the policy objective. Our findings underline the importance of pension wealth more generally for understanding labour supply decisions at older ages (Stock and Wise, Reference Stock and Wise1990). Specifically, given the UK context the presence, type, and level of occupational pension wealth is likely to play an important role in determining retirement expectations and actual labour supply decisions.
In the UK, Defined Contribution pensions can be claimed at age 55, whereas more generous Defined Benefit schemes vary in terms of eligibility ages albeit are generally higher. Crawford et al. (Reference Crawford, Cribb, Emmerson and Simpson2020) using WAS find for a cohort of individuals born in England during the 1950s current DB scheme members report on average, an EAR 0.8 years lower than individuals who have no private pension arrangement, whereas members of DC pensions do not report an EAR which is statistically different from the latter group. Unfortunately, in the UKHLS it is not possible to identify the type of pension held by an individual. Conditional on the type of occupational pension held (if any), Crawford et al. (Reference Crawford, Cribb, Emmerson and Simpson2020), who in addition to finding evidence of time effects, note that individuals in the top household financial wealth quintile report on average an EAR over 2 years lower relative to those in bottom quintile. While Crawford et al. (Reference Crawford, Cribb, Emmerson and Simpson2020) and Cribb (Reference Cribb2023) using the WAS find a general increase in EAR between 2006 and 2018 among a sample of individuals aged 40–54, their analysis, which is descriptive in nature, is largely based on pooled data and does not explicitly account for SPe-age when analysing the factors which explain individual’s EAR nor control for individual fixed effects.
8. Conclusion
Our results confirm that the SPe-age strongly influences the likelihood of retiring despite the absence of an earnings test for State Pension eligibility, or significant financial incentives to remain in work. Thus, SPe-age remains closely aligned with social and cultural norms regarding when individuals reduce work intensity or exit the labour market.
Separately, our results show that in general individuals do not adjust their EAR upward in response to an increase in SPe-age. This finding is driven by younger cohorts born in the 1960s who are more likely to expect retirement income in the form of an occupational pension compared to older cohorts. Our results are also likely to be driven by the fact that in the UK for most household’s retirement income is largely financed by occupational pension, and state pension is an important source of supplementary income.Footnote 17 Finally, our findings show that individuals tend to adjust their retirement behaviour much closer to SPe-age itself.
One interpretation of our findings is that younger cohorts, and especially women, may be overly optimistic with respect to their EAR. For example, perceiving their workplace pension will facilitate retirement prior to SPe-age alongside engaging in paid employment in later life. Nevertheless, women and men do adjust their retirement behaviour much closer to the date of actual retirement, possibly remaining in the labour market longer than they anticipated. Data constraints imply we cannot follow the same individuals in both samples which would allow us to determine whether individual expectations match realisations to confirm our conjecture; an issue that future research should address.
Our findings suggest that ex-ante policymakers in the UK need to improve communication to raise awareness of SPe-ages both for cohorts approaching retirement years and especially among younger prime age workers. Recent developments such as auto-enrolment, the midlife MOT, and forthcoming Pensions Dashboard Programme aim to address some of these issues. A key challenge here is engaging individuals, especially those who are less financially literate to use such tools and increase retirement preparedness in the UK.
Supplementary material
The supplementary material for this article can be found at https://doi.org/10.1017/S1474747225000095.
Conflict of interest statement/declaration of competing interests
The authors declare that they have no conflict/declarations of interest. No funding was sought for this project. We confirm this article is not being considered for publication elsewhere.
Acknowledgements
The authors would like to thank the editor, Vincenzo Galasso, and two anonymous referees for constructive feedback.


 Open access