


1. Introduction
Business cycle comovements differ across countries since each country has a different economic structure. Hence, it is plausible to conjecture that countries with different energy production and trade structures may have different business cycle correlations with the USA. Surprisingly, however, this has not been analyzed in existing studies on international business cycles. This study addresses this gap in the literature. It first presents the empirical findings that GDP correlations between the USA and energy-exporting countries are greater than those between the USA and energy-importing countries. It then builds a three-country model in which the USA (an energy importer), a non-US energy importer, and an energy exporter exist, and shows that the model replicates the empirical findings well.
Energy has peculiar features compared to other goods. It is used as an input in production in almost every sector, as well as consumed by households. Other goods, however, are typically only consumed or used as inputs for production in a specific sector.Footnote 1 Due to these features of energy, changes in energy prices affect both households and firms, which means that energy prices have a more widespread effect on the economy than other goods. Thus, macroeconomists generally regard changes in energy prices as a critical source of economic fluctuation and one that can affect many countries simultaneously [Blanchard and Galí (Reference Blanchard, Galí, Blanchard and Galí2010)]. Furthermore, each country has its idiosyncratic energy production and trade structure. For instance, countries such as the USA are net energy-importing countries, whereas countries such as Canada are net energy-exporting countries.Footnote 2 Therefore, each country will be affected by the same shock in a different way. As a result, several papers studying North-South interactions, such as Moutos and Vines (Reference Moutos and Vines1989), have already emphasized that to properly capture macroeconomic interactions between countries in open economy macro models, the asymmetries of trade and production resulting from commodities, including energy, should be considered.Footnote 3
To illustrate, output growth triggered by a certain shock in the USA, an energy-importing country, would increase its import demand for energy for both production and consumption. Accordingly, energy prices would rise, since the USA is a large open economy. This increased US demand for energy imports would have a positive influence on the economies of energy-exporting countries in terms of output. Conversely, higher energy prices would adversely affect the economies of energy-importing countries. Hence, the outputs of energy-exporting countries would increase by more than those of energy-importing countries. Consequently, US output would be expected to have stronger positive correlations with those of energy-exporting countries than with those of energy-importing countries. In accordance with this hypothesis, the USA has higher positive GDP correlations with energy-exporting countries than with energy-importing countries based on the data (see Section 2 for details).
To analyze this international business cycle differential, this paper constructs a three-country model in which the different energy production and trade structures of countries are considered. The three countries are the USA (an energy importer), a non-US energy importer, and an energy exporter. Only the energy exporter produces energy. Furthermore, energy consumption goods are included in the consumption basket of households as a complement to nonenergy consumption goods, and energy is used as an input in the production of nonenergy goods.Footnote 4
This study primarily aims to examine whether the model can generate a higher output correlation between the USA and the energy exporter than that between the USA and the energy importer, consistent with the empirical findings. Indeed, the model replicates these empirical findings. Changes in energy prices and trade in response to shocks play a key role in this analysis.
Specifically, positive productivity shocks in the USA lead to increases in its aggregate output and demand for energy imports. Thus, energy prices increase. The rise in US demand for energy imports increases energy output in the energy exporter and, hence, its aggregate output. However, in the energy importer, higher energy prices raise its import prices. Therefore, the terms of trade (defined as the relative price of exports to imports) in the importer increase (improve) by less than that in the exporter. Owing to the smaller increase in the terms of trade, the market value of the importer’s output increases by less and, hence, its income. Accordingly, aggregate consumption and output in the importer increase by less than those in the exporter. As the exporter’s output rises by more, the correlation of US output with output in the exporter is higher than that with output in the importer.
Within the international business cycles literature, this study is related to research that attempt to explain the discrepancies of cross-country output and consumption correlations between the data and standard models’ predictions. Among the first such studies is Backus et al. (Reference Backus, Kehoe and Kydland1992). They extend a closed economy real business cycle model to a two-country model. Their model, however, is not successful in replicating the basic properties of international business cycles. It predicts that the output correlation between countries is negative (whereas in the data, it is positive), and that the consumption correlation between countries is very high and larger than the output correlation (whereas in the data, the output correlation is greater than the consumption correlation). Since their seminal work, numerous papers have attempted to tackle the discrepancies. One strand of the literature restricts asset trade between countries [see Baxter and Crucini (Reference Baxter and Crucini1995), Kollmann (Reference Kollmann1996), Heathcote and Perri (Reference Heathcote and Perri2002), Kehoe and Perri (Reference Kehoe and Perri2002), etc.]. Another strand of the literature, which maintains complete asset markets, adds new elements or disturbances to the models. Examples include nontraded goods and taste shocks [Stockman and Tesar (Reference Stockman and Tesar1995)], the distribution sector [Corsetti et al. (Reference Corsetti, Dedola and Leduc2008)], Greenwood–Hercowitz–Huffman (GHH) preferences with internal habit formation in consumption [Dmitriev and Roberts (Reference Dmitriev and Roberts2012)], investment composition [Oviedo and Singh (Reference Oviedo and Singh2013)], and Epstein-Zin-Weil and GHH preferences [Kollmann (Reference Kollmann2017)]. Some studies have searched factors causing the high output correlation between countries: similar financial market structures [Faia (Reference Faia2007)], the globalization of banking [Ueda (Reference Ueda2012)], etc. Despite differences in economic structures and business cycle comovements across countries, all these studies assume extreme symmetry across countries in their models. The model in this paper relaxes the assumption of the symmetry across countries by considering different energy production and trade structures of countries.
The paper is organized as follows. Section 2 shows the empirical findings that US output correlations with energy exporters are greater than those with energy importers. Section 3 describes the three-country model in which the different energy production and trade structures of countries are considered. Section 4 presents the model analysis, and finally, Section 5 concludes the paper.
2. Properties of US output comovements
In this section, I show empirically that US GDP correlations with energy-exporting countries are significantly higher than those with energy-importing countries.Footnote 5
Since the USA is a large open economy, changes in its demand for energy imports affect energy prices. Specifically, an increase in its output will increase its demand for energy imports; thus, energy prices will also increase. Rises in US demand for energy imports will have a positive effect on outputs in energy exporters, while an increase in energy prices will adversely affect outputs in energy importers. Hence, we would expect the USA to have stronger GDP comovements with energy exporters than with energy importers.
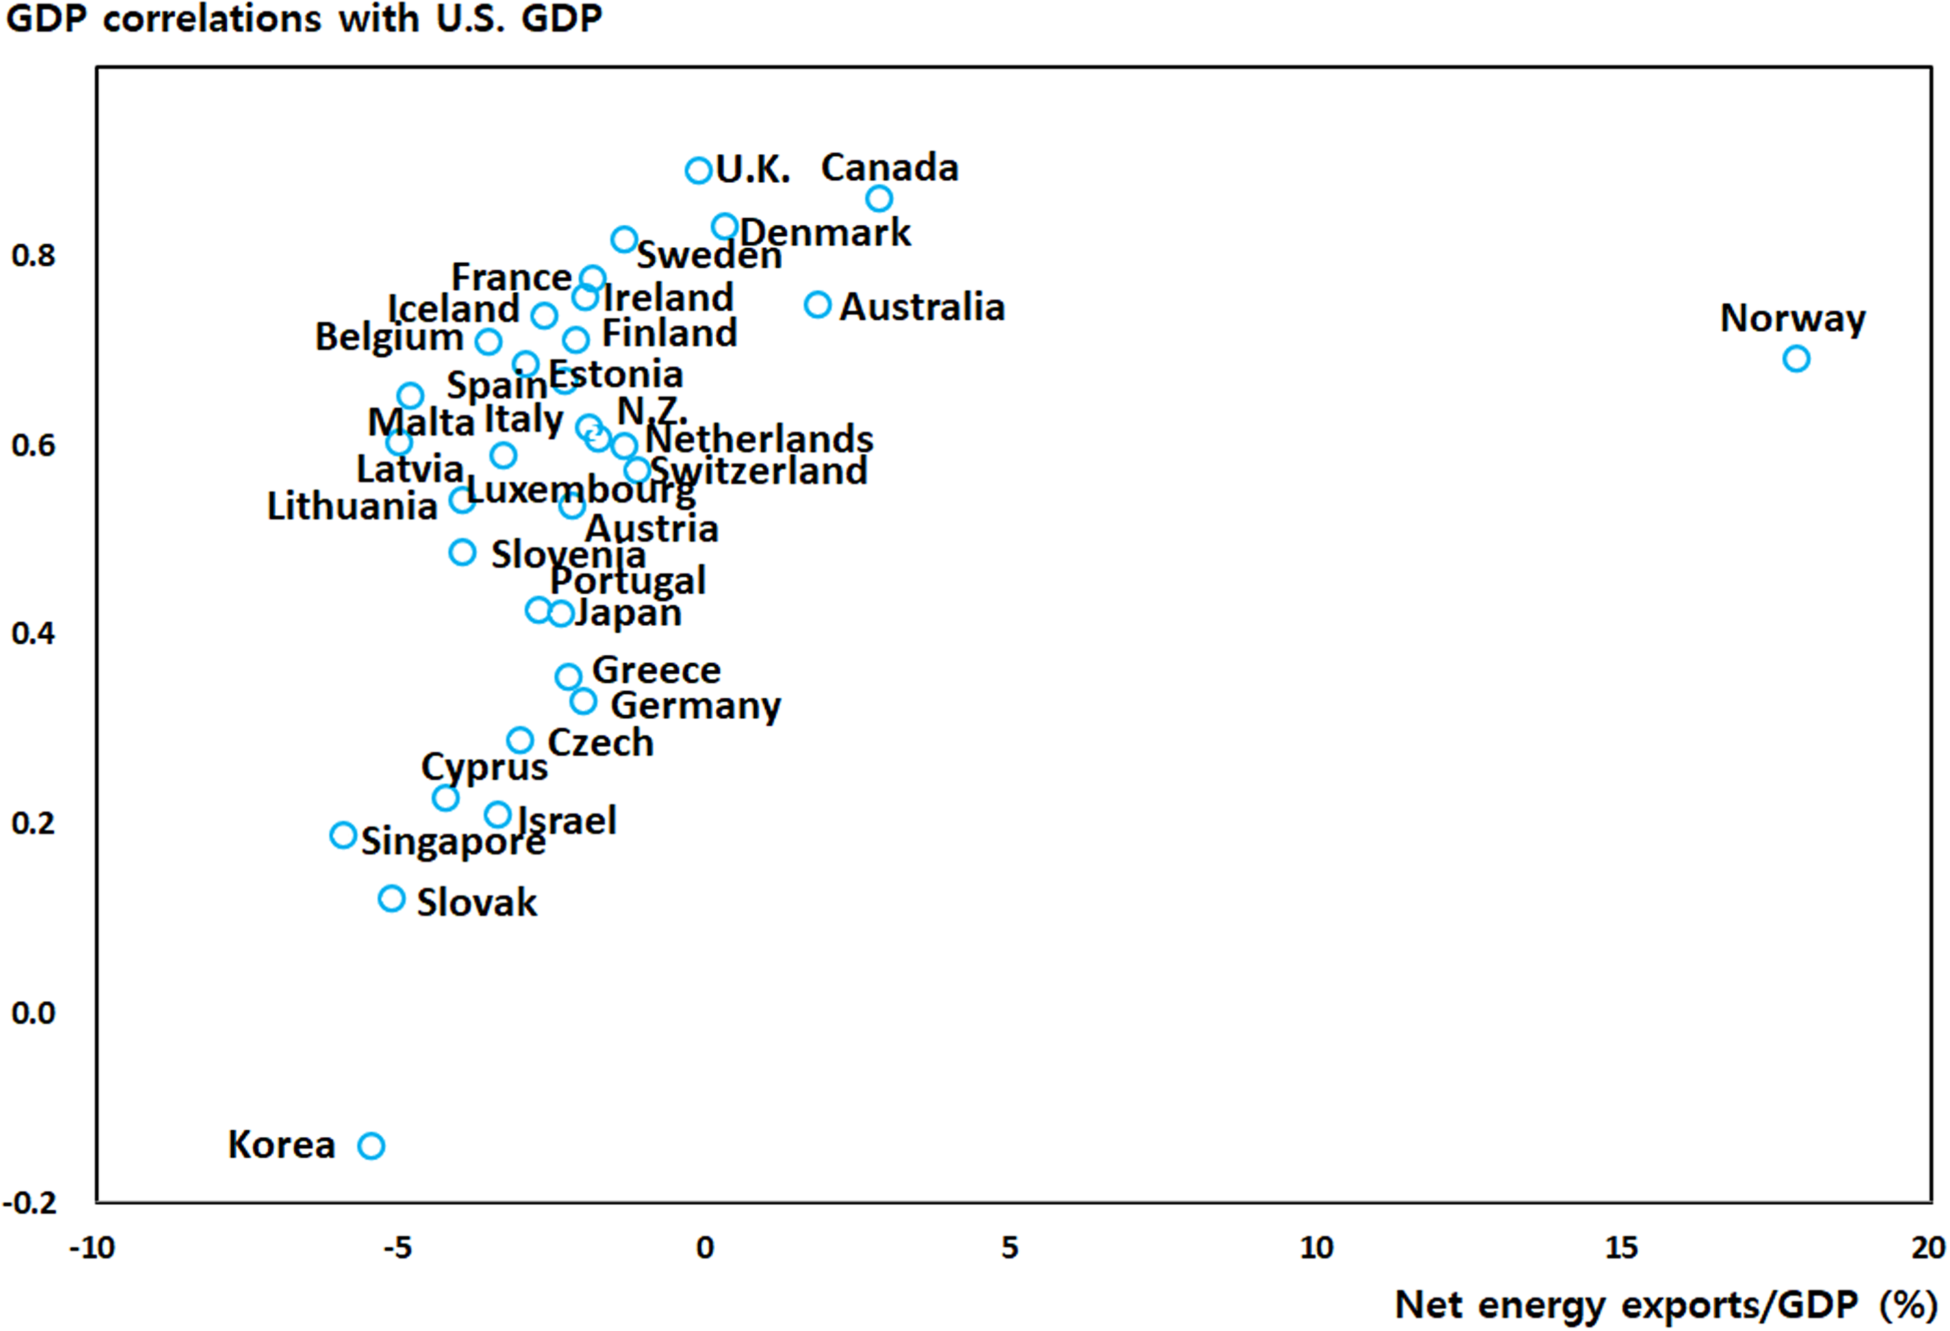
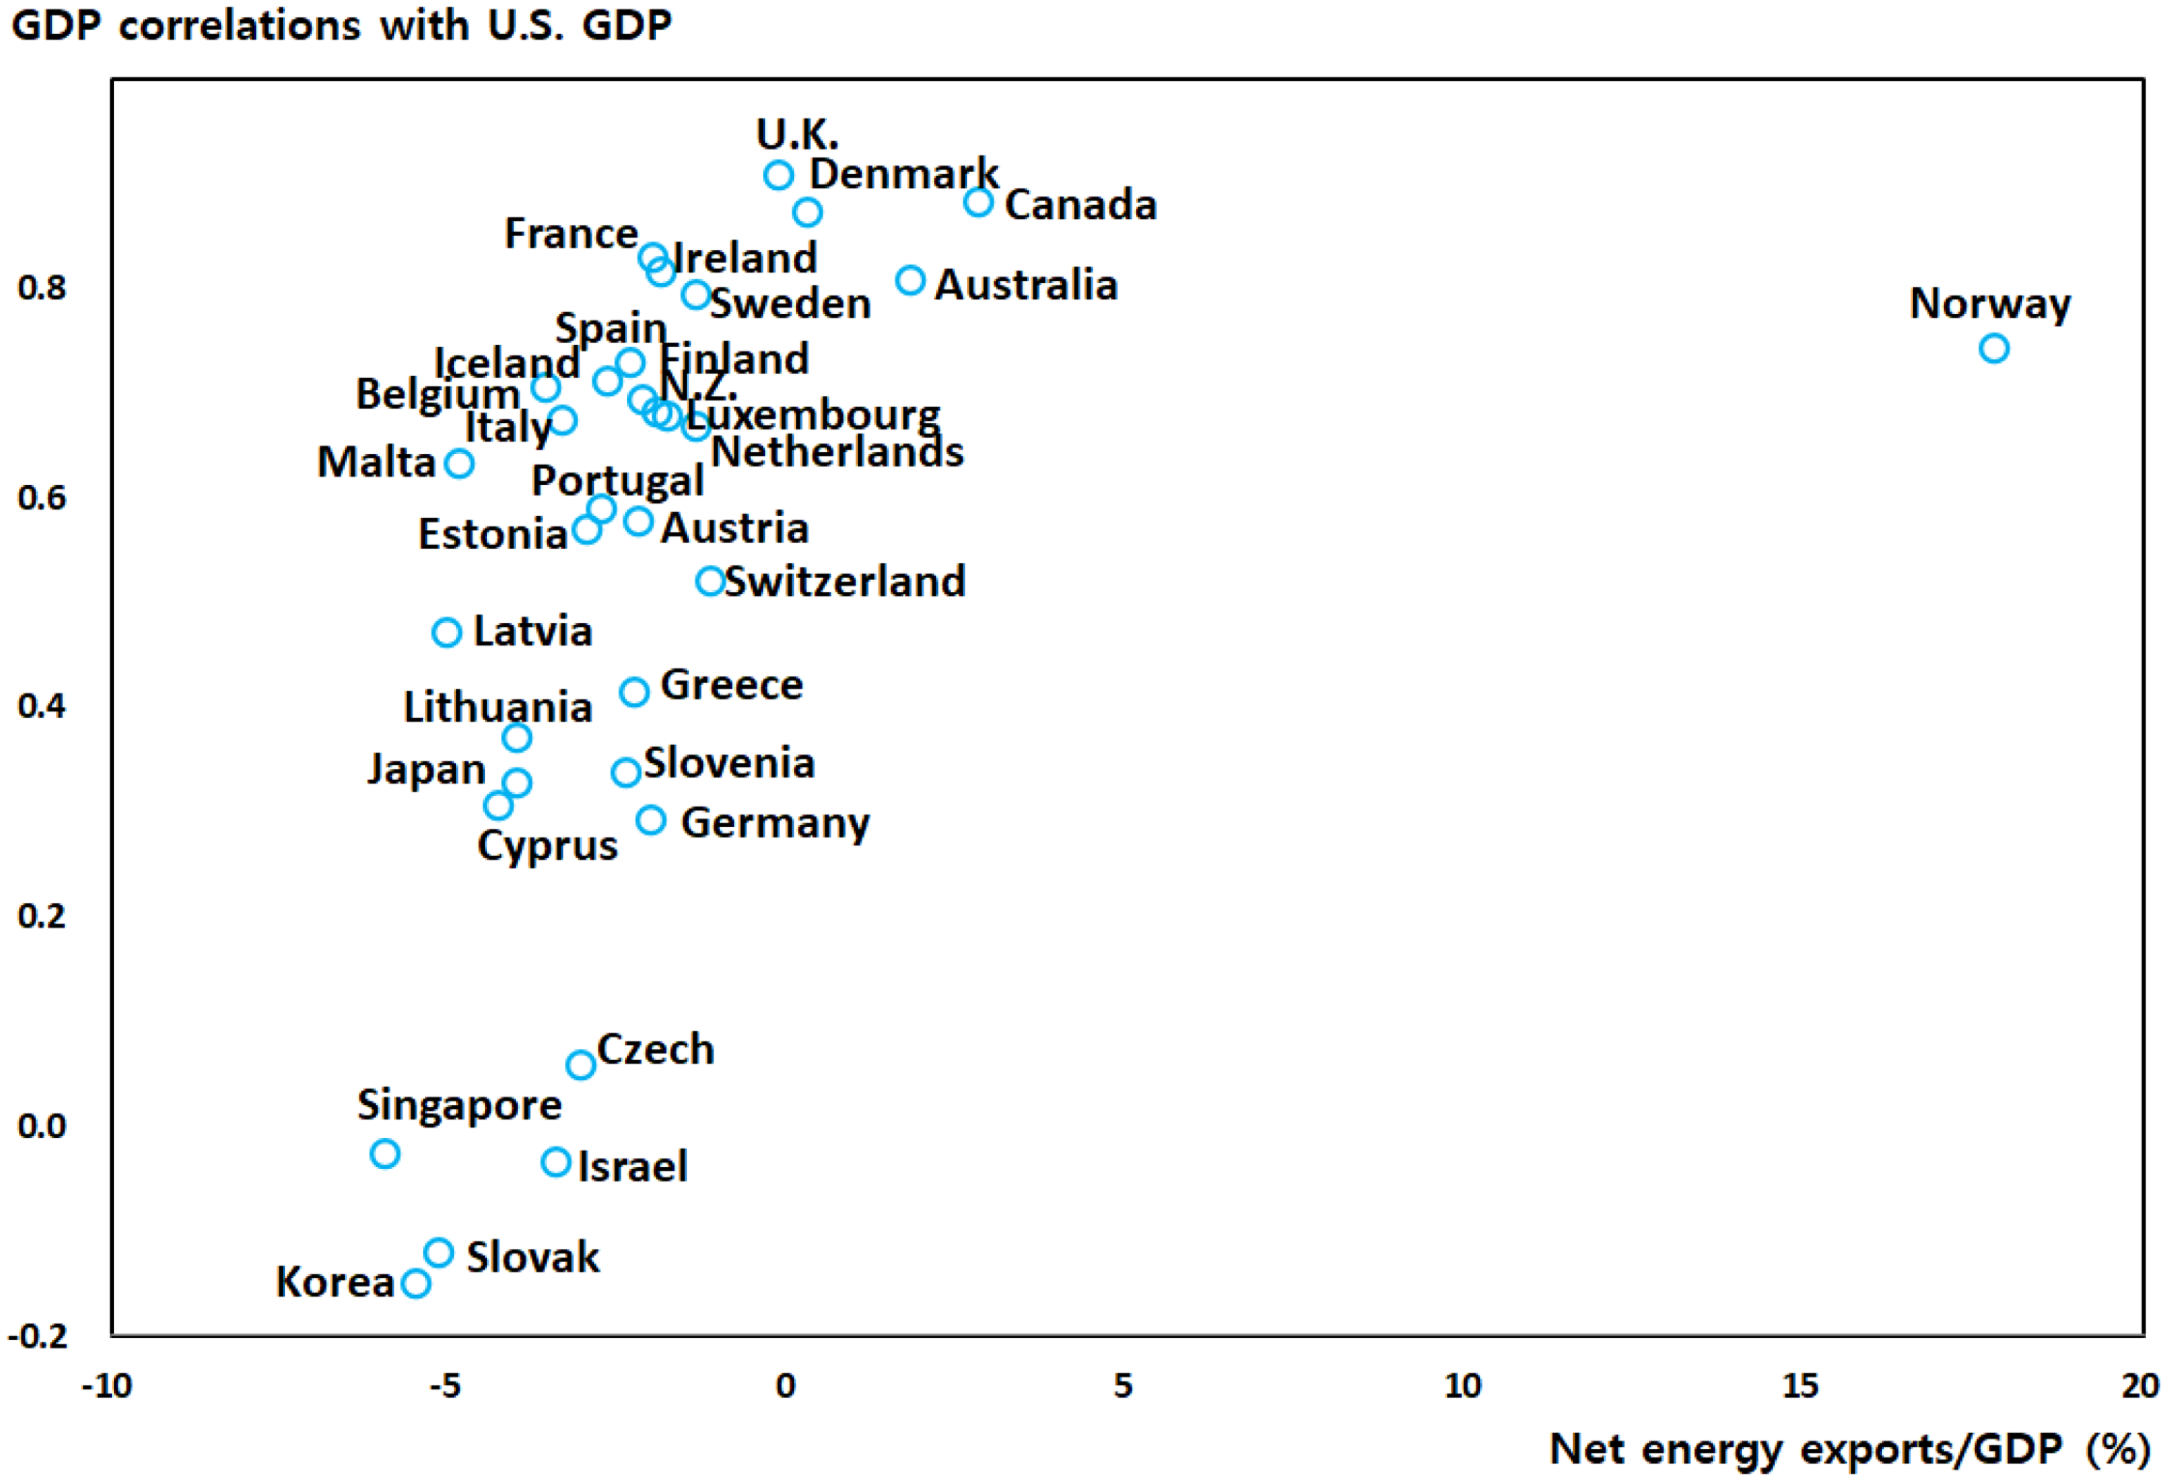
Figure 1 shows the US GDP correlations with major countries according to the ratios of net energy exports to GDP in these countries.Footnote
6
Consistent with our initial expectations, there seems to be a positive relationship between the correlations and the ratios of net energy exports to GDP.Footnote
7
In other words, at first glance, US GDP correlations with energy-exporting countries seem to be greater than those with energy-importing countries.Footnote
8
It should be noted that GDP correlations are calculated using the Hodrick–Prescott (HP) filter with a smoothing parameter (λ) of 100. For robustness, I also present the same figure in Appendix C (Figure 6) using the quadratic filter. Similar to Figure 1, the correlations and the ratios of net energy exports to GDP appear positively related. Therefore, I use the HP filter with $\lambda =100$
throughout the paper.
$\lambda =100$
throughout the paper.
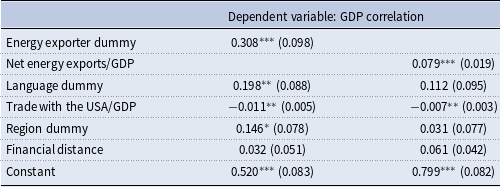
According to certain studies, such as Faia (Reference Faia2007), business cycle differences across countries can be explained by various factors, including trade between countries and language. Therefore, to analyze whether US GDP correlations with energy-exporting countries are higher than those with energy-importing ones, I control for factors other than the ratio of net energy exports to GDP that have influences on the correlations. Specifically, I regress GDP correlations between the USA and other countries on the dummy variable for energy-exporting countries, whose value is “1” if the country is included in energy-exporting countries, and other control variables. Further, I regress the correlations on the ratios of net energy exports to GDP of other countries and other control variables to see whether the correlation with a country increases as the net energy exports ratio of the country rises. As in Faia (Reference Faia2007), the following control variables are used in the regressions: ratios of trade with the USA to GDP, a dummy variable for language whose value is “1” if one of the country’s official languages is English, a dummy variable for region with a value of “1” if the country is in Western Europe or North America that are geographically and culturally close to the USA, and financial distance between the USA and other countries as measured by differences between banks’ return on assets.
The estimation results are presented in Table 1.Footnote 9 The first column shows the estimation results, including the dummy variable for energy exporters as an explanatory variable. The estimated coefficient of the energy exporter dummy is positive and statistically significant, suggesting that energy exporters have higher GDP correlations with the USA than importers do. The estimation results for the regression in which the ratio of net energy exports to GDP is used as an explanatory variable are presented in the second column in Table 1. According to the estimation results, the ratio of net energy exports to GDP has a statistically significant positive effect on US GDP correlations with other countries. The estimation results thus provide evidence that US GDP correlations with a country are high when it is an energy-exporting country and its ratio of net energy exports to GDP is high.
Estimation results
Notes: Values within parentheses are heteroscedasticity robust standard errors. ***, **, and * denote significance at the 1 $\%$
, 5
$\%$
, 5 $\%$
, and 10
$\%$
, and 10 $\%$
level, respectively.
$\%$
level, respectively.
GDP correlations with the USA and ratios of net energy exports to GDP. Notes: Correlations are calculated using detrended annual GDPs during the 1990–2015 period using the HP filter with $\lambda =100$
. The values of net energy exports/GDP are averages for the period of 1990–2015.
$\lambda =100$
. The values of net energy exports/GDP are averages for the period of 1990–2015.
In a nutshell, the estimation results confirm that the US GDP correlations with energy-exporting countries are greater than those with energy-importing countries.
Table 2 shows the GDP correlations between the USA and both energy-exporting and energy-importing countries. The first two columns in the table provide the average of the GDP correlations between the USA and energy exporters and that between the USA and energy importers. The GDP correlations between the USA and the two major energy exporters are presented in the third and fourth columns in Table 2. The last two columns show the GDP correlations between the USA and two major energy importers.
Correlations with US GDP

Notes: Statistics are computed using detrended data with the HP filter with $\lambda =100$
. The sample period is 1990–2015. The figures in the first and second columns are the averages of energy-exporting and energy-importing countries, respectively.
$\lambda =100$
. The sample period is 1990–2015. The figures in the first and second columns are the averages of energy-exporting and energy-importing countries, respectively.
The correlations between US GDP and the GDPs of other major countries are positive and high. Canada has a very large correlation, 0.860. The correlations for Germany (0.328) and Japan (0.420) are relatively small. More importantly, the average correlation between US GDP and the GDPs of energy-exporting countries (0.782) is substantially higher than that between US GDP and those of energy-importing countries (0.516).
In sum, US GDP is more strongly correlated with the GDPs of energy-exporting countries than with those of energy-importing countries. The model in this paper attempts to replicate these properties of US international business cycles with energy exporters and importers and investigate the mechanism of how US GDP is more synchronized with the GDPs of energy exporters than with those of energy importers.
3. The model
In this section, I describe the three-country model with energy in which each country’s unique energy production and trade structure are considered.Footnote
10
Specifically, there are three countries in the world economy: country $A$
(the USA, an energy-importing country), country
$A$
(the USA, an energy-importing country), country $B$
(a representative non-US energy-importing country), and country
$B$
(a representative non-US energy-importing country), and country $C$
(a representative energy-exporting country). Countries
$C$
(a representative energy-exporting country). Countries $A$
and
$A$
and $B$
are symmetric—they have identical energy production and trade structures. They produce nonenergy goods and import energy goods. Country
$B$
are symmetric—they have identical energy production and trade structures. They produce nonenergy goods and import energy goods. Country $C$
produces energy as well as nonenergy goods and exports energy goods. In the model, energy is included in the composite of consumption goods as a complement to nonenergy, and nonenergy producers produce nonenergy goods using energy together with labor and capital. Incomplete asset markets are assumed in this model.
$C$
produces energy as well as nonenergy goods and exports energy goods. In the model, energy is included in the composite of consumption goods as a complement to nonenergy, and nonenergy producers produce nonenergy goods using energy together with labor and capital. Incomplete asset markets are assumed in this model.
Hereafter, I only provide the equations for country $A$
. Unless there is other explanation, equations for the other two countries are symmetric to those for country
$A$
. Unless there is other explanation, equations for the other two countries are symmetric to those for country $A$
. Superscripts
$A$
. Superscripts $B$
and
$B$
and $C$
denote variables in countries
$C$
denote variables in countries $B$
and
$B$
and $C$
, respectively, and the subscripts
$C$
, respectively, and the subscripts $A$
,
$A$
, $B$
, and
$B$
, and $C$
refer to variables produced in countries
$C$
refer to variables produced in countries $A$
,
$A$
, $B$
, and
$B$
, and $C$
, respectively.
$C$
, respectively.
3.1. Households
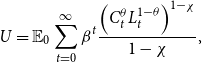
The representative household maximizes the following utility:
 \begin{equation} U=\mathbb{E}_{0}\sum _{t=0}^{\infty }\beta ^{t}\frac{\left (C_{t}^{\theta }L_{t}^{1-\theta }\right )^{1-\chi }}{1-\chi }, \end{equation}
where $1=L_{t}+N_{t}$
.
$1=L_{t}+N_{t}$
. $\mathbb{E}$
is the conditional expectations operator,
$\mathbb{E}$
is the conditional expectations operator, $C_{t}$
is a composite of nonenergy and energy consumption goods,
$C_{t}$
is a composite of nonenergy and energy consumption goods, $L_{t}$
is leisure,
$L_{t}$
is leisure, $N_{t}$
is hours worked,
$N_{t}$
is hours worked, $\beta$
is the discount factor,
$\beta$
is the discount factor, $\theta$
is the consumption share, and
$\theta$
is the consumption share, and $\chi$
is the curvature parameter.
$\chi$
is the curvature parameter.
The budget constraint is as follows:
 \begin{equation} C_{t}+Q_{t}B_{t}+\frac{1}{2}\zeta B_{t}^{2}+D_{t}=B{}_{t-1}+R_{t-1}D_{t-1}+W_{t}N_{t}, \end{equation}
where $B_{t}$
and
$B_{t}$
and $Q_{t}$
are the quantities of the noncontingent international bond and the price of this bond, respectively. The term
$Q_{t}$
are the quantities of the noncontingent international bond and the price of this bond, respectively. The term $\frac{1}{2}\zeta B_{t}^{2}$
is bond holding costs.
$\frac{1}{2}\zeta B_{t}^{2}$
is bond holding costs. $R_{t}$
and
$R_{t}$
and $W_{t}$
are the risk-free real return on deposit
$W_{t}$
are the risk-free real return on deposit $D_{t}$
and the real wage, respectively.
$D_{t}$
and the real wage, respectively.
The composite of consumption goods $C_{t}$
is defined as the following constant elasticity of substitution (CES) aggregator function of nonenergy consumption goods
$C_{t}$
is defined as the following constant elasticity of substitution (CES) aggregator function of nonenergy consumption goods $C_{ne,t}$
and energy consumption goods
$C_{ne,t}$
and energy consumption goods $C_{e,t}$
:Footnote
11
$C_{e,t}$
:Footnote
11
 \begin{equation} C_{t}=\left \{ (1-\gamma _{1})^{\frac{1}{\eta _{1}}}C_{ne,t}^{^{\frac{\eta _{1}-1}{\eta _{1}}}}+\gamma _{1}{}^{\frac{1}{\eta _{1}}}C_{e,t}^{^{\frac{\eta _{1}-1}{\eta _{1}}}}\right \} ^{\frac{\eta _{1}}{\eta _{1}-1}}. \end{equation}
The nonenergy consumption goods $C_{ne,t}$
, in turn, are similarly defined by domestically produced nonenergy consumption goods
$C_{ne,t}$
, in turn, are similarly defined by domestically produced nonenergy consumption goods $C_{A,t}$
, those produced in country
$C_{A,t}$
, those produced in country $B$
$B$ $C_{B,t}$
, and those produced in country
$C_{B,t}$
, and those produced in country $C$
$C$ $C_{C,t}$
. For simplicity, I assume that the weights of
$C_{C,t}$
. For simplicity, I assume that the weights of $C_{B,t}$
and
$C_{B,t}$
and $C_{C,t}$
in
$C_{C,t}$
in $C_{ne,t}$
are equal:
$C_{ne,t}$
are equal:
 \begin{equation} C_{ne,t}=\left \{ (1-\gamma _{2})^{\frac{1}{\eta _{2}}}C_{A,t}^{^{\frac{\eta _{2}-1}{\eta _{2}}}}+\left (\frac{\gamma _{2}}{2}\right )^{\frac{1}{\eta _{2}}}C_{B,t}^{^{\frac{\eta _{2}-1}{\eta _{2}}}}+\left (\frac{\gamma _{2}}{2}\right )^{\frac{1}{\eta _{2}}}C_{C,t}^{^{\frac{\eta _{2}-1}{\eta _{2}}}}\right \} ^{\frac{\eta _{2}}{\eta _{2}-1}}. \end{equation}
3.2. Firms
All three countries produce nonenergy goods with the same production function, but only country $C$
(energy-exporting country) produces energy goods. Energy producers use labor and capital as inputs for their production, while nonenergy producers use energy as well as labor and capital for their production. Firms purchase capital at the end of period
$C$
(energy-exporting country) produces energy goods. Energy producers use labor and capital as inputs for their production, while nonenergy producers use energy as well as labor and capital for their production. Firms purchase capital at the end of period $t-1$
to produce goods in period
$t-1$
to produce goods in period $t$
and sell the nondepreciated capital back to capital producers at the end of period
$t$
and sell the nondepreciated capital back to capital producers at the end of period $t$
.
$t$
.
3.2.1. Nonenergy producers
All countries produce nonenergy using capital, labor, and energy as inputs. The production function of nonenergy is a nested CES, as in Kim and Loungani (Reference Kim and Loungani1992) and Backus and Crucini (Reference Backus and Crucini2000):
 \begin{equation} Y_{ne,t}=A_{ne,t}\{(1-a)K_{ne,t}^{-\nu }+ae_{t}^{-\nu }\}^{-\frac{\alpha }{\nu }}N_{ne,t}^{1-\alpha }, \end{equation}
where $Y_{ne,t}$
,
$Y_{ne,t}$
, $A_{ne,t}$
,
$A_{ne,t}$
, $K_{ne,t}$
,
$K_{ne,t}$
, $e_{t}$
, and
$e_{t}$
, and $N_{ne,t}$
denote output, productivity, capital, energy, and labor for production of nonenergy goods, respectively.
$N_{ne,t}$
denote output, productivity, capital, energy, and labor for production of nonenergy goods, respectively. $1-\alpha$
is the labor share of income,
$1-\alpha$
is the labor share of income, $a$
determines the importance of energy, and
$a$
determines the importance of energy, and $\nu =\frac{1-\varsigma }{\varsigma }$
, where
$\nu =\frac{1-\varsigma }{\varsigma }$
, where $\varsigma$
is the elasticity of substitution between capital and energy.
$\varsigma$
is the elasticity of substitution between capital and energy.
3.2.2. Energy producers
Energy producers use capital and labor as inputs in production, and only country $C$
produces energy. The production function is Cobb–Douglas, as in Arora and Gomis-Porqueras (Reference Arora and Gomis-Porqueras2011) and Huynh (Reference Huynh2016).
$C$
produces energy. The production function is Cobb–Douglas, as in Arora and Gomis-Porqueras (Reference Arora and Gomis-Porqueras2011) and Huynh (Reference Huynh2016).
 \begin{equation} Y_{e,t}^{C}=A_{e,t}^{C}K_{e,t}^{C^{\alpha _{e}}}N_{e,t}^{C^{1-\alpha _{e}}}, \end{equation}
where $Y_{e,t}^{C}$
,
$Y_{e,t}^{C}$
, $A_{e,t}^{C}$
,
$A_{e,t}^{C}$
, $K_{e,t}^{C}$
, and
$K_{e,t}^{C}$
, and $N_{e,t}^{C}$
are output, productivity, capital, and labor for energy production, respectively.
$N_{e,t}^{C}$
are output, productivity, capital, and labor for energy production, respectively. $1-\alpha _{e}$
is the labor share of income.
$1-\alpha _{e}$
is the labor share of income.
3.2.3. Capital producers
Capital producers convert final goods into capital goods. In each period, they buy $I_{s,t}$
of final goods at
$I_{s,t}$
of final goods at $p_{s,t}$
and
$p_{s,t}$
and $(1-\delta )K_{s,t}$
of used capital from firms at price
$(1-\delta )K_{s,t}$
of used capital from firms at price $q_{s,t}$
where
$q_{s,t}$
where $s\in \{ ne,e \}$
.Footnote
12
Then, they produce
$s\in \{ ne,e \}$
.Footnote
12
Then, they produce $K_{s,t+1}$
of new capital goods. Thus, the capital producer’s problem is given by the following:
$K_{s,t+1}$
of new capital goods. Thus, the capital producer’s problem is given by the following:
 \begin{equation*} \max _{K_{s,t+1}}q_{s,t}K_{s,t+1}-(1-\delta )q_{s,t}K_{s,t}-p_{s,t}I_{s,t}, \end{equation*}
subject to the law of motion for capital:
 \begin{equation} K_{s,t+1}=(1-\delta )K_{s,t}+\phi \left (\frac{I_{s,t}}{K_{s,t}}\right )K_{s,t}, \end{equation}
where $\phi (\cdot )$
denotes the adjustment cost function with
$\phi (\cdot )$
denotes the adjustment cost function with $\phi \gt 0$
,
$\phi \gt 0$
, $\phi '\gt 0$
, and
$\phi '\gt 0$
, and $\phi ''\lt 0$
, and
$\phi ''\lt 0$
, and $\delta$
is the depreciation rate.
$\delta$
is the depreciation rate.
3.3. Market clearing
Output in the nonenergy sector in each country must equal the world demand for nonenergy produced in it plus its investment:
 \begin{equation} Y_{ne,t}=C_{A,t}+C_{A,t}^{B}+C_{A,t}^{C}+I_{ne,t}. \end{equation}
Output in the energy sector in country $C$
should be equal to the world demand for energy for consumption and production plus its investment:
$C$
should be equal to the world demand for energy for consumption and production plus its investment:
 \begin{equation} Y_{e,t}^{C}=C_{e,t}+C_{e,t}^{B}+C_{e,t}^{C}+e_{t}+e_{t}^{B}+e_{t}^{C}+I_{e,t}^{C}. \end{equation}
Finally, bond markets must clear:
 \begin{equation} B_{t}+B_{t}^{B}+B_{t}^{C}=0. \end{equation}
4. Model analysis
In this section, I first provide model calibration. Then I present the international business cycle statistics that the model produces and explain how the model yields a higher output correlation between the USA and the energy exporter than that between the USA and the energy importer. Finally, I conduct a sensitivity analysis of the model’s results, in which different assumptions for asset markets and the values of some important parameters are considered.
4.1. Calibration
One period in the model is equal to one year. I assume symmetry across the three countries following standard literature, except for the energy production and trade structures.
To assign parameter values, I use the simulated method of moments (SMM) approach proposed by Ruge-Murcia (Reference Ruge-Murcia2012). Specifically, this approach minimizes the weighted distance between the moments from the model and data. For the detailed method, please see Ruge-Murcia (Reference Ruge-Murcia2012).
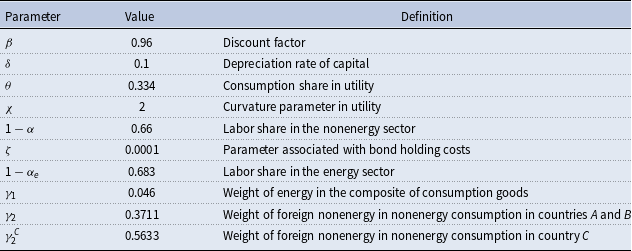
I first list the parameter values fixed prior to estimation in Table 3. Specifically, the discount factor $\beta$
is 0.96, and the depreciation rate of capital
$\beta$
is 0.96, and the depreciation rate of capital $\delta$
is 0.1, following Stockman and Tesar (Reference Stockman and Tesar1995) and Corsetti et al. (Reference Corsetti, Dedola and Leduc2008). The consumption share
$\delta$
is 0.1, following Stockman and Tesar (Reference Stockman and Tesar1995) and Corsetti et al. (Reference Corsetti, Dedola and Leduc2008). The consumption share $\theta$
and the curvature parameter
$\theta$
and the curvature parameter $\chi$
in utility are assumed to be 0.334 and 2, respectively. I set the labor share of income in the nonenergy sector (
$\chi$
in utility are assumed to be 0.334 and 2, respectively. I set the labor share of income in the nonenergy sector ( $1-\alpha$
) at 0.66. The parameter associated with bond holding costs
$1-\alpha$
) at 0.66. The parameter associated with bond holding costs $\zeta$
is set to be very small, as in the standard literature. Based on the assumption that real wages in each sector are identical in the model, the labor share of income in the energy sector,
$\zeta$
is set to be very small, as in the standard literature. Based on the assumption that real wages in each sector are identical in the model, the labor share of income in the energy sector, $1-\alpha _{e}$
, is set to 0.683. I assume that the steady-state capital/energy ratio in nonenergy production,
$1-\alpha _{e}$
, is set to 0.683. I assume that the steady-state capital/energy ratio in nonenergy production, $K_{ne}/e$
, is 63, and the weight of energy consumption goods in the composite of consumption goods,
$K_{ne}/e$
, is 63, and the weight of energy consumption goods in the composite of consumption goods, $\gamma _{1}$
, is 0.046.Footnote
13
The weight of imported nonenergy consumption goods in nonenergy consumption in countries
$\gamma _{1}$
, is 0.046.Footnote
13
The weight of imported nonenergy consumption goods in nonenergy consumption in countries $A$
and
$A$
and $B$
,
$B$
, $\gamma _{2}$
, is 0.3711.Footnote
14
The weight of imported nonenergy consumption goods in nonenergy consumption in country
$\gamma _{2}$
, is 0.3711.Footnote
14
The weight of imported nonenergy consumption goods in nonenergy consumption in country $C$
,
$C$
, $\gamma _{2}^{C}$
, is 0.5633, which is due to the assumption that the steady-state values of aggregate consumption in all countries are equal. Under these parameter values, the ratio of net energy imports to GDP in the steady-state (
$\gamma _{2}^{C}$
, is 0.5633, which is due to the assumption that the steady-state values of aggregate consumption in all countries are equal. Under these parameter values, the ratio of net energy imports to GDP in the steady-state ( $P_{e}(C_{e}+e)/PY$
) is 7%.Footnote
15
The steady-state ratio of energy consumption to GDP (
$P_{e}(C_{e}+e)/PY$
) is 7%.Footnote
15
The steady-state ratio of energy consumption to GDP ( $P_{e}C_{e}/PY$
) is 3.6%, and the steady-state ratio of energy inputs to GDP (
$P_{e}C_{e}/PY$
) is 3.6%, and the steady-state ratio of energy inputs to GDP ( $P_{e}e/PY$
) is 3.5%. These steady-state ratios are consistent with the data. Specifically, from the US Energy Information Administration (EIA), the average ratio of end-use energy expenditure to GDP during the 1997–2015 period is approximately 8%.Footnote
16
During the same period, the average ratio of energy output to GDP in the USA is approximately 1%, based on National Income and Product Accounts (NIPA) data. This implies that the average ratio of net energy imports to GDP for 1997–2015 is approximately 7%. Since based on EIA data the average ratio of energy consumption to the end-use energy expenditure for 1997–2015 is approximately 51%, the average ratio of energy consumption to GDP is approximately 3.5%, which means that the average ratio of energy inputs to GDP is approximately 3.5%.Footnote
17
$P_{e}e/PY$
) is 3.5%. These steady-state ratios are consistent with the data. Specifically, from the US Energy Information Administration (EIA), the average ratio of end-use energy expenditure to GDP during the 1997–2015 period is approximately 8%.Footnote
16
During the same period, the average ratio of energy output to GDP in the USA is approximately 1%, based on National Income and Product Accounts (NIPA) data. This implies that the average ratio of net energy imports to GDP for 1997–2015 is approximately 7%. Since based on EIA data the average ratio of energy consumption to the end-use energy expenditure for 1997–2015 is approximately 51%, the average ratio of energy consumption to GDP is approximately 3.5%, which means that the average ratio of energy inputs to GDP is approximately 3.5%.Footnote
17
Parameter values fixed prior to estimation
I assume that the productivities of the nonenergy sectors for the three countries follow a standard VAR(1), as follows:
 \begin{equation*} \mathbb {A}_{t}=\Gamma \mathbb {A}_{t-1}^{T}+\varepsilon _{t}, \end{equation*}
where $\mathbb{A}_{t}= [\ln A_{ne,t},\ln A_{ne,t}^{B},\ln A_{ne,t}^{C} ]^{T}$
,
$\mathbb{A}_{t}= [\ln A_{ne,t},\ln A_{ne,t}^{B},\ln A_{ne,t}^{C} ]^{T}$
, $\Gamma = \left(\begin{array}{c@{\quad}c@{\quad}c} \rho & \rho _{a} & \rho _{a}\\ \rho _{a} & \rho & \rho _{a}\\ \rho _{a} & \rho _{a} & \rho \end{array} \right)$
, and
$\Gamma = \left(\begin{array}{c@{\quad}c@{\quad}c} \rho & \rho _{a} & \rho _{a}\\ \rho _{a} & \rho & \rho _{a}\\ \rho _{a} & \rho _{a} & \rho \end{array} \right)$
, and $\varepsilon _{t}= [\epsilon _{t},\epsilon _{t}^{B},\epsilon _{t}^{C} ]^{T}$
are the innovations to
$\varepsilon _{t}= [\epsilon _{t},\epsilon _{t}^{B},\epsilon _{t}^{C} ]^{T}$
are the innovations to $\mathbb{A}_{t}$
. I further assume that productivity in the energy sector in country
$\mathbb{A}_{t}$
. I further assume that productivity in the energy sector in country $C$
is constant for simplicity. Nonetheless, I also simulate the model with productivity shocks in the energy sector in country
$C$
is constant for simplicity. Nonetheless, I also simulate the model with productivity shocks in the energy sector in country $C$
later in this section.
$C$
later in this section.
The rest of the parameter values are estimated using SMM. For the empirical moments, GDP, consumption, investment, hours worked, and net exports of the USA for 1990–2015, and the GDPs of Austria and Australia for 1990–2015 are used. The GDPs of Austria and Australia are used as the GDPs of countries $B$
and
$B$
and $C$
, respectively, because US GDP correlation with Austria is most similar to the average of US GDP correlations with energy importers and that with Australia is closest to the average of US GDP correlations with exporters. The standard deviations of these seven variables and the covariance of US GDP with the other six variables are matched.
$C$
, respectively, because US GDP correlation with Austria is most similar to the average of US GDP correlations with energy importers and that with Australia is closest to the average of US GDP correlations with exporters. The standard deviations of these seven variables and the covariance of US GDP with the other six variables are matched.
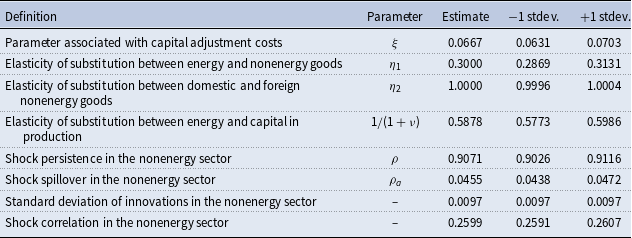
The estimation results are presented in Table 4.Footnote
18
All parameter values are precisely estimated as seen in the table.Footnote
19
The parameter associated with capital adjustment costs $\xi$
is estimated as 0.0667. The estimate for the elasticity of substitution between energy and nonenergy in consumption
$\xi$
is estimated as 0.0667. The estimate for the elasticity of substitution between energy and nonenergy in consumption $\eta _{1}$
is 0.3, which is equal to that used in Natal (Reference Natal2012), and that for the elasticity of substitution between domestic and foreign nonenergy in nonenergy consumption
$\eta _{1}$
is 0.3, which is equal to that used in Natal (Reference Natal2012), and that for the elasticity of substitution between domestic and foreign nonenergy in nonenergy consumption $\eta _{2}$
is 1, which is within the range of standard values in the literature. The estimate for the elasticity of substitution between capital and energy in nonenergy production
$\eta _{2}$
is 1, which is within the range of standard values in the literature. The estimate for the elasticity of substitution between capital and energy in nonenergy production $1/(1+\nu )$
is 0.5878, which is similar to that in Kim and Loungani (Reference Kim and Loungani1992).Footnote
20
The estimates for shock persistence (
$1/(1+\nu )$
is 0.5878, which is similar to that in Kim and Loungani (Reference Kim and Loungani1992).Footnote
20
The estimates for shock persistence ( $\rho$
), shock spillover (
$\rho$
), shock spillover ( $\rho _{a}$
), standard deviation of innovations, and shock correlation in the nonenergy sector are 0.9071, 0.0455, 0.0097, and 0.2599, respectively, which are similar to those used in Backus et al. (Reference Backus, Kehoe and Kydland1992).
$\rho _{a}$
), standard deviation of innovations, and shock correlation in the nonenergy sector are 0.9071, 0.0455, 0.0097, and 0.2599, respectively, which are similar to those used in Backus et al. (Reference Backus, Kehoe and Kydland1992).
Parameter values estimated by SMM
Finally, it should be noted that the elasticity of substitution between energy and nonenergy in consumption ( $\eta _{1}$
), that between domestic and foreign nonenergy in nonenergy consumption (
$\eta _{1}$
), that between domestic and foreign nonenergy in nonenergy consumption ( $\eta _{2}$
), that between capital and energy in nonenergy production (
$\eta _{2}$
), that between capital and energy in nonenergy production ( $1/(1+\nu )$
), the weight of energy in consumption (
$1/(1+\nu )$
), the weight of energy in consumption ( $\gamma _{1}$
), weight of imported nonenergy in nonenergy consumption (
$\gamma _{1}$
), weight of imported nonenergy in nonenergy consumption ( $\gamma _{2}$
), shock spillover (
$\gamma _{2}$
), shock spillover ( $\rho _{a}$
), and shock persistence (
$\rho _{a}$
), and shock persistence ( $\rho$
) are important to generating the main results of this study. Therefore, I evaluate the model with different values for these parameters later in the paper.
$\rho$
) are important to generating the main results of this study. Therefore, I evaluate the model with different values for these parameters later in the paper.
4.2. International business cycles
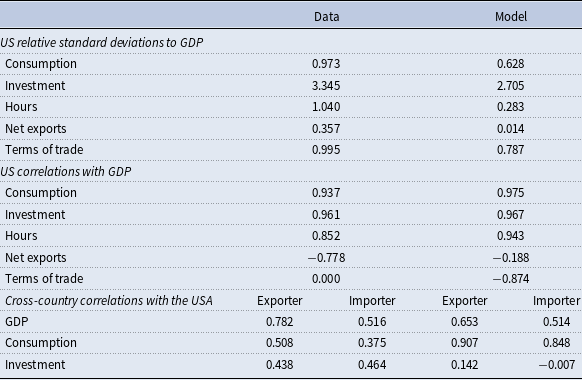
Table 5 shows the business cycle statistics from the data (first column) and model (second column). The first five rows present the relative standard deviations of consumption, investment, hours worked, net exports, and the terms of trade to output in country $A$
(the USA). The correlations of these five variables with output in country
$A$
(the USA). The correlations of these five variables with output in country $A$
are listed in the sixth to tenth rows. The cross-country correlations of output, consumption, and investment between the USA and the energy-exporting country (country
$A$
are listed in the sixth to tenth rows. The cross-country correlations of output, consumption, and investment between the USA and the energy-exporting country (country $C$
) and those between the USA and the energy-importing country (country
$C$
) and those between the USA and the energy-importing country (country $B$
) are shown in the eleventh to thirteenth rows in Table 5. As the central aim of this paper is to show that the model generates a higher output correlation between the USA and the energy-exporting country than that between the USA and the energy-importing country, I focus on the cross-country output correlations.
$B$
) are shown in the eleventh to thirteenth rows in Table 5. As the central aim of this paper is to show that the model generates a higher output correlation between the USA and the energy-exporting country than that between the USA and the energy-importing country, I focus on the cross-country output correlations.
Simulation results
Notes: The cross-country correlations between the USA and exporters (importers) from the data are the average correlations between the same variables in the USA and energy-exporting countries (energy-importing countries). Net exports are defined as exports minus imports over GDP. The sample period is 1990–2015. The statistics are based on the HP filtered data with $\lambda =100$
. The statistics in the model column are the averages over 10,000 simulations of 26 periods each.
$\lambda =100$
. The statistics in the model column are the averages over 10,000 simulations of 26 periods each.
The model is successful in replicating the properties of US international business cycles with energy-exporting and energy-importing countries explained in Section 2. Consistent with the data, the US output correlation with the energy exporter is higher than that with the energy importer. Specifically, the output correlation between the USA and the energy exporter in the model is 0.653, which is higher than that between the USA and the energy importer (0.514). Furthermore, the output correlations are quite close to those in the data (0.782 between the USA and the exporter and 0.516 between the USA and the importer).
As for other business cycle statistics, the model displays some discrepancies with the data. Consumption, investment, hours, net exports, and terms of trade are less volatile, net exports are less negatively correlated with GDP, and the correlation between the terms of trade and GDP is more negative than in the data. Although the consumption correlation between the USA and the exporter is higher than that between the USA and the importer, as in the data, the two correlations are so high that they cannot be lower than the output correlations. Cross-country investment correlations are also too small compared to the data. It should be noted that these discrepancies are common in international business cycle models, such as Backus et al. (Reference Backus, Kehoe and Kydland1994), Stockman and Tesar (Reference Stockman and Tesar1995), Heathcote and Perri (Reference Heathcote and Perri2002) and Corsetti et al. (Reference Corsetti, Dedola and Leduc2008).
4.3. Features of the model generating the output correlation outcomes
In this section, I explain how the model generates a higher output correlation between the USA (country $A$
) and the energy exporter (country
$A$
) and the energy exporter (country $C$
) than between the USA and the energy importer (country
$C$
) than between the USA and the energy importer (country $B$
), using the responses of the model to a 1% positive shock in the US nonenergy sector. The higher output correlation between countries
$B$
), using the responses of the model to a 1% positive shock in the US nonenergy sector. The higher output correlation between countries $A$
and
$A$
and $C$
is primarily due to the changes in energy prices and trade in response to the shock.
$C$
is primarily due to the changes in energy prices and trade in response to the shock.
The responses of the aggregate output and real energy prices to the shock are shown in Figure 2. The shock increases US aggregate output as usual. Since the USA is a net energy-importing country, the increased output increases its demand for energy imports from the energy exporter; hence, the real energy prices increase. The shock also increases aggregate outputs in the importer and exporter. However, the increase in aggregate output in the exporter is larger than that in the importer, which enables the output correlation between the USA and the exporter to be greater.
Responses of aggregate output and the real energy price.
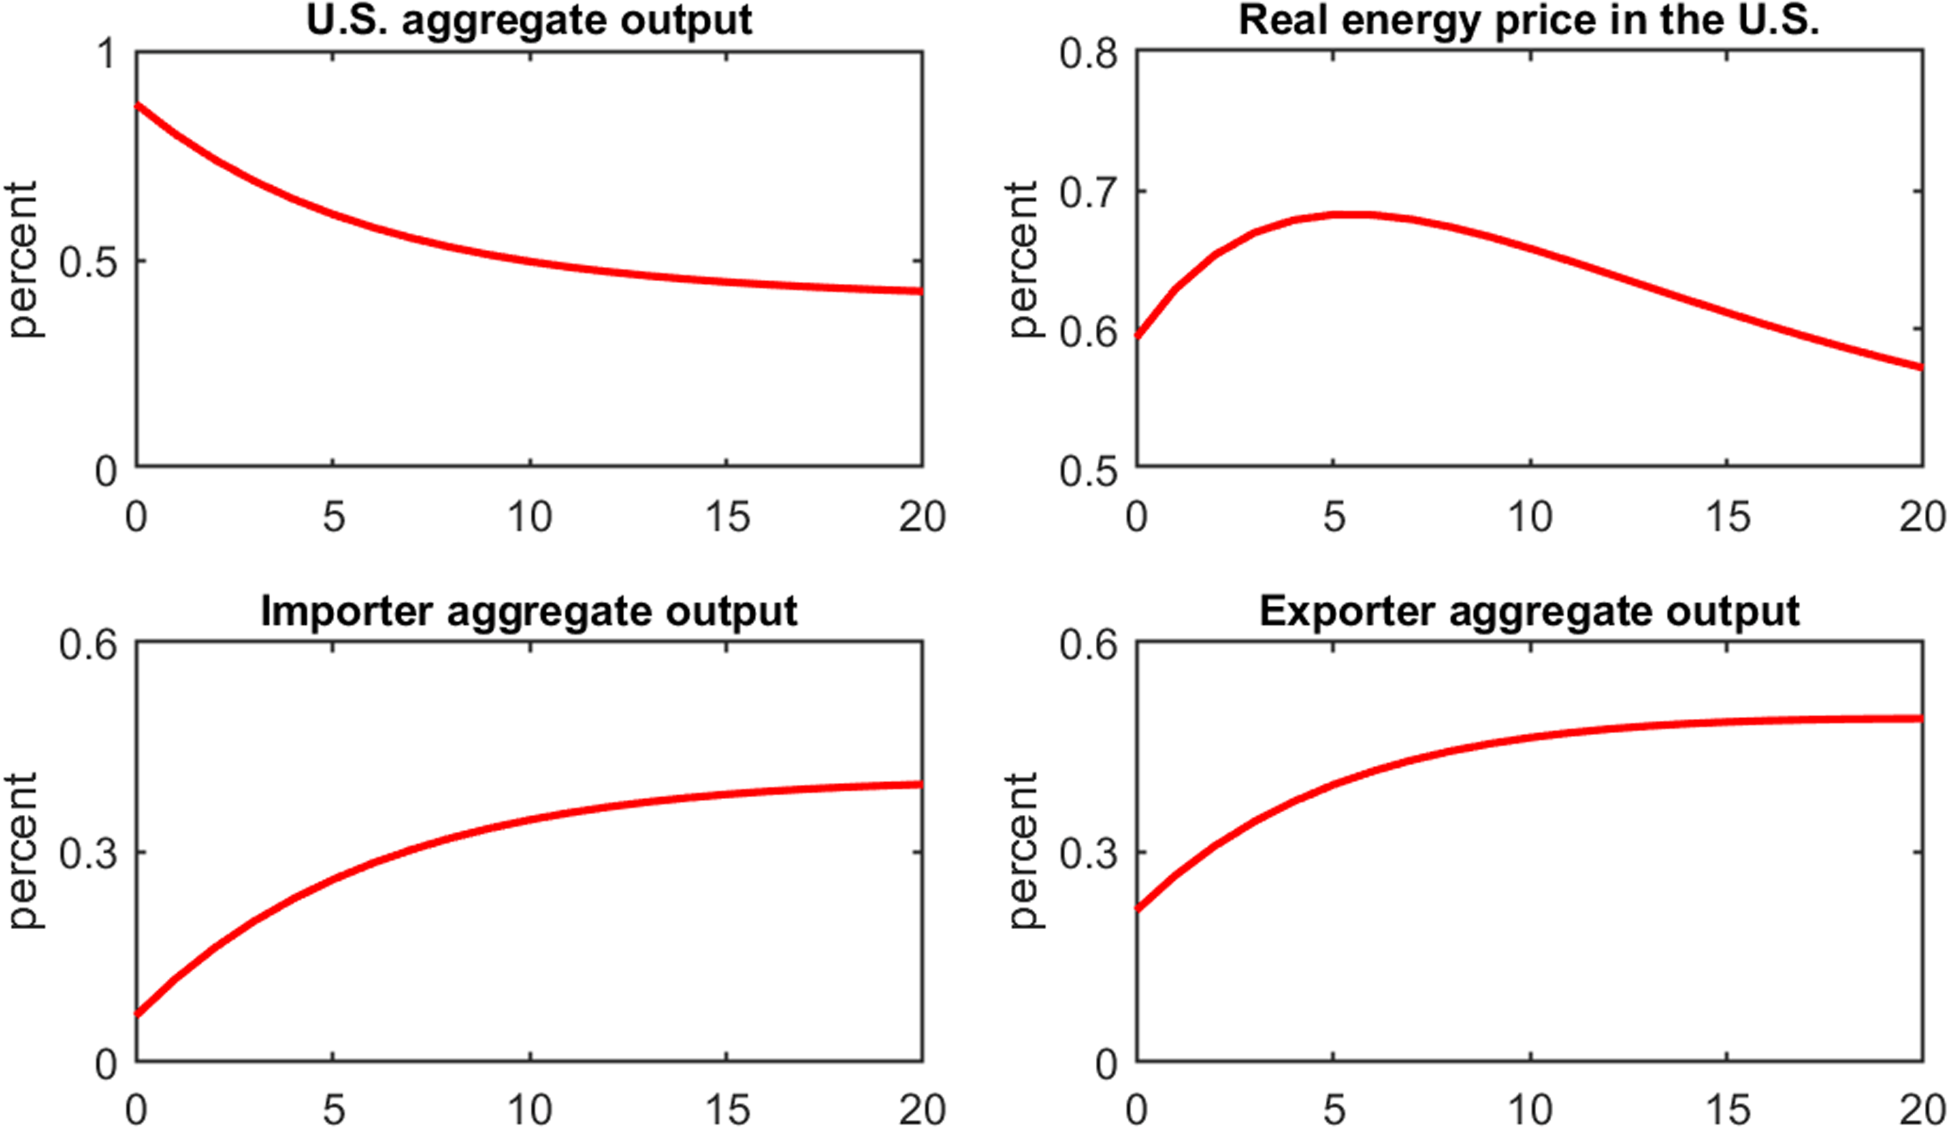
Figure 3 shows the responses of several non-US variables to the shock, which are important in explaining the higher increase in the exporter’s aggregate output. The dashed lines denote the responses of the importer, and the solid lines refer to those of the exporter. Since the increased energy prices in response to the shock raise the energy importer’s import prices, the terms of trade (export prices divided by import prices) in the importer increase (improve) by less than that in the exporter. Thus, the market value of the importer’s output increases by less, and therefore its income increases by less compared to the exporter. Accordingly, aggregate consumption in the importer rises by less than that in the exporter. Furthermore, the increased US demand for energy imports leads to an increase in energy exports in the exporter; hence, the exporter’s energy output increases. In short, the increased energy prices in response to the shock adversely affect aggregate output in the importer, whereas the increased US demand for energy imports has a positive influence on aggregate output in the exporters. Consequently, the shock leads to a greater increase in aggregate output in the exporter than in the importer.
Responses of non-US variables. Note: Since the energy importer does not hold the energy sector, the responses of energy exports and energy output in the importer are not presented.
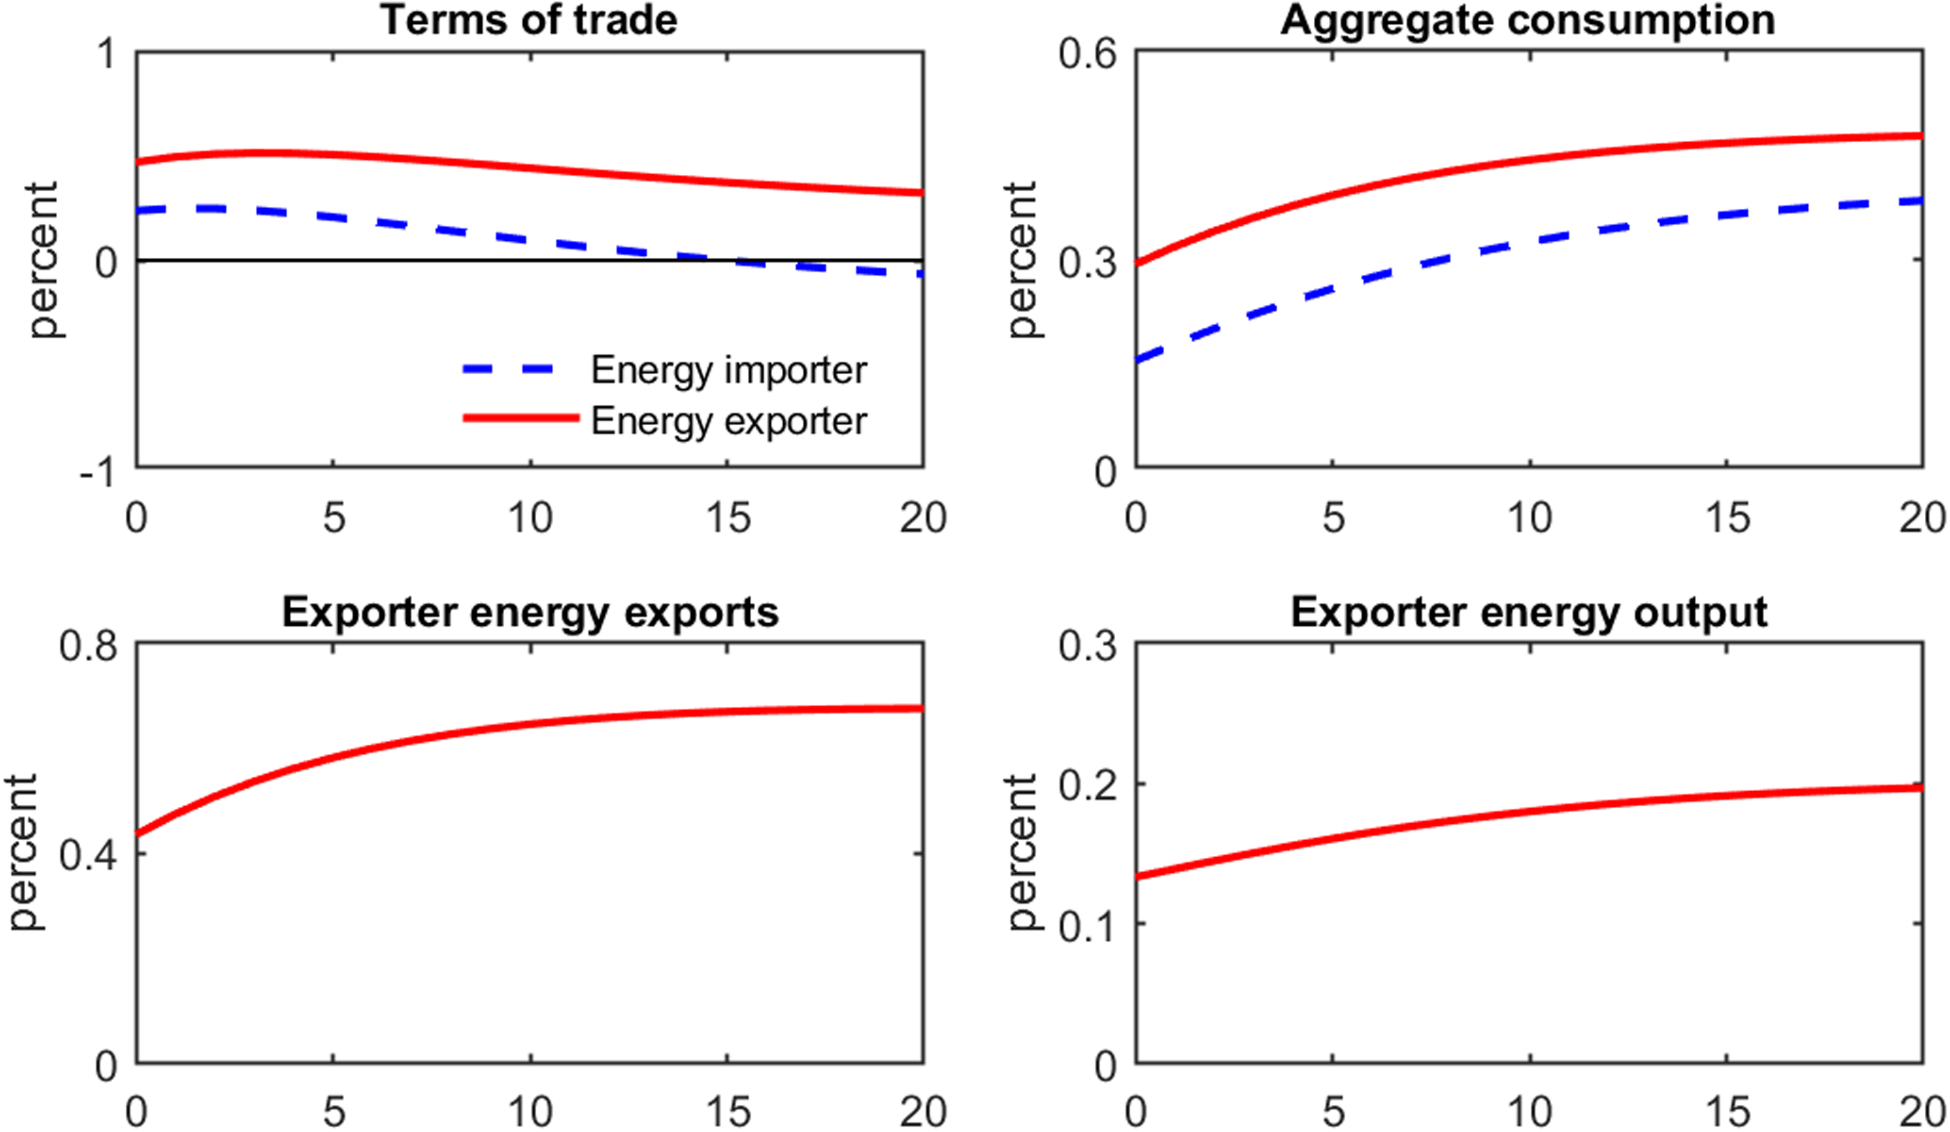
In summary, a positive productivity shock in the USA raises its demand for energy, leading to increases in output in the energy sector for the energy exporter and energy prices. Accordingly, in response to the shock, aggregate output in the exporter, which produces and exports energy, increases by more than that in the importer, which does not produce energy but imports it. This enables the output correlation between the USA and the exporter to be greater than that between the USA and the importer.
4.4. Sensitivity analysis
In this section, I evaluate the model with different assumptions from the baseline case. Specifically, I alter the asset market structure, the parameter values (elasticity of substitution between energy and nonenergy in consumption, that between domestic and foreign nonenergy in consumption, that between capital and energy in production, and the weights of energy and imported nonenergy in consumption), and productivities in the energy and nonenergy sectors.
If we assume complete asset markets instead of incomplete asset markets as in the baseline case, we need to alter the budget constraint as follows:
 \begin{equation*} C_{t}+\sum _{s_{t+1}}Q(s_{t+1}\mid s_{t})B_{t+1}(s_{t+1})+D_{t}=B_{t}(s_{t})+R_{t-1}D_{t-1}+W_{t}N_{t}, \end{equation*}
where $B_{t+1}(s_{t+1})$
denotes the holdings of state-contingent securities at the end of period
$B_{t+1}(s_{t+1})$
denotes the holdings of state-contingent securities at the end of period $t$
, which gives a unitary return in period
$t$
, which gives a unitary return in period $t+1$
if and only if the state of the economy is
$t+1$
if and only if the state of the economy is $s_{t+1}$
.
$s_{t+1}$
. $Q(s_{t+1}\mid s_{t})$
is the price of the securities. The first row in Table 6 shows the results of the model with complete asset markets. The output correlation between the USA and the energy exporter is 0.721, which is greater than that between the USA and the energy importer (0.615). Therefore, even if we assume complete asset markets, the model generates a higher correlation of US output with the exporter’s output.
$Q(s_{t+1}\mid s_{t})$
is the price of the securities. The first row in Table 6 shows the results of the model with complete asset markets. The output correlation between the USA and the energy exporter is 0.721, which is greater than that between the USA and the energy importer (0.615). Therefore, even if we assume complete asset markets, the model generates a higher correlation of US output with the exporter’s output.
Results under different assumptions
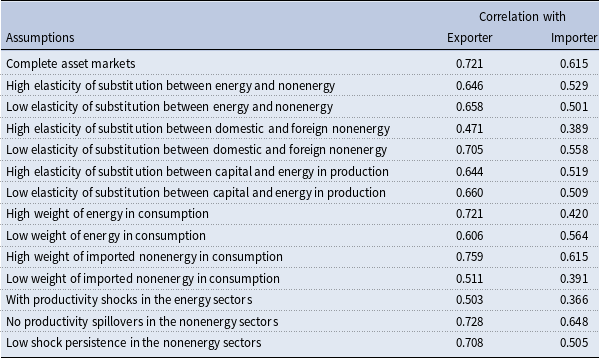
Notes: High elasticity of substitution between energy and nonenergy: $\eta _{1}=0.6$
; low elasticity of substitution between energy and nonenergy:
$\eta _{1}=0.6$
; low elasticity of substitution between energy and nonenergy: $\eta _{1}=0.1$
; high elasticity of substitution between domestic and foreign nonenergy:
$\eta _{1}=0.1$
; high elasticity of substitution between domestic and foreign nonenergy: $\eta _{2}=1.5$
; low elasticity of substitution between domestic and foreign nonenergy:
$\eta _{2}=1.5$
; low elasticity of substitution between domestic and foreign nonenergy: $\eta _{2}=0.9$
; high elasticity of substitution between capital and energy in production:
$\eta _{2}=0.9$
; high elasticity of substitution between capital and energy in production: $\nu =0.01$
; low elasticity of substitution between capital and energy in production:
$\nu =0.01$
; low elasticity of substitution between capital and energy in production: $\nu =2$
; high weight of energy in consumption:
$\nu =2$
; high weight of energy in consumption: $\gamma _{1}=0.1$
; low weight of energy in consumption:
$\gamma _{1}=0.1$
; low weight of energy in consumption: $\gamma _{1}=0.01$
; high weight of imported nonenergy in consumption:
$\gamma _{1}=0.01$
; high weight of imported nonenergy in consumption: $\gamma _{2}=0.5$
; low weight of imported nonenergy in consumption:
$\gamma _{2}=0.5$
; low weight of imported nonenergy in consumption: $\gamma _{2}=0.2$
; no productivity spillovers:
$\gamma _{2}=0.2$
; no productivity spillovers: $\rho _{a}=0$
; low shock persistence:
$\rho _{a}=0$
; low shock persistence: $\rho =0.5$
. The statistics are based on the HP filtered results with
$\rho =0.5$
. The statistics are based on the HP filtered results with $\lambda =100$
and the averages over 10,000 simulations of 26 periods each.
$\lambda =100$
and the averages over 10,000 simulations of 26 periods each.
The second and third rows in Table 6 consider different values of elasticity of substitution between energy and nonenergy in consumption $\eta _{1}$
. I set
$\eta _{1}$
. I set $\eta _{1}=0.6$
for the high
$\eta _{1}=0.6$
for the high $\eta _{1}$
and
$\eta _{1}$
and $\eta _{1}=0.1$
as the low
$\eta _{1}=0.1$
as the low $\eta _{1}$
. Even when
$\eta _{1}$
. Even when $\eta _{1}$
is higher or lower than the baseline value (0.3), the results do not change. That is, the model produces a higher output correlation between the USA and the exporter.
$\eta _{1}$
is higher or lower than the baseline value (0.3), the results do not change. That is, the model produces a higher output correlation between the USA and the exporter.
Different values of elasticity of substitution between domestic and foreign nonenergy in consumption $\eta _{2}$
are considered in the fourth and fifth rows in Table 6. Here,
$\eta _{2}$
are considered in the fourth and fifth rows in Table 6. Here, $\eta _{2}=1.5$
in the high
$\eta _{2}=1.5$
in the high $\eta _{2}$
case and
$\eta _{2}$
case and $\eta _{2}=0.9$
in the low
$\eta _{2}=0.9$
in the low $\eta _{2}$
case. The simulation results with these values of
$\eta _{2}$
case. The simulation results with these values of $\eta _{2}$
show that our results are insensitive to the values of
$\eta _{2}$
show that our results are insensitive to the values of $\eta _{2}$
. In both cases, the correlation of US output with the exporter’s output is greater than that with the importer’s output.
$\eta _{2}$
. In both cases, the correlation of US output with the exporter’s output is greater than that with the importer’s output.
The sixth and seventh rows in Table 6 show the results under high and low elasticity of substitution between energy and capital in nonenergy production $1/(\nu +1)$
. In the high
$1/(\nu +1)$
. In the high $1/(\nu +1)$
case,
$1/(\nu +1)$
case, $\nu$
is assumed to be 0.01, and
$\nu$
is assumed to be 0.01, and $\nu$
is 2 in the low case. It appears that the results are insensitive to the value of
$\nu$
is 2 in the low case. It appears that the results are insensitive to the value of $\nu$
. Even in both the low and high
$\nu$
. Even in both the low and high $1/(\nu +1)$
cases, the correlation of US output with importer’s output is lower than that with the exporter’s output.
$1/(\nu +1)$
cases, the correlation of US output with importer’s output is lower than that with the exporter’s output.
Then, I consider the high weight of energy in consumption $\gamma _{1}$
in the eighth row in the table. It is assumed that
$\gamma _{1}$
in the eighth row in the table. It is assumed that $\gamma _{1}$
is 0.1. Similar to the baseline case, the output correlation between the USA and the exporter is larger than that between the USA and the importer.
$\gamma _{1}$
is 0.1. Similar to the baseline case, the output correlation between the USA and the exporter is larger than that between the USA and the importer.
According to the EIA, US net energy imports have been decreasing since the late 2000s due to the shale boom. In fact, the USA became a net energy-exporting country in 2019. Since the sample period is not long enough, we cannot evaluate whether US GDP correlations with energy exporters and importers have changed based on the data. We can, however, evaluate this using the model by considering the case in which the US imports energy to a much lesser extent. Given that the lower $\gamma _{1}$
is, the smaller the US imports of energy from the energy exporter are, this can be assessed by significantly reducing
$\gamma _{1}$
is, the smaller the US imports of energy from the energy exporter are, this can be assessed by significantly reducing $\gamma _{1}$
. Specifically, I consider
$\gamma _{1}$
. Specifically, I consider $\gamma _{1}=0.01$
. As shown in Table 6 (ninth row), when
$\gamma _{1}=0.01$
. As shown in Table 6 (ninth row), when $\gamma _{1}$
is low, output correlation with the energy exporter is 0.606—lower than the baseline case (0.653)—and that with the importer is 0.564—higher than the baseline case (0.514). Hence, even if the US imports a much smaller amount of energy, the correlation of US output with the importer’s output is lower than that with the exporter. Nevertheless, this result implies that, as US energy imports have sharply decreased thanks to the shale boom, the output correlation between the USA and energy exporters would become lower but that between the USA and importers would become higher.
$\gamma _{1}$
is low, output correlation with the energy exporter is 0.606—lower than the baseline case (0.653)—and that with the importer is 0.564—higher than the baseline case (0.514). Hence, even if the US imports a much smaller amount of energy, the correlation of US output with the importer’s output is lower than that with the exporter. Nevertheless, this result implies that, as US energy imports have sharply decreased thanks to the shale boom, the output correlation between the USA and energy exporters would become lower but that between the USA and importers would become higher.
The next two experiments consider different values of the weight of imported nonenergy in nonenergy consumption $\gamma _{2}$
. Their results are presented in the tenth and eleventh rows in Table 6. Specifically, I set
$\gamma _{2}$
. Their results are presented in the tenth and eleventh rows in Table 6. Specifically, I set $\gamma _{2}$
to 0.5 and 0.2 as the high and low
$\gamma _{2}$
to 0.5 and 0.2 as the high and low $\gamma _{2}$
, respectively. Even when
$\gamma _{2}$
, respectively. Even when $\gamma _{2}$
is higher or lower than the baseline case, the model produces similar international business cycles to the baseline case. That is, the correlation between US output and the exporter’s output is higher than that between US output and the importer’s output.
$\gamma _{2}$
is higher or lower than the baseline case, the model produces similar international business cycles to the baseline case. That is, the correlation between US output and the exporter’s output is higher than that between US output and the importer’s output.
Then, I add the productivity process in the energy sector of the energy exporter, as in Backus and Crucini (Reference Backus and Crucini2000). To be specific, it follows the AR(1) process. Productivity shocks in the sector are not correlated with those in other sectors. They have no spillover to other sectors, the autocorrelation of productivity is 0.88, and the standard deviation of the shocks is 0.083. The twelfth row in Table 6 shows the results when productivity shocks in the energy sector are included in the model. Even with such productivity shocks in the energy sector in the exporter, the results are similar to the baseline case. Specifically, the output correlation between the USA and the exporter is 0.503, which is greater than that between the USA and the importer (0.366).
Finally, I consider the different values of the parameters associated with the productivity shock process in the nonenergy sectors. The thirteenth row in the table considers no productivity spillovers— $\rho _{a}$
is zero. The low shock persistence is also considered in the last row in Table 6. Specifically,
$\rho _{a}$
is zero. The low shock persistence is also considered in the last row in Table 6. Specifically, $\rho$
is 0.5 in this case. Even when these parameter values are different, US output is more strongly correlated with output in the energy exporter than with that in the energy importer.
$\rho$
is 0.5 in this case. Even when these parameter values are different, US output is more strongly correlated with output in the energy exporter than with that in the energy importer.
In summary, the model appears to be insensitive to these assumptions. That is, even under the different assumptions, the model produces a stronger correlation of US output with energy exporter output than with importer output, as observed in the data.
5. Conclusion
In this paper, I set up a three-country model with idiosyncratic energy production and trade structures in which the USA (an energy importer), a non-US energy importer, and an energy exporter exist. Consistent with the empirical findings, the model produces a higher output correlation between the USA and the energy exporter than that between the USA and the energy importer. The changes in energy prices and trade in response to productivity shocks enable the connections between outputs in the former two countries to be stronger than those in the latter two countries. Finally, the sensitivity analysis shows that the main results of this paper are valid under different parameter values and asset market structures.
Therefore, accounting for countries’ different energy production and trade structures in open economy macro models appears to be useful, as it helps explain US business cycle correlations with energy exporters and importers. The framework that this paper proposes is therefore promising for further research on the different international macroeconomic interactions between the USA and energy exporters and between the USA and energy importers, especially in the international transmission of monetary and fiscal policies.
Appendix
A. Data appendix
This appendix describes the data used in this paper. The data are mainly from five sources: the UN, the OECD, the IMF, the World Bank, and the Federal Reserve Economic Data (FRED).
Figure 1, and Tables 1 and 2
Countries in Figure 1 and Table 2 are advanced countries based on IMF’s classification and those whose energy trade data are available in the UN Comtrade database. For the GDP correlations in Figure 1 and Table 2, data for 33 countries are used. The 33 countries are Australia, Austria, Belgium, Canada, Cyprus, Czech Republic, Denmark, Estonia, Finland, France, Germany, Greece, Iceland, Ireland, Israel, Italy, Japan, Korea, Latvia, Lithuania, Luxembourg, Malta, the Netherlands, New Zealand, Norway, Portugal, Singapore, Slovak Republic, Slovenia, Spain, Sweden, Switzerland, and the UK. Among the 33 countries, four countries are energy-exporting countries whose net energy exports are positive: Australia, Canada, Denmark, and Norway. Annual real GDPs for computing correlations are taken from the IMF World Economic Outlook. Since the pre-1990 data for most Eastern European countries are not available, the GDP data cover the period 1990–2015, except for Czech Republic (1995–2015), Estonia (1993–2015), Latvia (1992–2015), Lithuania (1995–2015), Malta (2000–2015), Slovak Republic (1993–2015), and Slovenia (1992–2015). Net energy exports are exports minus imports of mineral fuels, oils, distillation products, etc. in UN Comtrade. The ratio of net energy exports to GDP is the average of net energy exports divided by GDP for the period of 1990–2015. However, due to data availability, each country has a different sample starting year. The sample starting year for Germany is 1991; that for Ireland, the Netherlands, and Sweden is 1992; that for Norway and the UK is 1993; that for Austria, France, Italy, Latvia, Lithuania, Malta, Slovak Republic, and Slovenia is 1994; that for the Czech Republic, Estonia, and Israel is 1995; that for Belgium and Luxembourg is 1999; and that for the remaining countries is 1990. Banks’ return on assets is sourced from the World Bank Global Financial Development. Financial distance is measured by the average of the differences between banks’ return on assets in the USA and that in other countries. Since the data for banks’ return on assets are available from 2000, the sample period for financial distance is 2000–2015. The ratio of trade with the USA to GDP is the average of dividing exports to the USA plus imports from it by nominal GDP for the period of 1990–2015, and the source of trade with the USA is the IMF Direction of Trade Statistics.
Table 5
The data for GDP are the same as before, and annual private consumption, net exports, and real private fixed investment are taken from the OECD National Accounts. Hours are total hours worked in the economy, which are taken from Valerie Ramey’s website. The terms of trade are defined as the relative price of exports to imports and are sourced from the FRED. The GDP correlations are taken from Table 2. For the consumption and investment correlations in Table 5, I exclude Cyprus, Lithuania, and Singapore from the 33 countries used in Table 2 because their data are not available in the OECD National Accounts.
B. GDP correlations between all country pairs
Notes: Correlations are calculated using detrended annual GDPs during the 1990–2015 period using the HP filter with $\lambda =100$
. AU: Australia, AT: Austria, BE: Belgium, CA: Canada, CY: Cyprus, CZ: Czech Republic, DE: Denmark, ES: Estonia, FI: Finland, FR: France, GE: Germany, GR: Greece, IC: Iceland, IR: Ireland, IS: Israel, IT: Italy, JA: Japan, KO: Korea, LA: Latvia, LI: Lithuania, LU: Luxembourg, MA: Malta, NE: The Netherlands, NZ: New Zealand, NO: Norway, PO: Portugal, SI: Singapore, SL: Slovak Republic, SO: Slovenia, SP: Spain, SW: Sweden, and SI: Switzerland.
$\lambda =100$
. AU: Australia, AT: Austria, BE: Belgium, CA: Canada, CY: Cyprus, CZ: Czech Republic, DE: Denmark, ES: Estonia, FI: Finland, FR: France, GE: Germany, GR: Greece, IC: Iceland, IR: Ireland, IS: Israel, IT: Italy, JA: Japan, KO: Korea, LA: Latvia, LI: Lithuania, LU: Luxembourg, MA: Malta, NE: The Netherlands, NZ: New Zealand, NO: Norway, PO: Portugal, SI: Singapore, SL: Slovak Republic, SO: Slovenia, SP: Spain, SW: Sweden, and SI: Switzerland.
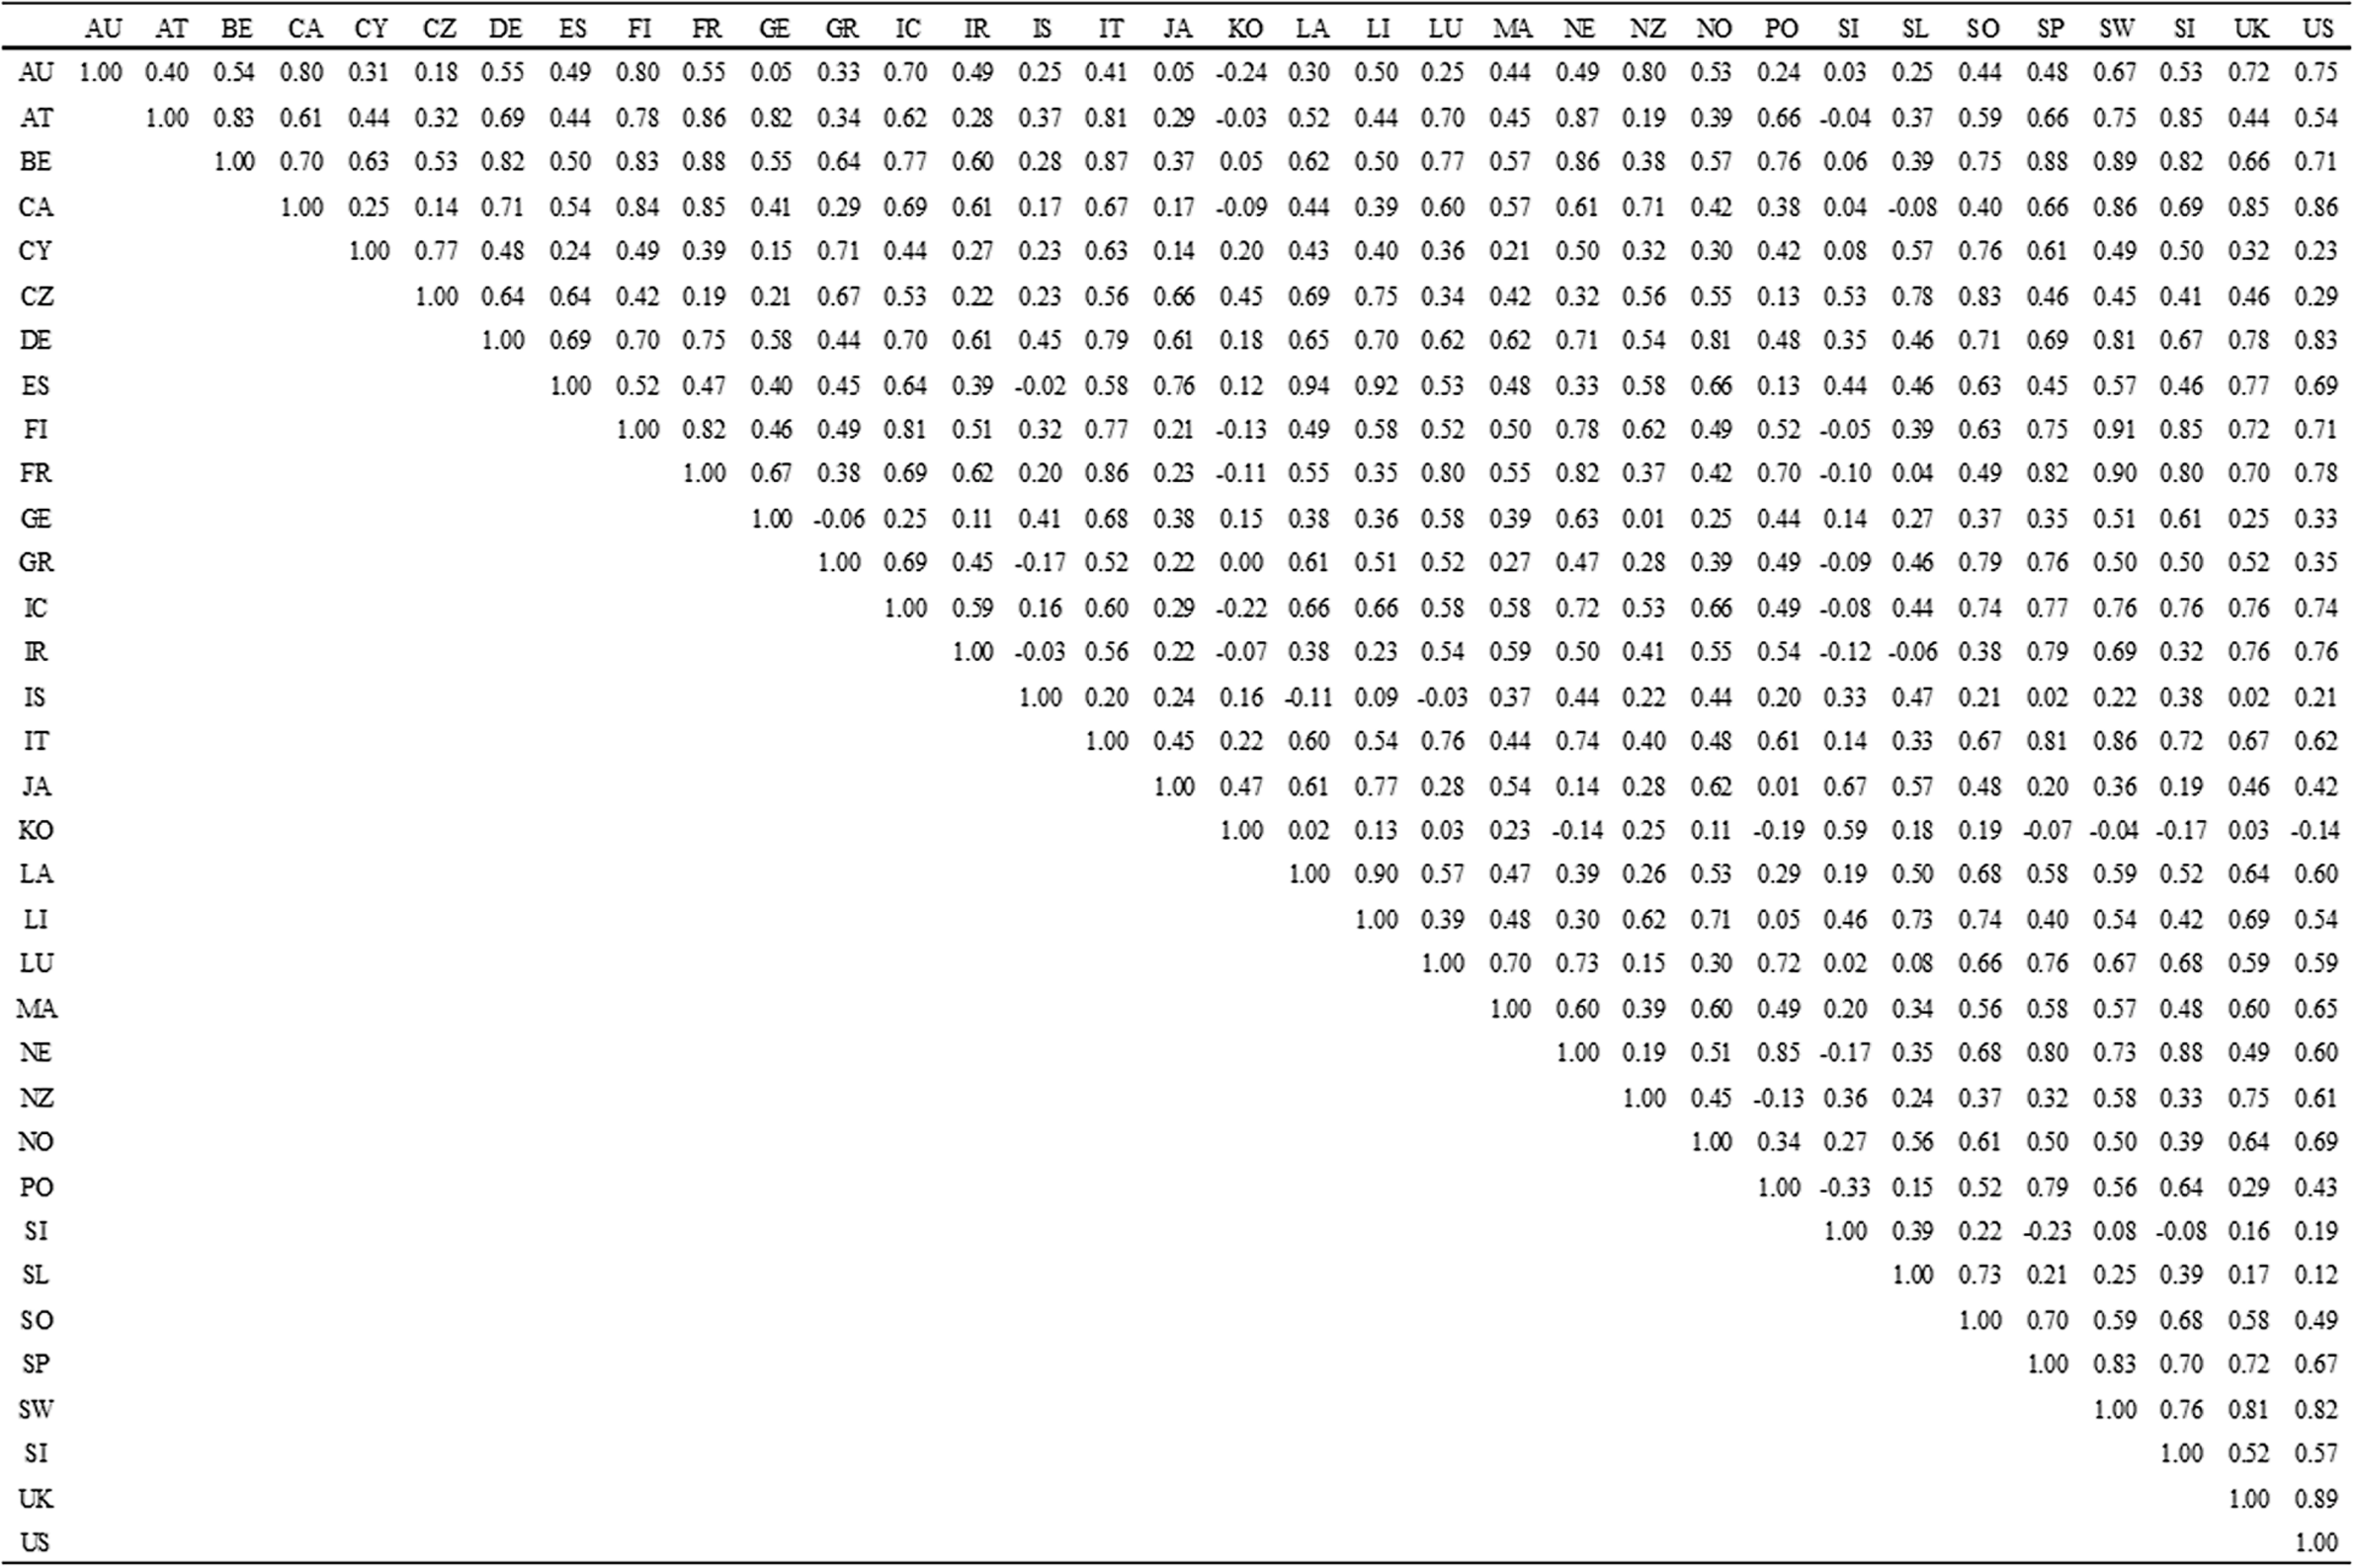
Notes: Correlations are calculated using detrended annual GDPs during the 1990–2015 period with the HP filter with $\lambda =100$
. The values of net energy exports/GDP are averages for the period of 1990–2015.
$\lambda =100$
. The values of net energy exports/GDP are averages for the period of 1990–2015.
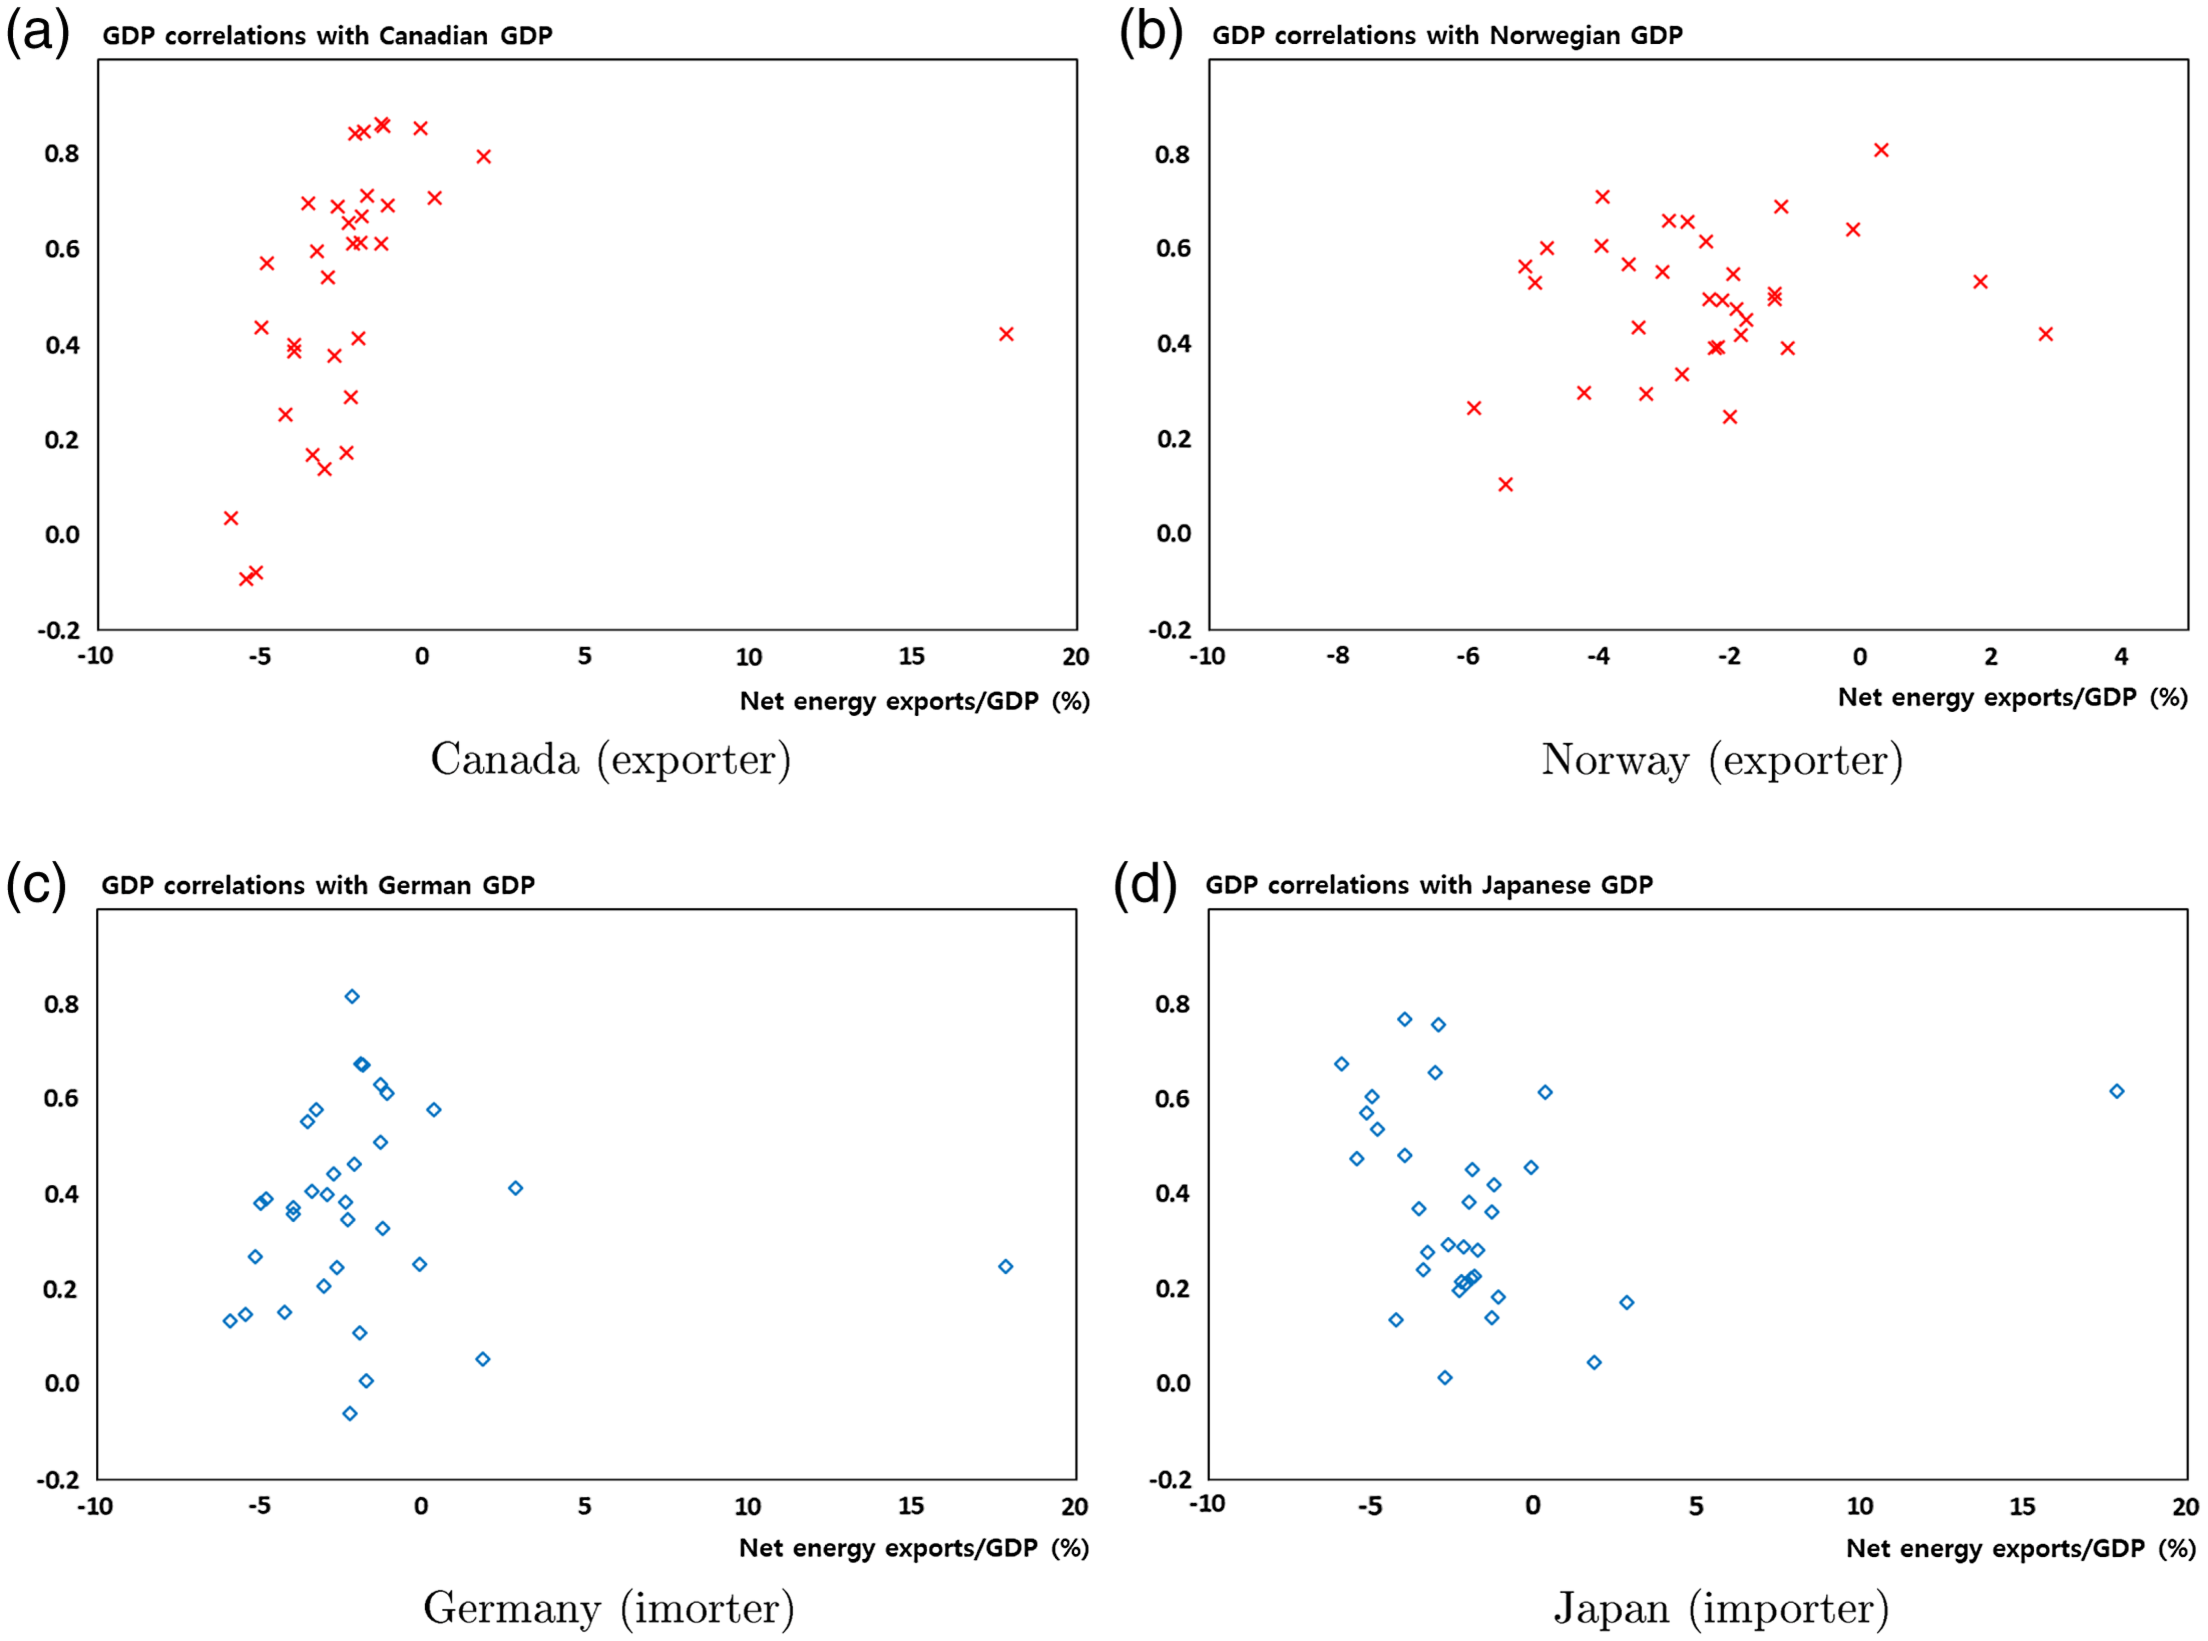
C. GDP correlations with the USA and ratios of net energy exports to GDP using the quadratic filter
Notes: Correlations are calculated using detrended annual GDPs during the 1990–2015 period with the quadratic filter. The values of net energy exports/GDP are averages for the period of 1990–2015.
D. Equilibrium conditions of the model
In this appendix, I present the equilibrium conditions for country $A$
(the USA) described in Section 3. Those for countries
$A$
(the USA) described in Section 3. Those for countries $B$
and
$B$
and $C$
can be found in a similar way.
$C$
can be found in a similar way.
 \begin{align} \lambda _{t}=\theta C_{t}^{\theta (1-\chi )-1}L_{t}^{(1-\theta )(1-\chi )}, \end{align}
 \begin{align} W_{t}\lambda _{t}=(1-\theta )C_{t}^{\theta (1-\chi )}L_{t}^{(1-\theta )(1-\chi )-1}, \end{align}
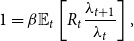 \begin{align} 1=\beta \mathbb{E}_{t}\left [R_{t}\frac{\lambda _{t+1}}{\lambda _{t}}\right ], \end{align}
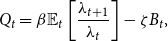 \begin{align} Q_{t}=\beta \mathbb{E}_{t}\left [\frac{\lambda _{t+1}}{\lambda _{t}}\right ]-\zeta B_{t}, \end{align}
 \begin{align} 1=L_{t}+N_{t}, \end{align}
 \begin{align} p_{A,t}\left (C_{A,t}^{B}+C_{A,t}^{C}\right )-\left \{ p_{B,t}C_{B,t}+p_{C,t}C_{C,t}+p_{e,t}(C_{e,t}+e_{t})\right \} +B_{t-1}=Q_{t}B_{t}+\frac{1}{2}\zeta B_{t}^{2}, \end{align}
 \begin{align} C_{ne,t}=(1-\gamma _{1})p_{ne,t}^{-\eta _{1}}C_{t}, \end{align}
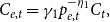 \begin{align} C_{e,t}=\gamma _{1}p_{e,t}^{-\eta _{1}}C_{t}, \end{align}
 \begin{align} C_{A,t}=(1-\gamma _{2})\left (\frac{p_{A,t}}{p_{ne,t}}\right )^{-\eta _{2}}C_{ne,t}, \end{align}
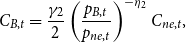 \begin{align} C_{B,t}=\frac{\gamma _{2}}{2}\left (\frac{p_{B,t}}{p_{ne,t}}\right )^{-\eta _{2}}C_{ne,t}, \end{align}
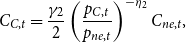 \begin{align} C_{C,t}=\frac{\gamma _{2}}{2}\left (\frac{p_{C,t}}{p_{ne,t}}\right )^{-\eta _{2}}C_{ne,t}, \end{align}
 \begin{align} 1=(1-\gamma _{1})p_{ne,t}^{1-\eta _{1}}+\gamma _{1}p_{e,t}^{1-\eta _{1}}, \end{align}
 \begin{align} p_{ne,t}^{1-\eta _{2}}=(1-\gamma _{2})p_{A,t}^{1-\eta _{2}}+\frac{\gamma _{2}}{2}p_{B,t}^{1-\eta _{2}}+\frac{\gamma _{2}}{2}p_{C,t}^{1-\eta _{2}}, \end{align}
 \begin{align} p_{A,t}=s_{B,t}p_{A,t}^{B}, \end{align}
 \begin{align} p_{B,t}=s_{B,t}p_{B,t}^{B}, \end{align}
 \begin{align} p_{C,t}=s_{B,t}p_{C,t}^{B}, \end{align}
 \begin{align} p_{e,t}=s_{B,t}p_{e,t}^{B}, \end{align}
 \begin{align} p_{A,t}=s_{C,t}p_{A,t}^{C}, \end{align}
 \begin{align} p_{B,t}=s_{C,t}p_{B,t}^{C}, \end{align}
 \begin{align} p_{C,t}=s_{C,t}p_{C,t}^{C}, \end{align}
 \begin{align} p_{e,t}=s_{C,t}p_{e,t}^{C}, \end{align}
 \begin{align} Y_{ne,t}=A_{ne,t}\{(1-a)K_{ne,t}^{-\nu }+ae_{t}^{-\nu }\}^{^{-\frac{\alpha }{\nu }}}N_{ne,t}^{1-\alpha }, \end{align}
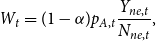 \begin{align} W_{t}=(1-\alpha )p_{A,t}\frac{Y_{ne,t}}{N_{ne,t}}, \end{align}
 \begin{align} R_{t-1}=\frac{1}{q_{ne,t-1}}\left \{ (1-\delta )q_{ne,t}+\alpha (1-a)p_{A,t}K_{ne,t}^{-\nu -1}\frac{Y_{ne,t}}{(1-a)K_{ne,t}^{-\nu }+ae_{t}^{-\nu }}\right \}, \end{align}
 \begin{align} p_{e,t}=a\alpha p_{A,t}e_{t}^{-\nu -1}\frac{Y_{ne,t}}{(1-a)K_{ne,t}^{-\nu }+ae_{t}^{-\nu }}, \end{align}
 \begin{align} K_{ne,t+1}=(1-\delta )K_{ne,t}+\phi \left (\frac{I_{ne,t}}{K_{ne,t}}\right )K_{ne,t}, \end{align}
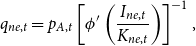 \begin{align} q_{ne,t}=p_{A,t}\left [\phi '\left (\frac{I_{ne,t}}{K_{ne,t}}\right )\right ]^{-1}, \end{align}
 \begin{align} Y_{ne,t}=C_{A,t}+C_{A,t}^{B}+C_{A,t}^{C}+I_{ne,t}, \end{align}
 \begin{align} B_{t}+B_{t}^{B}+B_{t}^{C}=0. \end{align}


 Open access

