


Introduction
The human population of sub-Saharan Africa is expected to at least double by 2050, necessitating a corresponding increase in food availability (Ittersum et al., Reference Ittersum, Bussel, Wolf, Grassini, Wart, Guilpart, Claessens, Groot, Wiebe, Mason-D’Croz, Yang, Boogaard, Oort, Loon, Saito, Adimo, Adjei-Nsiah, Agali, Bala, Chikowo, Kaizzi, Kouressy, Makoi, Ouattara, Tesfaye and Cassman2016; Cleland and Machiyama, Reference Cleland and Machiyama2017). Yields per hectare have, however, remained largely static in recent decades, and many African countries are net importers of food (Cleland and Machiyama, Reference Cleland and Machiyama2017). Sustainable intensification to close the yield gap between current and maximum possible production could help improve food security in this region (Godfray et al., Reference Godfray, Beddington, Crute, Haddad, Lawrence, Muir, Pretty, Robinson, Thomas and Toulmin2010; Godfray and Garnett, Reference Godfray and Garnett2014).
One barrier to improving food security is yield loss from invertebrate pest damage. Sustainable intensification includes an increased reliance on biological pest control (Garibaldi et al., Reference Garibaldi, Gemmill-Herren, D'Annolfo, Graeub, Cunningham and Breeze2017). As part of integrated pest management, this could increase yields while minimising the negative impacts of pesticide application such as environmental pollution and compromised human health (Bianchi et al., Reference Bianchi, Booij and Tscharntke2006; Kansiime et al., Reference Kansiime, Mugambi, Rwomushana, Nunda, Lamontagne-Godwin, Rware, Phiri, Chipabika, Ndlovud and Day2019; Tambo et al., Reference Tambo, Kansiime, Mugambi, Rwomushana, Kenis, Day and Lamontagne-Godwin2020; Haggblade et al., Reference Haggblade, Diarra and Traoré2021). The configuration of landscape natural capital stocks (e.g. semi-natural habitat surrounding cropland) can potentially be managed to increase the flow of biological pest control services, particularly on smallholder farms (Steward et al., Reference Steward, Shackelford, Carvalheiro, Benton, Garibaldi and Sait2014).
One such biological pest control service could come from habitat spillover effects, where populations of invertebrates from surrounding semi-natural habitat move into crop areas to consume or parasitize pests (Tscharntke et al., Reference Tscharntke, Rand and Bianchi2005). Here, we refer to these predators and parasitoids as ‘natural enemies’. Complex landscapes consistently contain higher natural enemy populations than simple landscapes (Bianchi et al., Reference Bianchi, Booij and Tscharntke2006). Furthermore, richness and diversity of natural enemy communities is important in delivering effective biological pest control (Wilby and Thomas, Reference Wilby and Thomas2002; Cardinale et al., Reference Cardinale, Harvey, Gross and Ives2003; Crowder et al., Reference Crowder, Northfield, Strand and Snyder2010). However, measures to diversify crop landscapes are not guaranteed to enhance natural enemies, decrease pests, or increase yields (Bianchi et al., Reference Bianchi, Booij and Tscharntke2006; Poveda et al., Reference Poveda, Gomez and Martinez2008). Semi-natural habitat can act as reservoirs for crop pests, increasing their abundance and corresponding crop damage (Tscharntke et al., Reference Tscharntke, Rand and Bianchi2005). The inconsistent impact of semi-natural habitat limits the ability to make general recommendations for landscape management. Therefore, localized case-specific studies are required to inform management recommendations.
Fall armyworm (FAW, Spodoptera frugiperda J. E. Smith, Lepidoptera: Noctuidae), native to the Americas, has been invasive in West Africa since 2016 and attacks several economically important crops such as maize, millet, sorghum, rice, wheat, and sugar cane (Goergen et al., Reference Goergen, Kumar, Sankung, Togola and Tamò2016). FAW is a particular problem on maize (Zea mays) (Day et al., Reference Day, Abrahams, Bateman, Beale, Clottey, Cock, Colmenarez, Corniani, Early, Godwin, Gomez, Moreno, Murphy, Oppong-Mensah, Phiri, Pratt, Silvestri and Witt2017; Early et al., Reference Early, González-Moreno, Murphy and Day2018); estimates of yield loss in sub-Saharan Africa range between 12 and 45%, with 26% losses reported by Ghanaian farmers in 2018 (Njuguna et al., Reference Njuguna, Nethononda, Maredia, Mbabazi, Kachapulula, Rowe and Ndolo2021). Although a variety of natural enemies of FAW have been identified in Ghana (Agboyi et al., Reference Agboyi, Goergen, Beseh, Mensah, Clottey, Glikpo, Buddie, Cafà, Offord, Day, Rwomushana and Kenis2020; Koffi et al., Reference Koffi, Kyerematen, Eziah, Agboka, Adom, Goergen and Meagher2020) and studies on landscape management for its control are emerging from sub-Saharan Africa (e.g. Midega et al., Reference Midega, Pittchar, Pickett, Hailu and Khan2017), studies investigating how abundance of FAW or its natural enemies changes with distance from field edges are lacking (Harrison et al., Reference Harrison, Thierfelder, Baudron, Chinwada, Midega, Schaffner and Berg2019). This is fundamental to understanding the potential for semi-natural habitat to enhance biological control of this economically important pest, which in turn is required to inform management recommendations for landscape configuration to minimise pest abundance and maximise crop yield.
Using a combination of empirical observation and experimental dummy caterpillars in Ghanaian maize fields we examine the relationship between distance from semi-natural habitat and FAW-mediated crop damage, and the abundance, richness and diversity of its potential natural enemies. We hypothesise that natural enemies colonise maize from semi-natural habitat, and therefore predict that FAW crop damage will be lower, and the activity of natural enemies higher, closer to field edges. Conversely, if semi-natural habitat acts as a reservoir for FAW from which it colonises crops, this may be a more important determinant of FAW abundance, and FAW damage could therefore be higher closer to field edges.
Methods
FAW damage in relation to distance from field edge
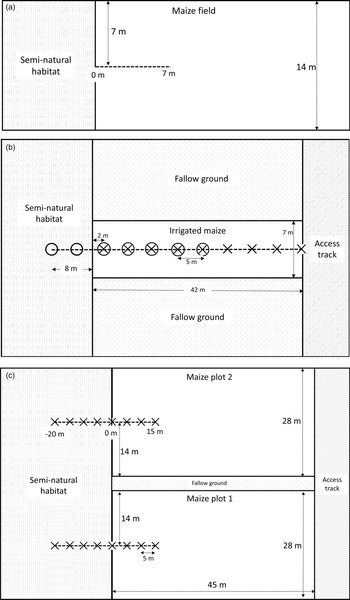
To assess how herbivory from FAW varied with distance from field margins in a rural smallholder agricultural setting, on 5 February 2019 we surveyed two fields of unharvested maize bordered by semi-natural habitat (grass, shrubs, and small trees) in Abutia Amegame (Volta Region of Ghana; 6.46°N, 0.32°E), referred to throughout as village maize (VM). We sampled along a 7 m transect running from the mid-point of a field edge into the centre of the maize crop (fig. 1a). Maize plants within a 2-m wide zone along this transect were surveyed for the total number of leaves per plant and number of leaves showing herbivory. The proportion of leaves with herbivore damage correlates with FAW abundance (Hruska and Gould, Reference Hruska and Gould1997; Midega et al., Reference Midega, Pittchar, Pickett, Hailu and Khan2017). FAW infestation had occurred earlier in the growing season, so no FAW were present in the fields when surveyed, but the damage recorded was characteristic of FAW damage; i.e. windowed whorls with larval frass and skeletonised leaves (Goergen et al., Reference Goergen, Kumar, Sankung, Togola and Tamò2016). We were unable to sample additional fields as intended due to the majority of maize fields having already been harvested.
Layout of maize plots sampled. (a) VM. Two fields in Abutia Amegame were surveyed for FAW herbivory, both 14 m wide. Leaf damage was assessed on maize plants within a 2 m zone along the transect (dashed line) and plant distant point recorded to the nearest 0.5 m. (b) UM1. February-planted irrigated maize plot on the University of Ghana experimental farm. 50 m transect (dashed line) ran through 42 m of crop and 8 m of semi-natural habitat. Sampling took place at 5 m intervals; crosses indicate where maize leaf herbivory damage was assayed and FAW larvae were collected, and circles indicate where pitfall traps were set. (c) UM2. November-planted tasselling-stage maize plots, University farm. 35 m transects (dashed lines) ran through each plot and adjacent semi-natural habitat. Crosses indicate where pitfall traps and dummy caterpillars were set. The plots were separated by fallow ground.

To observe the infestation process of FAW on young maize plants in a more controlled experimental setting, on 5 February 2019 we established a 42 m × 7 m irrigated maize plot at the University of Ghana experimental farm (5.66°N, 0.19°W), referred to here as University maize 1 (UM1). The plot was bordered by bare cultivated earth on the long edges and semi-natural vegetation (predominantly grass) or a dirt access track on the short edges (fig. 1b). We ran a 50 m transect starting 8 m into semi-natural vegetation at one margin of the crop, through the whole experimental crop plot, and ending at the opposite margin bordering an access track. During 12–22 February 2019, we daily monitored 6–8 maize plants every 5 m along the transect in the two planting rows on either side of the transect. We recorded the total number of leaves and the number of leaves showing herbivore damage for the same plants each day. The number of FAW larvae per plant was not observed directly; this would have required destructive sampling, since FAW larvae typically retreat into leaf whorls (Day et al., Reference Day, Abrahams, Bateman, Beale, Clottey, Cock, Colmenarez, Corniani, Early, Godwin, Gomez, Moreno, Murphy, Oppong-Mensah, Phiri, Pratt, Silvestri and Witt2017; Early et al., Reference Early, González-Moreno, Murphy and Day2018).
Natural enemy activity in relation to distance from field edge
To link the development of FAW-mediated crop damage in young maize to natural enemy activity, richness and diversity, between 12 and 22 February 2019 we placed pitfall traps every 5 m along the 50 m transect in the University maize plot described above (UM1, fig. 1b). Traps were emptied every 24 h and invertebrate morphospecies abundances recorded. The four pitfall traps closest to the access track were excluded from analysis, due to inability to determine whether invertebrates in these samples had entered the crop from the edge of interest (bordering semi-natural habitat) or had crossed the access track to reach the maize. We also assessed parasitism rates of FAW larvae from a three plant by three plant quadrat (totalling nine plants) every 5 m along the transect within the crop. Seventeen days after planting the maize, each plant was searched systematically for FAW larvae, and all larvae were collected (up to a maximum of 20 larvae per quadrat). Each larva was reared individually on maize leaves in transparent plastic cups covered with nylon mesh in the Department of Crop Sciences, University of Ghana, until either an adult moth or a parasitoid emerged, or the larva or pupa died; monitoring for parasitoid emergence continued for 1 week after death. Further collection of larvae took place at 14-day intervals, on 8 and 22 March 2019 (Supplementary Table 4).
We complemented our study of natural enemy activity in the young maize crop by surveying previously established maize at the tasselling stage on the experimental farm (University maize 2, UM2). Two un-irrigated maize plots 28 m × 45 m had been planted on 9 November 2018. One of the 28 m margins of both plots was bordered by uncultivated land, predominantly exposed ground with patchy shrubs and grass clumps. One plot had previously been treated with a pesticide targeting FAW, but as pesticide treatment was not ongoing and is not of interest in our study, we sampled both plots to increase replication and included plot ID as a fixed effect in data analysis. We set a 35 m transect perpendicular to the edge bordering uncultivated habitat in both plots, starting 20 m into the semi-natural vegetation and continuing 15 m into the maize plot (fig. 1c). On 11 February 2019, we placed pitfall traps (6 cm in diameter) partially filled with water and detergent, every 5 m along this transect. We emptied traps after 24 h and recorded invertebrate morphospecies. As a further indicator of natural enemy activity, ten plasticine caterpillars were placed every 5 m on the transect on 12 February 2019. Model caterpillars made from modelling clay or plasticine are widely used to assess potential predation pressure on invertebrate herbivores from arthropods, birds and mammals (Howe et al., Reference Howe, Lövei and Nachman2009; Low et al., Reference Low, Sam, McArthur, Posa and Hochuli2014). Dummy caterpillars (30 mm × 3 mm) were made from brown Newplast (Newclay Products Ltd), to mimic later instars of FAW (EPPO, 2015; Jeger et al., Reference Jeger, Bragard, Caffier, Candresse, Chatzivassiliou, Dehnen-Schmutz, Gilioli, Gregoire, Miret, Navarro, Niere, Parnell, Potting, Rafoss, Rossi, Urek, Bruggen, Werf, West, Winter, Gardi, Aukhojee and MacLeod2017). Caterpillars were attached to maize/semi-natural vegetation using UHU super glue. After 48 h, we used a hand lens to score the presence or absence of attack and the identity of the potential predator (categorised as arthropod, mammal, or bird) (Low et al., Reference Low, Sam, McArthur, Posa and Hochuli2014). Mammal and bird attacks were rare (two and one caterpillars, respectively), so analyses were restricted to overall attack rates. Missing caterpillars were excluded from the analysis (as in Sam et al., Reference Sam, Remmel and Molleman2015; Mansion-Vaquié et al., Reference Mansion-Vaquié, Ferrante, Cook, Pell and Lövei2017).
Statistical analysis
R version 3.5.2 was used for statistical analysis and to plot graphs. Details of the variables and response distribution included in the generalised linear models (GLM, fitted using the glm function), along with details of dispersion tests and adjusted R 2 used to assess model fit are given in Supplementary Table 1 and Supplementary Text 1.
Araneae (spider) and Hymenoptera (mostly Formicidae, i.e. ant) data from pitfall traps were analysed as likely natural enemies of FAW. Three metrics were used to summarise Araneae and Hymenoptera activity and diversity: abundance (total number of individuals), species richness (number of species), and inverse Simpson's diversity index.
Results
FAW crop damage
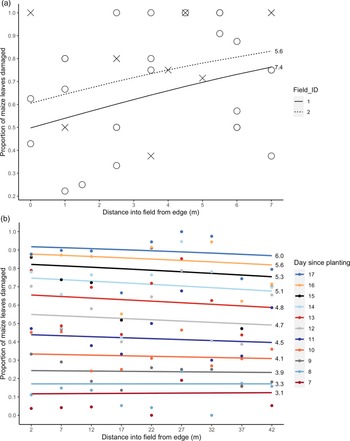
The proportion of leaves showing herbivore damage in the VM fields increased significantly with distance from semi-natural habitat by 4.2 and 3.9% per metre in the two fields (P < 0.05, Table 1, fig. 2a). However, relatively little of the variation in herbivory was explained by distance (R 2D, Dγ = 0.0761, Supplementary Table 2).
Proportion of maize leaves showing herbivory damage with distance from semi-natural habitat in (a) VM and (b) UM1 (cumulative total damage over successive days). Lines display model-fitted values and points show the raw data. The mean number of leaves per field (VM) or per day (UM1) are shown next to the respective lines, to indicate maize development stage during sampling. Colour of lines and points in (b) indicate day since maize was planted, with 11 days surveyed in total.

Change in proportion of leaf damage with distance into maize field from semi-natural habitat, for VM and UM1

VM model back-transformed values are between 3 and 4 m on transect. UM1 models are back-transformed between 17 and 22 m to evaluate change in proportion with distance on the first and last day of surveying (7 and 17 days after planting), and also evaluated at 22 m to indicate the effect of time since planting alone. Statistical significance of variables is indicated (– not significant, * P < 0.05, ** P < 0.01, *** P < 0.001). For the full summary of model estimates, standard errors and R 2 values, see Supplementary Table 2.
In the UM1 plot, the relationship between level of herbivory and distance from semi-natural habitat changed with time since planting (i.e. a significant time × distance interaction; P < 0.001, Supplementary Table 2). Our hypothesis was primarily concerned with the effect of distance on herbivory, but since leaf damage accumulates as FAW infestation progresses, we included time as a fixed effect to account for this and to determine any interaction effect with distance. On the first day of sampling (7 days after planting), the proportion of leaves showing herbivore damage increased 0.078% over 10 m (15–25 m) from the semi-natural habitat, whereas 17 days after planting the proportion of leaves damaged decreased 0.59% over this same distance (Table 1, fig. 2b). The proportion of leaves with herbivory increased with time since planting from 12.0% 7 days after planting to 89.6% on day 17 (Table 1), but the increase in damage was less pronounced further from the field margin bordering semi-natural habitat (fig. 2b). The binomial GLM had a very good fit to the data (R 2D, γ = 0.476, Supplementary Table 2), equivalent to a conventional R 2 value of over 0.9 (Louviere et al., Reference Louviere, Hensher and Swait2000).
Natural enemy activity – abundance, richness, and diversity
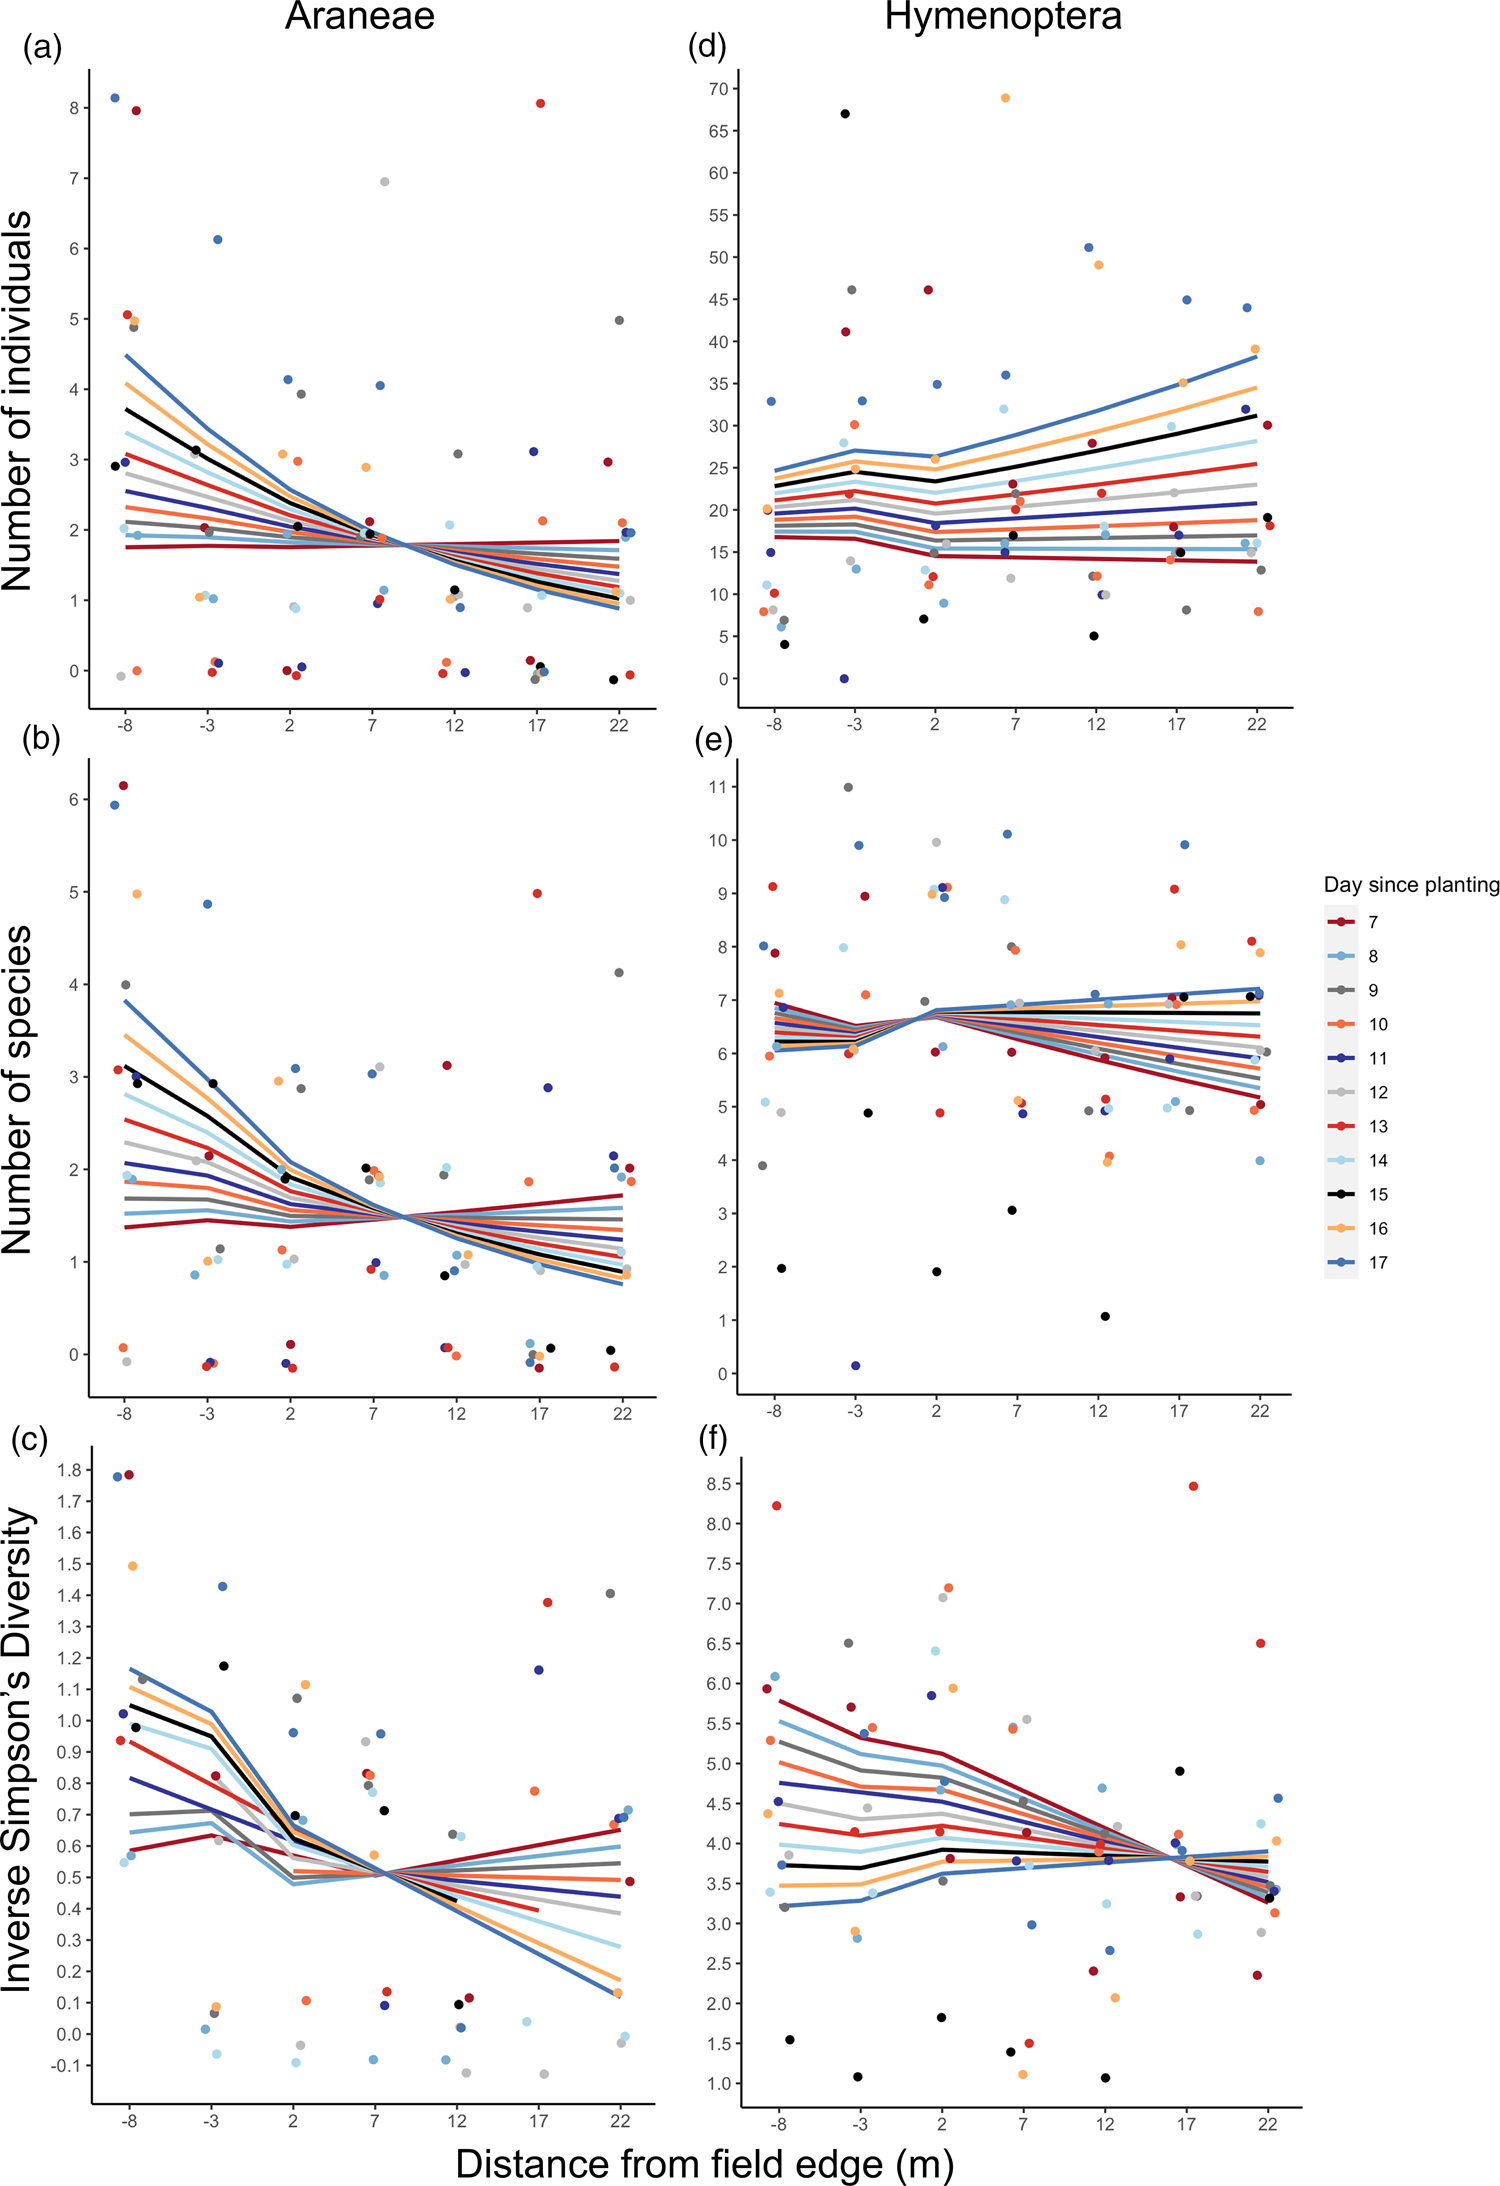
In UM1, a total of 2138 invertebrates were collected in pitfall traps over 11 days of sampling. Araneae accounted for 169 individuals assigned to 33 morphospecies, while a further 1670 were Hymenoptera, predominantly Formicidae (ants) and attributed to 64 morphospecies. The samples were dominated by three Araneae morphospecies (each with over 20 specimens across all days of sampling) and seven Hymenoptera morphospecies (combined abundance greater than 100).
Araneae activity was affected by an interaction between distance from semi-natural habitat and time since planting (P < 0.05 for total abundance, P < 0.1 for richness and diversity, Table 2). As the maize grew, Araneae activity changed from moderately increasing with distance from semi-natural habitat to decreasing with distance (fig. 3a–c). The total abundance data contained an outlier at 20 m on day 7 (abundance of 18) and re-analysis without this data point removed the statistical significance of this result, but not the direction of the effect (Supplementary Table 3). Araneae diversity was also significantly higher in semi-natural habitat than in the crop (P < 0.05, Table 2).
Natural enemy activity (abundance, richness and diversity) data from pitfall traps in UM1; 8 m into semi-natural habitat (from crop edge) to 22 m into irrigated maize plot. Lines display model-fitted values, points show the raw data, and colours indicate day since maize was planted (11 days surveyed in total). (a) Araneae abundance (total number of individuals), (b) Araneae species richness (number of species), (c) Araneae diversity (inverse Simpsons Diversity Index, log scale), (d) Hymenoptera abundance (total number of individuals, (e) Hymenoptera species richness (number of species), (f) Hymenoptera diversity (inverse Simpsons Diversity Index). As the maize grew, Araneae activity tended to decrease with distance into the maize plot, whereas Hymenoptera activity increased.
Values of natural enemy metrics from UM1 pitfall trap data, evaluated as the difference between the 7 and 12 m sampling points from the crop edge for the first and last day of sampling (7 and 17 days after maize planting)

Values given are back-transformed from models fitted. Statistical significance of variables is indicated (– not significant, . P < 0.1, * P < 0.05, ** P < 0.01). For the full summary of model estimates, standard errors and R 2 values, see Supplementary Table 3.
a Seven intervals on the transect were sampled over 11 days, resulting in n = 77. However, an outlier was removed for Araneae total abundance. Samples with zero individuals were removed from analyses of inverse Simpsons index.
Hymenoptera diversity was affected by an interaction between distance and time since planting (P < 0.05, Table 2), declining with increasing distance from semi-natural habitat into crop initially but, over time, changing to an increase with distance from crop edge (fig. 3f). All GLMs used to analyse the Araneae and Hymenoptera metrics from the UM1 pitfall trap data explained little variation in the data, indicated by low R 2 values (Supplementary Table 3).
From the 260 FAW larvae collected at three 14-day intervals from UM1, 53 emerged as moths and eight as parasitoids, giving an average parasitism rate of 13.1% (Table 3) which is typical of parasitism of FAW in Ghana (Agboyi et al., Reference Agboyi, Goergen, Beseh, Mensah, Clottey, Glikpo, Buddie, Cafà, Offord, Day, Rwomushana and Kenis2020; Koffi et al., Reference Koffi, Kyerematen, Eziah, Agboka, Adom, Goergen and Meagher2020) and East Africa (Sisay et al., Reference Sisay, Simiyu, Malusi, Likhayo, Mendesil, Elibariki, Wakgari, Ayalew and Tefera2018, 2019). Most other larvae died as larvae or pupae (Supplementary Table 5). Future work would benefit from also considering egg parasitism, given candidates have already been identified in West Africa (Kenis et al., Reference Kenis, du Plessis, Van den Berg, Ba, Goergen, Kwadjo, Baoua, Tefera, Buddie, Cafà, Offord, Rwomushana and Polaszek2019).
Parasitism rate for FAW larvae collected from UM1 at 17, 31 and 45 days after planting

For numbers of larvae collected at each distance, and the outcomes of all larvae collected, see Supplementary Tables 4 and 5, respectively.
Of the 449 invertebrates collected using pitfall traps in UM2, 22 Araneae and 385 Hymenoptera were identified (11 and 22 morphospecies, respectively).
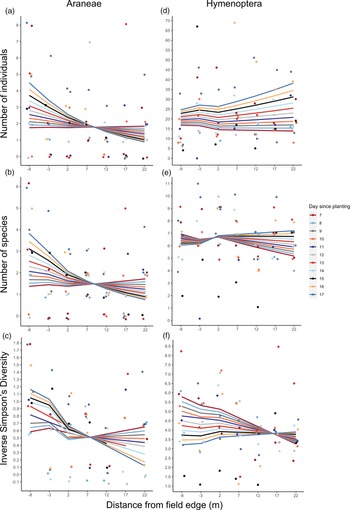
Hymenoptera species richness and diversity significantly increased with distance along the transect (P < 0.05, Table 4, fig. 4e, f), but did not differ significantly between habitat types. Statistical models used for analysis of Hymenoptera metrics fitted the data well, indicated by high R 2 values (Supplementary Table 3); total abundance and species richness models have adjusted pseudo-R 2 values in the range 0.2–0.4, equivalent to conventional R 2 values of 0.7–0.9 or above (Louviere et al., Reference Louviere, Hensher and Swait2000). In contrast, the models used to analyse Araneae metrics explained little variation in the data (Supplementary Table 3).
Natural enemy activity in UM2; abundance, richness and diversity data from pitfall traps plus dummy caterpillar attack rate. Transect run from 20 m into semi-natural habitat (negative distance increments) to 15 m into crop (positive distance increments), with the 0 m point representing the crop edge. Lines display model-fitted values and points show the raw data; circle points and solid lines represent plot 1, and triangle points and dashed lines represent plot 2 (see fig. 1c). (a) Araneae abundance (total number of individuals), (b) Araneae species richness (number of species), (c) Araneae diversity (inverse Simpsons Diversity Index, log scale), (d) Hymenoptera abundance (total number of individuals, (e) Hymenoptera species richness (number of species), (f) Hymenoptera diversity (inverse Simpsons Diversity Index), (g) proportion of dummy caterpillars attacked. Missing data points in (c) (circles at −20 and −5 m) and (f) (triangle at −10 m) are due to these traps having a Simpsons Diversity Index of 0 so these points were removed from the analysis.

Values of natural enemy metrics from UM2 pitfall trap and dummy caterpillar data, evaluated as the difference between −10 m and −15 m for semi-natural habitat samples, and between 5 m and 10 m for crop samples, for both plots

Values given are back-transformed from models fitted. Significance of variables on natural enemy metric are also given (– not significant, . P < 0.1, * P < 0.05, ** P < 0.01). For the full summary of model estimates, standard errors and R 2 values, see Supplementary Table 3.
a Eight intervals on the transect were sampled over across two plots, resulting in n = 16. Samples with zero individuals were removed from analyses of inverse Simpsons index.
Attack rate of dummy caterpillars placed in UM2 increased significantly with distance from crop edge in both the crop and semi-natural habitat (P < 0.05, Table 4, fig. 4g). Attack rate was significantly different between plots (P < 0.01). The model fitted very well, explaining a substantial amount of the variation in the data (R 2D, Dγ of 0.446, Supplementary Table 3).
Discussion
We found that apparent FAW herbivory on maize (mature at the point of observation) increased with distance from semi-natural habitat in the realistic conditions of smallholder fields (VM). Our daily monitoring of herbivory on young maize plants at the University of Ghana research farm (UM1) indicated that FAW damage changed from increasing to decreasing with distance from semi-natural habitat as the maize grew. Araneae activity, richness and diversity decreased with distance from semi-natural habitat over time in this crop, whilst Hymenoptera diversity increased. Further data from mature maize plots at the research farm (UM2) also found increased Hymenoptera richness and diversity, and dummy caterpillar attack rate, with distance from uncultivated ground at the crop edge.
The maize plots on the university farm were relatively small and the semi-natural habitat bordering these plots is not consistently representative of semi-natural habitat surrounding fields in rural villages, which can include complex matrices of grass, shrubs and small trees. We did not record the maize varieties grown or plant species composition of the semi-natural habitat bordering the plots in this study, which would have allowed us to further qualify our findings and evaluate the prevalence of alternate hosts for FAW surrounding crop fields. Our study suffers from low replication, the magnitude of the effects we identified was very small and the differences between the VM and UM sites make comparison of results difficult. However, our results are useful as preliminary indicators of trends in a data-poor region. There are few published studies from West Africa that consider the relationship between semi-natural habitat and natural enemy activity. A limited number of studies from the Americas consider the influence of extra-field characteristics (Wyckhuys and O'Neil, Reference Wyckhuys and O'Neil2007), weeds within crops (Altieri and Whitcomb, Reference Altieri and Whitcomb1980), and distance from semi-natural habitat (forest) (Sousa et al., Reference Sousa, Matos, Almeida and Teodoro2011) on natural enemy and FAW abundance. Successful biological control of crop pests can be highly context-specific (Tscharntke et al., Reference Tscharntke, Rand and Bianchi2005; Bianchi et al., Reference Bianchi, Booij and Tscharntke2006), so regional studies of FAW in sub-Saharan Africa are necessary to fill this important knowledge gap. Future research would benefit from ongoing sampling of a greater number of fields throughout the maize growing season, with some measure of surrounding habitat and landscape complexity included in analyses, as this has been shown to be significant for other crop pests in sub-Saharan Africa (Kebede et al., Reference Kebede, Bianchi, Baudron, Abraham and de Valença2018a, Reference Kebede, Baudron, Bianchi and Tittonell2018b).
While there are no published data from Africa, FAW abundance has been found to increase with distance from semi-natural habitat in the Americas (Sousa et al., Reference Sousa, Matos, Almeida and Teodoro2011), consistent with our VM results. This trend could be due to edge effects resulting in decreasing FAW abundance closer to a non-preferred habitat (Ries et al., Reference Ries, Fletcher, Battin and Sisk2004) or natural enemy pressure being greater near the field edge due to spillover of enemies from adjacent non-crop habitat (Bianchi et al., Reference Bianchi, Booij and Tscharntke2006). In contrast, the pattern of herbivore damage in UM1 is consistent with crop pests infesting the field from the edge, re-colonising following post-harvest clearance (Tscharntke et al., Reference Tscharntke, Rand and Bianchi2005). The distance-dependent difference in herbivory emerged from around day 10 (fig. 2b), corresponding to when FAW infestation is likely to have commenced; FAW frass – a characteristic sign of FAW infestation (Hruska and Gould, Reference Hruska and Gould1997; Goergen et al., Reference Goergen, Kumar, Sankung, Togola and Tamò2016; Jeger et al., Reference Jeger, Bragard, Caffier, Candresse, Chatzivassiliou, Dehnen-Schmutz, Gilioli, Gregoire, Miret, Navarro, Niere, Parnell, Potting, Rafoss, Rossi, Urek, Bruggen, Werf, West, Winter, Gardi, Aukhojee and MacLeod2017) – first appeared on leaves 11 days after planting. However, it is unlikely that the trend in herbivory we observed is due to a gradient in FAW infestation from the crop edge. Although some pest species may benefit from specific components of semi-natural vegetation (e.g. Baggen et al., Reference Baggen, Gurr and Meats1998), the primary source of most pest species are crop fields (Bianchi et al., Reference Bianchi, Booij and Tscharntke2006) and FAW adult females disperse long distances and oviposit directly onto maize throughout the field (Goergen et al., Reference Goergen, Kumar, Sankung, Togola and Tamò2016). Crop yield measurements would provide a more robust and economically relevant measure of the impact of FAW. The yield loss from leaf damage depends on the maize growth stage; early infestation causes the largest yield losses, but yield loss plateaus with increasing pest pressure in later growth stages (Evans and Stansly, Reference Evans and Stansly1990; Overton et al., Reference Overton, Maino, Day, Umina, Bett, Carnovale, Ekesi, Meagher and Reynolds2021). Other limitations of using leaf damage as a proxy for FAW abundance, particularly in the mature maize of the VM fields, include (i) inability to determine the maize growth stage when FAW attack occurred, (ii) difficulty distinguishing FAW leaf damage from other Lepidopteran crop pests, and (iii) leaf damage remaining in instances where FAW are removed by natural enemies. Despite its weaknesses, we feel leaf damage provided an adequate proxy to initially test our hypotheses and would seek to measure crop yields in future work.
The decrease in Araneae abundance with increased distance from edge in UM1, and similar findings in early samples of Hymenoptera, are consistent with theoretical and empirical evidence that natural enemies colonise crops from surrounding semi-natural habitat in fragmented landscapes (Kruess and Tscharntke, Reference Kruess and Tscharntke2000; Tscharntke et al., Reference Tscharntke, Rand and Bianchi2005; Bianchi et al., Reference Bianchi, Booij and Tscharntke2006; Sousa et al., Reference Sousa, Matos, Almeida and Teodoro2011). Semi-natural habitats can enable the persistence of natural enemies during inter-crop periods when pests are not present by providing: (i) a source of alternative plant hosts and prey and nectar sources (important for parasitoids), (ii) a favourable microclimate, (iii) refuge, and (iv) sites for hibernation (Tscharntke et al., Reference Tscharntke, Rand and Bianchi2005; Bianchi et al., Reference Bianchi, Booij and Tscharntke2006; Harrison et al., Reference Harrison, Thierfelder, Baudron, Chinwada, Midega, Schaffner and Berg2019). The subsequent reversal in trend for Hymenoptera in UM1 – consistent with the trends in Hymenoptera and dummy caterpillar attack rate in UM2 – is expected if natural enemies have moved from the semi-natural habitat and stayed in the crop as the maize grew, perhaps facilitated by the increased suitability of the crop as habitat and/or availability of crop pests as food sources. If this is the case, it is possible that Araneae are slower to move into the crop following the arrival of crop pests, or require a more developed crop to provide a suitable matrix, potentially explaining why we detected this trend reversal for Hymenoptera but not Araneae in UM1. Our results therefore highlight the influence of time since planting on the distribution of potential natural enemies with distance from semi-natural habitat. Early FAW infestation of maize results in the largest yield losses (Evans and Stansly, Reference Evans and Stansly1990), and our study found evidence of FAW infestation 11 days after planting. As such, natural enemies from semi-natural habitat surrounding crops may not effectively minimise yield loss if they do not disperse into the crop rapidly enough.
FAW infestations in sub-Saharan Africa are causing substantial damage to maize crops (Sisay et al., Reference Sisay, Simiyu, Mendesil, Likhayo, Ayalew, Mohamed, Subramanian and Tefera2019) with severe yield consequences (Njuguna et al., Reference Njuguna, Nethononda, Maredia, Mbabazi, Kachapulula, Rowe and Ndolo2021) in a context where food security is already of concern (FAO et al., Reference FAO, IFAD, UNICEF, WFP and WHO2019). Control of FAW to date is focusing almost exclusively on the use of synthetic insecticides (Harrison et al., Reference Harrison, Thierfelder, Baudron, Chinwada, Midega, Schaffner and Berg2019; Agboyi et al., Reference Agboyi, Goergen, Beseh, Mensah, Clottey, Glikpo, Buddie, Cafà, Offord, Day, Rwomushana and Kenis2020; Tambo et al., Reference Tambo, Kansiime, Mugambi, Rwomushana, Kenis, Day and Lamontagne-Godwin2020) despite recognition of the negative impacts of pesticide application on human health and the environment (Kansiime et al., Reference Kansiime, Mugambi, Rwomushana, Nunda, Lamontagne-Godwin, Rware, Phiri, Chipabika, Ndlovud and Day2019; Tambo et al., Reference Tambo, Kansiime, Mugambi, Rwomushana, Kenis, Day and Lamontagne-Godwin2020; Haggblade et al., Reference Haggblade, Diarra and Traoré2021). Enhancing landscape complexity by increasing the proximity of crops to semi-natural habitat has been suggested as a means to increase natural enemy predation of crop pests, both generally (Bianchi et al., Reference Bianchi, Booij and Tscharntke2006) and specifically for FAW (Harrison et al., Reference Harrison, Thierfelder, Baudron, Chinwada, Midega, Schaffner and Berg2019), thus reducing the need for synthetic insecticides as part of an integrated pest management approach. Our results support further investigation of changing maize field configuration to increase proximity of crops to semi-natural habitat (e.g. through dividing larger fields with semi-natural vegetation strips), to reduce FAW damage and increase natural enemy abundance and diversity within crops. Future work should assess the impact of such a strategy on maize yield, to ensure reductions in FAW damage translate into improved or safeguarded yields that more than compensate for potential loss of cropping area from habitat enhancement.
Conclusion
This study provides the first quantification of changes in FAW crop damage and activity of its potential natural enemies with distance from semi-natural habitat bordering maize crops in West Africa. We observed increased herbivore damage with distance from semi-natural habitat in a small sample of smallholder maize fields and provide initial evidence that abundance of some natural enemies declines with distance from semi-natural habitat in young maize around the time of FAW infestation – a particularly critical stage for reducing pest-mediated yield loss. Further work is required to quantify the extent to which natural enemy pressure reduces FAW abundance, and whether this occurs rapidly enough to prevent significant yield loss due to herbivore damage, before the effectiveness of such management practices as a means of improving food security can be assessed.
Supplementary material
The supplementary material for this article can be found at https://doi.org/10.1017/S0007485321000894
Acknowledgements
We would like to thank Miriam Mantey and Kurt Matey for assisting with fall armyworm larvae collection and rearing, and Dr Chris Terry for advice on statistical analysis. We would also like to thank the anonymous reviewers whose comments greatly improved the paper. This work was supported by funding from the Biotechnology and Biological Sciences Research Council (BBSRC) (grant number BB/M011224/1).
Conflict of interest
The authors declare none.


 Open access