


1. Introduction
Social media platforms have become essential tools for political communication, mobilization, and engagement in recent decades (Tucker et al., Reference Tucker, Guess, Barbera, Vaccari, Siegel, Sanovich, Stukal and Nyhan2018). With vast user communities generating real-time data, platforms such as Twitter,Footnote 1 Facebook, Reddit, and YouTube provide rich sources of behavioral information, including social networks and text, for analyzing political discourse around the world (Storck, Reference Storck2011; Grimmer and Stewart, Reference Grimmer and Stewart2013; Effing et al., Reference Effing, Van Hillegersberg and Huibers2011; De Francisci Morales et al., Reference De Francisci Morales, Monti and Starnini2021). One important application of these data is the measurement of political ideology among elites as well as the broader online public (Golbeck and Hansen, Reference Golbeck and Hansen2014; Barberá and Rivero, Reference Barberá and Rivero2015; Mosleh and Rand, Reference Mosleh and Rand2022).
Most approaches to studying ideological leanings rely on a single mode of data. While methods vary (see Section 2), they generally follow a common recipe: take a social network or a text corpus at a single point in time, embed the data, and project the embedding onto one or two latent dimensions (e.g., Figure 1). These approaches have performed well on massive volumes of network and text data (Himelboim et al., Reference Himelboim, Smith, Rainie, Shneiderman and Espina2017; Vafa et al., Reference Vafa, Naidu and Blei2020). A prominent example is Barberá et al. (Reference Barberá, Jost, Nagler, Tucker and Bonneau2015), who introduced a computationally tractable network-based algorithm that has since become standard. However, although such methods typically estimate static positions, their temporal consistency and their ability to distinguish extremists from moderates remain unclear.
The ideological spectrum often serves as a tool for understanding and categorizing political positions. Usually, it is more difficult to accurately estimate individuals who either have sparse data and are ambivalent about their political beliefs or, conversely, have popular connections from both sides and hold extreme political beliefs.

Meanwhile, high-profile political accounts attract large numbers of followers from across the spectrum, not necessarily because users agree with their views, but because they wish to monitor those messages. Similarly, controversial politicians may exhibit apparent shifts in estimated ideal points as their audiences change, even when their views remain stable. Consequently, estimating ideal points using only network information can be inconsistent for highly visible elites and for users with cross-cutting connections on social media (Figure 1).
Inspired by the work of Bail et al. (Reference Bail, Argyle, Brown, Bumpus, Chen, Hunzaker, Lee, Mann, Merhout and Volfovsky2018) on exposure to opposing views and polarization, we connect the network-based approach of Barberá et al. (Reference Barberá, Jost, Nagler, Tucker and Bonneau2015) with textual analysis to estimate ideology for both political elites and ordinary users over time. We propose a data-augmentation strategy that jointly leverages network and text data on a latent scale to improve reliability in practice. Our data include networks and posts from the Twitter accounts of 933 political elites and 1,176 experimental participants with self-reported party alignments, observed over five years. We argue that although networks may change for many reasons, language provides a stable source of ideological information and, as we show in simulations, facilitates ideal-point estimation.
Our results first verify that while network-based approaches provide reasonable estimates of ideological positions within a moderate left–right spectrum at a single point in time, these estimates can become inconsistent as the composition of elites’ and users’ networks evolves over time. Incorporating text information from users’ tweet content substantially improves the estimation of ideal points, particularly by better identifying political elites at the ideological extremes. Furthermore, when comparing across estimators, we find that the text-only approach based on word embeddings captures meaningful linguistic variation but lacks sufficient structural information to accurately distinguish moderate users. By contrast, our data-augmented (DA) estimator, which integrates both network and text data, achieves the most distinct and stable separation of ideological groups, outperforming single-source approaches.
The remainder of this paper proceeds as follows. First, we review background on the ideal-point estimation problem, with a particular focus on correspondence analysis (CA) and its limitations in practical applications. We then describe our motivating data, introduce the proposed joint modeling framework, and present supporting simulation evidence in Section 3. In Section 4, we apply our data-augmented estimation method and discuss ideal-point results for both American political elites and ordinary Twitter users. Finally, we conclude by summarizing our contributions and outlining directions for future work.
2. Estimating political ideology with behavioral data
Social media platforms serve as a rich and dynamic source of data for studying political opinions, attitudes, and behaviors in democratic polities (Garton et al., Reference Garton, Haythornthwaite and Wellman1997; Kavanaugh et al., Reference Kavanaugh, Fox, Sheetz, Yang, Li, Whalen, Shoemaker, Natsev and Xie2011). With rapid advances in technology and Internet accessibility, people around the world increasingly turn to social media to read news, express ideas, build connections, and engage in discussions about political and social issues (Wike et al., Reference Wike, Silver, Fetterolf, Huang, Austin, Clancy and Gubbala2022). This widespread engagement provides substantial opportunities for researchers across all disciplines to study political behavior using large-scale observational data.
In late 2017, Bail et al. (Reference Bail, Argyle, Brown, Bumpus, Chen, Hunzaker, Lee, Mann, Merhout and Volfovsky2018) conducted a large-scale experiment involving more than 1,600 Twitter users who identified as either Democrats or Republicans. The study sought to understand how exposure to different political perspectives on social media might influence participants’ political ideologies and, ultimately, patterns of political polarization in the United States. Participants were surveyed at the beginning and end of the experiment to assess treatment effects, and the study documented notable backfire effects, whereby exposure to opposing political views intensified partisan polarization. Nevertheless, these posttreatment ideological shifts are difficult to quantify formally and objectively. The lack of a standard measurement introduces both practical challenges and substantive concerns in analyzing outcomes. Our study is motivated by the need for a reliable and consistent approach to estimating ideological positions.
2.1 Understanding ideology through social media
Over the past several decades, the scholarly study of ideal-point estimation has gained significant traction, drawing contributions from multiple disciplines. These efforts have helped formalize ideal points as quantitative representations of latent preferences within a policy or issue space (Martin and Quinn, Reference Martin and Quinn2002). This conceptualization is particularly salient because it aligns with how political dimensions, such as the left–right spectrum, are commonly understood in spatial terms (Shor and McCarty, Reference Shor and McCarty2011; Laver, Reference Laver2014).
Advances in statistical methodology have enabled researchers to model ideal points in multidimensional spaces using a variety of approaches, including logistic regression (Wasserman and Pattison, Reference Wasserman and Pattison1996), covariate-based mixed-effects models (Bailey, Reference Bailey2001), item response theory (Clinton et al., Reference Clinton, Jackman and Rivers2004; Martin and Quinn, Reference Martin and Quinn2002), multinomial models (Goplerud, Reference Goplerud2019), and discriminant analysis (Takane et al., Reference Takane, Bozdogan and Shibayama1987). At the same time, concerns regarding the strict assumptions and complexity of traditional models have also motivated the development of nonparametric alternatives (Tahk, Reference Tahk2018).
With increasingly sophisticated strategies for estimating ideal points from public records and known network ties, researchers have gained deeper insight into the ideological spectrum of political elites. While congressional polarization has become a stylized fact in the United States (Hill and Tausanovitch, Reference Hill and Tausanovitch2015), the ideal points of the general public have attracted growing interest, especially with the proliferation of large-scale data on political opinions (Imai et al., Reference Imai, Lo and Olmsted2016; Barberá et al., Reference Barberá, Casas, Nagler, Egan, Bonneau, Jost and Tucker2019). More recent techniques, including social network analysis (Himelboim et al., Reference Himelboim, Smith, Rainie, Shneiderman and Espina2017), topic modeling via latent Dirichlet allocation (Greene and Cross, Reference Greene and Cross2017; Kherwa and Bansal, Reference Kherwa and Bansal2019), variational EM algorithms (Imai et al., Reference Imai, Lo and Olmsted2016; Slapin and Proksch, Reference Slapin and Proksch2008), and machine learning–based sentiment analysis (Hasan et al., Reference Hasan, Moin, Karim and Shamshirband2018), have expanded the toolkit for estimating ideological positions among broad populations of social media users. A foundational contribution in this area is Barberá (Reference Barberá2015), who developed a Bayesian spatial-following model to estimate ideal points for large samples of both elite and regular Twitter users in the United States and several European countries.
Building on prior work using latent-space models for networks and related positional estimates (Hoff et al., Reference Hoff, Raftery and Handcock2002; Shortreed et al., Reference Shortreed, Handcock and Hoff2006), Barberá (Reference Barberá2015) argue that ideology can be represented as a continuous latent variable along a multidimensional ideological spectrum. Individual point estimates are obtained by locating users within a low-dimensional ideological space. Their method employs a logit model that characterizes the probability that a user follows a given political account. The formulation relies on the idea that users tend to follow elites with similar ideological positions and engage with their content (Enelow and Hinich, Reference Enelow and Hinich1984). In this setting, political elites refer to influential Twitter accounts whose followership patterns provide strong discriminatory power for predicting users’ ideological orientations.
2.2 Correspondence analysis
While the Bayesian spatial-modeling approach to ideal-point estimation is valued for its flexibility in incorporating prior information and quantifying uncertainty (Bafumi et al., Reference Bafumi, Gelman, Park and Kaplan2005), its reliance on Markov chain Monte Carlo (MCMC) sampling makes it less practical for large-scale social network applications (Barberá, Reference Barberá2015). To facilitate the analysis of large user networks while preserving interpretability and comparability, Barberá et al. (Reference Barberá, Jost, Nagler, Tucker and Bonneau2015) proposed using CA to project users onto a latent ideological space as a scalable alternative to a full Bayesian estimation framework.
Correspondence analysis has since been widely used to quantify and visualize the political ideology of social media users (Lozza et al., Reference Lozza, Kastlunger, Tagliabue and Kirchler2013; Lai et al., Reference Lai, Brown, Bisbee, Bonneau, Tucker and Nagler2022). Broadly speaking, CA is a statistical technique for uncovering associations between categorical variables, including political attitudes and preferences (Pack and Jolliffe, Reference Pack and Jolliffe1992; Kroonenberg and Greenacre, Reference Kroonenberg and Greenacre2004; Nenadic and Greenacre, Reference Nenadic and Greenacre2007). The CA framework builds upon the same log-linear latent-space model that underlies network-based ideal-point estimation. Specifically, users’ connections on Twitter are treated as indicators of similarity and used to construct a correspondence matrix (Barberá et al., Reference Barberá, Jost, Nagler, Tucker and Bonneau2015). Applying singular value decomposition (SVD) to the matrix of standardized residuals yields a low-dimensional ideological subspace that captures the strongest systematic associations in the data. Projecting users onto this subspace produces coordinates representing their estimated ideological positions. Empirical evidence suggests that these CA-based latent positions are highly correlated with those obtained from Bayesian MCMC methods, offering a conceptually aligned yet more interpretable and computationally efficient alternative (Lowe, Reference Lowe2008; Barberá et al., Reference Barberá, Jost, Nagler, Tucker and Bonneau2015).
2.3 Toward a comprehensive approach: joint network- and text-based estimation
Over time, with the rapid proliferation of social network site data, Barberá (Reference Barberá2015) has become one of the most widely adopted methods in the field. It has been replicated and extended across a range of substantive areas, including protest survey analysis (Barrie and Frey, Reference Barrie and Frey2021), environmental discourse (Chang et al., Reference Chang, Armsworth and Masuda2022), and public health misinformation (Borghouts et al., Reference Borghouts, Huang, Gibbs, Hopfer, Li and Mark2023). Examining the political landscape of the lower house of the Polish legislature, Ecker (Reference Ecker2017) found empirical support for the relationship between Twitter network–based policy position estimates and politicians’ individual voting records. Similarly, Souza et al. (Reference Souza, Graça and Silva2017) applied the approach to the 2014 Brazilian elections, showing that network-based estimates for federal deputies were broadly consistent with roll-call–based measures, although interpreting ideological distances within a highly fragmented legislature remained challenging.
To further evaluate reliability, Barberá (Reference Barberá2015) and Jost et al. (Reference Jost, Barberá, Bonneau, Langer, Metzger, Nagler, Sterling and Tucker2018) demonstrated that follower-based ideal-point estimates for both elites and ordinary users correlate strongly with conventional measures of ideology, such as DW-NOMINATE scores and party registration records (Heller and Mershon, Reference Heller and Mershon2009). Ramaciotti Morales and Muñoz Zolotoochin (Reference Ramaciotti Morales and Muñoz Zolotoochin2022) also found that CA-based estimates largely align with classifications generated by language models using users’ Twitter bios, though their study did not integrate network and text information into a single modeling framework.
A key gap in the existing literature concerns the temporal stability of the CA estimates. Social media networks are highly dynamic and evolve rapidly, yet most applications estimate ideal points at a single static time point. As a result, little is known about the consistency of applying a CA model constructed from elites’ networks at one time to the networks of ordinary users observed at another. This lack of temporal robustness motivates the need for methods that jointly leverage multiple behavioral signals and better accommodate the evolving nature of online social networks.
Moreover, the accuracy of network-based approaches faces limitations in settings where social connections alone are insufficient to reveal true ideological positions. For example, a well-known and socially active political figure located at an ideological extreme may be estimated near the center because they attract followers across the entire spectrum. In such cases, the complexity of social networks can obscure meaningful signals, whereas the textual content of users’ tweets may provide a more direct indicator of ideological orientation. The text-based ideal-point model of Vafa et al. (Reference Vafa, Naidu and Blei2020) exemplifies this approach, using an unsupervised probabilistic topic model to identify latent topics and estimate ideal points based on political texts. In parallel, advances in automated text analysis have opened new avenues for recovering latent traits from political discourse, with increasing attention to measurement validity and theoretical grounding (Schoonvelde et al., Reference Schoonvelde, Schumacher and Bakker2019). Researchers have now applied a range of natural language processing techniques to extract ideological cues from tweets, including keyword usage, sentiment, topic structure, and linguistic features (Spell et al., Reference Spell, Guay, Hillygus and Carin2020; Wu et al., Reference Wu, Nagler, Tucker and Messing2023; Chao et al., Reference Chao, Molitor, Needell and Porter2022). These developments highlight the promise of text as a complementary source of information for ideal-point estimation, a direction we aim to extend in this paper.
Despite substantial progress, existing research has not fully leveraged the combined value of text and network data from online platforms. Most studies analyze either textual content or interaction patterns in isolation rather than integrating both sources. A closely related contribution is Kim et al. (Reference Kim, Londregan and Ratkovic2018), who proposed a supervised joint model of text and voting data to estimate legislators’ positions, linking roll-call votes and speech text through a generalized method of moments estimator in a shared latent space. However, this approach relies on the availability of ground-truth votes and does not recover latent preferences directly from behaviorally generated relational and textual signals.
Given the complexity and richness of social media discourse, integrating both the content of communication and the structure of user connections has the potential to generate more accurate and comprehensive measures of political ideology. These gaps in the literature present an important opportunity for our research to capture a more complete picture of political sentiment and positioning on social media.
3. Data & ideal point estimation method
3.1 Twitter data
The data used in this study originate from Bail et al. (Reference Bail, Argyle, Brown, Bumpus, Chen, Hunzaker, Lee, Mann, Merhout and Volfovsky2018) and include Twitter network and text data (tweet timelines) spanning from 2017 through 2022. For our analysis, we focus on a subset of 933 political elites and 1,176 experimental participants with complete follow-ups. The original study used survey responses to infer participants’ ideological positions; here, we estimate ideal points as an alternative continuous measure of ideology and validate these estimates against elites’ known political affiliations and respondents’ self-reported party alignments. In addition to party identification, we retain covariates such as age, gender, frequency of Twitter use, and interest in political news for downstream analyses, allowing further examination of the determinants of ideological positioning and change.
To complement the original dataset, we collected updated Twitter information for the same participants and elites in 2022. Using the Twitter Application Programming Interface (API), we retrieved (1) follower and following relationships between participants and elites and (2) up to the most recent 2,000 tweets per account to comply with standard API rate limits. Data collection was conducted between October and November 2022, ensuring cross-sectional consistency and avoiding artifacts from repeated querying. All publicly available tweets within the API limit were included, allowing for consistent comparison across accounts and facilitating the construction of user-level word-occurrence matrices and updated network graphs for ideal-point estimation.
Due to privacy settings, account deletions, and suspensions, not all individuals’ data were retrievable through the API. These missing cases are discussed in more detail in Section 4.1 and Appendix A.
3.2 Data-augmented estimation framework
This subsection introduces a unified framework for the joint estimation of users’ ideal points from both network and text information. We first formalize the latent factor model in scalar notation consistent with standard ideal-point frameworks, then describe its spectral estimation procedure and algorithmic implementation.
3.2.1 Observed data and notation
Let there be
 $N$
users (indexed by
$N$
users (indexed by
 $i$
),
$i$
),
 $J$
political elites (indexed by
$J$
political elites (indexed by
 $j$
), and a vocabulary of
$j$
), and a vocabulary of
 $K$
words (indexed by
$K$
words (indexed by
 $k$
). For each user, we observe two behavioral signals:
$k$
). For each user, we observe two behavioral signals:
-
• Network follows:
 $y_{ij} \in \{0,1\}$
indicates whether user
$i$
follows elite
$j$
.
$y_{ij} \in \{0,1\}$
indicates whether user
$i$
follows elite
$j$
. -
• Word usage:
$w_{ik} \in \{0,1\}$
indicates whether user
$i$
uses word
$k$
at least once in their tweet history (extensions to word frequency or counts are also compatible and straightforward).


3.2.2 Latent structure and observation models
Each user
 $i$
has an unobserved one-dimensional ideal point
$i$
has an unobserved one-dimensional ideal point
 $u_i \in \mathbb{R}$
representing ideological preference. Each elite
$u_i \in \mathbb{R}$
representing ideological preference. Each elite
 $j$
and word
$j$
and word
 $k$
has a corresponding discrimination parameter
$k$
has a corresponding discrimination parameter
 $v^{(Y)}_j$
and
$v^{(Y)}_j$
and
 $v^{(W)}_k$
, measuring how strongly it differentiates along the ideological dimension. Intercepts
$v^{(W)}_k$
, measuring how strongly it differentiates along the ideological dimension. Intercepts
 $\alpha$
and
$\alpha$
and
 $\beta$
capture baseline tendencies in following or word use.
$\beta$
capture baseline tendencies in following or word use.
Network model
. For each user–elite pair
 $(i,j)$
,
$(i,j)$
,
 \begin{equation*} \Pr \Big(y_{ij}=1 \mid u_i, v^{(Y)}_j, \alpha ^{(Y)}_j, \beta ^{(Y)}_i\Big) = \sigma \!\left (\alpha ^{(Y)}_j + \beta ^{(Y)}_i + u_i\,v^{(Y)}_j\right ), \end{equation*}
where
 $\sigma (\! \cdot \!)$
denotes a logistic or probit link. Users are more likely to follow elites whose estimated positions
$\sigma (\! \cdot \!)$
denotes a logistic or probit link. Users are more likely to follow elites whose estimated positions
 $v^{(Y)}_j$
align with user ideological preference
$v^{(Y)}_j$
align with user ideological preference
 $u_i$
.
$u_i$
.
Text model
. For each user–word pair
 $(i,k)$
,
$(i,k)$
,
 \begin{equation*} \Pr \Big(w_{ik}=1 \mid u_i, v^{(W)}_k, \alpha ^{(W)}_k, \beta ^{(W)}_i\Big) = \sigma \!\left (\alpha ^{(W)}_k + \beta ^{(W)}_i + u_i\,v^{(W)}_k\right ), \end{equation*}
so that ideologically distinctive words have loadings
 $v^{(W)}_k$
whose sign and magnitude correspond to their political orientation and salience.
$v^{(W)}_k$
whose sign and magnitude correspond to their political orientation and salience.
Conditional independence
. Conditional on
 $u_i$
and the item parameters,
$u_i$
and the item parameters,
 $\{y_{ij}\}$
and
$\{y_{ij}\}$
and
 $\{w_{ik}\}$
are independent. This single-trait structure follows the convention of ideal-point and item-response models: both modalities serve as noisy but complementary indicators of the same latent ideology
$\{w_{ik}\}$
are independent. This single-trait structure follows the convention of ideal-point and item-response models: both modalities serve as noisy but complementary indicators of the same latent ideology
 $u_i$
(Bafumi et al., Reference Bafumi, Gelman, Park and Kaplan2005).
$u_i$
(Bafumi et al., Reference Bafumi, Gelman, Park and Kaplan2005).
Identification and interpretation
. The model is invariant to sign and scale transformations of
 $u_i$
and
$u_i$
and
 $v^{(\! \cdot \!)}$
. We orient the latent scale so that right-leaning (Republican) elites have positive loadings on average and standardize estimated user scores
$v^{(\! \cdot \!)}$
. We orient the latent scale so that right-leaning (Republican) elites have positive loadings on average and standardize estimated user scores
 $\hat {\gamma }_i$
to have mean 0 and variance 1. The resulting dimension is interpreted as a left–right ideological continuum.
$\hat {\gamma }_i$
to have mean 0 and variance 1. The resulting dimension is interpreted as a left–right ideological continuum.
3.2.3 Spectral surrogate estimation and implementation
We adopt a spectral surrogate approach that approximates the latent structure by leveraging the leading eigenvectors of user–user similarity matrices. This method is mathematically equivalent to analyzing the eigenvectors of the normalized graph Laplacian constructed from the network and text similarity graphs, a standard technique in spectral graph theory that recovers low-dimensional embeddings of nodes based on shared connectivity patterns (Binkiewicz et al., Reference Binkiewicz, Vogelstein and Rohe2017). Under standard latent factor assumptions, this spectral representation consistently recovers the principal latent dimension corresponding to users’ ideological orientation.
Conceptual overview . The key intuition is that two users are ideologically similar if they (i) follow similar sets of political elites, and (ii) use similar language in their tweets. These relationships are expressed in two matrices:
-
• The network/correspondence matrix,
$\textbf{Y}\in \{0,1\}^{N\times J}$
, where each element
$y_{ij}=1$
indicates that user
$i$
follows elite
$j$
. -
• The word/text matrix,
$\textbf{W}\in \{0,1\}^{N\times K}$
, where each element
$w_{ik}=1$
indicates that user
$i$
has used word
$k$
at least once in their tweet history.


From these, we derive user–user similarity matrices based on co-following and co-word usage patterns:
 \begin{equation*} \textbf{S}_Y = \textbf{Y}\textbf{Y}^\top , \qquad \textbf{S}_W = \textbf{W}\textbf{W}^\top . \end{equation*}
Each entry
 $(i,i')$
in
$(i,i')$
in
 $\textbf{S}_Y$
or
$\textbf{S}_Y$
or
 $\textbf{S}_W$
represents the degree of similarity between users
$\textbf{S}_W$
represents the degree of similarity between users
 $i$
and
$i$
and
 $i'$
in their following or language behavior.
$i'$
in their following or language behavior.
Normalization and aggregation
. Because
 $\textbf{S}_Y$
and
$\textbf{S}_Y$
and
 $\textbf{S}_W$
may differ substantially in scale and degree, we apply symmetric degree normalization to each:
$\textbf{S}_W$
may differ substantially in scale and degree, we apply symmetric degree normalization to each:
 \begin{equation*} \tilde {\textbf{S}}_Y = \textbf{D}_Y^{-1/2}\,\textbf{S}_Y\,\textbf{D}_Y^{-1/2}, \qquad \tilde {\textbf{S}}_W = \textbf{D}_W^{-1/2}\,\textbf{S}_W\,\textbf{D}_W^{-1/2}, \end{equation*}
where
 $\textbf{D}_Y$
and
$\textbf{D}_Y$
and
 $\textbf{D}_W$
are diagonal matrices of row sums of
$\textbf{D}_W$
are diagonal matrices of row sums of
 $\textbf{S}_Y$
and
$\textbf{S}_Y$
and
 $\textbf{S}_W$
, respectively. This degree normalization improves comparability across modalities and mitigates the influence of high-degree users or very common words. The two normalized similarities are then aggregated:
$\textbf{S}_W$
, respectively. This degree normalization improves comparability across modalities and mitigates the influence of high-degree users or very common words. The two normalized similarities are then aggregated:
 \begin{equation*} \textbf{X} = \tilde {\textbf{S}}_Y + \tilde {\textbf{S}}_W, \end{equation*}
placing equal weight on behavioral and textual similarity. More generally, users may introduce a tuning parameter
 $\lambda$
and consider
$\lambda$
and consider
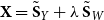 $\textbf{X} = \tilde {\textbf{S}}_Y + \lambda \,\tilde {\textbf{S}}_W$
to up- or down-weight the text modality.
$\textbf{X} = \tilde {\textbf{S}}_Y + \lambda \,\tilde {\textbf{S}}_W$
to up- or down-weight the text modality.
Spectral extraction
. The eigenstructure of
 $\textbf{X}$
captures the principal dimensions of latent variation across users. The first eigenvector primarily reflects overall activity or popularity, while the second eigenvector captures the dominant non-trivial axis of variation, interpreted as the ideological dimension. Standardizing the second eigenvector yields the estimated ideal points:
$\textbf{X}$
captures the principal dimensions of latent variation across users. The first eigenvector primarily reflects overall activity or popularity, while the second eigenvector captures the dominant non-trivial axis of variation, interpreted as the ideological dimension. Standardizing the second eigenvector yields the estimated ideal points:
 \begin{equation*} \hat {\gamma } = \mathrm{Standardize}\ \!\big (v_2(\textbf{X})\big ), \end{equation*}
where
 $v_2(\textbf{X})$
denotes the second eigenvector of
$v_2(\textbf{X})$
denotes the second eigenvector of
 $\textbf{X}$
. Sign orientation is fixed such that right-leaning elites have positive mean scores.
$\textbf{X}$
. Sign orientation is fixed such that right-leaning elites have positive mean scores.
This spectral approximation offers an efficient and interpretable procedure for large-scale data integration, capturing the joint structure of users’ ideological behavior across both network and linguistic dimensions. The complete estimation pipeline is summarized below.
Data-Augmented (DA) Ideal-Point Estimation

3.2.4 Relation to correspondence analysis
CA applied to a user–elite matrix represents the network-only special case of the proposed model with
 $\lambda =0$
. The CA method embeds users and elites into a low-dimensional space by decomposing standardized residuals of follows. Our data-augmented approach generalizes this by incorporating an additional, conditionally independent source of information, the linguistic content of users’ tweets, into the same latent space. Both modalities are modeled as functions of the same underlying ideological dimension, and their integration aims to enhance identification, particularly at the ideological extremes.
$\lambda =0$
. The CA method embeds users and elites into a low-dimensional space by decomposing standardized residuals of follows. Our data-augmented approach generalizes this by incorporating an additional, conditionally independent source of information, the linguistic content of users’ tweets, into the same latent space. Both modalities are modeled as functions of the same underlying ideological dimension, and their integration aims to enhance identification, particularly at the ideological extremes.
3.3 Empirical evidence of the joint modeling approach
Before applying the proposed joint model to the collected data, we present a simulation study to evaluate its ability to recover latent ideological positions from multiple data sources. The simulation demonstrates both the consistency of the data-augmented estimator under the model assumptions and its improved identification of ideological extremes compared to single-source estimators. For simplicity, ideology is again assumed to be a one-dimensional unobserved trait.
Data generation process
. We first simulated
 $N = 100$
users with latent ideological positions drawn independently from a uniform distribution:
$N = 100$
users with latent ideological positions drawn independently from a uniform distribution:
 \begin{equation*} u_i \overset {\text{i.i.d.}}{\sim } \mathrm{Unif}(-5,5), \quad i = 1,\ldots ,N. \end{equation*}
The vector
 $\textbf{U} = (u_1, \ldots , u_n)^\top$
was sorted in ascending order to facilitate examination of extreme positions. For each of
$\textbf{U} = (u_1, \ldots , u_n)^\top$
was sorted in ascending order to facilitate examination of extreme positions. For each of
 $S$
potential data sources (representing different types of behavioral signals), we generated:
$S$
potential data sources (representing different types of behavioral signals), we generated:
 \begin{equation*} D_s \overset {\text{i.i.d.}}{\sim } \mathcal{N}(0,1), \quad \textbf{V}_s = (v_{s1}, \ldots , v_{sn})^\top \overset {\text{i.i.d.}}{\sim } \mathrm{Unif}(-1,1), \quad s = 1,\ldots ,S. \end{equation*}
Each binary observation matrix
 $\textbf{A}_s$
was generated via a probit model with Gaussian noise:
$\textbf{A}_s$
was generated via a probit model with Gaussian noise:
 \begin{align*} \textbf{A}_{s}^{\text{raw}} &= \textbf{U} D_s \textbf{V}_{s}^\top + \mathbf{\Sigma }_s, \quad [\mathbf{\Sigma }_{s}]_{ij} \overset {\text{i.i.d.}}{\sim } \mathcal{N}(0,1), \\[5pt] \textbf{A}_{s} &= \mathbb{I}(\textbf{A}_{s}^{\text{raw}} \gt 0), \end{align*}
where
 $\mathbb{I}(\! \cdot \!)$
is the indicator function. This setup produced
$\mathbb{I}(\! \cdot \!)$
is the indicator function. This setup produced
 $S$
distinct binary matrices that share the same latent ideological dimension
$S$
distinct binary matrices that share the same latent ideological dimension
 $\textbf{U}$
.
$\textbf{U}$
.
Illustration of real data structure
. In the real-data analysis, two such matrices are observed: (1) the adjacency matrix
 $\textbf{Y}$
, describing user–elite follows; and (2) the word-occurrence matrix
$\textbf{Y}$
, describing user–elite follows; and (2) the word-occurrence matrix
 $\textbf{W}$
, describing users’ language use. To illustrate their structure from our Twitter data:
$\textbf{W}$
, describing users’ language use. To illustrate their structure from our Twitter data:
 \begin{equation} \begin{aligned} \begin{array}{ccccc} \text{Adjacency matrix} & \text{ @JoeBiden } & \text{ @BarackObama } & \text{ @realDonaldTrump } & \ \ldots \\ \text{@user1} & 1 & 1 & 0 & \ \ldots \\ \text{@user2} & 1 & 0 & 1& \ \ldots \\ \text{@user3} & 0 & 0 & 1 & \ \ldots \\ \vdots \end{array} \\ \begin{array}{cccccc} \text{Word occurrence matrix} & \text{ american } & \text{ civilrights } & \text{ government } & \text{ justice } & \ldots \\ \text{@user1} & 0 & 1 & 0 & 0& \ \ldots \\ \text{@user2} & 1 & 0 & 1& 1& \ \ldots \\ \text{@user3} & 1 & 0 & 1 & 1& \ \ldots \\ \vdots \end{array} \end{aligned} \end{equation}
Each entry of
 $\textbf{Y}$
indicates whether a user follows a given elite, and each entry of
$\textbf{Y}$
indicates whether a user follows a given elite, and each entry of
 $\textbf{W}$
indicates whether a user employs a specific word in their tweets. Both matrices are therefore sparse, high-dimensional representations of observable online behavior reflecting underlying ideological preferences.
$\textbf{W}$
indicates whether a user employs a specific word in their tweets. Both matrices are therefore sparse, high-dimensional representations of observable online behavior reflecting underlying ideological preferences.
Estimators of latent traits
. Assuming that all data sources measure the same latent ideology, the ideal estimator would aggregate across sources to reconstruct
 $\textbf{U}$
. We could then approximate this through the spectral aggregation of cross-product similarity matrices:
$\textbf{U}$
. We could then approximate this through the spectral aggregation of cross-product similarity matrices:
 \begin{equation*} \hat {\gamma }_S = v_2\!\left (\sum _{s=1}^S \textbf{A}_s \textbf{A}_s^\top \right ), \end{equation*}
where
 $v_2(\! \cdot \!)$
denotes the second eigenvector of the summed similarity matrix. The first eigenvector captures overall activity or popularity, while the second captures the dominant ideological dimension. Following Krzakala et al. (Reference Krzakala, Moore, Mossel, Neeman, Sly, Zdeborová and Zhang2013), the second eigenvector of a normalized similarity matrix is maximally correlated with the true latent structure in sparse settings.
$v_2(\! \cdot \!)$
denotes the second eigenvector of the summed similarity matrix. The first eigenvector captures overall activity or popularity, while the second captures the dominant ideological dimension. Following Krzakala et al. (Reference Krzakala, Moore, Mossel, Neeman, Sly, Zdeborová and Zhang2013), the second eigenvector of a normalized similarity matrix is maximally correlated with the true latent structure in sparse settings.
In our study, this corresponds to using both
 $\textbf{Y}$
(network ties) and
$\textbf{Y}$
(network ties) and
 $\textbf{W}$
(text features) to estimate ideal points. Reliable estimation is achieved even with moderate sample sizes (
$\textbf{W}$
(text features) to estimate ideal points. Reliable estimation is achieved even with moderate sample sizes (
 $N=100$
), and aggregation across modalities substantially improves the recovery of ideological extremes.
$N=100$
), and aggregation across modalities substantially improves the recovery of ideological extremes.
Simulation evidence supporting the data-augmented estimator. The top row shows all users, illustrating how adding more sources, from
 $\textbf{A}_1\textbf{A}_1^{\top }$
to
$\textbf{A}_1\textbf{A}_1^{\top }$
to
 $\sum _{s=1}^{10}\textbf{A}_s\textbf{A}_s^{\top }$
, improves alignment with the true latent ideal points
$\sum _{s=1}^{10}\textbf{A}_s\textbf{A}_s^{\top }$
, improves alignment with the true latent ideal points
 $\textbf{U}$
. The bottom row focuses on the upper tail (the 25 most extreme users), showing that the aggregated estimator better preserves the ordering of ideological extremes (highlighted in red).
$\textbf{U}$
. The bottom row focuses on the upper tail (the 25 most extreme users), showing that the aggregated estimator better preserves the ordering of ideological extremes (highlighted in red).

The simulation results shown in Figure 2 and Appendix B demonstrate that:
-
• The second eigenvector derived from a single source (
$\hat {\gamma }_1$
) provides a noisy but informative approximation of the latent ideology
$\textbf{U}$
. -
• Aggregating information from multiple sources markedly enhances estimation accuracy and stability, especially in identifying extreme ideological positions.


This simulation parallels our empirical setting, where
 $\textbf{Y}$
and
$\textbf{Y}$
and
 $\textbf{W}$
represent distinct yet complementary manifestations of users’ political behavior. By aggregating information from both, the data-augmented estimator yields more precise and interpretable estimates of the latent ideological dimension, particularly at the extremes of the political spectrum.
$\textbf{W}$
represent distinct yet complementary manifestations of users’ political behavior. By aggregating information from both, the data-augmented estimator yields more precise and interpretable estimates of the latent ideological dimension, particularly at the extremes of the political spectrum.
3.4 Comparison with word–embedding approaches
We also explored an alternative variant of the textual input using TF-IDF–SVD embeddings (Ramos, Reference Ramos2003; Kadhim et al., Reference Kadhim, Cheah, Hieder and Ali2017), described in detail in Section 4.3 and Appendix D. This analysis was conducted in parallel to confirm the robustness of our original word-occurrence-based approach and provide additional visualization of ideological structure.
To further benchmark our proposed approach, we conducted an additional robustness analysis using a standard neural word-embedding model. Specifically, we trained a skip-gram word2vec model (Mikolov et al., Reference Mikolov, Chen, Corrado and Dean2013) on the corpus of tweets posted by the same set of accounts (detailed implementation steps are provided in Appendix E). Each user’s tweet text was represented as a bag-of-words distribution, and we derived their text-based embeddings by taking Smooth Inverse Frequency (SIF), the weighted averages of the learned word vectors (Arora et al., Reference Arora, Liang and Ma2017). The resulting user-level embeddings were used to compute cosine similarity between users, followed by degree normalization to form a Laplacian matrix. The second eigenvector of this matrix provides text-only ideal point estimates, analogous to the CA and DA methods. This procedure serves as a contemporary text-encoding benchmark that captures semantic regularities in language and allows for a comparison with our data-augmented estimator.
4. Results
4.1 Data availability
The availability of longitudinal Twitter user data has continued to decline over recent years due to platform policy changes and user behavior shifts, making it increasingly difficult to track participants’ current information. While Bail et al. (Reference Bail, Argyle, Brown, Bumpus, Chen, Hunzaker, Lee, Mann, Merhout and Volfovsky2018) originally recruited 1,176 participants, 335 accounts either restricted data access or were deactivated by 2022. Another 137 participants did not follow sufficient elite accounts for reliable ideal point estimation using network data. This attrition results in a final sample of 704 users with valid ideal point estimates.
Figures 9 and 10 (Appendix A) compare excluded versus analyzed participants. Three patterns of missingness emerge here: First, excluded users show significantly lower baseline Twitter activity in initial surveys. Second, while party affiliation remains balanced among excluded participants, the analyzed sample skews Democratic (62% Democratic vs. 38% Republican). Lastly, the experimental groups maintain balance within parties, comprising 439 Democrats (175 control, 264 treatment) and 265 Republicans (107 control, 158 treatment).
4.2 Elite ideology over time
One primary concern with the previous correspondence analysis method for estimating ideal points is its consistency in projecting users onto the ideological plane over time. For instance, the U.S. political landscape and the key elites shaping it had evolved considerably from 2017 to 2022. The original CA method relied on a reference set of 1,186 elites whose Twitter data were collected in 2015, and subsequent analyses, as well as related applied work, have continued to use this same reference set (Barrie and Frey, Reference Barrie and Frey2021; Chang et al., Reference Chang, Armsworth and Masuda2022). This reliance on outdated elite ideal points as a reference risks introducing inaccuracies and inconsistencies in the analysis.
To address this issue, we compiled an updated list of 933 elites and collected their Twitter network and text data by the end of 2022 to serve as the new reference for estimating the ideal points. In our method, we define “elites” more broadly than the tweetscore package, which focuses primarily on elected officials such as congressional representatives. Our dataset includes both elected political elites (e.g., members of Congress) and non-elected elites, such as prominent journalists, think tank scholars, and political commentators. These accounts are typically verified, have large follower bases, and are frequently cited or retweeted in political discourse.
For identification purposes, positive ideal points are again assigned to right-leaning and conservative ideological traits, while negative values correspond to liberal traits. Figure 3 shows that updating the reference data leads to a significant change in the estimation of ideal points: a number of Democrats who were previously misestimated (located in the upper left quadrant) now have negative ideal points, indicating improved alignment of the ideal point estimates with self-identified ideology. This improvement supports using an up-to-date reference dataset that corresponds to the target estimations. In Figure 12 (Appendix C), we observe that the new estimates provide a greater separation in the distributions of the estimated ideal points between left and right-leaning individuals. Nevertheless, some discrepancies remain between the estimations and users’ self-reported party affiliations. Notably, some users who self-identify as Democrats continue to be estimated with relatively high positive values across both methods. This finding highlights the inherent challenges of relying solely on network data for ideal point estimation, particularly for users who follow a diverse array of elites.
Point estimations of 704 participants’ ideal points using the CA method with different reference data. Points are colored according to users’ self-reported party affiliations (blue = Democrat, red = Republican).

While pinpointing the exact causes of inconsistencies in ordinary users’ ideal points over time is challenging without more detailed personal data, the ideal points of prominent political figures are generally expected to remain stable and consistent with public perception. Nevertheless, we observe clear shifts in the CA-estimated ideal points of elite accounts that do not align with their established ideological positions. For instance, Table 1 shows that the ideal points for @JoeBiden, @sensanders, and @HillaryClinton shifted approximately 50% towards zero between the network data collected in 2015 and 2022. This change does not necessarily reflect a true ideological shift among these Democrat political elites; rather, it may result from the substantial changes in the composition of their follower base, which now encompasses a broader range of ideological backgrounds (Eady et al., Reference Eady, Nagler, Guess, Zilinsky and Tucker2019).
Selected elites’ twitter accounts with their ideal point estimates and number of followers taken based on network data collected in 2015 and 2022

4.3 Highlighting ideological extremes through network and text data
Here, we compare three estimation approaches for elite ideal points: (1) the proposed DA estimator that integrates both network and text information; (2) the baseline CA estimator that relies solely on network data; and (3) the word-embedding–based estimator that directly uses textual information learned from tweet corpora via a word2vec skip-gram model. Figure 4 shows the distributions of the estimated ideal points across Democratic, Republican, and Independent elites for each method. The figure illustrates clear differences in the ideological separation produced by each estimator. The CA method (blue) yields relatively compressed distributions, reflecting its limited ability to distinguish elites who share overlapping followers. The word-embedding method (yellow) incorporates linguistic signals from tweet contents and shows improvements over the CA, revealing more nuanced variations in word usages especially among moderates. Our DA estimator (pink), which jointly models network and text data, shows the most distinct ideological polarization, with clear separation between Democratic and Republican distributions and a centered spread for Independents. These results confirm that combining the two modalities provides the most consistent and interpretable estimates of elites’ ideological positions as the DA framework effectively leverages complementary information from networks and texts to refine the latent ideological space.
Following established approaches for quantifying partisan lexical asymmetries (Monroe et al., Reference Monroe, Colaresi and Quinn2008; Gentzkow et al., Reference Gentzkow, Shapiro and Taddy2019), we also computed a lexical polarization index (LPI), defined as the difference in average word usage rates between the most extreme (top 10%) and the moderate (bottom 50%) elites. The highest-scoring “extremist” words include FBI, Donald, FOX, podcast, GOP, Trumps, Georgia, Democrat, Hunter, and documents – terms tied to partisan media, political scandals, and identity-laden topics. In contrast, words most associated with moderates include communities, veterans, bipartisan, businesses, ensure, colleagues, legislation, resources, and infrastructure, reflecting institutional or policy-oriented language (more detailed results described in Appendix F). This contrast suggests that extremist discourse is more event- and identity-focused, whereas moderate discourse centers on governance and service (Figure 14).
Across all elites, the most frequent and cross-partisan words – America, attack, business, children, court, power, president, rights, and Washington – suggest a common civic vocabulary. We further compare the alignment of text and network structures in Appendix G, suggesting that moderates show higher text–network coupling than extremists.
Density plots of estimated ideal points for 933 elites’ Twitter accounts, grouped by their party affiliation. The CA estimator (blue) uses only network information; the word-embedding estimator (yellow) uses word2vec-derived textual embeddings only; and the DA estimator (pink) integrates network and text data. The DA method produces the clearest separation between Democratic and Republican elites, indicating improved identification of ideological extremes.

Figure 5 compares the estimated ideal points of elites before and after incorporating text data. Our proposed DA method demonstrates a superior ability to identify and highlight elites with strongly liberal or conservative ideologies compared to the standard CA method. While the CA approach tends to cluster elites more centrally, our DA method more effectively adjusts the ideal points of moderate elites, independents, and third-party members toward the ideological center, reflecting their positions more accurately. Notably, prominent political figures and media outlets, such as Hillary Clinton, Tucker Carlson, and CNN, which were estimated to have moderate within-party ideal points, are now clearly differentiated using our DA approach. This differentiation underscores the value of leveraging text data, as it reveals distinct patterns of word usage in Twitter rhetoric that correlate with the ideological spectrum. These findings thus highlight the importance of incorporating rich text data, particularly for capturing the ideological extremes.
Moreover, we can also verify the overall DA estimation performance with the known ideological orientations of these elite accounts. For politicians and influencers, we distinguish them by their publicly known party affiliations. For news and media accounts, we use the media bias scores to classify their liberal and conservative leanings. These classifications are well reflected in Figure 5, further showing that our ideal point estimation strategy provides an accurate depiction of the true ideological distribution.
Estimated ideal points of political elites before and after adjusting for text data, with their true political alignment marked in colors. Some well-known elites with significant changes to their estimated ideal points after applying the new method are named and highlighted. Those with extreme ideologies are more distinct under the new estimation method while CA estimation does not clearly identify true extremes.

Estimated participants’ ideal points by the CA method. Ideal points are generally consistent with party alignments reported by users during the experiment.

4.4 Revisiting Bail et al. (Reference Bail, Argyle, Brown, Bumpus, Chen, Hunzaker, Lee, Mann, Merhout and Volfovsky2018)
As a further and wider application of our method, we analyzed and compared the ideal points of real ordinary users from the experiment in Bail et al. (Reference Bail, Argyle, Brown, Bumpus, Chen, Hunzaker, Lee, Mann, Merhout and Volfovsky2018) through the CA method and our proposed DA approach. We first applied the CA method using the default reference data from 2015 to the experimental data (Barberá, Reference Barberá2021). As shown in Figure 6, the densities of estimated ideal points align with the party affiliations self-reported by participants during the survey. Individuals with CA-estimated ideal points that contradict their affiliations predominantly self-reported moderate or weak party alignments, positioning them near the center of the estimated ideal point distribution. There are stronger discrepancies between ideal points and party affiliations among Democrats (18%) than Republicans (11%). Since the CA method relies solely on social network data, it reflects the phenomenon whereby a greater proportion of Democrat users tend to follow political elites whose views oppose their own, relative to their Republican counterparts. This finding contributes additional evidence to an ongoing debate in the literature, as empirical studies have offered conflicting perspectives on whether liberals are more inclined than conservatives to follow media and political accounts from the opposite sides (Barberá et al., Reference Barberá, Jost, Nagler, Tucker and Bonneau2015; Eady et al., Reference Eady, Nagler, Guess, Zilinsky and Tucker2019; Wojcieszak et al., Reference Wojcieszak, Casas, Yu, Nagler and Tucker2022).
Estimated participants’ ideal points by the DA method at various time points. Distributions remained stable during 2017, but experienced notable changes in 2022, as circled boxplots highlight that ideal points of weakly aligned Republicans spread across both positive and negative values.

Figure 7 presents results obtained using our DA method with an updated elite list from 2022 to estimate ideal points longitudinally. Consistent with findings from the CA method, these estimated ideal points mostly align with users’ self-reported party affiliations. However, unlike the relatively static CA-based ideal points, the DA method reveals more substantial shifts over the five-year period following the original experiment. Specifically, the overall sample average ideal point decreased from −0.036 in 2017 to −0.139 in 2022 (median changed from −0.094 to −0.139). Among Democratic users, the average ideal point changed slightly from −0.915 to −0.917, whereas Republican users exhibited a more pronounced shift, decreasing from 1.362 to 1.123. These results suggest that the distribution of estimated ideal points among Republican users became more centered over time, potentially reflecting increased heterogeneity or moderation in online behavior among a subset of users. These distributional shifts are consistent with emerging literature documenting ideological heterogeneity and moderation among segments of the Republican electorate in recent years, particularly post-2016 and during the COVID-19 era (Pew Research Center, Reference Center2017; Ekins, Reference Ekins2017; Iyengar et al., Reference Iyengar, Lelkes, Levendusky, Malhotra and Westwood2019).
Finally, we revisited the analysis of Bail et al. (Reference Bail, Argyle, Brown, Bumpus, Chen, Hunzaker, Lee, Mann, Merhout and Volfovsky2018) to explore whether the exposure to opposing political views had any observable effect on users’ actual online behavior. Unlike the original study, which focused on changes in self-reported policy attitudes, our analysis and method examine changes in users’ Twitter behaviors, specifically their network connections and posted texts, as inferred through estimated ideal points. To do this, we estimated ideal points for participants just before and immediately after the study, assuming that the short intervention window did not lead to interactions among participants. As shown in Figure 8, we found no evidence of meaningful changes in the estimated ideal points from network composition and texts of participants between the two time points. This aligns with prior work suggesting that observable behavior, such as who users follow or how they communicate online, is relatively resistant to change following brief interventions (Valente, Reference Valente2012).
Estimations of changes in ideal points for Democrats and Republicans over time, in contrast to theoretical, no-treatment-effect changes if the parallel trend assumption holds.

5. Discussion
In this work, we advance ideal point estimation methodologies by proposing a joint model for network and text data that enhances the reliability and accuracy of estimating latent political preferences among users. In particular, our results reveal ideological extremity among political elites with greater precision, a task at which previous methods often faltered. This approach normalizes the network and text data to a common scale, but this is not the only possible solution for scaling differences between covariates. It is, for example, possible to normalize the word occurrence matrix directly and introduce a tuning parameter when adding the network and text information. While this step may provide some additional gains if the tuning parameter is chosen correctly, setting such parameters is notoriously hard and frequently estimators behave consistently for a very wide range of parameter settings (e.g. Binkiewicz et al., Reference Binkiewicz, Vogelstein and Rohe2017). Moreover, as embedding-based methods are increasingly popular in the literature and as a further robustness check, we also compare our joint data-augmented estimator with a text-only ideal point model using word2vec embeddings (Mikolov et al., Reference Mikolov, Chen, Corrado and Dean2013). Although the embedding-based approach captures semantically meaningful ideological signals from language alone, it still lags behind the DA estimator in distinguishing ideological extremes and overall consistency with known party affiliations. This reinforces that neither networks nor text data alone are sufficient, and that their combination offers the most comprehensive and stable measurement of ideology.
Beyond its empirical performance, a key advantage of the proposed framework lies in its interpretability relative to unsupervised embedding-based approaches. In our model, the estimated user positions
 $\hat {\gamma }_i$
correspond to coordinates on a latent left–right ideological continuum, which can be directly validated against known party affiliations or policy stances (Clinton et al., Reference Clinton, Jackman and Rivers2004; Bafumi et al., Reference Bafumi, Gelman, Park and Kaplan2005; Barberá, Reference Barberá2015). The elite- and word-level parameters,
$\hat {\gamma }_i$
correspond to coordinates on a latent left–right ideological continuum, which can be directly validated against known party affiliations or policy stances (Clinton et al., Reference Clinton, Jackman and Rivers2004; Bafumi et al., Reference Bafumi, Gelman, Park and Kaplan2005; Barberá, Reference Barberá2015). The elite- and word-level parameters,
 $v^{(Y)}_j$
and
$v^{(Y)}_j$
and
 $v^{(W)}_k$
, represent discrimination weights indicating how strongly each elite or term contributes to ideological differentiation – positive values aligning with conservative orientation and negative values with liberal orientation (Clinton et al., Reference Clinton, Jackman and Rivers2004). These interpretable quantities link model output to observable political behaviors (e.g., following specific elites or using partisan language), allowing substantive validation and transparent comparison across studies (Barberá et al., Reference Barberá, Jost, Nagler, Tucker and Bonneau2015; Barberá, Reference Barberá2015). By contrast, unsupervised embedding models, such as word2vec or transformer-based text embeddings capture latent semantic regularities in high-dimensional spaces but lack an explicit, identifiable ideological axis (Mikolov et al., Reference Mikolov, Chen, Corrado and Dean2013; Devlin et al., Reference Devlin, Chang, Lee and Toutanova2019; Rodríguez et al., Reference Rodríguez, Cuadros and Rigau2022). Thus, our approach offers both conceptual clarity and empirical transparency, facilitating theoretical interpretation and reproducibility in studies of online political behavior.
$v^{(W)}_k$
, represent discrimination weights indicating how strongly each elite or term contributes to ideological differentiation – positive values aligning with conservative orientation and negative values with liberal orientation (Clinton et al., Reference Clinton, Jackman and Rivers2004). These interpretable quantities link model output to observable political behaviors (e.g., following specific elites or using partisan language), allowing substantive validation and transparent comparison across studies (Barberá et al., Reference Barberá, Jost, Nagler, Tucker and Bonneau2015; Barberá, Reference Barberá2015). By contrast, unsupervised embedding models, such as word2vec or transformer-based text embeddings capture latent semantic regularities in high-dimensional spaces but lack an explicit, identifiable ideological axis (Mikolov et al., Reference Mikolov, Chen, Corrado and Dean2013; Devlin et al., Reference Devlin, Chang, Lee and Toutanova2019; Rodríguez et al., Reference Rodríguez, Cuadros and Rigau2022). Thus, our approach offers both conceptual clarity and empirical transparency, facilitating theoretical interpretation and reproducibility in studies of online political behavior.
It is important to also acknowledge certain inherent challenges and potential extensions of using our estimated ideal points in downstream analyses. While our analysis uses data originally collected by Bail et al. (Reference Bail, Argyle, Brown, Bumpus, Chen, Hunzaker, Lee, Mann, Merhout and Volfovsky2018), we treat this dataset as a motivating real-world application for evaluating the utility of our data-augmented ideal point estimation method, rather than to replicate or test the causal hypotheses of the original study. Due to the significant attrition over time, where many participant accounts were deactivated, restricted, or lacked sufficient activity for estimation, the original experimental design’s assumptions no longer hold. Moreover, network structures evolve dynamically over time, which violates the static network assumptions underlying the causal framework of Bail et al. (Reference Bail, Argyle, Brown, Bumpus, Chen, Hunzaker, Lee, Mann, Merhout and Volfovsky2018). That said, the extended analysis does yield substantive insight into the long-term evolution of ideological alignment on Twitter. For instance, our updated estimates reveal asymmetric patterns and variability of ideological drift among weakly aligned Republicans between 2017 and 2022, with many shifting closer to the ideological center. These results highlight how the joint estimation method may detect trends in political positioning that pure network-based approaches may miss.
Additionally, our simulation framework assumed a Uniform distribution for latent ideology. This simplifying choice does not capture the clustering and skewness seen in empirical ideology distributions (e.g., bimodal left–right polarization). Future research could adopt empirically grounded priors or mixture models to more closely approximate real-world ideological structures. This would allow testing whether the joint model maintains robustness under more complex ideological landscapes.
Although our empirical analyses estimate ideal points across time through re-estimating the ideal points based on users’ networks and textual content available at each observed time point, this design does not yet impose any temporal structure on these estimates. In contrast, time-varying ideal point models, such as those proposed by Martin and Quinn (Reference Martin and Quinn2002), Carroll et al. (Reference Carroll, Lewis, Lo, Poole and Rosenthal2009), and more recently Kubinec (Reference Kubinec2025), explicitly model latent trajectories that evolve dynamically over time. Extending our joint modeling framework to a time-varying context (e.g., via dynamic latent factor or state-space models that combine network and text data streams) represents a promising direction for future work.
While Twitter discontinued free access to its API in 2023, our methodological framework is broadly applicable to settings where network data are accompanied by text information. For example, there are large corpora of historical Twitter data that can be reanalyzed to understand how stable ideal points are. More platforms, such as Facebook, Reddit, and TikTok, continue to offer varying levels of API accessibility, which allow researchers to analyze current online users. Beyond these, researchers have routinely collected (symmetric and asymmetric) network data and accompanying open-ended survey questions that can be analyzed to identify positioning within these studies (Singh and Moody, Reference Singh and Moody2022). Building on our work, future research could explore more sophisticated text analysis models and expand the joint modeling framework to incorporate additional data sources, such as multimedia content or user engagement metrics. Finally, using large language models to identify specific linguistic patterns or word choices that distinguish users with extreme ideological dispositions could offer deeper insights into the relationship between language and political behavior (Wu et al., Reference Wu, Nagler, Tucker and Messing2023). These advancements would not only refine our understanding of ideological positioning but also enhance the applicability of the method across diverse digital platforms and contexts.
Acknowledgements
We are grateful to the members of the Polarization Lab at Duke for providing important feedback on early versions of this work.
Competing interests
No competing interest is declared.
Data availability statement
The code for this work is available in https://github.com/sheny2/Ideal-point-estimation, including a large user-elite network data and word occurrence matrix. Network and text information for the participants in the original study is not shareable publicly due to being personally identifying information.
Funding statement
This work was partially supported by DMS-CAREER 2046880 and the Templeton Foundation.
Appendix A. Missing data analysis
To assess the extent and pattern of missing data across time, we plotted the user-level presence or absence of tweets and network data from 2017 to 2022. Our analysis first reveals considerable attrition: many users active in 2017 are no longer present in the 2022 dataset. Importantly, the data are not missing completely at random (MCAR); rather, it reflects informative dropout. Users may have deactivated accounts, been suspended, or changed behavior in ways correlated with ideological position or treatment group in the original experiment. As a result, reusing this dataset for causal inference without accounting for informative missingness would lead to biased conclusions. In our work, we treat the updated 2022 snapshot as an independent dataset and focus on evaluating the methodological robustness of joint ideal point estimation.
Age distribution across non-estimable, missing, and analyzed participants.

Illustration of non-estimable, missing, and analyzed participants. (a) Party identification, (b) Party strength, (c) Twitter activity, (d) Twitter usage.

Appendix B. Simulation results
Figure 11 visualizes the association between the top three eigenvectors of the network-text Laplacian and the estimated latent ideological positions. While the second eigenvector clearly aligns with the one-dimensional left–right ideological axis and is consistent with our theoretical justification from the spectral graph theory (Krzakala et al., Reference Krzakala, Moore, Mossel, Neeman, Sly, Zdeborová and Zhang2013), the first and third eigenvectors exhibit substantially less ideological structure. The first eigenvector is known to capture trivial global properties, such as node degree or popularity, rather than the community structure. The third eigenvector may capture secondary or noisy structural signals but does not strongly align with partisan affiliation in this case. These findings reinforce our choice to focus on the second eigenvector for ideal point estimation and underscore that the latent ideological space is predominantly one-dimensional in our context.
Full simulation results examining the use of different eigenvectors when extracting multiple sources of characteristics.

Appendix C. Sensitivity to elite reference data
To examine the sensitivity of our estimation to the definition of the elite reference set, we re-estimated ideal points using different subsets of elite users in the network anchoring procedure. Figure 12 compares the resulting distributions across specifications. We observe that while the overall shape of the partisan distributions remain unimodal and approximately continuous, the location and scale shift depending on which elite subset is used for alignment. This underscores the importance of choosing a stable and interpretable reference group when interpreting the positions on the latent ideological scale. Nevertheless, relative ordering among users is preserved, and correlations between versions remain high, indicating that the qualitative ideological structure is relatively robust to the choice of elite anchors.
Density plots of all 704 participants’ ideal points estimated using the correspondence analysis method with different reference data of elites taken in 2017 and 2022.

Appendix D. TF-IDF word embeddings approach
To validate and strengthen our modeling choice for the textual component, we implemented a TF-IDF transformation of the user-word matrix and derived a low-dimensional embedding via truncated SVD (Ramos, Reference Ramos2003; Kadhim et al., Reference Kadhim, Cheah, Hieder and Ali2017). Specifically, we first applied TF-IDF reweighting to the word occurrence matrix using the text2vec package. We then extracted a 30-dimensional embedding. The resulting word embedding matrix preserves both lexical structure and document-level variation. Importantly, this TF-IDF–SVD variant produces highly consistent results compared to our original model that relied on simple word occurrence counts. This suggests that the key ideological signals are robust to alternative word representations, thereby supporting the validity of our original design. These findings are consistent with recent work on the interpretability and stability of word embeddings in applied settings (Rodriguez and Spirling, Reference Rodriguez and Spirling2022), which emphasize that embedding-based representations can yield valid insights when carefully evaluated and aligned with research goals.
To further explore the ideological information captured by the text-based user embeddings, we applied t-distributed stochastic neighbor embedding to the 30-dimensional matrix obtained from the TF-IDF–SVD pipeline (Maaten and Hinton, Reference Maaten and Hinton2008). This non-linear dimensionality reduction method visualizes high-dimensional data while preserving local structure in the embedding space. We set the perplexity to 30 and used a fixed random seed for reproducibility.
Figure 13 shows the resulting two-dimensional projection, where each point represents a user and is colored by their self-reported party affiliation. The axes are abstract dimensions created by t-SNE and do not have direct interpretable meaning like principal components. However, their spatial configuration reveals that users form coherent clusters largely corresponding to their political alignment. Liberal users (blue) and conservative users (red) are well-separated, suggesting that their patterns of word usage, as encoded through TF-IDF and compressed into the low-dimensional embedding, reflect meaningful ideological divisions. This supports our assumption that text features contain relevant information about latent political positions and validates the utility of our original, simpler word-occurrence approach as a strong baseline.
Two-dimensional t-SNE projection of user-level TF-IDF–SVD embeddings. The projection reveals clear clustering by political alignment, indicating that textual features learned from users’ tweet content encode meaningful ideological signals.

Appendix E. Word-embedding approach using word2vec
To complement our data-augmented estimator and to benchmark it against more contemporary text-encoding techniques, we additionally implemented a word-embedding–based ideal point estimator using the skip-gram variant of the word2vec model (Mikolov et al., Reference Mikolov, Chen, Corrado and Dean2013). This model learns vector representations of words by predicting surrounding tokens within a fixed context window, thereby capturing both syntactic and semantic regularities in language. The learned embeddings are subsequently aggregated to the elite level to infer text-only ideological positions.
Data and preprocessing . We used the same corpus of tweets collected for the elite accounts described in Section 3.1. Each elite’s tweet history was tokenized, lowercased, and cleaned by removing URLs, mentions, emojis, and non-alphabetic symbols. The tweets for each elite were concatenated into a single pseudo-document, producing a corpus of 933 documents (one per elite). This ensures consistent preprocessing with the text data used in our DA method.
Model training
. The skip-gram word2vec model was trained on this corpus to learn
 $d$
-dimensional word embeddings. The model parameters were set as follows: embedding dimension
$d$
-dimensional word embeddings. The model parameters were set as follows: embedding dimension
 $d = 200$
, context window size
$d = 200$
, context window size
 $= 5$
, minimum word frequency
$= 5$
, minimum word frequency
 $= 5$
, number of negative samples
$= 5$
, number of negative samples
 $= 10$
, and training iterations
$= 10$
, and training iterations
 $= 10$
. The optimization was performed using negative sampling. The resulting embedding matrix
$= 10$
. The optimization was performed using negative sampling. The resulting embedding matrix
 $ {\textbf{E}_{\textbf{W}}} \in \mathbb{R}^{V \times d}$
represents each word
$ {\textbf{E}_{\textbf{W}}} \in \mathbb{R}^{V \times d}$
represents each word
 $w$
among
$w$
among
 $V = 18,946$
total words as a continuous vector
$V = 18,946$
total words as a continuous vector
 $\textbf{e}_w$
in a latent semantic space of dimension
$\textbf{e}_w$
in a latent semantic space of dimension
 $d$
.
$d$
.
Embeddings and estimation
. To obtain text-based representations for each elite, we applied the SIF weighting (Arora et al., Reference Arora, Liang and Ma2017). Let
 $c_{wj}$
denote the count of word
$c_{wj}$
denote the count of word
 $w$
in elite
$w$
in elite
 $j$
’s tweets and
$j$
’s tweets and
 $p(w)$
the empirical frequency of
$p(w)$
the empirical frequency of
 $w$
across all elites. The SIF-weighted elite embedding is defined as
$w$
across all elites. The SIF-weighted elite embedding is defined as
 \begin{equation*} \textbf{X}_j = \frac {\sum _{w \in \mathcal{V}_j} \frac {a}{a + p(w)} \, c_{wj} \, \textbf{e}_w} {\sum _{w \in \mathcal{V}_j} \frac {a}{a + p(w)} \, c_{wj}}, \end{equation*}
where
 $a = 10^{-3}$
is a smoothing constant and
$a = 10^{-3}$
is a smoothing constant and
 $\mathcal{V}_j$
denotes the set of words appearing in elite
$\mathcal{V}_j$
denotes the set of words appearing in elite
 $j$
’s tweets. Each resulting vector
$j$
’s tweets. Each resulting vector
 $\textbf{X}_j$
is then
$\textbf{X}_j$
is then
 $L_2$
-normalized to yield the elite-level text embedding.
$L_2$
-normalized to yield the elite-level text embedding.
Using the normalized elite embeddings, we constructed the elite–elite cosine similarity matrix
 \begin{equation*} {\textbf{S}_{\textbf{W}} = {\textbf{Z Z}}^{\mathbf{\top }}}, \end{equation*}
where
 $Z$
stacks all normalized elite embeddings as rows. From this, we computed the degree-normalized Laplacian
$Z$
stacks all normalized elite embeddings as rows. From this, we computed the degree-normalized Laplacian
 \begin{equation*} {\textbf{L}_{\textbf{W}}= {\textbf{D}}^{-\frac {1}{2}} \textbf{S}_{\textbf{W}} \textbf{D}^{-\frac {1}{2}}, \qquad \textbf{D} = \mathrm{diag}(\textbf{S}_\textbf{W} \mathbf{1})}, \end{equation*}
and extracted its second eigenvector,
 $\boldsymbol{\gamma }_W$
, which serves as the word-embedding ideal point estimator. Values of
$\boldsymbol{\gamma }_W$
, which serves as the word-embedding ideal point estimator. Values of
 $\boldsymbol{\gamma }_W$
were standardized to have mean 0 and unit variance for interpretability. This procedure parallels the spectral framework of our CA and data-augmented estimators, thereby allowing a direct comparison across all three methods.
$\boldsymbol{\gamma }_W$
were standardized to have mean 0 and unit variance for interpretability. This procedure parallels the spectral framework of our CA and data-augmented estimators, thereby allowing a direct comparison across all three methods.
Interpretation . The word2vec-based estimator identifies a one-dimensional ideological structure that emerges purely from the linguistic content of elites’ tweets. As shown in Figure 4, the resulting distribution of estimated ideal points reveals clear partisan clustering that is consistent with known political alignments, but remains less sharply separated than the DA estimates.
Appendix F. Lexical polarization and discourse differences
To further investigate how linguistic signals relate to ideological differentiation, we conducted a lexical analysis comparing the language of extreme versus moderate elites. Specifically, we computed the LPI, defined as the difference in average word usage rates between extreme and moderate elites (Monroe et al., Reference Monroe, Colaresi and Quinn2008; Gentzkow et al., Reference Gentzkow, Shapiro and Taddy2019). The resulting contrasts reveal clear thematic distinctions in discourse.
Lexical polarization by extremity. Bars show the top words (by magnitude of the lexical polarization index) that distinguish extremists (top 10%) from moderates (bottom 50%). Extremist discourse concentrates on partisan media and identity-laden topics (e.g., FBI, Donald, FOX, GOP), while moderate discourse emphasizes institutional and policy language (e.g., communities, veterans, bipartisan, legislation, infrastructure).

Appendix G. Text–network coupling and ideological extremity
Following previous work that integrates network and text data to study polarization and echo-chamber effects (Bail, Reference Bail2016; Barberá et al., Reference Barberá, Jost, Nagler, Tucker and Bonneau2015), we compared the alignment between elites’ text-based and network-based similarity structures to assess how discourse and social connectivity jointly shape ideological differentiation. For the network dimension, we constructed a symmetric co-occurrence similarity matrix
 $S_{\text{net}}$
from a bipartite follower (or retweet) incidence matrix
$S_{\text{net}}$
from a bipartite follower (or retweet) incidence matrix
 $Y$
(rows = users, columns = elites). The network similarity was computed as:
$Y$
(rows = users, columns = elites). The network similarity was computed as:
 \begin{align*}S_{\text{net}} = {\textbf{D}}^{-\frac {1}{2}} ({\textbf{Y}}^{\textsf{T}} {\textbf{Y}}) {\textbf{D}}^{-\frac {1}{2}},\end{align*}
where
 $\textbf{D}$
is a diagonal matrix of column degrees
$\textbf{D}$
is a diagonal matrix of column degrees
 $\mathrm{diag}(Y^{\textsf{T}} Y)$
, following the standard normalized Laplacian transformation used in spectral graph analysis. Each entry
$\mathrm{diag}(Y^{\textsf{T}} Y)$
, following the standard normalized Laplacian transformation used in spectral graph analysis. Each entry
 $S_{\text{net},ij}$
represents the normalized co-occurrence between elites
$S_{\text{net},ij}$
represents the normalized co-occurrence between elites
 $i$
and
$i$
and
 $j$
(e.g., overlap in follower or retweet audiences).
$j$
(e.g., overlap in follower or retweet audiences).
We then compared this structure to the text-based similarity matrix
 $S_{\text{text}}$
, derived from cosine similarity of elites’ embedding representations. Two complementary measures were computed: (i) a global correlation between all off-diagonal elements of
$S_{\text{text}}$
, derived from cosine similarity of elites’ embedding representations. Two complementary measures were computed: (i) a global correlation between all off-diagonal elements of
 $S_{\text{text}}$
and
$S_{\text{text}}$
and
 $S_{\text{net}}$
, and (ii) a per-elite correlation
$S_{\text{net}}$
, and (ii) a per-elite correlation
 \begin{equation*} \rho _i = \mathrm{cor}(S_{\text{text},i\cdot }, S_{\text{net},i\cdot }), \end{equation*}
which captures how well an elite’s text-similar neighbors coincide with their network neighbors.
Figure 15 summarizes the per-elite correlations by ideological extremity group (0–50% = moderates, 50–90% = high, 90–100% = extremes). We observe that moderates exhibit higher text–network coupling on average, while the correspondence weakens among more extreme elites. This indicates that moderates’ discourse tends to align more closely with the overall network structure as their language overlaps with multiple communities, whereas extremists’ linguistic patterns diverge even from their own network clusters. In other words, the separation of extremists reflects not only structural segregation but also the distinctiveness of their rhetorical choices, which are less well explained by networks alone.
Text–network coupling by ideological extremity. Each box shows the distribution of per-elite correlations between text-based and network-based similarity matrices. Higher values indicate stronger alignment between linguistic and structural neighborhoods. Moderates display the highest coupling, suggesting that their language reflects broader network connections, whereas extremists show weaker coupling, indicating discourse that diverges from network ties and contributes to greater ideological differentiation.


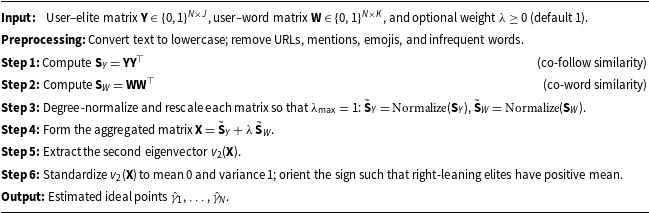


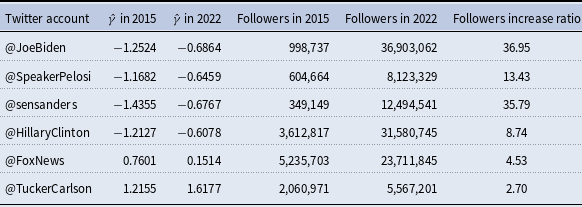


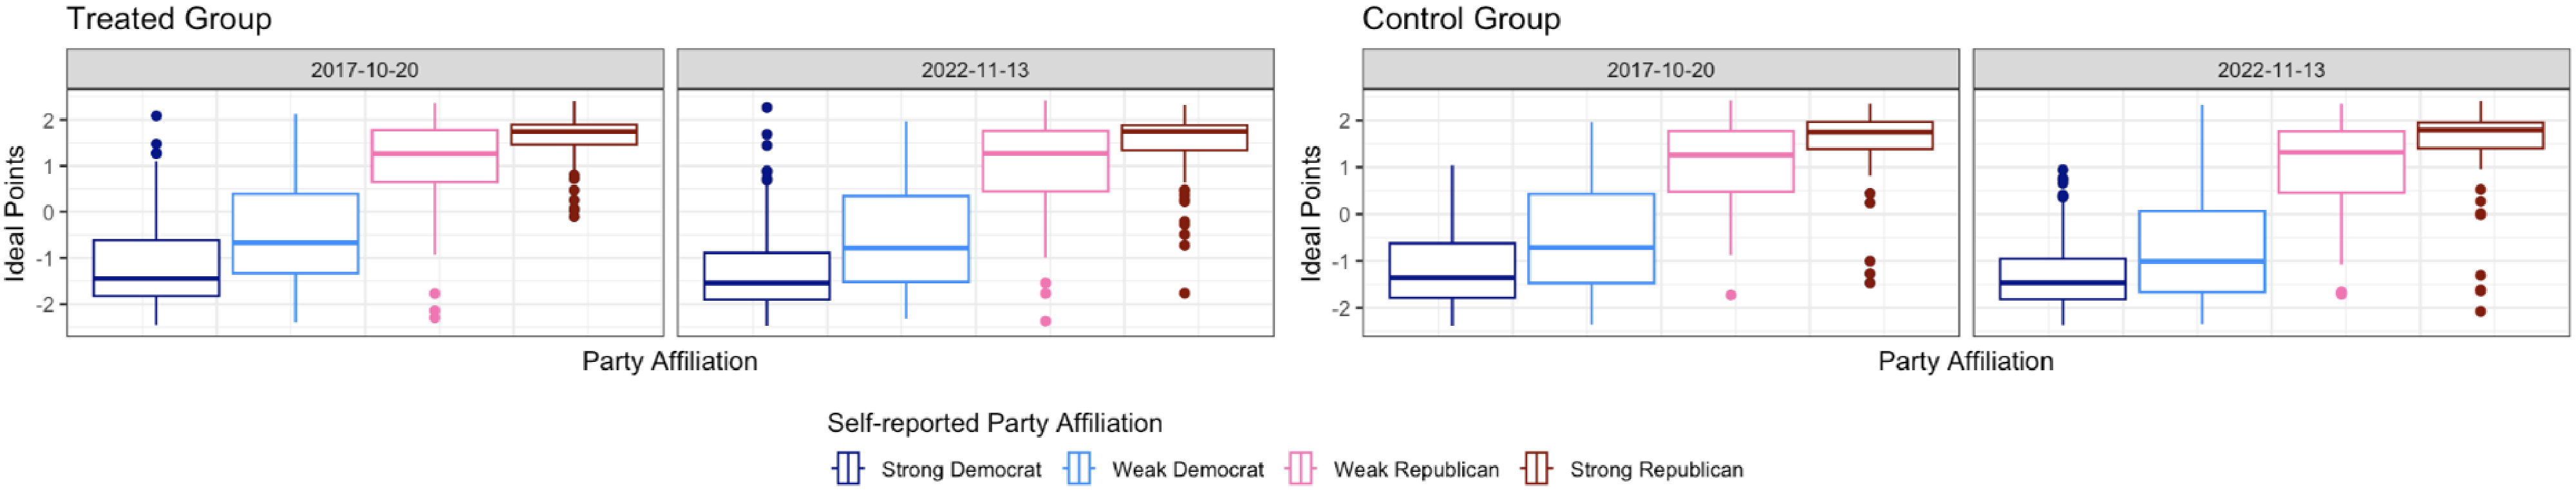
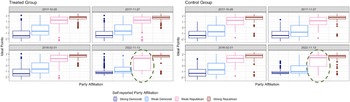
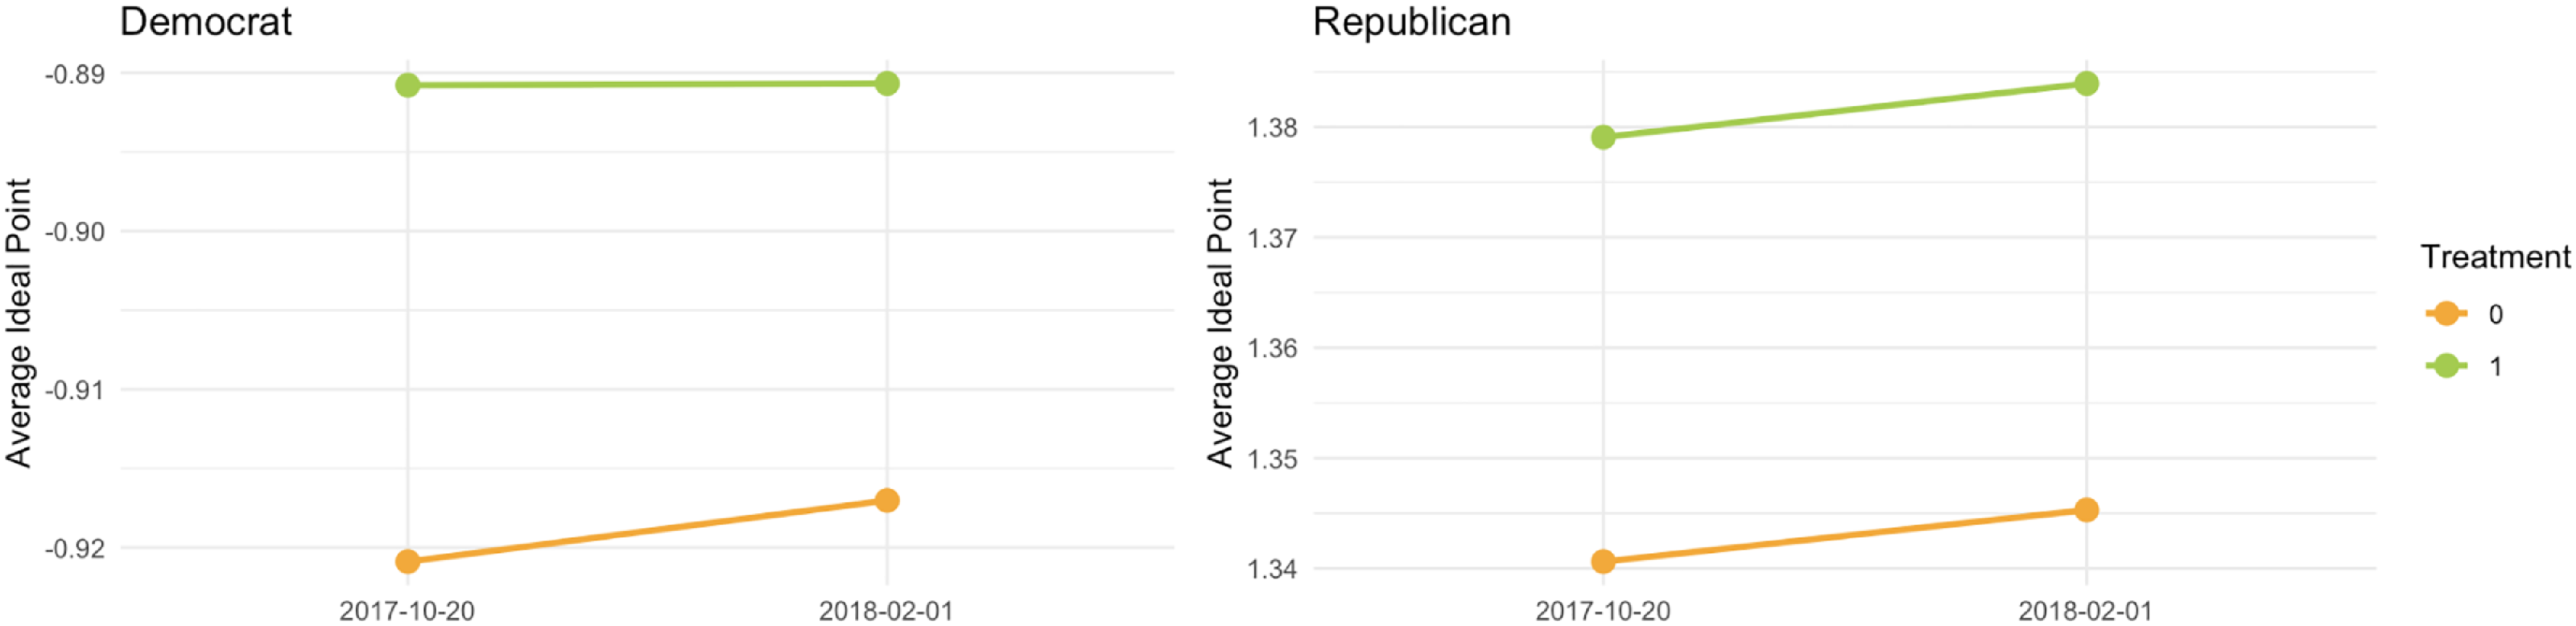
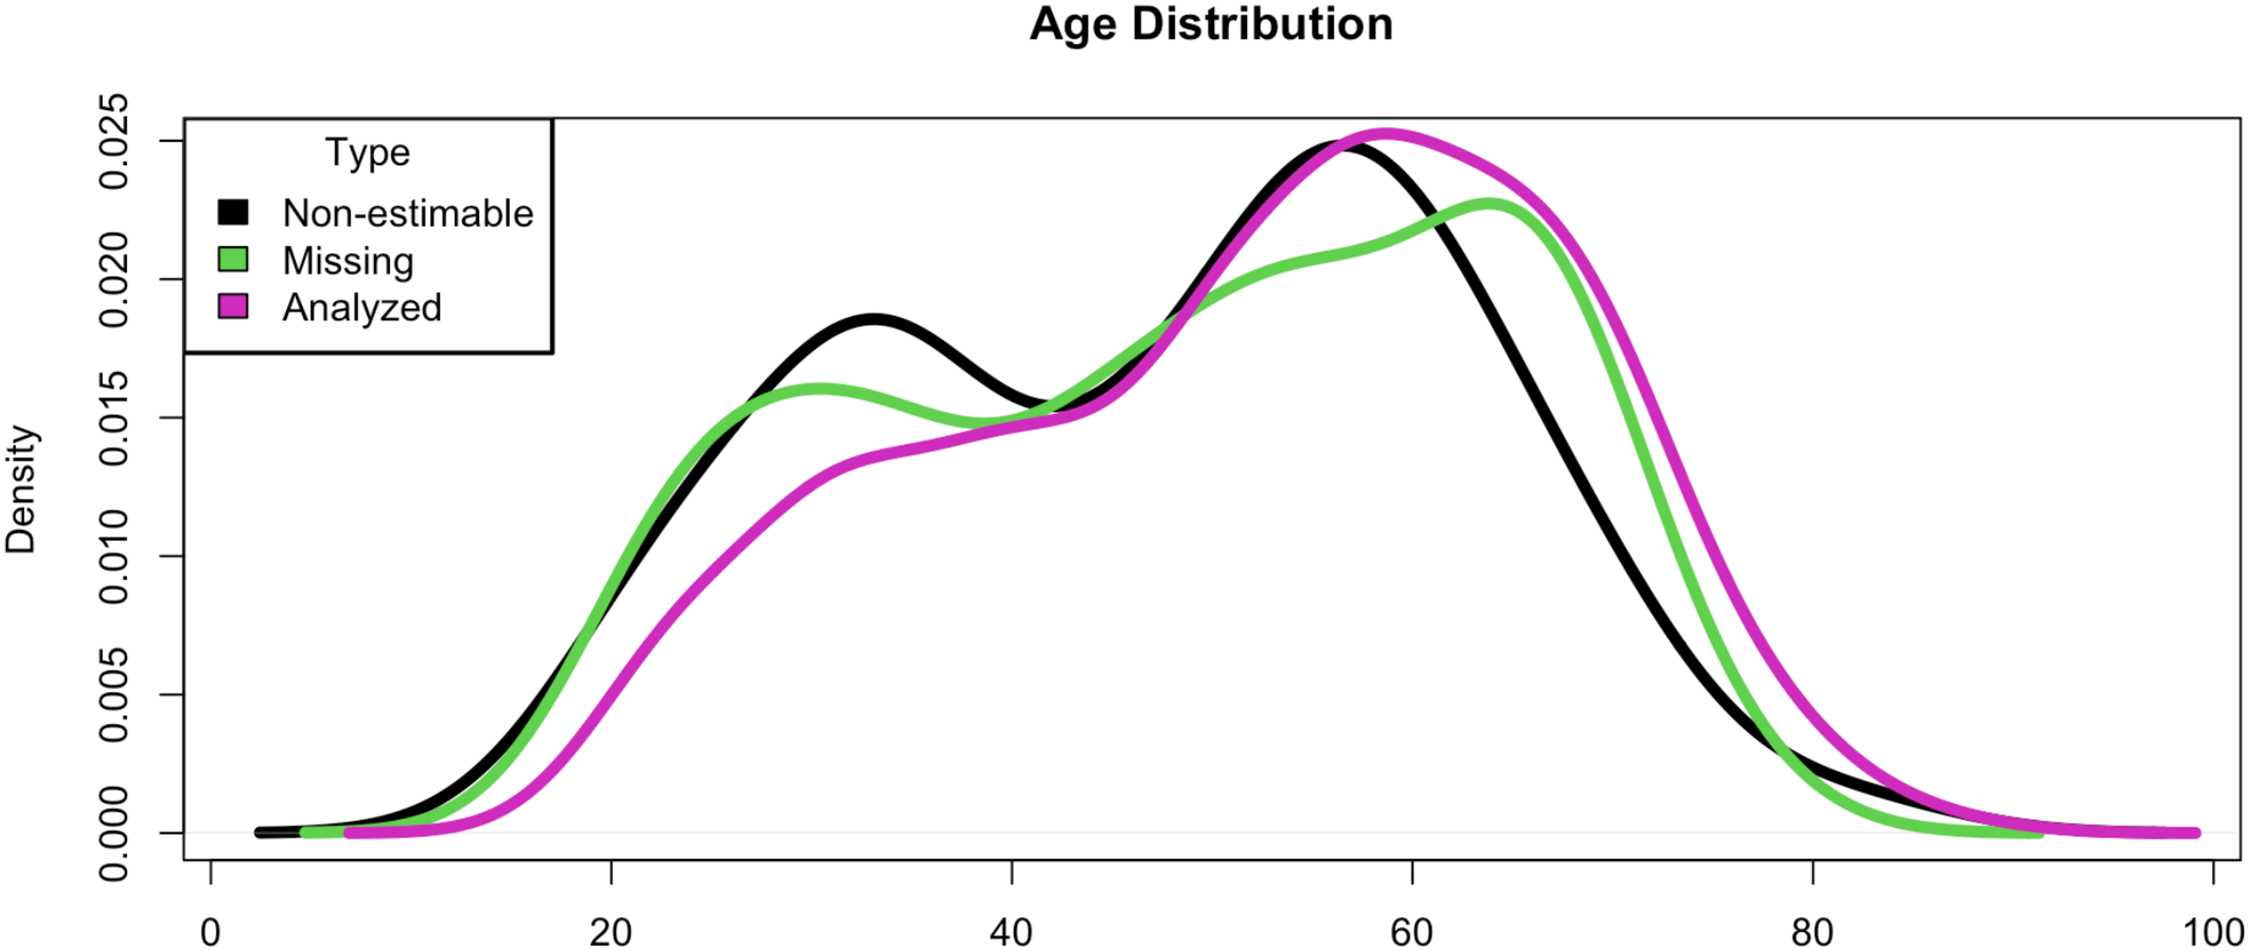


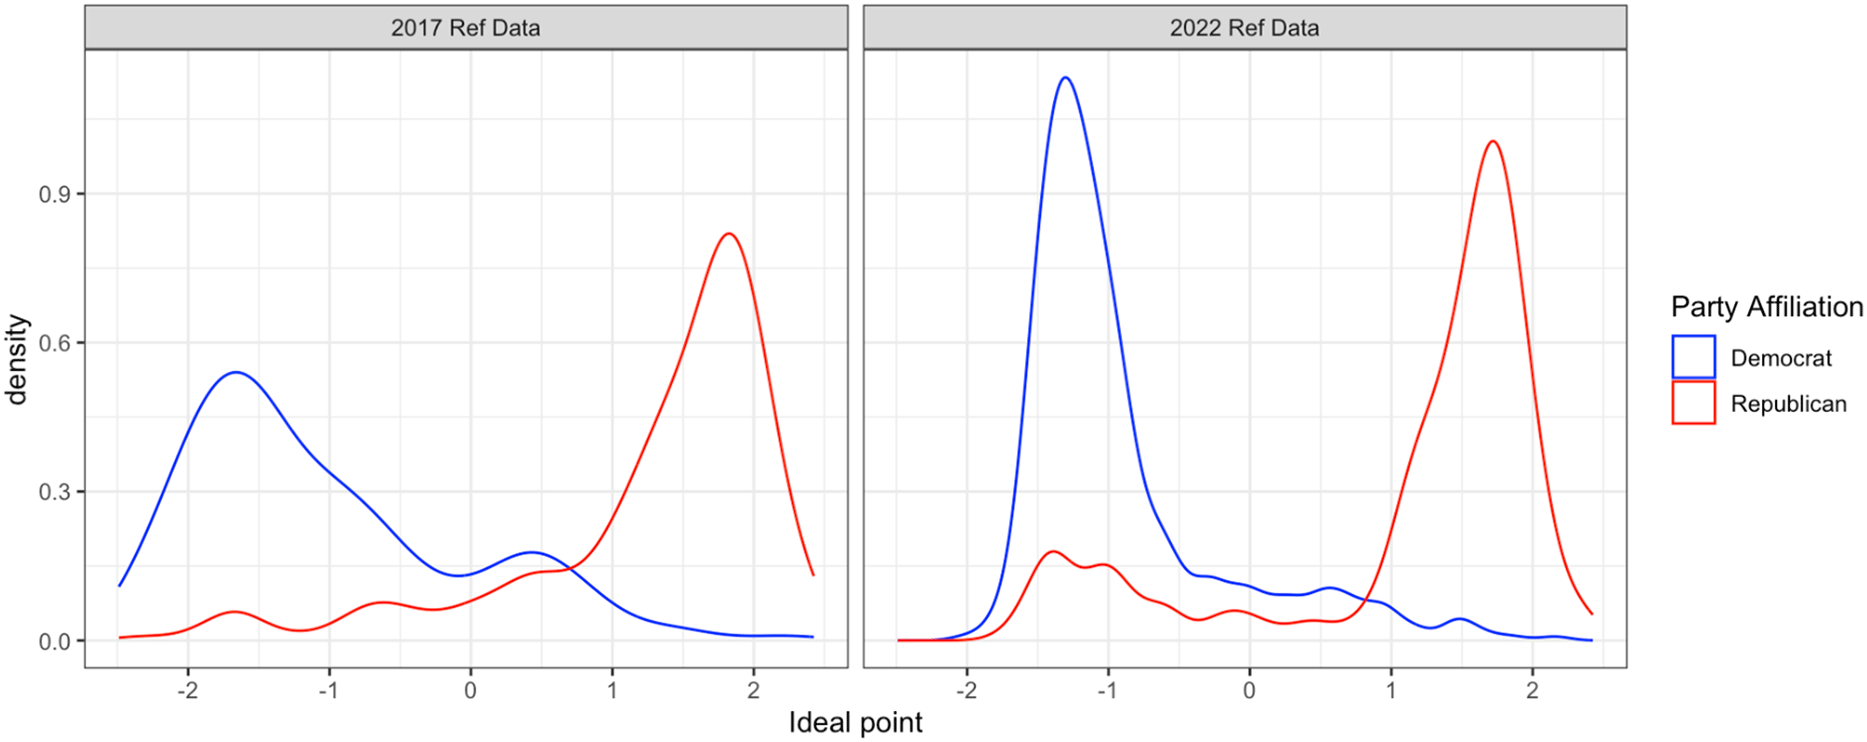
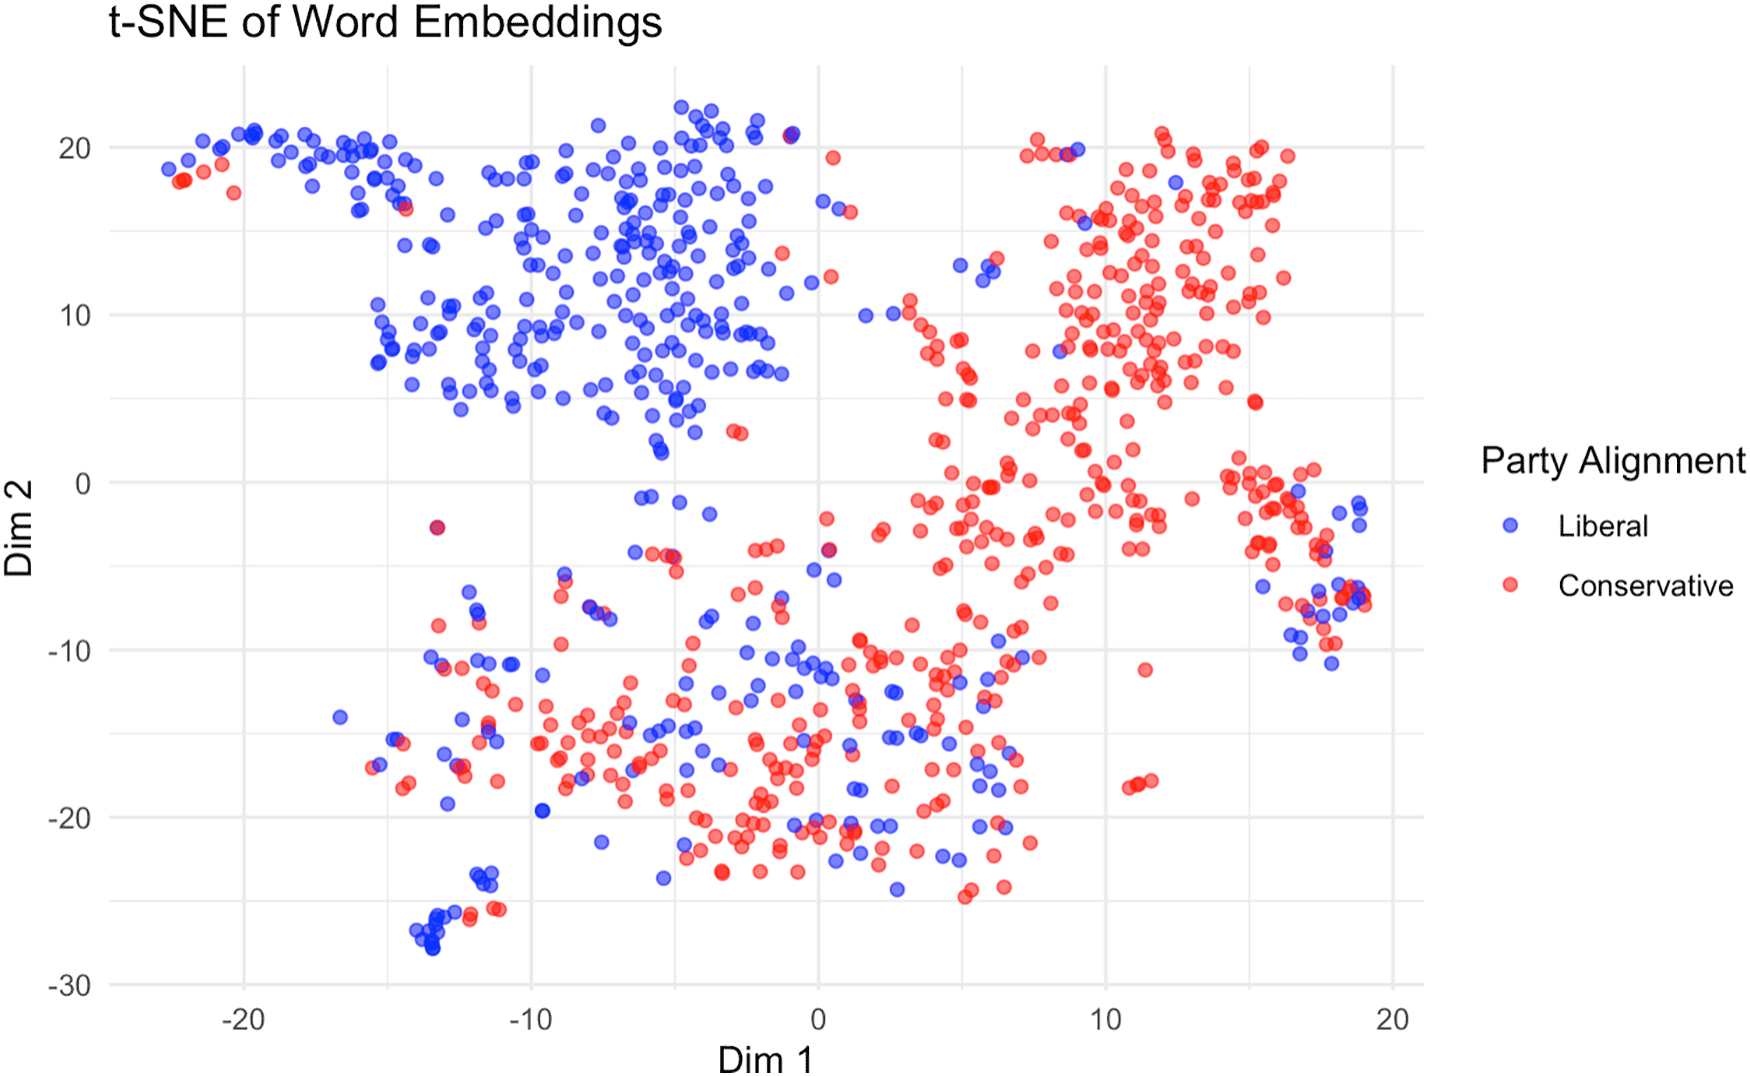

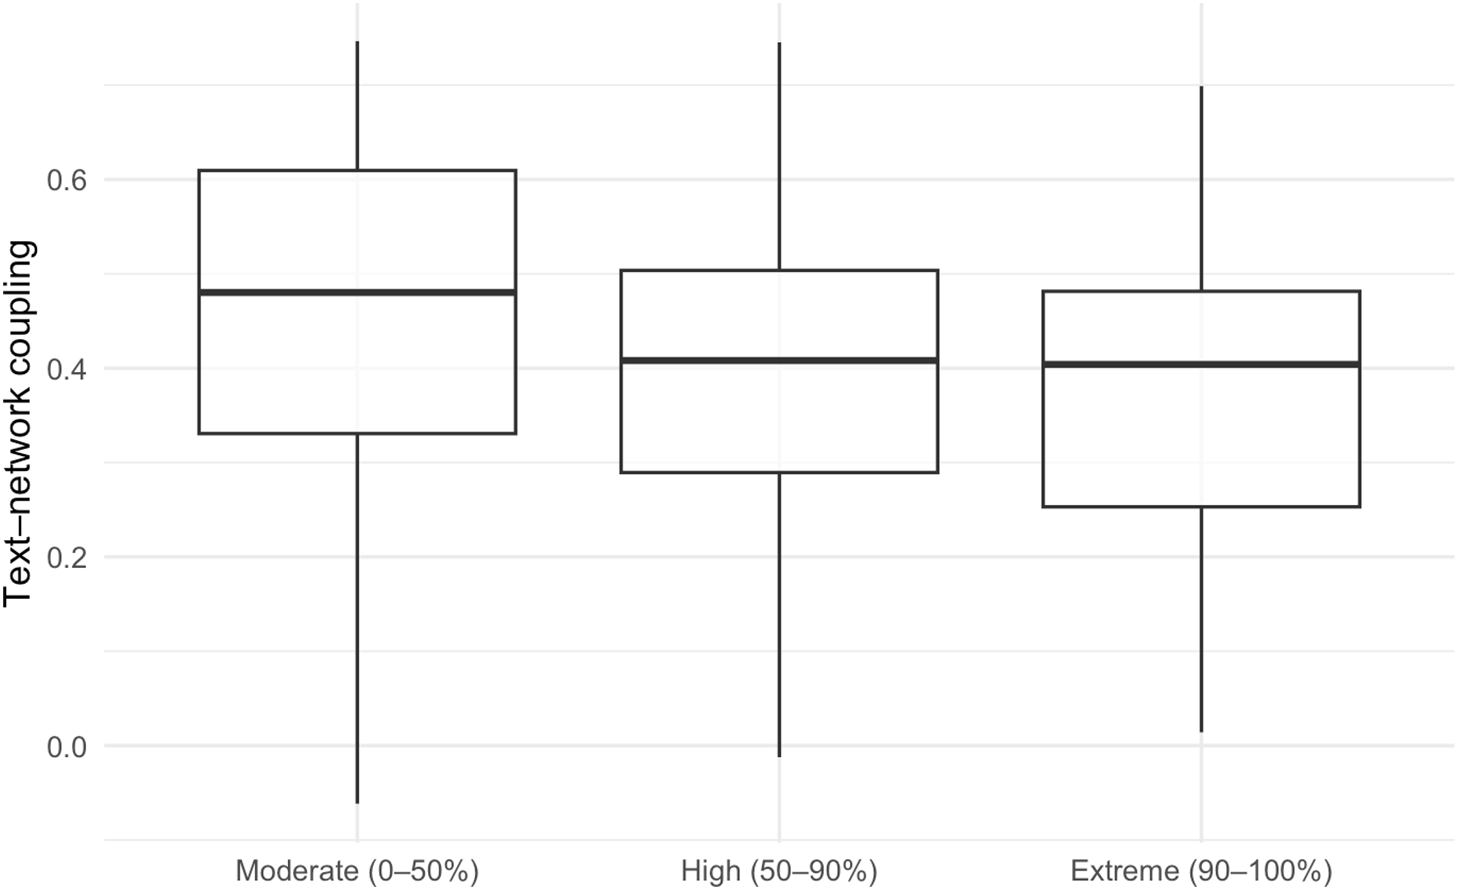

 Open access