



1 INTRODUCTION
Interstellar dust is an important component of the interstellar medium. It is the remnant of star formation and stellar evolution processes. Interstellar dust grains can transmit, redirect, and transmute the starlight (Fitzpatrick Reference Fitzpatrick, Witt, Clayton and Draine2004). Due to this property of dust grain, the actual distances and magnitude determination of astronomical objects is often very difficult (Pandey et al. Reference Pandey, Upadhyay, Nakada and Ogura2002). For this reason, it is very important to have knowledge of interstellar dust in the line of sight of the objects under study. The interstellar extinction is caused by two distinct sources, a diffuse component associated by the general interstellar medium and a variable component associated with localised region of higher mean density (Martin & Whittet Reference Martin and Whittet1990; Turner Reference Turner1994). Studies of the variable component gives information about the composition of stars. Extinction properties of dust are wavelength dependent, so investigation of interstellar extinction law is the best way to determine the dust properties (Yadav & Sagar Reference Yadav and Sagar2001; Fitzpatrick Reference Fitzpatrick, Witt, Clayton and Draine2004). Young open star clusters are the ideal objects for this kind of study because they may contain gas and dust around early type (O, B, and A) stars (Hayashi Reference Hayashi1970; Larson Reference Larson1973; McNamara Reference McNamara1976, Warner, Strom, & Strom Reference Warner, Strom and Strom1979; Yadav & Sagar Reference Yadav and Sagar2001).
Trumpler studied the interstellar dust for the first time in 1920 and then it was studied by many investigators. Krelowski and Strobel (Reference Krelowski and Strobel1983) analysed interstellar extinction law in two stellar aggregates namely, Sco OB2 and Per OB1 and found different extinction curves for these two aggregates and their differences are large in far UV wave band. They concluded that the differences in FUV (Far-Ultra-Violet) fluxes for these fields is due to the circumstellar dust and also confirmed the presence of two populations of grains. Kiszkurno et al. (Reference Kiszkurno, Ko los, Kre lowski and Strobel1984) investigated 20 large OB associations at different galactic positions and found similar colour excess curves in the FUV range. They also concluded that these complexes are obscured by same type of interstellar material. Sagar (Reference Sagar1987) studied interstellar extinction in 15 open star clusters and found non-uniform extinction across 10 of the clusters. When the value of the inferred colour excess varies from one part of cluster region to another one, this is known as non-uniform extinction. The possible reasons behind the non-uniform extinction has been discussed by many investigators. Sagar (Reference Sagar1987) and Sagar & Qian (Reference Sagar and Qian1989) stated that this non-uniformity is due to the hot and ionised circumstellar dust around the stars. Samson (Reference Samson1975), McCuskey & Hauk (Reference McCuskey and Hauk1964), and Stone (Reference Stone1977) proposed that dust shells around stars and local dust clouds lying in the cluster direction is responsible for non-uniform extinction. Tapia et al. (Reference Tapia, Roth, Marrow and Ruiz1988) studied the extinction law in clusters using 200 stars located within four open clusters situated at same distance from the Sun. They found that these clusters have different reddening values and that they follow the normal extinction law for λ > 0.55 μm. They also interpreted the anomalies of the extinction law in then U and B bands because of the presence of dense intra-cluster dust cloud of different grain properties in comparison with normal dust grains. Cardelli, Clayton, & Mathis (Reference Cardelli, Clayton and Mathis1989) derived the mean extinction law for the wavelength range 0.12 μm ⩽ λ ⩽ 3.5 μm. This extinction law is applicable for the diffuse as well as the dense interstellar medium and depends only on one parameter R V , the total to selective extinction ratio.
Pandey, Mahra, & Sagar (Reference Pandey, Mahra and Sagar1990) found that differential extinction which is due to a non-uniform distribution of star-forming material decreases systematically with the age of the cluster. Yadav & Sagar (Reference Yadav and Sagar2001) studied interstellar extinction law in 15 open star clusters and found the presence of non-uniform extinction in all the clusters. They also found that most of the clusters follow the normal extinction law for λ < λ J , more specifically that the value of the colour excess for these clusters is close to the standard value derived for the general interstellar medium in this waveband, but show anomalous behaviour for λ ⩾ λ J . Pandey et al. (Reference Pandey, Upadhyay, Nakada and Ogura2002) studied 14 open clusters located around l ~ 130° and found that dust along these objects follow the normal interstellar extinction law for λ ⩾ λ J , but for shorter wavelengths, it depends upon R cluster (total-to-selective absorption in the cluster region). Joshi (Reference Joshi2005) studied the distribution of interstellar matter near the Galactic plane on the basis of 722 open star clusters and found that ~90% of the absorbing material lies within −5° ⩽ b ⩽ 5° of the Galactic plane. Nishiyama et al. (Reference Nishiyama2005) studied the interstellar extinction law in J, H, and K S bands towards the Galactic centre in the region l ⩽ 2°.0 and 0°.5 ⩽ b ⩽ 1°.0 using Red Clump (RC) stars and concluded that the extinction law is not universal even in the infra-red band.
In the light of above discussions, we can say that there are numerous studies available regarding the interstellar extinction in the direction of different objects. But, yet there are number of clusters for which less information is available about the distribution of dust and gas in our Galaxy. In order to study the distribution of dust and gas in the Milky Way, we need to consider different young open star clusters. Therefore, we have in this study considered 20 open star clusters to study interstellar extinction law in the optical and near-IR bands.
The structure of the article is as follows. Section 2 describes the data sources and cluster selection criteria. Section 3 describes the data analysis while Section 4 represents the conclusions of the present study.
2 CLUSTER SELECTION AND DATA SET
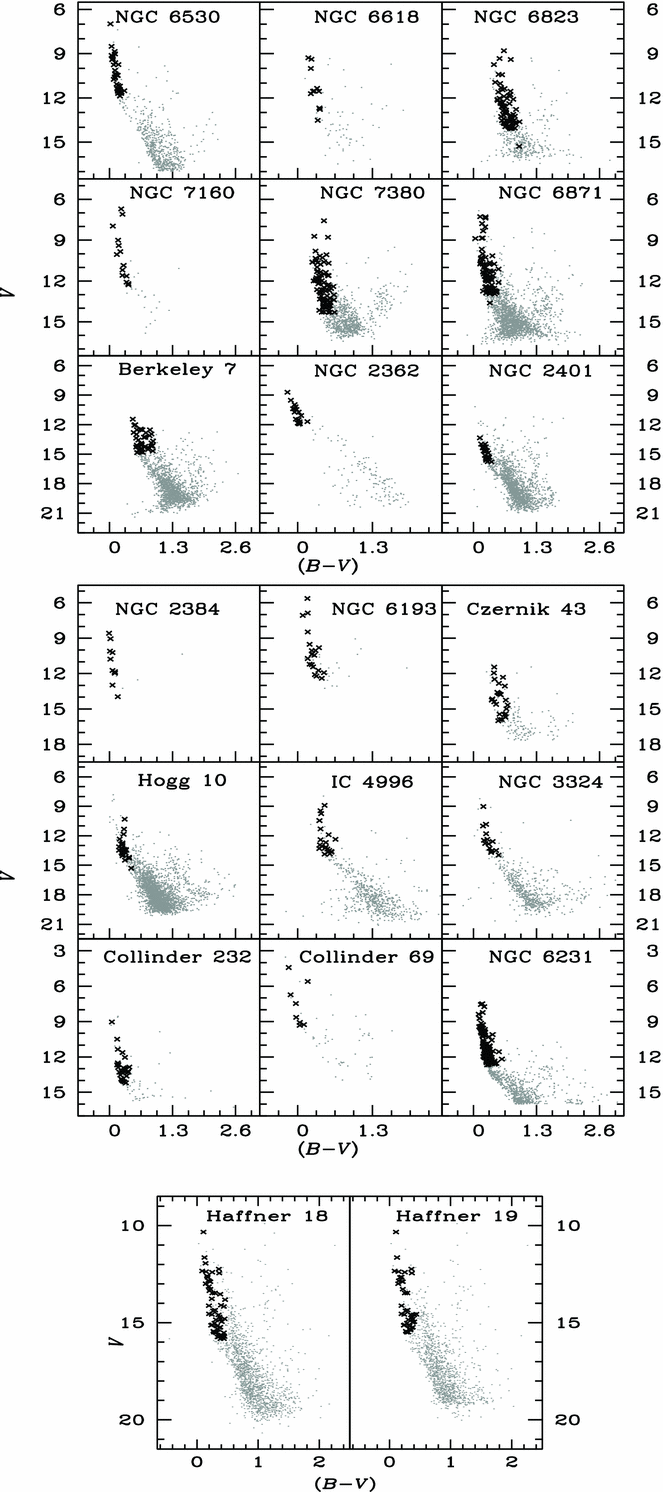
To study the extinction properties in the clusters, we have selected 20 young open star clusters from the WEBDA database, which have age younger than 50 Myr. The selection criteria of these clusters is based on the availability of UBVRI photometric data and previous studies on extinction. These clusters have been considered first time for interstellar extinction study. These clusters have distances ranging from 0.44 to 6.3 kpc. In young open star clusters, the early type stars may have dust and gas around them. Therefore, for the present analysis, we have selected only early type stars (O, B, and A) in each cluster. These stars have been selected using colour–colour and colour–magnitude diagrams (CMDs). The CMDs of the clusters are shown in Figure 1. The crosses represent the selected stars for the present analysis, while gray points are the remaining stars of the clusters. The UBVRI data for these clusters are taken from the WEBDA (http://www.univie.ac.at/webda/) database, while JHK data are taken from 2MASS (Two Micron All Sky Survey) catalogue. These clusters are distributed along the galactic plane with longitude from 6°.08 to 336°.70. Almost all the clusters under study have UBVRIJHK data. The optical data set have error ~0.01 mag in V and ~0.02 mag in (B − V), (V − R), and (V − I) while ~0.03 mag in (U − B). The JHK data set have error ~0.05 mag in J mag. The spectroscopic data is taken from the WEBDA database wherever available. Due to the unavailability of spectroscopic data for many stars, photometric Q-method (Johnson & Morgan Reference Johnson and Morgan1953) have been used. The maximum difference between the spectral type as identified by Q-method and that of available spectral type data is about two spectral sub-classes. The general information about the selected open star clusters is listed in Table 1.
The V, (B − V) colour–magnitude diagrams for all 20 clusters under study. The gray points represent all stars of the cluster and black crosses represent the stars used for the present study.
General information about the clusters under study taken from WEBDA website. N S denotes the number of stars used in the analysis.

3 ANALYSIS OF OBSERVATIONAL DATA
For the study of interstellar extinction law, we have derived the E(U − V), E(B − V), E(V − R), E(V − I), E(V − J), E(V − H), and E(V − K) colour excesses for early type stars. We have calculated these excesses by comparing the observed colours with their intrinsic ones. The intrinsic colours are derived from the MKK spectral type luminosity class colour relation given by FitzGerald (Reference FitzGerald1970) for (U − V) and (B − V), by Johnson (Reference Johnson1966) for (V − R) and (V − I) and by Koornneef (Reference Koornneef1983) for (V − J), (V − H), and (V − K). The number of stars included in the study for a particular cluster are listed in the Table 1.
3.1. Non-uniform extinction
To study the presence of non-uniform extinction in each cluster, we have calculated ΔE(B − V) = E(B − V)max − E(B − V)min, where E(B − V)max and E(B − V)min are the average E(B − V) of four highest and four lowest values of E(B − V). The values of ΔE(B − V) along with the central coordinates of each clusters are listed in the Table 2. The factors which can produce dispersion in ΔE(B − V) other than non-uniform extinction can cause maximum dispersion ~0.11 mag (Burki Reference Burki1975; Sagar Reference Sagar1985; Sagar Reference Sagar1987; Pandey et al. Reference Pandey, Mahra and Sagar1990; Yadav & Sagar Reference Yadav and Sagar2001). Therefore, the value of ΔE(B − V) greater than 0.11 mag can be considered as non-uniform extinction in the cluster. In the present study, except three clusters namely, NGC 2362, NGC 2384, and Collinder 69, all are having ΔE(B − V) value more than 0.11 mag. So this analysis confirms the presence of non-uniform extinction in all clusters except NGC 2362, NGC 2384, and Collinder 69. In case of NGC 6530, we found a result similar as that reported by Sagar (Reference Sagar1987).
The values of mean E(B − V), E(B − V)min, E(B − V)max, and ΔE(B − V) of each cluster are listed with their central coordinates.

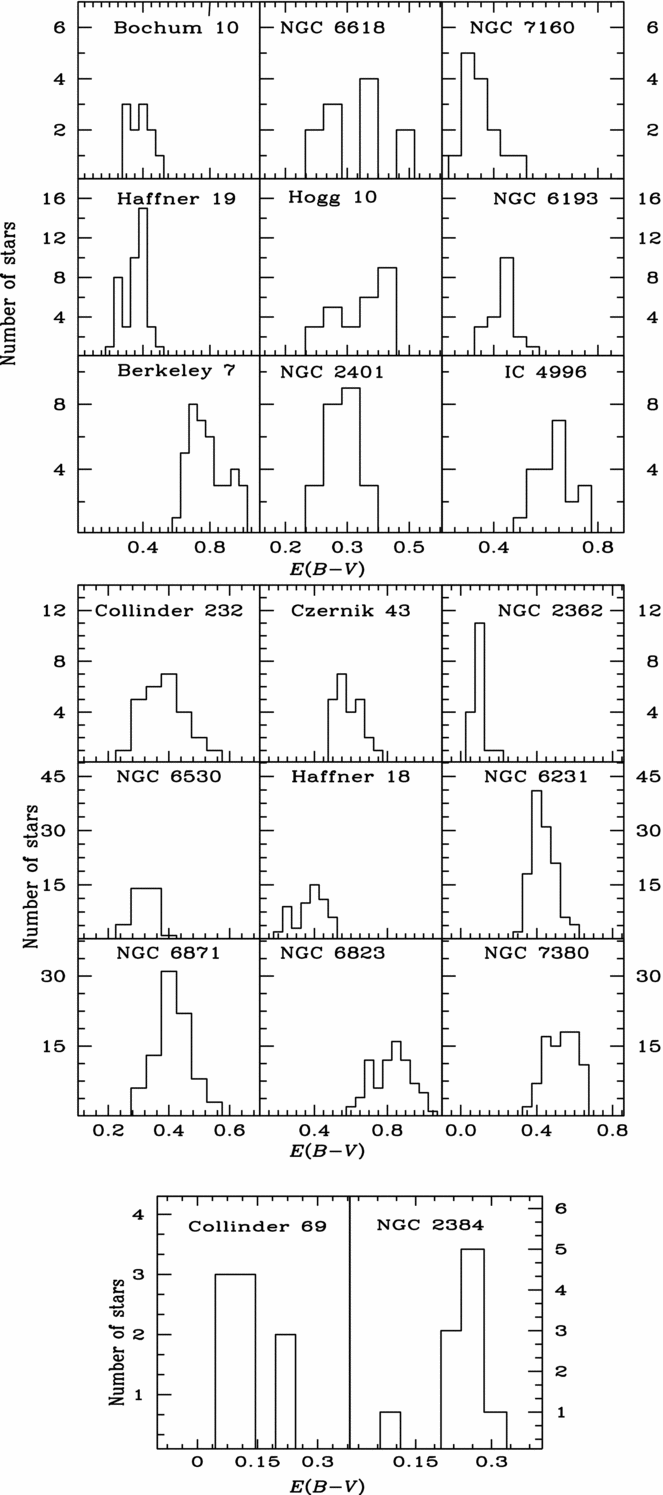
In addition to this, we have also analysed the extent of non-uniform extinction by plotting the histograms of E(B − V) as shown in Figure 2 for each cluster. Histograms show that all the clusters have a wide range in E(B − V) values. This indicates that all the clusters have different amounts of non-uniform extinction and dust is non-uniformly distributed over the cluster region. In the following sections, we explore the possible reasons for the presence of this type of distribution in E(B − V).
The dispersion of E(B − V) shows the presence of non-uniform extinction for the clusters under study.
3.2. Extinction law
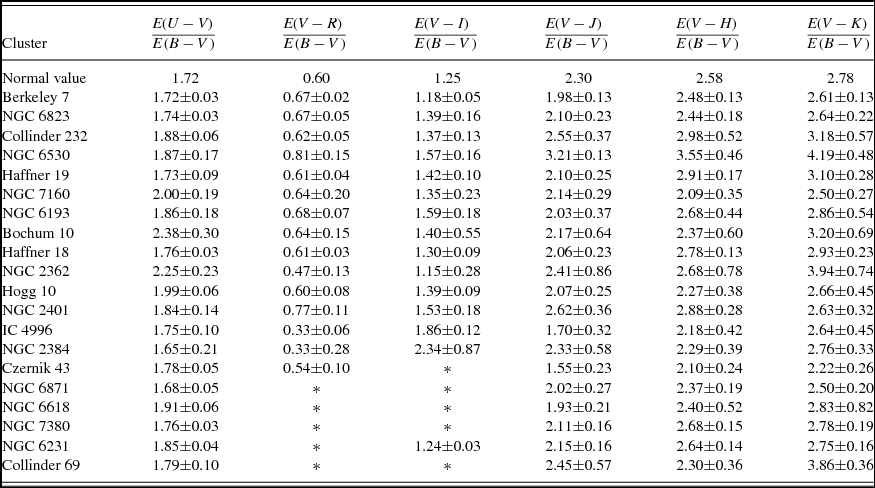
To investigate the interstellar extinction law towards the clusters, we have plotted the colour excesses E(U − V), E(V − R), E(V − I), E(V − J), E(V − H), and E(V − K) against E(B − V) in Figures 3–7. The solid line in the plots is the least-square fit to the data points. The slope of the colour excess ratios along with their error are listed in Table 3. The theoretical values of the colour excess ratios are taken from Pandey et al. (Reference Pandey, Upadhyay, Nakada and Ogura2002). By comparing the observed colour excess ratios with the theoretical one, following conclusions can be drawn:
-
(i) Twelve clusters namely NGC 6823, Haffner 18, Haffner 19, NGC 7160, NGC 6193, NGC 2401, NGC 2384, NGC 6871, NGC 7380, Berkeley 7, Collinder 69, and IC 4996 follow the normal extinction law in optical and near-IR region within 2σ, where σ is the standard deviation of data points. This shows the expected behaviour of the normal interstellar law in the direction of these clusters and hence presumably dust with normal characteristics in shape, size, and composition (Tapia et al. Reference Tapia, Costero and Roth1991). Similar results have also been discussed in Yadav & Sagar (Reference Yadav and Sagar2001) for the clusters NGC 1893, NGC 2244, Tr 37, and Be 68.
-
(ii) Six clusters namely Bochum 10, NGC 2362, Collinder 232, Hogg 10, NGC 6618, and NGC 6231 show anomalous behaviour in λ < λ J . These clusters have colour excess ratios greater than that of the normal value in optical band. This indicates that extinction law is different than for the normal extinction law. This also implies that dust particles in the direction of these clusters have smaller cross section than the normal ones (Turner Reference Turner1994).
-
(iii) Two clusters NGC 6530 and Czernik 43 show anomalous behaviour for λ ⩾ λ J . NGC 6530 have large colour excess ratios, while Czernik 43 have less ratios than the normal one.
The colour excesses E(U − V), E(V − R), E(V − I), E(V − J), E(V − H), E(V − K) are plotted against E(B − V) for the clusters Berkeley 7, NGC 6823, Collinder 232, and NGC 6530.

Same as Figure 3 for the clusters Haffner 19, NGC 7160, NGC 6193, and Bochum 10.
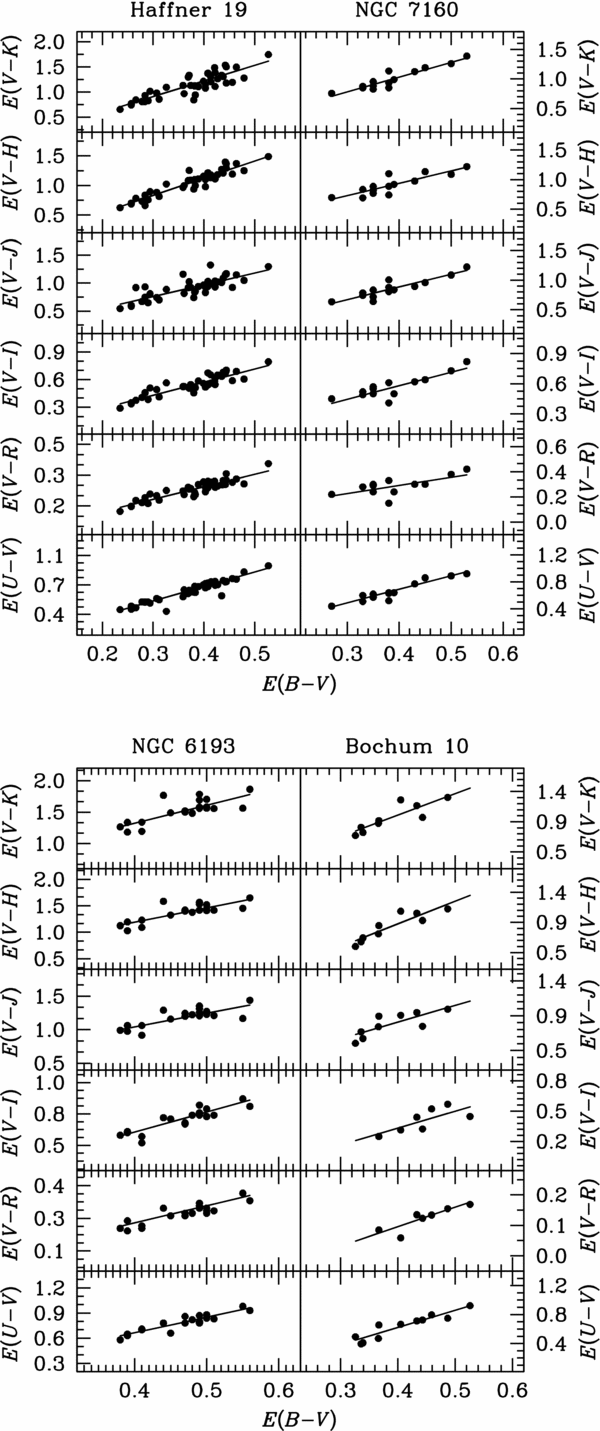
Same as Figure 3 for the clusters Haffner 18, NGC 2362, Hogg 10, and NGC 2401.
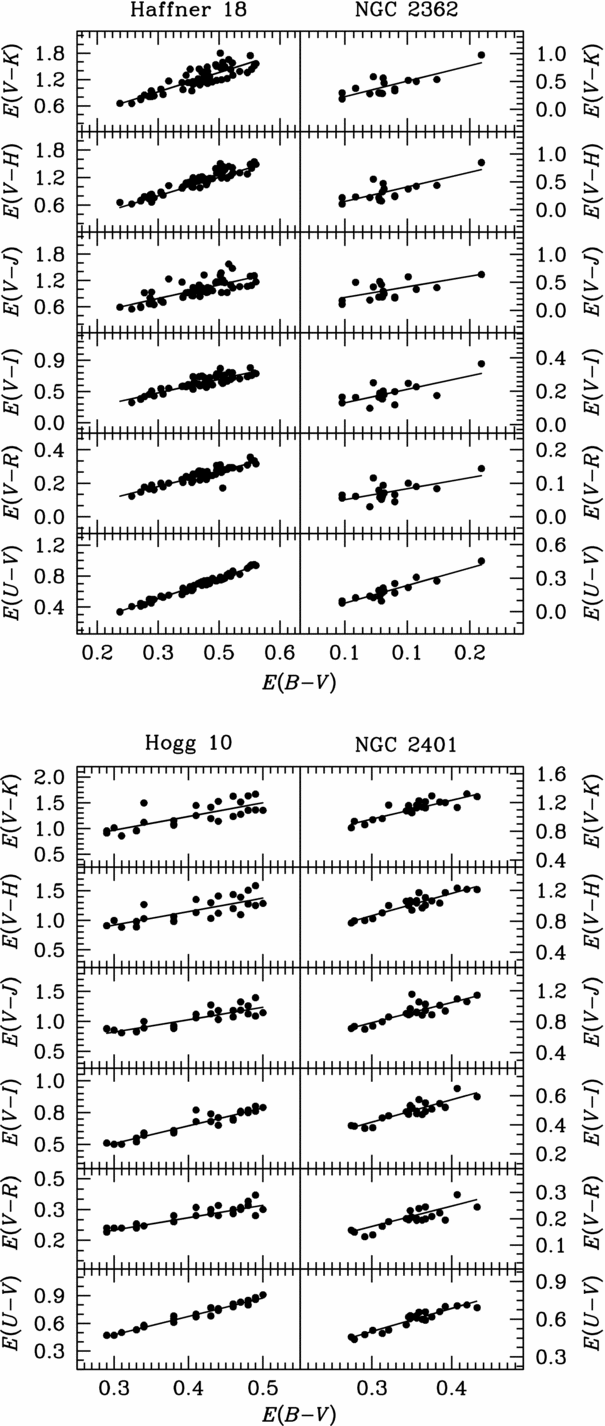
Same as Figure 3 for the clusters IC 4996, NGC 2384 Czernik 43, and NGC 6231.

Same as Figure 2 for the clusters NGC 6618, NGC 7380, Collinder 69, and NGC 6871.

The derived and normal colour excess ratios for all the clusters under study.
The extinction law around early type stars can be understood by the model given by Seab & Shull’s (Reference Seab and Shull1983) for dust grain processing due to passage of shock waves. Results of this model are naturally dependent on the physical conditions of the intracluster material (Sagar & Qian Reference Sagar and Qian1993). Small inhomogeneities in them would therefore result in large differences in the observed parameters. Consequently, depending upon the physical conditions of intracluster material, grain size distribution resulting from the interactions of strong radiations of hot O and B stars can be either normal or shifted by a small amount in either direction compared to that of normal sized particles. The anomaly depends on the direction of the shift, which ultimately depends on the grain destruction mechanism.
3.3. Variation of colour excess with age of the clusters
It is believed that stars are formed in the dense clouds of dust and gas, by contracting under their own gravitational attraction (Yorke & Krugel Reference Yorke and Krugel1977; Pandey et al. Reference Pandey, Mahra and Sagar1990). Not all of this gas or dust becomes part of star but also used in the formation of planets, asteroids, comets, etc. or remains as dust. So this remnant dust is either used in the star formation or blown away by the high radiation pressure of embedded or nearby stars (Pandey et al. Reference Pandey, Mahra and Sagar1990). Therefore, young open star clusters should have some amount of dust and gas which gradually decreases with time. It means there should be a relationship between age of the star cluster and the interstellar extinction. Pandey et al. (Reference Pandey, Mahra and Sagar1990) studied the variation of non-uniform extinction ΔE(B − V) with age for 64 open star clusters and found that extinction decreases with the age of the clusters and calculated the gas removal time larger than 108 yrs. As ΔE(B − V) represents the measure of non-uniform extinction, so we have plotted the age of each cluster with ΔE(B − V) to see the relationship between age of cluster and the presence of non-uniform extinction. This plot is shown in Figure 8. The values of ΔE(B − V) of the clusters under study are listed in the Table 2 and the ages of the clusters are taken from Table 1. For this study, we have also included the clusters studied by Yadav & Sagar (Reference Yadav and Sagar2001). To see the variation of mean ΔE(B − V) with age, we have binned the data into several groups with an age interval of 0.5 Myr. After binning the data, we have calculated the mean of ΔE(B − V) and its standard deviation, which are plotted in Figure 8. The variation of ΔE(B − V) with age indicates that a large amount of obscuring material is present in younger age clusters. For older clusters, the mean value of ΔE(B − V) is small. So we can conclude that the extent of non-uniform extinction decreases with age. Dust and gas may be blown away from the older clusters due to several reasons as discussed in Yadav & Sagar (Reference Yadav and Sagar2001). A similar analysis was also done by Yadav & Sagar (Reference Yadav and Sagar2001) and found the similar relationship between ΔE(B − V) and age of the clusters.
Variation of ΔE(B − V) with the cluster age. The open circles denote data points from present work and the filled circles denotes data points from Yadav & Sagar (Reference Yadav and Sagar2001). Note: Error bars denote the corresponding standard deviation of binned data.

3.4. Spatial variation of colour excess
To study the spatial variation of colour excess E(B − V), we have divided the whole region of the clusters into small square boxes. The clusters Collinder 69, Collinder 232, Czernik 43, NGC 6530, Bochum 10, NGC 2384, NGC 6618, and NGC 7160 were not considered for this study due to insufficient number of stars and smaller area. The area of the clusters Berkeley 7, Haffner 18, Haffner 19, Hogg 10, IC 4996, NGC 2401, NGC 6193, NGC 6231, and NGC 6823 is divided into small boxes of area 5 arcmin × 5 arcmin. For the clusters NGC 6871 and NGC 7380, the square boxes are of 10 arcmin × 10 arcmin due to the available larger area. We have calculated the mean value of E(B − V) and its standard deviation for the stars in each boxes. The close inspection of these values provides a clue that there is no significant variation of the mean colour excess values with the positions in the cluster area. A small variation of mean E(B − V) with position in NGC 6193 is observed and listed in Table 4. In NGC 6193, the value of E(B − V) decreases from east to west. A variation in E(B − V) with position has also been observed by Sagar (Reference Sagar1987) for three clusters NGC 6611, IC 1805, and NGC 6530 and by Yadav & Sagar (Reference Yadav and Sagar2001) for Tr 14.
The spatial variation of E(B − V) across the open cluster NGC 6193. In each boxes, there is mean values of E(B − V) with their standard deviation for corresponding 5 × 5 arcmin2. The numbers in the bracket represent the number of stars in that box.

3.5. Spectral type variation of colour excess
To understand the relation between the interstellar extinction and the spectral type of the stars, we plotted E(B − V) against the spectral type of the stars with gray open points in Figure 9. To see the significant variations, we have binned the stars in groups and calculated mean and standard deviation of E(B − V). The plots of mean E(B − V) against spectral type are shown in Figure 9 with black solid points. These plots clearly show that for most of the clusters there is no significant trend in E(B − V) with spectral class except Berkeley 7, Hogg 10, NGC 6871, and NGC 7380. For the clusters NGC 7380, NGC 6871, and Berkeley 7 initially E(B − V) remains constant, but after B6 spectral class, it decreases. In Hogg 10, E(B − V) decreases continuously from O to A type stars.
Variation of E(B − V) with the spectral class of the stars. The gray open circles represent the data points while the black solid points are mean E(B − V).

3.6. Colour excess variation with luminosity
To study the variation of E(B − V) with the luminosity of stars, we have plotted the colour excess E(B − V) against the absolute magnitude of the stars. These plots are shown in Figure 10 with gray open points. Apparent V magnitudes are converted into absolute magnitude M V by the relation M V = V −(5logd−5 + A V ) where A V = 3.25E(B − V) and distances are taken from Table 1. To see the clear variation in the colour excess, we have plotted the mean and standard deviation of E(B − V) against the absolute luminosity and shown in Figure 10 with the black solid points with errors. We grouped the stars to calculate the mean and standard deviation in colour excess. A close inspection of Figure 10 shows that there is no significant correlation of mean E(B − V) with luminosity for clusters Collinder 69, NGC 2384, NGC 6618, NGC 7160, Haffner 18, Collinder 232, Czernik 43, NGC 2362, NGC 2401, Haffner 19, NGC 6823, NGC 2362, IC 4996, NGC 6231, and NGC 6618. However, in the clusters NGC 7380, NGC 6871, and Berkeley 7, a decreasing trend of E(B − V) with luminosity is observed after M v ~0 mag. In Hogg 10, E(B − V) decreases continuously with M v .
Variation of E(B − V) with the luminosity of the stars. The gray open circles represent the data points while the solid black points are mean E(B − V).

3.7. Discussions of variable reddening
On the basis of the study presented in Sections 3.5 and 3.6, we divided the clusters sample into following three groups:
-
(1) Clusters namely Berkeley 7, NGC 7380, NGC 6871 belong to group 1 show a dependence of E(B − V) on both spectral type and luminosity. Initially, E(B − V) remains constant up to B6 spectral class and M v ~0 mag luminosity but decreases as we go towards late type spectral class and fainter stars.
-
(2) For the cluster Hogg 10 which is in group 2, E(B − V) continuously decreases with luminosity and temperature of the stars.
-
(3) The clusters belonging to group 3 are Collinder 69, NGC 2384, NGC 6618, NGC 7160, Haffner 18, Collinder 232, Czernik 43, NGC 2362, NGC 2401, Haffner 19, NGC 6823, NGC 2362, IC 4996, NGC 6231, Hogg 10, and NGC 6618. For these clusters, no dependence of E(B − V) on either spectral type or luminosity is seen.
The observed dependence of E(B − V) on the spectral type and luminosity of the stars in groups 1 and 2 is due to the presence of circumstellar matter around them as discussed by Sagar (Reference Sagar1987). In these groups, the value of E(B − V) is higher for early type and most luminous stars. Yorke & Krugel (Reference Yorke and Krugel1977) and Bhattacharjee & Williams (Reference Bhattacharjee and Williams1980) discussed that relative mass of the relict envelope present around a newly formed massive star is positively correlated with the stellar mass. Massive main sequence stars blow off their circumstellar material by emitting strong stellar winds and ultraviolet radiations. But the time required to blow off this circumstellar material is dependent on various parameters as discussed by Sagar (Reference Sagar1987). Therefore, stars of groups 1 and 2 have their circumstellar material still present around them, whereas group 3 stars have blown their circumstellar envelope away.
3.8. Near-IR fluxes
The total interstellar extinction towards a star is the summation of three terms as stated by Yadav & Sagar (Reference Yadav and Sagar2001). These three terms are (i) interstellar extinction caused by the dust and gas present between the observer and the cluster, (ii) intra-cluster extinction caused by the dust and gas present inside the cluster field, and (iii) circumstellar extinction caused by the remnant discs or envelope around the young cluster members in which the disc is not completely dissipated.
Generally, it is assumed that the interstellar extinction caused by general interstellar medium between observer and the object follows the normal interstellar extinction law. So if there is an anomaly in the observed extinction law, then it may be due to the intra-cluster extinction or due to the circumstellar extinction or due to both. Since in the present study we have selected brighter stars in young clusters, so it may be possible that the observed anomaly in the interstellar extinction law may be due to the reasons listed in points (ii) and (iii) in above paragraph. To test these two possibilities, we have to use the colour excess E(V − J) instead of E(B − V) as stated by Smith (Reference Smith1987), Tapia et al. (Reference Tapia, Roth, Marrow and Ruiz1988), Sagar & Qian (Reference Sagar and Qian1989, Reference Sagar and Qian1990), and Yadav & Sagar (Reference Yadav and Sagar2001) that the value of E(V − J) is independent of the properties such as chemical composition, shape, structure, and degree of alignment of the interstellar dust and cloud (Vashchinnikov & I1’in Reference Vashchinnikov and I1in1987; Cardelli, Clayton, & Mathis Reference Cardelli, Clayton and Mathis1989). In order to study the reason behind the anomaly in the observed interstellar law, we have calculated the differences between the observed values of E(V − H) and E(V − K) based on spectral classification and the derived colour excess values from E(V − J) assuming normal extinction law and has been plotted against the corresponding value of E(V − J) in Figures 11 and 12.
Plots of near-IR flux excess in terms of Δ(V − H) and Δ(V − K) against the colour excess E(V − J). The black line denotes the zero excess and the broken lines denote the extent of significant error.
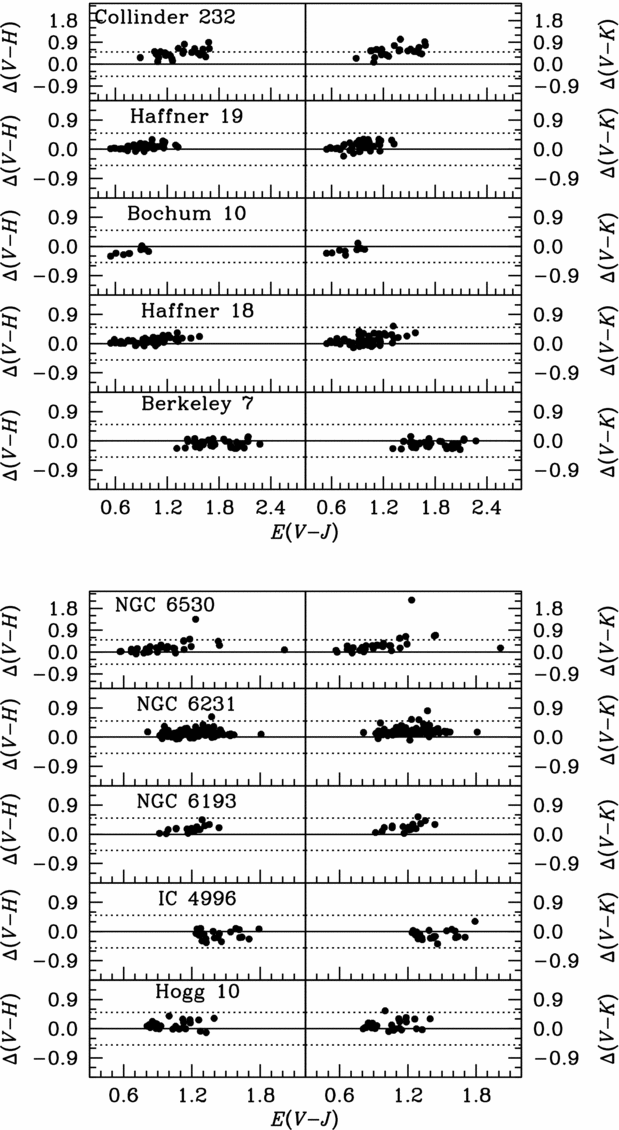
Plots of near-IR flux excess in terms of Δ(V − H) and Δ(V − K) against the colour excess E(V − J). The black line denotes the zero excess and the broken lines denote the extent of significant error.

In the Figures 11 and 12, Δ(V − H) and Δ(V − K) are the differences of observed and derived colour excess, the continuous line denote the zero value of Δ(V − H) and Δ(V − K). The errors in Δ(V − H) and Δ(V − K) mainly occur due to observational uncertainties in JHK magnitudes, inaccuracies in the calculation of E(V − J), and errors in spectral classification. The maximum value of differences due to these factors can be ~0.5 mag and denoted by dotted lines in Figure 11.
On close inspection of Figures 11 and 12, we can see that for most of the clusters, stars are concentrated around the zero value and inside the error line, which indicates that there is no near-IR excess fluxes in the stars of the clusters. In the clusters namely Collinder 232, NGC 6530, and NGC 6231 there are some stars which have larger value of Δ(V − H) and Δ(V − K) and they are lying outside the error boundary. These stars are listed in Table 5.
Near-IR flux excess in stars of cluster under study. Star numbers are taken from WEBDA.

All the stars listed in Table 5 for the clusters Coll 232, NGC 6530 and NGC 6231 have larger values in Δ(V − K). It is possible that circumstellar material is present around these stars. We have detected near-IR fluxes for these stars for the first time. Strom, Strom, & Yost (Reference Strom, Strom and Yost1971) and Strom et al. (Reference Strom, Strom, Yost, Carrasco and Grasdalen1972) noticed the presence of circumstellar material around NGC 2264-90 on the basis of near-IR fluxes. Smith (Reference Smith1987) and Yadav & Sagar (Reference Yadav and Sagar2001) have also found near-IR excess fluxes for the stars Tr 14-15, NGC 2264-165, and Tr 16-68.
4 CONCLUSIONS
In the present study, we analysed the interstellar extinction law in the direction of 20 open clusters younger than 50 Myr. We have also studied the variation of colour excess E(B − V) with age, luminosity, spectral type, and position of stars in the cluster. The main results of this study are summarised as follows:
-
1. The histograms of E(B − V) show that gas and dust is non-uniformly distributed over the cluster area in each cluster. The value of ΔE(B − V) confirms the presence of non-uniform extinction in all clusters under study except NGC 2362, NGC 2384, and Collinder 69. Our analysis shows that non-uniform extinction decreases with the age of the clusters. This indicates that dust and gas are still present in younger clusters while it has been blown away in older clusters by UV radiations of hot stars.
-
2. Derived colour excess ratios show that 12 clusters NGC 6823, Haffner 18, Haffner 19, NGC 7160, NGC 6193, NGC 2401, NGC 2384, NGC 6871, NGC 7380, Berkeley 7, Collinder 69, and IC 4996 have normal extinction laws in the optical and near-IR regions within 2σ error. This indicates that dust and gas present in the clusters have normal size distributions. Six clusters Bochum 10, NGC 2362, Collinder 232, Hogg 10, NGC 6618, and NGC 6231 show anomalous behaviour in the optical band. Two clusters NGC 6530 and Czernik 43 show anomalous behaviour for λ ⩾ λ J . This shows that the extinction law for these clusters is different from normal one.
-
3. Spatial variation of the colour excess E(B − V) has been found only for one cluster, NGC 6193, in the sense that E(B − V) is decreasing from east to west. For other clusters, E(B − V) is distributed non-uniformly over the cluster field.
-
4. A small variation in E(B − V) with spectral class and luminosity of stars have been found in the clusters Berkeley 7, NGC 7380, NGC 6871, and Hogg 10. The observed dependency of E(B − V) shows that early type stars in these clusters are having some amount of dust and gas around them.
-
5. From the near-IR flux values, we identified eight stars in Collinder 232, four stars in NGC 6530, and one star in NGC 6231 which are having significant near-IR excess fluxes. Higher fluxes may be due to the presence of circumstellar material around these stars.
ACKNOWLEDGEMENTS
We are thankful to the anonymous referee for careful reading of the paper and constructive comments. We also thank Prof. Johan P. U. Fynbo, Niels Bohr Institute, University of Copenhagen, Denmark for reading our manuscript. This research has made use of the WEBDA database, operated at the Department of Theoretical Physics and Astrophysics of the Masaryk University. We have also used data from Two Micron All Sky Survey, which is a joint project of the University of Massachusetts and the Infrared Processing and Analysis Center/California Institute of Technology, funded by the National Aeronautics and Space Administration and the National Science Foundation.



