
INTRODUCTION
After reading Jacobides, MacDuffie, and Tae (Reference Jacobides, MacDuffie and Tae2016), the success of Tesla in launching a new automobile company in a crowded sector puzzled us. Jacobides, MacDuffie, and Tae (Reference Jacobides, MacDuffie and Tae2016) had convinced us that developing the capabilities to become the manufacturer of a complete, safe automobile system would be quite difficult. Since the establishment of the dominant design for the auto in the 1920s, the industry has operated on the premise of massive economies of scale. Original equipment manufacturers’ (OEMs) role in taking responsibility for the legal liability of the whole automobile, combined with their extensive supply and marketing chains, has ensured they remained dominant in the sector despite some missteps with modularisation and outsourcing efforts (Jacobides, MacDuffie, & Tae, Reference Jacobides, MacDuffie and Tae2016; Schulze, MacDuffie, & Taube, Reference Schulze, MacDuffie and Taube2015). No major component supplier has succeeded in forward integrating into becoming an OEM and no new entrants have challenged the dominance of the incumbent OEMs since the earliest days of the auto industry (Jacobides & MacDuffie, Reference Jacobides and MacDuffie2013).
Researching the development history of Tesla, we have pieced together the key features of how Tesla achieved its successful entry into the automobile sector. From this we have concluded, based on the development time and costs associated with the Tesla Model S, that a well-funded company could develop a new electric vehicle (EV) from scratch and move it into production within 3 to 5 years, by spending $1–2 billion of capital for design, development, and manufacturing. Without a doubt, increasing production to the levels of mass producers would take much longer, but the Telsa example demonstrates that new entry into the industy has become feasible.
Tesla's trajectory, from start-up on the brink of bankruptcy to a company mass producing electric vehicles within 5 years, raises important questions about the future of the global automobile sector. What would prevent Apple and Google, two companies that clearly have the resources to fund $2B in R&D, from entering the market and contesting fiercely with the dominant OEMs such as GM, Ford, VW, Mercedes, and Toyota? There are already many ventures in the Chinese electric automobile sector, such as BYD, Qiantu, NIO, and many more. Inspired by the success of Tesla, why would Chinese software and internet giants such as Tencent and Alibaba not enter this large market given that Tesla did not have prior experience and was able to get a successful car ready for sale within 5 years?
In this perspective piece, we offer our reflections on the implications of the success of Tesla for the dynamics of the global automobile sector. We will appraise the chances that Chinese firms will for the first time become leading players in pushing the frontier of automotive technology, a goal that has eluded them over the past 30 years despite massive government efforts to create strong home-grown auto companies.
HOW DID TESLA DEVELOP CAPABILITIES TO PRODUCE AN ENTIRE AUTO?
Since its founding in 2003, Tesla's vision was to manufacture mass-market battery electric vehicles (EV) that offered a compelling customer value proposition including long range and recharging flexibility, energy efficiency, low cost of ownership and high performance which didn't compromise design or functionality (Tesla Motors, 2010a). Tesla got its start with a $6.5 million investment from Elon Musk and leased a warehouse in Silicon Valley just big enough to assemble a few prototype vehicles (Vance, Reference Vance2015).
Retrofitting Existing Car with Electric Power
The company focused on developing the Roadster, a premium EV sports car based on the Lotus Elise platform. The intent was simply to replace the internal combustion engine (ICE) powertrain with an electric one, consisting of lithium ion batteries, power electronics, motors, gearbox, and control logic. Tesla used standard 18650 battery cells and combined many thousands in parallel to form a battery pack. Within four months the first prototype of the Roadster was completed with less than 20 employees. However, developing a robust battery required engineering solutions to keep them cool, prevent them from catching fire and causing explosions. In 2005, Tesla engineers performed many fire and explosion experiments, in order to develop a robust and safe battery pack. Being a start-up, Tesla brought a can-do attitude to engineering and manufacturing. This had the advantage of solving individual problems quickly, but slowed down progress when changes in one area of the car had knock-on effects into another area. As a result, while Tesla originally planned to ship the first Roadster in 2006, the delivery date continued to slip due to engineering and manufacturing issues into 2008. Tesla delivered approximately 2,450 Roadsters between 2008 and 2012 (Tesla Motors, 2012).
Hiring Experienced Auto Engineers
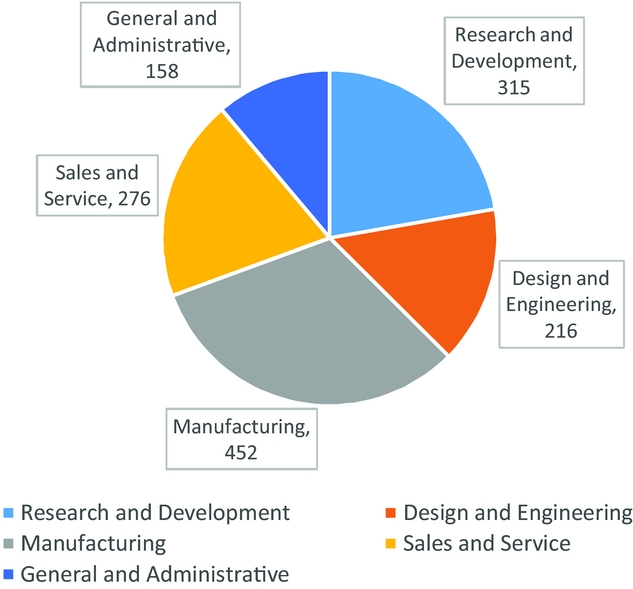
Tesla started work on the Model S in 2007 and by March 2009 had finished the prototype design (Davis, Reference Davis2010). At this time, the company had a few hundred employees and was also manufacturing the Roadster. In contrast to its approach with the Roadster, Tesla hired a team of seasoned automotive engineering and manufacturing specialists to design and develop the Model S, with experience at companies including Audi, BMW, GM, Jaguar, Mazda and Toyota. Engineers from leading automobile companies, were hired, alongside engineers with electrical, electronic and IT backgrounds from leading Silicon Valley firms. This included Franz von Holzhausen, Chief Designer of the Model S (from GM, Audi and Mazda) and Gilbert Passin as VP Manufacturing (from Toyota). In 2010, 2011, and 2012 Tesla had 899, 1417, and 2964 employees, respectively (Tesla Motors, 2010b, 2011, 2012). Figure 1 shows the distribution of employees by function at the end of 2011, when the company was ramping up its preparations to deliver the Model S. Of a total of 1417 employees, Tesla had 315 (22%) in R&D and 216 (15%) in Design and Engineering, which is a much higher percentage than a traditional car company. Tesla stationed its design engineers at the manufacturing facility, reducing total overheads and increasing interaction and feedback between the engineering and production departments (Tech Talker, 2014).
Distribution of employees by function at end of 2011 (data from Tesla Motors, 2011)
The characteristics of the Model S were a sleek design with an all-aluminium light weight body. Tesla abandoned the conventional ICE layout, and mounted the battery pack on a large rigid and flat floor (Dryer & Furr, Reference Dryer and Furr2016). This led to a low centre of gravity and good weight distribution between the front and rear axles, which in turn gave very good handling. Electric motors and the gearbox were located at each wheel and designed around the battery packs. The number of moving parts was very small, reducing noise and vibration.
Making Model S Safe through Design Choices
In terms of the powertrain, Tesla focused on the core intellectual property of four components – the advanced battery pack, the power electronics module, the high efficiency motor and the electronic control software (Tesla Motors, 2011). A key strategy that Tesla adopted was that the battery pack could accommodate different battery cell chemistries and was designed to allow for multiple suppliers. Tesla argues its integration of these components is more valuable than the sum of parts and is therefore a core competency providing the company with competitive advantage (Evanson, Reference Evanson2013).
The Model S design choices led to it achieving the highest safety ratings in history (Vance, Reference Vance2015) and the car becoming the most awarded car of 2013 (Evanson, Reference Evanson2013). The large floor space enabled Tesla to install battery capacities up to 85 kWh, so that the car could run for up to 300 miles on a single charge – and beyond the requirements of most customers. In addition, the Tesla architecture was designed to be a platform for models beyond the Model S: ‘with an adaptable platform architecture and common electric powertrain to provide . . . the flexibility to use the Model S platform to cost efficiently launch new electric vehicle models subsequent to the start of production of the Model S’ (Dryer & Furr, Reference Dryer and Furr2016).
The Model S was the first luxury battery EV sedan with high performance, accelerating faster than many sports cars, with some models reaching 60 mph in circa 3 seconds (Tesla Motors, 2015). The Model S also incorporated at lot of innovation from the IT sector, including an electronic dash board and a 17” touch screen, which enabled all controls of the car to be manipulated. The embedded IT functionality, allowed features such as the summon feature, auto parking and autopilot to be incorporated. The combination of a heavier use of electronic components, fewer moving parts and online connectivity, meant that Tesla's cars could be upgraded via software easily and much more substantially than conventional ICE cars (Hettich & Müller-Stewens, Reference Hettich and Müller-Stewens2014).
Tesla's original plan was to make 10,000 Model S sedans per year and spend $130 million on development and manufacturing (Vance, Reference Vance2015). While CEO Elon Musk had been successful producing the Roadster as the first stage in the master product plan, Tesla was not profitable and faced bankruptcy in December 2008. Critical to Tesla's ability to develop the Model S was the funding it secured in 2009 and 2010. Up to that time Tesla had spent about $185 million and delivered less than 1000 Roadsters (which amounted to about 100 million in sales). In mid-2009, Tesla secured a US Department of Energy (DOE) loan of $465 million to support (i) engineering, production and assembly of the Model S and (ii) development of a manufacturing facility to build electric vehicle powertrain components (Tesla Motors, 2010a).
Buying Existing Auto Plant
A major coup for Tesla was the purchase of the NUMMI factory in Fremont, CA for $42 million from Toyota in 2009 (Tesla Motors, 2010a). The factory had produced up to 450,000 cars per year for Toyota and GM and was valued at over $1 billion. The purchase also enabled Tesla to meet the pre-conditions for the release of funds under the DOE loan scheme. Tesla adopted a vertical integration model to a much larger degree than other automobile companies. It produced 95% of its stampings in-house, developed its own software to control the car and installed 185 robots at the NUMMI factory to automate more manufacturing operations than any other car factory in the USA (Tech Talker, 2014). The vertical integration approach helped Tesla learn quickly and maintain control of all the key design details. Tesla went further, vertically integrating its retail sales channel and building its own network of charging stations.
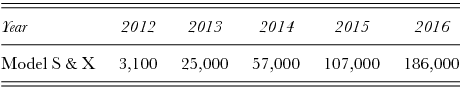
The first Model S sedan was manufactured in June 2012. Table 1 shows the volumes of cars manufactured by Tesla compiled from SEC Filing data (Tesla Motors, 2012–2016).
Approximate cumulative delivery volumes of Tesla Model S and X vehicles
In addition to the DOE loan, Tesla received tax breaks and incentives from the California Alternative Energy and Advanced Transportation Financing Authority (CAEATFA). These totalled $31 million in 2011. Buyers of Tesla vehicles were also entitled to a tax break due to the Zero Emission Vehicle (ZEV) program of up to $7,500 per vehicle (Tesla Motors, 2010b). In 2009, Daimler recognized Tesla's leadership in battery-pack design, agreeing to a battery supply agreement for their Smart cars and later invested $50 million for 9% of the company, valuing it at over $500 million.
In June 2010, Tesla Motors conducted an initial public offering on the New York Stock Exchange, becoming the first new U.S. automobile company to do so since the 1950s (Tesla Motors, 2010a). Tesla raised $226 million from the IPO, valuing the company at $2 billion. In the same year, Panasonic invested $30 million under a battery partnership and Tesla raised a further 172 $million in May 2011 and 192 $million in September 2012 via secondary offerings.
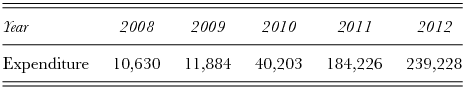
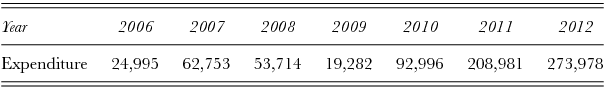
Capital expenditures between 2008 and 2012 (when the first Model S was delivered) totalled $486 million and research and development expenditures between 2006 and 2012 totalled $737 million as shown in Tables 2 and 3 (Tesla Motors, 2010a, 2010b, 2011–2016).
Tesla capital expenditures for 2008 to 2012 (in thousands)
Tesla R&D expenditures for 2006 to 2012 (in thousands)
The core elements of Tesla's strategy have been: (i) proprietary integrated electric powertrain, (ii) vertical integration from development through to production and retail sales, (iii) significant incorporation of IT capabilities into the auto, (iv) uncompromising focus on battery electric vehicles, and (v) build-out of supercharger network and free charging for customers. However, the above strategy cannot fully explain Tesla's success. Timing and vision played a significant role. Tesla was one of only a handful of pure EV car makers globally in the mid-2000s and probably the first to develop a robust EV powertrain and battery pack. The company was a first mover in betting that lithium-ion battery costs would continue to decrease for many years to come. Tesla's hard charging nature, led by CEO Elon Musk and its unique branding approach enabled it to distinguish itself from other car-makers and attract loyal customers, despite many missed deadlines in the early days of the Roadster and Model S development.
Contrary to our expectation from reading Jacobides, MacDuffie, and Tae (Reference Jacobides, MacDuffie and Tae2016), Tesla suggests that at least in the EV space developing the capabilities to produce a safe car is not that difficult. Tesla's journey with the Model S shows that a well-funded company could develop a new EV from scratch and into production within 3 to 5 years, with about $1–2 billion of capital for design, development and manufacturing (and a bit of luck).
REFLECTIONS ON THE FUTURE OF THE AUTOMOBILE
The Tesla story suggests that barriers to entry for the automobile industry are coming down. Tesla's big-break came with securing the NUMMI plant for a fraction of its replacement cost and securing favourable DOE loans. New entrants in the automobile sector can take advantage of contract manufacturing (CM), to reduce their upfront capital costs. For example, Valmet Automotive has manufactured cars for large OEMs for decades, and currently makes the Mercedes GLC in Finland. New entrants have already used the services of contract manufacturers such as Valmet to produce their cars. In addition, given the overcapacity in manufacturing they may be able to buy an existing plant as Tesla did with NUMMI. GM last year shut its last plant in Australia and a British EV entrepreneurs is in talks to buy the assets (Davies, Reference Davies2018).
In the future dynamics of the auto sector, substantial value migration could occur to new entrants that focus on critical aspects of the auto industry value chain or on niche markets in the electro-mobility age. These critical elements are likely to be dominated by sensors, specialised computer hardware (i.e., video recognition), communication and control software. For example, the platform operating system that is used to control the car and communicate between the car and its surroundings, could become a critical battleground over which new entrants and incumbent OEMs fight to obtain, or retain, a dominant position in the industry.
Connectivity via vehicle-to-vehicle and vehicle-to-infrastructure communications will require standards. Could the players developing the platform operating systems become the kingpins in the future auto industry, setting standards and forcing other actors in the auto ecosystem to adopt them (Jacobides & MacDuffie, Reference Jacobides and MacDuffie2013)? The current three big players in this space are Google, Apple, and Microsoft. Each have already adapted operating systems for the car (Android, IOS, and Windows Embedded Automotive, respectively). In China, Baidu and Alibaba are actively working on similar systems. While the early generations of these products have focused on smart phone connectivity etc., to enhance phone operations and music playing, these platforms could readily form the basis of future features such as advanced driving navigation, partial and fully autonomous driving and communication and connectivity to manage traffic flows. Apple is known to be working on car applications and autonomous vehicle technology (Bergen & Webb, Reference Bergen and Webb2017). Already, driving navigation tools leverage online mapping and big data in real time to provide guidance of how to avoid traffic jams. In future, the same systems could manage traffic flows automatically if a sufficient portion of the traffic is connected to the one system.
The large IT companies such as Google, Apple, Microsoft and their Chinese counter-parts Alibaba, Baidu, and Tencent have the financial capacity and technical capabilities to repeat the Tesla journey, or even, to buy an OEM outright. Apple for example in February 2018 is sitting on US $250 billion in cash and its stock value is 15 times as large as GM (US $ billion 900 versus 60 billion). If large IT companies decide that it does not make sense for them to become system integrators outright, then they could focus on capturing value by developing platform technologies that become installed in the cars produced by the OEMs through alliances. Companies such as N-Vidia and Intel are currently adopting this approach (Turner, Reference Turner2017). For IT companies, this strategy would leverage their existing competitive advantage in hardware, software, smart phones, big data, artificial intelligence and cloud services infrastructure (e.g., see for example Sangameswaran & Nagarajan, Reference Sangameswaran and Nagarajan2017). For B2C firms such as Apple, the aim could be to develop ecosystems which seamlessly integrate a user's smart phone, their connected ‘smart’ home and the ‘smart’ car; for B2B firms such as Intel, the aim could be to develop an IT vehicle platform that multiple OEMs install in each car. It is conceivable that in the long term controlling the automotive IT platforms may become more valuable than making the car itself, especially if individual ownership substantially declines, reducing the value of automotive aesthetics. This is precisely what happened with the PC three decades ago, when a large portion of the sector value migrated to the producers of the critical components, being the CPU (Intel) and operating system (Microsoft) (Jacobides & MacDuffie, Reference Jacobides and MacDuffie2013).
Thus, competition in the auto market is increasing, driven by a convergence of trends including electrification of the powertrain, greater use of ride-sharing and the future prospects for autonomous vehicles. New companies are being formed in an attempt to take advantage of the lower barriers to entry, while IT companies are vying to enter the sector directly or develop standards and platforms so they can become kingpins and control the emerging ecosystem(s).
As barriers to entry have come down, competition in the EV space has changed dramatically since the Model S was launched in 2012. New entrants such as the Chinese company Qiantu are attempting to repeat Tesla's success in China and have announced a luxury EV sports car with the intention of developing more models in future (Schuman, Reference Schuman2017). Established companies such as BYD of China already have a range of EV and PHEV cars on sale. Over the coming 3 to 5 years all major OEMs will have hybrid EVs and battery EVs across most major market segments and will be delivering those products at scale. What will be the ramifications for new entrants and even Tesla? Although Tesla, has a current market capitalisation greater than both GM and Ford, it still needs to ramp up production of the Model 3 and compete against rivals such as the Chevy Bolt and forthcoming compact luxury EVs from European and Japanese manufacturers.
In China, the government is backing the development of a local EV industry with substantial funding and tariffs on imported autos. While China's strategy to become a leading manufacturer of ICE automobiles hasn't been fulfilled, the electric vehicle market is less mature and may offer a second opportunity for Chinese manufacturers to develop products which could compete globally. And in China, so-called new energy vehicles, are expected to capture most of the auto sales growth in the country over the next 8 years (Banjo, Reference Banjo2017). A plethora of new entrants have already started manufacturing everything from electric motorbikes and electric delivery vans to electric sports cars. Global start-up NIO (2017), with backing from Baidu, Tencent and several Silicon Valley venture capital firms has developed an electric super-car and announced plans to introduce an all-electric SUV in China in 2018. BYD has become the world's second largest manufacturer of plug-in hybrid vehicles (behind Nissan) with cumulative production of more than 170,000 units. BYD already produces over 8 GWh of batteries per annum, compared to less than 1 GWh by Tesla.
Chinese internet companies Baidu, Alibaba, and Tencent are investing in autonomous driving technologies, start-up electric car companies and joint ventures with OEMs. Baidu has established an autonomous vehicle division and invested into NIO. Tencent has a 5% stake in Tesla, while Alibaba has a co-operation agreement with SAIC and is actively developing internet connected cars (SAIC Motor, Reference Motor2016). Given government support, it seems likely that the Chinese internet giants will be in a good position to develop and potentially dictate the autonomous driving platforms used in China.
Emerging manufacturers like Tesla are seeking to become significant OEMs while new IT entrants are working on everything from mapping technologies and smartphone connectivity through to new automobile operating systems and autonomous vehicles. In light of our analysis of Tesla's development, large IT companies could enter automobile manufacturing directly in the next few years. Clearly they do not have to because they can participate in the new automobile ecosystem in many different ways. The automotive industry is now facing its greatest transformation since Edison and Ford argued over whether gasoline combustion or lead-acid batteries should power the automobile a century ago (Israel, Reference Israel1998).
For management scholars, the success of Tesla, the emergence of new automobile OEMs in China, and the strategic moves by IT companies to establish themselves in new segments of the industry raises important questions whether the future of automobiles will look very different than its past. If one thing is for sure, it is that the success of Tesla has heralded a new era in the automobile industry. As innovation and competition in the automotive sector increases, consumers will be the big winners. There is more choice than ever and new cars are more efficient, safer and have more features than those which came before.


