

Quality of life (QOL) assessment has many apparent merits in the measurement of outcome in chronic illness. It can be used to measure incremental improvements rather than complete cure; it takes account of a wide range of aspects of daily living; it places the consumer at the centre of the picture; and it can be used across various disciplines of medicine (Reference Oliver, Huxley and BridgesOliver et al, 1996). In psychiatry, interest in the measurement of QOL was stimulated by the plight of deinstitutionalised individuals with mental illness and by a parallel interest in assessing such dimensions of daily life as personal safety, isolation, poverty and transience of accommodation. The QOL measures have shown success in comparing different populations of people with mental illness in different circumstances and treatment conditions (Reference Lehman, Possidente and HawkerLehman et al, 1986; Reference Kaiser, Priebe and BarrKaiser et al, 1997; Reference Warner and HuxleyWarner & Huxley, 1998; Reference Warner, de Girolamo and BelelliWarner et al, 1998). It remains an open question, however, whether the approach will prove effective in assessing change over time (Reference Barry and ZissiBarry & Zissi, 1997; Reference LehmanLehman, 1999).
Subjective and objective quality of life
There is no single, universally accepted definition of QOL (Reference LauerLauer, 1999). The World Health Organization definition, for example, focuses on the subjective perspective (WHOQOL Group, 1993), whereas other constructs are broader and include objective indicators of health, housing and other material circumstances. According to recent reviews (Reference LauerLauer, 1999), most researchers believe that both subjective and objective information is necessary to the construct.
Complications arise, however, from the finding that the subjective appraisal of life often bears little or no relation to objective life circumstances (Reference Barry and CrosbyBarry & Crosby, 1996; Reference WarnerWarner, 1999). The same objective event may result in opposite evaluations by the same subject depending on his/her perspective at the time of interview (Reference Skantze, Wanke and BlessSkantze et al, 1994). Objective improvements in life circumstances may produce negative subjective responses (Reference LehmanLehman, 1996). Subjective QOL ratings are often higher in people with schizophrenia than affective disorder, although objective circumstances indicate the reverse (Reference Atkinson, Zibin and ChuangAtkinson et al, 1997; Reference Katschnig and AngermeyerKatschnig & Angermeyer, 1997). A weak or moderate association between observer-rated mental health indicators, such as psychopathology, and subjective QOL has been found in various studies (Reference Corrigan and BuicanCorrigan & Buican, 1995; Reference LehmanLehman, 1996; Reference Oliver, Huxley and BridgesOliver et al, 1996; Reference Kaiser, Priebe and BarrKaiser et al, 1997; Reference Ruggeri, Santolini and StegaganoRuggeri et al, 1999).
With such concerns in mind, this study was designed to investigate the relationship between QOL and key mental health indicators both cross-sectionally and over time, with a particular focus on the differential role of subjective and objective QOL dimensions. Specifically, the study investigates the relationship between these two dimensions, as measured by the Lancashire Quality of Life Profile and demographic variables, diagnosis, psychopathology, disability, functioning, service use, service satisfaction, affect balance and self-esteem at two points in time.
METHOD
Design
Data were collected as part of a naturalistic longitudinal study assessing the outcome of care provided by the community-based service of South Verona: the South Verona Outcome Project (Reference Ruggeri, Biggeri and RucciRuggeri et al, 1998). Information was gathered by the primary treating professional, reported by patients themselves using QOL and service satisfaction questionnaires and obtained from the psychiatric case register (PCR). In this study, data gathered from the same cohort in 1994 and 1996/97 (mean follow-up interval=29.96 months, s.d.=5.71), including patients no longer in treatment, were analysed. The study reported here is a factor analysis of responses to a QOL instrument to determine latent QOL constructs, followed by regression analyses to identify determinants of the constructs cross-sectionally and longitudinally.
Area and mental health service
South Verona is a relatively affluent urban area of north-east Italy, with a population of 75 000. The community mental health service (CMHS) provides the main source of care to area residents, and includes in-patient, out-patient, day care and emergency and rehabilitation services. The South Verona PCR, established in 1978 to collect data on all patients seen by the service, includes demographic, diagnostic and service utilisation information (Reference TansellaTansella, 1991).
Subjects
The analysis reported here is based on 285 patients, over age 15, attending the CMHS who completed the assessments of the South Verona Outcome Project (Reference Ruggeri, Biggeri and RucciRuggeri et al, 1998) in October-December 1994; of these, 183 were followed up in 1996/97, including 54 who were no longer in treatment with the agency. Decrease in cohort size was due to death of subjects (n=11), subjects' refusal to participate (n=20) or to complete the interview (n=28) and failure to locate the subject (n=43). After complete description of the study to the patients, written informed consent was obtained.
Measures
Demographic, diagnostic and service utilisation data for the prior year were extracted from the PCR. Diagnoses were based on ICD-10 (World Health Organization, 1992) and grouped in six categories as follows: schizophrenia, severe affective disorder, depression without psychotic symptoms, neurotic and somatoform disorder, personality disorder and other diagnoses. In some analyses a dichotomous classification of psychotic disorder (including schizophrenia and severe affective disorder) versus not psychotic was used (see Table 1 for more details). The clinicians making the diagnoses were specially trained in ICD coding. An exercise performed with the staff of four European case register centres demonstrated this grouping system to be reliable across centres (Reference Sytema, Giel and Ten HornSytema et al, 1989).
Characteristics of the cohort (n=183): demographics, diagnosis, psychopathology, disability, functioning, service utilisation and satisfaction with service in 1994 (all independent variables used in the trunk regression analysis are listed)
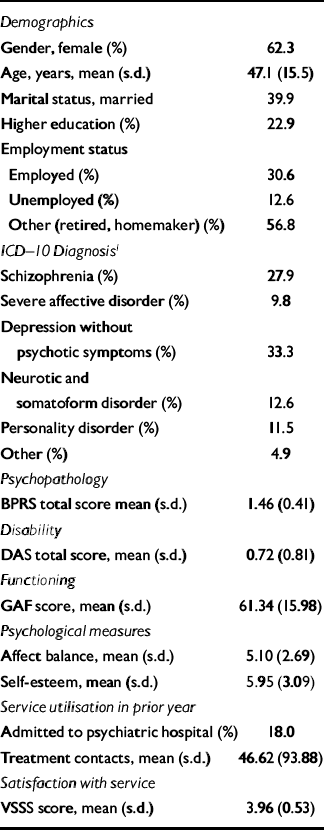
| Demographics | |
| Gender, female (%) | 62.3 |
| Age, years, mean (s.d.) | 47.1 (15.5) |
| Marital status, married | 39.9 |
| Higher education (%) | 22.9 |
| Employment status | |
| Employed (%) | 30.6 |
| Unemployed (%) | 12.6 |
| Other (retired, homemaker) (%) | 56.8 |
| ICD—10 Diagnosis 1 | |
| Schizophrenia (%) | 27.9 |
| Severe affective disorder (%) | 9.8 |
| Depression without psychotic symptoms (%) | 33.3 |
| Neurotic and somatoform disorder (%) | 12.6 |
| Personality disorder (%) | 11.5 |
| Other (%) | 4.9 |
| Psychopathology | |
| BPRS total score mean (s.d.) | 1.46 (0.41) |
| Disability | |
| DAS total score, mean (s.d.) | 0.72 (0.81) |
| Functioning | |
| GAF score, mean (s.d.) | 61.34 (15.98) |
| Psychological measures | |
| Affect balance, mean (s.d.) | 5.10 (2.69) |
| Self-esteem, mean (s.d.) | 5.95 (3.09) |
| Service utilisation in prior year | |
| Admitted to psychiatric hospital (%) | 18.0 |
| Treatment contacts, mean (s.d.) | 46.62 (93.88) |
| Satisfaction with service | |
| VSSS score, mean (s.d.) | 3.96 (0.53) |
Service utilisation data included the number, type and place of out-patient contacts, in-patient admissions and day care contacts. Assessments of psychopathology, disability and functioning were made by the primary clinican, a psychiatrist or psychologist, using the Brief Psychiatric Rating Scale (BPRS) expanded version (Reference Ventura, Green and ShanerVentura et al, 1993), eight items from the Social Roles section of the Disability Assessment Schedule (DAS—II; World Health Organization, 1988) and the Global Assessment of Functioning Scale (GAF; Reference Endicott, Spitzer and FleissEndicott et al, 1976). Patients were asked to complete the Lancashire Quality of Life Profile (LQL; Reference Oliver, Huxley and PriebeOliver et al, 1997) and the Verona Service Satisfaction Scale (VSSS; Reference Ruggeri, Dall'Agnola and AgostiniRuggeri et al, 1994). All scales were the official Italian versions. Primary clinicians were trained in the use of the observer-rated scales and achieved interrater reliability of at least 0.70. In the case of self-administered scales, test-retest was performed in a subsample of subjects and this showed good levels of stability. A research worker assisted the patient in completing questionnaires when necessary.
The LQL, developed from Lehman's QOL scale (Reference Oliver, Huxley and PriebeOliver et al, 1997), is a researcher-led questionnaire enquiring about objective life circumstances and subjective life satisfaction in nine domain — work/education, leisure, religion, finances, living situation, legal/safety, family relations, social relations and health — and it includes subjective ratings of overall well-being. The subjective satisfaction ratings are recorded on sevenpoint ‘delighted—terrible’ Likert scales (see Table 2). The measure includes affect balance and self-esteem scales. Construct, content and criterion validity, reliability and internal consistency of the LQL have been demonstrated to be satisfactory (Oliver et al, Reference Oliver, Huxley and Bridges1996, Reference Oliver, Huxley and Priebe1997). To reduce the number of variables in the factor analysis, some objective items in the domains of leisure, social relations and health were combined in three single scales. Where there was more than one satisfaction item in a domain, a mean of all such scores in the domain was completed.
Characteristics of the cohort (n=183): subjective and objective components from each domain of the Lancashire Quality of Life Profile in 1994 (all variables used in the factor analysis are listed)
| Overall well-being | |
| Mean (s.d.) | 4.21 (1.43) |
| Work/study | |
| Satisfaction, mean (s.d.) | 3.99 (1.67) |
| Time/week, hours, mean (s.d.) | 11.7 (16.7) |
| Earnings/months, thousand lire, mean (s.d.) | 486 (753) |
| Leisure | |
| Satisfaction, mean (s.d.) | 4.37 (1.17) |
| No. leisure items checked for past 2 weeks (max.=4), mean (s.d.) | 2.81 (0.83) |
| Religion | |
| Satisfaction, mean (s.d.) | 4.78 (1.35) |
| No. times attended religious activity in past month, mean (s.d.) | 3.48 (4.25) |
| Financial situation | |
| Satisfaction, mean (s.d.) | 3.81 (1.56) |
| Family income/month, thousand lire, mean (s.d.) | 1197 (783) |
| Living situation | |
| Satisfaction, mean (s.d.) | 4.57 (1.15) |
| Time living in current accommodation, years, mean (s.d.) | 17.8 (14.7) |
| No. other people in household, mean (s.d.) | 2.26 (1.35) |
| Proportion in unsheltered accommodation (%) | 89.6 |
| Safety/legal situation | |
| Satisfaction, mean (s.d.) | 4.73 (1.32) |
| % Accused of a crime in past year | 3.9 |
| % Victims of violence in past year | 10.1 |
| Family relations | |
| Satisfaction, mean (s.d.) | 4.67 (1.39) |
| % With daily family contact | 78.4 |
| % Living with family | 73.2 |
| Social relations | |
| Satisfaction, mean (s.d.) | 4.52 (1.49) |
| % Who met friend in past week | 59.7 |
| No. close personal relations items checked (max.=3), mean (s.d.) | 1.53 (1.14) |
| Health | |
| Satisfaction, mean (s.d.) | 4.59 (1.19) |
| No. physical illness items checked (max.=2), mean (s.d.) | 0.87 (0.69) |
| % With physical disability | 18.0 |
| No. physical illness items checked (max.=2), mean (s.d.) | 0.87 (0.69) |
| No. mental illness items checked (max.=3), mean (s.d.) | 2.02 (0.71) |
Statistical analysis
An exploratory factor analysis (Reference CattellCattell, 1978) was conducted on the LQL scores for 285 patients in the 1994 (Time 1) cohort. The full sample was used in order to maximise the possibility of detecting latent QOL constructs while maintaining an adequate balance of test items to subjects. Twenty-seven items (or subscales) from the LQL (17 objective and 10 subjective) were factor analysed using principal component analysis. To determine how many factors to select, we used the scree test in conjunction with the criterion of interpretability of the factor solution. Three factors were found and rotated using the Varimax method to obtain a clearer pattern of factor loadings (see Table 3). An identical factor analysis was conducted on Time 1 and Time 2 data for the 183 subjects with complete evaluations.
Changes over 2 years in subjective and objective domains of the Lancashire Quality of Life Profile (LQL) (n=183)
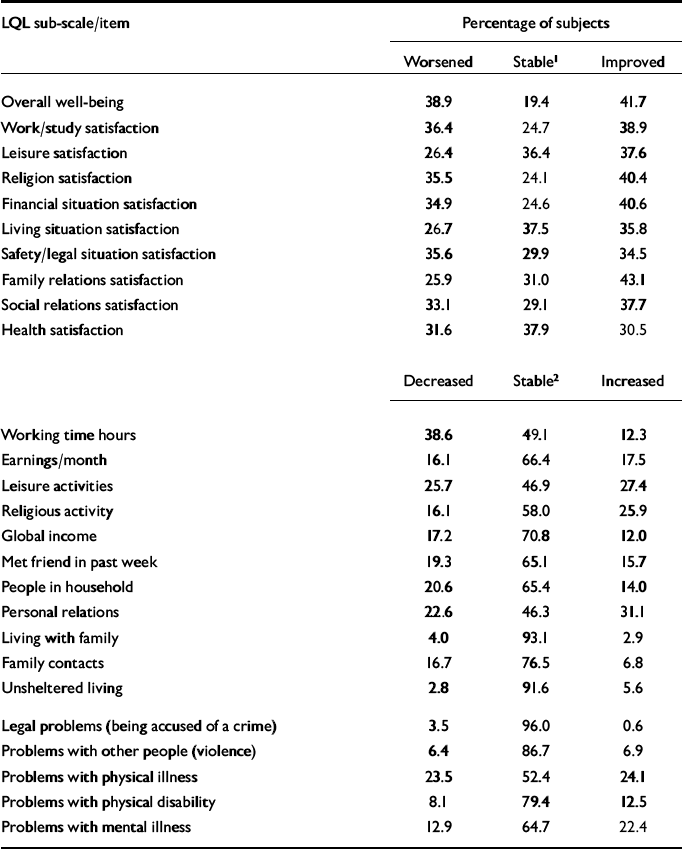
| LQL sub-scale/item | Percentage of subjects | ||
|---|---|---|---|
| Worsened | Stable1 | Improved | |
| Overall well-being | 38.9 | 19.4 | 41.7 |
| Work/study satisfaction | 36.4 | 24.7 | 38.9 |
| Leisure satisfaction | 26.4 | 36.4 | 37.6 |
| Religion satisfaction | 35.5 | 24.1 | 40.4 |
| Financial situation satisfaction | 34.9 | 24.6 | 40.6 |
| Living situation satisfaction | 26.7 | 37.5 | 35.8 |
| Safety/legal situation satisfaction | 35.6 | 29.9 | 34.5 |
| Family relations satisfaction | 25.9 | 31.0 | 43.1 |
| Social relations satisfaction | 33.1 | 29.1 | 37.7 |
| Health satisfaction | 31.6 | 37.9 | 30.5 |
| Decreased | Stable2 | Increased | |
| Working time hours | 38.6 | 49.1 | 12.3 |
| Earnings/month | 16.1 | 66.4 | 17.5 |
| Leisure activities | 25.7 | 46.9 | 27.4 |
| Religious activity | 16.1 | 58.0 | 25.9 |
| Global income | 17.2 | 70.8 | 12.0 |
| Met friend in past week | 19.3 | 65.1 | 15.7 |
| People in household | 20.6 | 65.4 | 14.0 |
| Personal relations | 22.6 | 46.3 | 31.1 |
| Living with family | 4.0 | 93.1 | 2.9 |
| Family contacts | 16.7 | 76.5 | 6.8 |
| Unsheltered living | 2.8 | 91.6 | 5.6 |
| Legal problems (being accused of a crime) | 3.5 | 96.0 | 0.6 |
| Problems with other people (violence) | 6.4 | 86.7 | 6.9 |
| Problems with physical illness | 23.5 | 52.4 | 24.1 |
| Problems with physical disability | 8.1 | 79.4 | 12.5 |
| Problems with mental illness | 12.9 | 64.7 | 22.4 |
A multivariate regression analysis of the QOL factor scores from Time 1 was performed and revealed no correlation between the residuals of the three factors, indicating that separate regression of each factor on potential determinants was appropriate.
Three successive block-stratified multiple regression models were constructed with one QOL factor score from Time 1 as dependent variable and a series of Time 1 variables (see Table 1) as independent variables. In the block-stratified procedure, putative determinants, organised into blocks denoting logically homogeneous sets of increasing complexity, were analysed in sequence; a similar method has been used in other studies (UK700 Group, 1999). In each block variables were selected using a stepwise procedure, retaining those variables that were significant in the previous blocks. First, the determinants summarising each block were included as ‘trunk’ variables (e.g. BPRS as a total mean score). Subsequently, each trunk in turn, taking into account the trunk determinants of the previous blocks, was exploded into its ‘branches’ to assess the contribution of each branch: diagnostic groups were assessed separately, BPRS, DAS and VSSS were split into their subscales (BPRS: Anxiety/Depression, Positive symptoms, Negative symptoms, Mania, Cognitive symptoms; DAS: Participation in household, Relationship with partner, Parental role, Friction with social contacts, Occupational role — performances/interest, Interest and information, Behavior in emergencies; VSSS: Professional skills and behavior, Information, Access, Efficacy, Type of intervention, Relatives' involvement) and aspects related to the type (community support, clinical assessment or psychotherapy) and the place (out-patient or casualty department, patient's home, community) of contacts were assessed. This procedure allowed the exploration of the role of the branch variables as determinants, while preserving a satisfactory ratio between the number of cases and variables included in the analysis.
To explore longitudinal effects, a block-straitified multiple regression model, similar to that used for the cross-sectional analyses, was constructed with one QOL factor score from Time 2 as the dependent variable and adding the factor scores from Time 1 to the set of independent variables used in the previous analyses. This model permitted the extraction of the effect of the QOL factor at Time 1 so that its residual could be analysed to explore what variables are associated with the change in QOL, given the baseline levels.
RESULTS
Characteristics of the cohort
Characteristics of the cohort are presented in Table 1. As shown in the table, patients both with and without psychotic symptoms have been included in the study; as expected, a difference between these two groups was found with regard to severity of psychopathology (15.7% of patients had a BPRS mean score ≥ 2 in the group of patients with psychosis v. 5.3% in the group of patients without psychosis; BPRS total mean scores differed significantly, P=0.029, Mann-Whitney U-test), disability (14.3% of patients had a DAS mean score ≥2 in the group of patients with psychosis v. 2.7% in the group of patients without psychosis; DAS total mean scores differed significantly, P <0.001, Mann-Whitney U-test) and dysfunction (27.1% of patients had a GAF score ≤40 in the group of patients with psychosis v. 6.2% in the group of patients without psychosis; GAF mean scores differed significantly, P=0.001, Mann-Whitney U-test). The QOL responses of the cohort are reported in Table 2.
Changes over 2 years in subjective and objective domains of the LQL are reported in Table 3. Overall, an improvement in LQL total mean score of subjective items was found in 26.4% of patients, and a worsening in 19.8%. Over 2 years, an improvement in BPRS total mean score was found in 11.5% of patients, and a worsening in 13.2% (change exceeding ±1/10 of the five-point Likert scale); an improvement in DAS total mean score was found in 26.4% of patients, and a worsening in 16.5% (change exceeding ±1/10 of the ten-point interval scale); an improvement in GAF total score was found in 25.3% of patients, and a worsening in 46.2% (change exceeding ±1/10 of the five-point Likert scale); an improvement in VSSS overall satisfaction score was found in 19.2% of patients, and a worsening in 24.9% (change exceeding ±1/10 of the five-point Likert scale).
Factor analysis
In the factor analysis of the Time 1 sample (n=285), the scree plot confirmed the initial hypothesis that the LQL was multidimensional and revealed three factors with relatively high eigenvalues; with Varimax rotation, three interpretable QOL factors were obtained (see Table 4: subjective satisfaction; objective work/income; and objective living situation/safety. The subjective factor accounted for 17% of the item variance, the objective work/income factor for 9% and the objective living-situation factor for 7%. No items loaded on more than one factor, 22 of the 27 items loaded onto one or another of the three factors. A factor analysis of the Time 1 data for the cohort followed up at Time 2 (n=183) established that the same latent constructs were present in the smaller cohort. Factor analysis of the Time 2 data identified the same three factors, with minor changes.
Factor loading matrix for 27 quality of life items loading on three factors: cohort in 1994 (n=285)
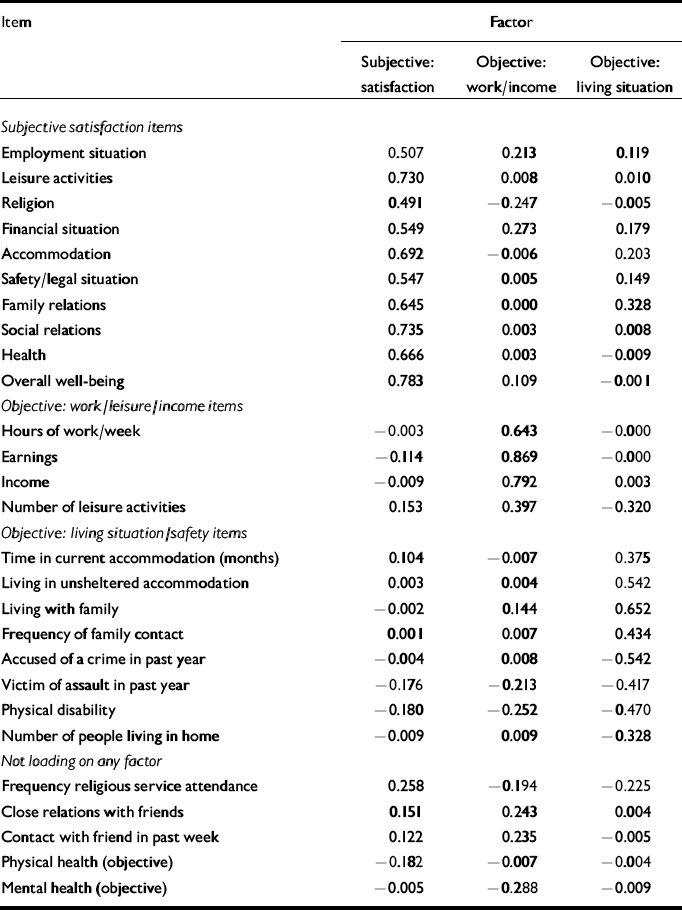
| Item | Factor | ||
|---|---|---|---|
| Subjective: satisfaction | Objective: work/income | Objective: living situation | |
| Subjective satisfaction items | |||
| Employment situation | 0.507 | 0.213 | 0.119 |
| Leisure activities | 0.730 | 0.008 | 0.010 |
| Religion | 0.491 | -0.247 | -0.005 |
| Financial situation | 0.549 | 0.273 | 0.179 |
| Accommodation | 0.692 | -0.006 | 0.203 |
| Safety/legal situation | 0.547 | 0.005 | 0.149 |
| Family relations | 0.645 | 0.000 | 0.328 |
| Social relations | 0.735 | 0.003 | 0.008 |
| Health | 0.666 | 0.003 | -0.009 |
| Overall well-being | 0.783 | 0.109 | -0.001 |
| Objective: work/leisure/income items | |||
| Hours of work/week | -0.003 | 0.643 | -0.000 |
| Earnings | -0.114 | 0.869 | -0.000 |
| Income | -0.009 | 0.792 | 0.003 |
| Number of leisure activities | 0.153 | 0.397 | -0.320 |
| Objective: living situation/safety items | |||
| Time in current accommodation (months) | 0.104 | -0.007 | 0.375 |
| Living in unsheltered accommodation | 0.003 | 0.004 | 0.542 |
| Living with family | -0.002 | 0.144 | 0.652 |
| Frequency of family contact | 0.001 | 0.007 | 0.434 |
| Accused of a crime in past year | -0.004 | 0.008 | -0.542 |
| Victim of assault in past year | -0.176 | -0.213 | -0.417 |
| Physical disability | -0.180 | -0.252 | -0.470 |
| Number of people living in home | -0.009 | 0.009 | -0.328 |
| Not loading on any factor | |||
| Frequency religious service attendance | 0.258 | -0.194 | -0.225 |
| Close relations with friends | 0.151 | 0.243 | 0.004 |
| Contact with friend in past week | 0.122 | 0.235 | -0.005 |
| Physical health (objective) | -0.182 | -0.007 | -0.004 |
| Mental health (objective) | -0.005 | -0.288 | -0.009 |
Cross-sectional analysis
Subjective satisfaction factor
As shown in Table 5, in the regression analysis with trunk variables, older age (3% delta variance), higher satisfaction with services (22%), positive affect (25%) and greater self-esteem (6%) were associated with a higher subjective QOL satisfaction score, accounting for 55% of the variance. When branch variables were entered into the equation, anxiety/depression (BPRS) was found to be negatively associated (7%), mania positively associated (4%), and satisfaction with service efficacy (23%) and access (2%) positively correlated.
Cross-sectional and longitudinal predictors for each factor of Lancashire Quality of Life Profile: estimated β coefficients, their significance and delta variance (%) for the final model (Blocks 1+2+3+4+5+6+7)
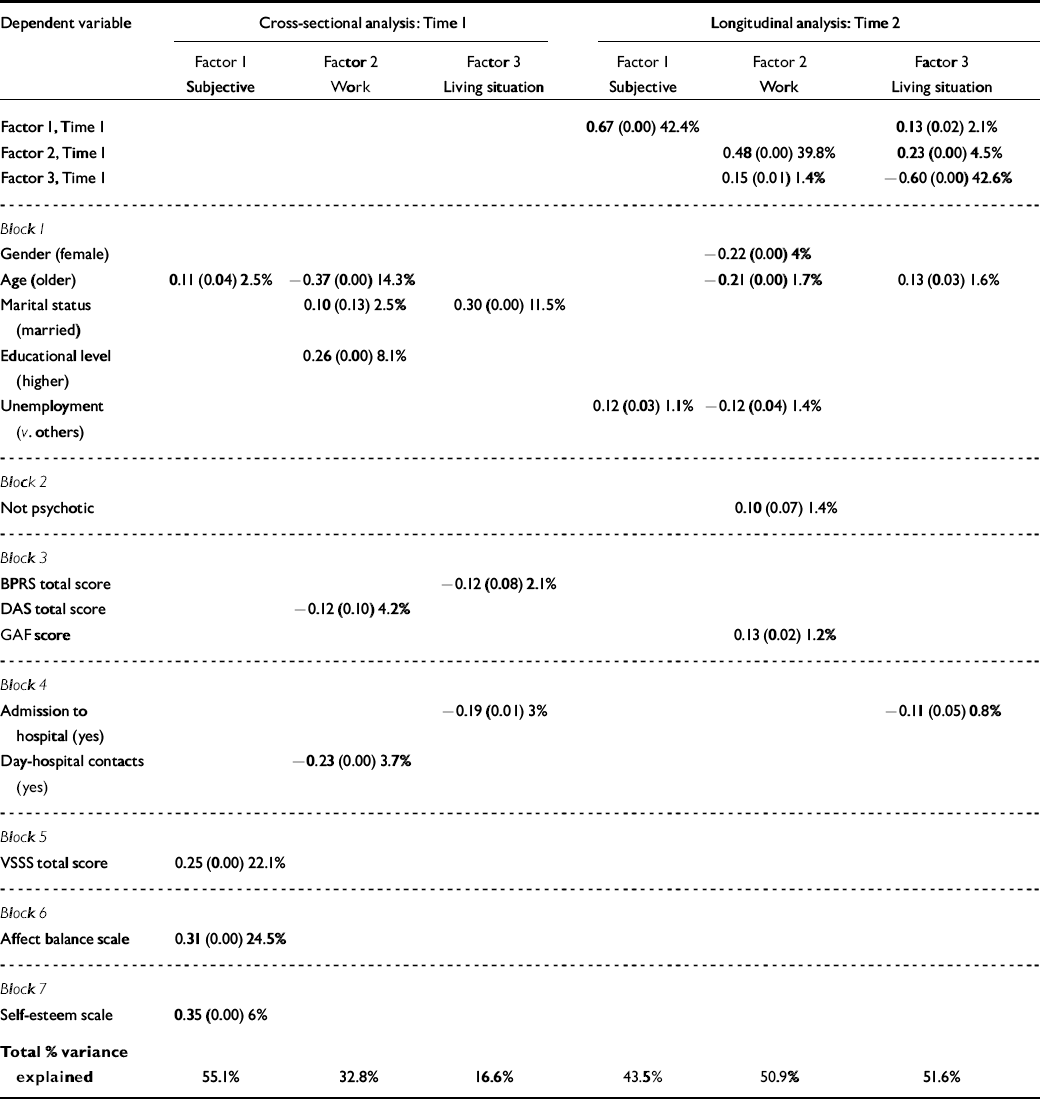
| Dependent variable | Cross-sectional analysis: Time 1 | Longitudinal analysis: Time 2 | ||||
|---|---|---|---|---|---|---|
| Factor 1 | Factor 2 | Factor 3 | Factor 1 | Factor 2 | Factor 3 | |
| Subjective | Work | Living situation | Subjective | Work | Living situation | |
| Factor 1, Time 1 | 0.67 (0.00) 42.4% | 0.13 (0.02) 2.1% | ||||
| Factor 2, Time 1 | 0.48 (0.00) 39.8% | 0.23 (0.00) 4.5% | ||||
| Factor 3, Time 1 | 0.15 (0.01) 1.4% | -0.60 (0.00) 42.6% | ||||
| Block 1 | ||||||
| Gender (female) | -0.22 (0.00) 4% | |||||
| Age (older) | 0.11 (0.04) 2.5% | -0.37 (0.00) 14.3% | -0.21 (0.00) 1.7% | 0.13 (0.03) 1.6% | ||
| Marital status (married) | 0.10 (0.13) 2.5% | 0.30 (0.00) 11.5% | ||||
| Educational level (higher) | 0.26 (0.00) 8.1% | |||||
| Unemployment (v. others) | 0.12 (0.03) 1.1% | -0.12 (0.04) 1.4% | ||||
| Block 2 | ||||||
| Not psychotic | 0.10 (0.07) 1.4% | |||||
| Block 3 | ||||||
| BPRS total score | -0.12 (0.08) 2.1% | |||||
| DAS total score | -0.12 (0.10) 4.2% | |||||
| GAF score | 0.13 (0.02) 1.2% | |||||
| Block 4 | ||||||
| Admission to hospital (yes) | -0.19 (0.01) 3% | -0.11 (0.05) 0.8% | ||||
| Day-hospital contacts (yes) | -0.23 (0.00) 3.7% | |||||
| Block 5 | ||||||
| VSSS total score | 0.25 (0.00) 22.1% | |||||
| Block 6 | ||||||
| Affect balance scale | 0.31 (0.00) 24.5% | |||||
| Block 7 | ||||||
| Self-esteem scale | 0.35 (0.00) 6% | |||||
| Total % variance explained | 55.1% | 32.8% | 16.6% | 43.5% | 50.9% | 51.6% |
Objective work/income/leisure factor
Trunk variables retained after stepwise regression were younger age (14% delta variance), higher education (8%), being married (3%), lower disability (7%) and not attending day care (4%), accounting for 33% of the variance. When branch variables were entered into the equation, not having a diagnosis of personality disorder (2%), low negative symptoms (8%), higher level of interest/information (DAS) (6%), and receiving fewer home visits (4%) were found to be correlated with greater QOL in the work/income factor.
Objective living-situation/safety factor
In the analysis with trunk variables, a more stable, safe and unsheltered living situation was associated with being married (12% delta variance), lower total symptomatology (2%) and not being admitted to hospital (3%), explaining 17% of the variance. When branch variables were introduced into the equation, lower positive symptoms (3%) and lower satisfaction with service efficacy (2%) were correlated with greater QOL in living situation.
Longitudinal analysis
Subjective satisfaction factor
As shown in Table 5, in the regression with trunk variables, the subjective satisfaction factor at Time 1 accounted for 42% of the variance in the same factor at Time 2. Un-employment at Time 1 accounted for an additional 1% of the variance. No branch variable was retained in any of the analyses.
Objective work/income/leisure factor
The score for the work/income factor at Time 1, in the trunk regression analysis, accounted for 40% of the variance in the factor at Time 2. The amount of variance contributed by other variables retained in the model was as follows: living situation factor, 1%; male gender, 4%; lower age, 2%; being employed, 2%; being without psychosis, 2%; and higher functioning, 1%. Branch variables contributing to the variance in subsequent analyses were: not having schizophrenia (3%) or a personality disorder (1%), low cognitive symptoms (1%) and higher work performance or interest in work (DAS) (1%).
Living-situation/safety factor
In the trunk regression analysis, the score for the living-situation/safety factor at Time 1 accounted for 43% of the variance in this factor at Time 2. The amount of variance contributed by other variables retained in the model was as follows: objective work/income factor, 5%; subjective satisfaction factor, 2%; older age, 2%; no hospital admissions, 1%. Branch variables contributing to the variance in subsequent analyses were low cognitive symptoms (2%) and low satisfaction with access (2%).
DISCUSSION
To our knowledge this is the first longitudinal study of QOL in a broadly selected cohort of psychiatric patients and the first using factor analysis. The approach provides an opportunity to focus on the role of subjective and objective dimensions of QOL. Limitations of the study include loss of one-third of the cohort between baseline and follow-up, variation in follow-up interval, the exploratory nature of the analyses and the large number of analyses performed on the same data set.
Latent constructs of quality of life
We identified three latent constructs of QOL in the LQL: subjective satisfaction, objective work/income/leisure and objective living situation/safety. There is face validity to the construction of these factors and to their patterns of prediction by other variables. For example, every satisfaction and well-being item was included in the subjective factor, and its predictors were other subjective measures, such as service satisfaction and affect balance. However, previous work (Reference Kaiser, Priebe and BarrKaiser et al, 1997) has shown that the factorial structure of subjective QOL might differ between schizophrenia out- and in-patients, and, in the group of in-patients, might depend on the length of the hospitalisation; thus, our results should be taken with caution when applied to psychiatric patients who are not living in the community.
Further research is needed in order to understand better why a remarkable amount of variance (67%) remains unaccounted for; however, the robustness of the factor solution is supported by the identification of the same factor for the cohort at two points in time. Previous research, moreover, has shown that subjective QOL is distinct from objective QOL (Reference Skantze, Wanke and BlessSkantze et al, 1994; Reference Atkinson, Zibin and ChuangAtkinson et al, 1997; Reference Warner, de Girolamo and BelelliWarner et al, 1998). In our study, in the work/income factor, employment was grouped with such anticipated consequences as increased earnings and total income, and it is credible that working and increased income can lead to a greater focus on, and capacity for, leisure activities. Family living for people with mental illness has been shown to be associated with objective QOL benefits (Reference Warner, de Girolamo and BelelliWarner et al, 1998). In this study, we found it to be linked, in the living-situation factor, to increased stability of housing, increased family contact and greater personal safety. The predictors of both objective QOL factors were such dimensions as demographics, disability and pathology, operating in the expected direction.
Predictive power of the regression models
There was more predictive power in the cross-sectional regression model for the subjective factor than for either objective factor. Three measures explained more than half of the variance in the subjective factor, whereas only 33% of the variance in the work/income factor and 16% in the living-situation factor were explained. This may be because the objective factors were influenced by social and economic variables, such as the availability of work or housing, which are not in our model (Reference WarnerWarner, 1994). On the other hand, in the longitudinal model, after the baseline effect of the factor was taken into account, the models explained more variance in the objective factors than the subjective factor. Only a further 1% of the variance in the subjective factor was explained, in contrast to 11% and 9%, respectively, in the work/income and living-situation factors. Changes in psychopathology, disability, functioning and satisfaction with services over 2 years have taken place in many subjects. As shown in Table 3, improvement or worsening over 2 years in both subjective and objective QOL have been found in high percentages of subjects, with a trend for higher stability in objective than in subjective QOL. It appears that the usual mental health predictors do not explain much of the change in QOL over time. Either there are no consistent predictors or those that exist are not in our model.
Predictors of subjective quality of life
The fact that subjective and objective components of QOL cluster separately on factor analysis suggests that they measure different underlying constructs. The distinct nature of subjective QOL is highlighted by the fact that most of the predictors of the subjective factor in this study were subjective variables such as service satisfaction, affect balance and self-esteem. In agreement with previous studies (Reference LehmanLehman, 1996; Reference Oliver, Huxley and BridgesOliver et al, 1996; Reference Kaiser, Priebe and BarrKaiser et al, 1997; Reference Ruggeri, Santolini and StegaganoRuggeri et al, 1999) we found subjective QOL to be weekly influenced by the usual observer-rated predictors used in mental health assessment, either cross-sectionally or longitudinally. A few measures of psychopathology were predictors in the cross-sectional analysis, and employment contributed a small proportion (1%) of the variance to the longitudinal model, but the baseline objective factors were not longitudinal predictors of subjective QOL.
It is reasonable to expect, as we found in this study, that affect state and other subjective elements will influence subjective assessment of QOL. Patients with depression, for example, rate their well-being, functioning and living conditions worse than an independent observer and worse than they do themselves when recovered (Reference Morgado, Smith and LecrubierMorgado et al, 1991). In our longitudinal model, however, the influence of affect state and other subjective variables was much reduced. Although affect balance and self-esteem were important determinants of subjective QOL cross-sectionally, they had no further effect on subjective or objective factors longitudinally.
Service satisfaction, which was associated with QOL cross-sectionally, did not predict change in subjective or objective QOL over time. Its most important association, as in previous studies by this group (Ruggeri et al, Reference Ruggeri, Biggeri and Rucci1998, Reference Ruggeri, Santolini and Stegagano1999) was with current satisfaction with life, indicating that both constructs may measure a common attitude towards satisfaction.
Predictors of objective quality of life
Few subjective variables were predictors of the objective factors, either cross-sectionally or longitudinally. We did find that the subjective satisfaction factor at Time 1 was associated with the living-situation factor in the longitudinal model, but observer-rated and demographic variables explained most of the variance in this factor and all of the variance in the other objective factor in both the longitudinal and cross-sectional models.
As noted, most of the determinants of the objective QOL factors, both cross-sectionally and longitudinally, were demographic factors, functioning level and other variables such as diagnosis, psychopathology and admissions to psychiatric hospitals that might be considered proxy measures of severity of illness. Because severity of illness and functional capacity are common targets of mental health services, objective QOL measures may prove to be more responsive than current subjective measures in the assessment of the effect of these interventions. We may find, for example, that variables in the work/income factor (e.g. hours of work, earnings and number of leisure activities) and in the living-situation factor (e.g. freedom from victimisation and tenure of accommodation) will be valuable in the assessment of rehabilitation outcome.
Implications of this study
Given the distinct nature of subjective QOL and its lack of association with standard mental health predictors and outcomes, what is to be its role in outcome assessment? Some QOL researchers consider the individual's perception of his/her circumstances to be the central component of QOL. Their approach has the merit of empowering the consumer and giving him/her a central role in the development of treatment services. Others, frustrated by the lack of correspondence between subjective and objective information, would abandon subjective evaluation (Reference Atkinson, Zibin and ChuangAtkinson et al, 1997). Warner (Reference Warner1999) has addressed this issue using an analogy with an equivalent area in anthropology, the issue of ‘emics’ and ‘etics’, which deals with similar complexities of informants' perceptions of reality v. the views of outside observers. He argues that subjective and objective appraisals are different kinds of data and that both have a role in QOL assessment. We suggest that the subjective dimension is essential in painting a complete picture of the person's life, in explaining patterns of behaviour and in providing the subject's interpretation of the personal impact of objective circumstances. It is clear that various factors make it difficult to build predictive models around subjective outcomes: these include the tendency towards psychological adaptation or ‘response shift’ that can occur over time in the subjective appraisal of a person's current state (and this might explain why in our study the strong association of service's satisfaction with QOL did not hold up for change at Time 2), the multifactorial determinance of subjective outcomes and the diverse reaction of different individuals to the same circumstances.
The predictors used in our study (largely demographic and observer-rated variables) are associated with change in objective circumstances rather than in subjective QOL. A possible explanation for this is that objective measures may prove to be more suitable in detecting the effects of treatment interventions because many interventions are not targeted at improving the subjective QOL of patients. Although the severity of symptoms and functional capacity remains the principal target of mental health services (rather than the patient's subjective QOL), objective information may be more suitable for building predictive models and in the longitudinal assessment of chronic illness.
Clinical Implications and Limitations
CLINICAL IMPLICATIONS
-
▪ Subjective and objective appraisals of quality of life (QOL) are different kinds of data but both have a role in assessment.
-
▪ Cross-sectionally, higher subjective QOL is associated with other subjective measures, such as positive affect, greater self-esteem and higher satisfaction with services, and is uninfluenced by any of the usual observer-rated predictors; the former measures do not have an additional effect in predicting changes in QOL over 2 years.
-
▪ Objective QOL is predicted by demographic and observer-rated variables both cross-sectionally and at follow-up, but little variance is explained by the models.
LIMITATIONS
-
▪ Loss of one-third of the cohort between baseline and follow-up.
-
▪ Exploratory nature of the analyses.
-
▪ Large number of analyses performed on the same data-set.
ACKNOWLEDGEMENTS
The authors are grateful to Doriana Cristofalo for assistance in data management. We are also grateful to the colleagues and the patients who participated in the South Verona Outcome Project, and we specifically thank Rosa Dall'Agnola, Paola Bonizzata, Marco Stegagno, Giuseppe Imperadore, Nazario Santolini, Stylianos Nicolaou and Manuela Benetollo for their contribution in the data collection. We are indebted to Professor Michele Tansella for his generous and continuous support and valuable advice and for helping to revise the manuscript.


eLetters
No eLetters have been published for this article.