Introduction
Both the National Aeronautics and Space Administration (NASA) and the European Space Agency (ESA) have recognised Raman spectroscopy (RS) as a potentially important analytical tool for planetary exploration (Jorge Villar & Edwards, Reference Jorge Villar and Edwards2006). A Raman spectrometer is scheduled to be included in the instrument package of the Rover on the ExoMars 2018 mission. In this paper, following a brief overview of Raman techniques and the latest developments, we will demonstrate how RS is being used by scientists in the Netherlands to identify traces of organic biomarkers in a mineral background and we will discuss the ability of RS to potentially detect past or present life.
Raman spectroscopy is used to detect and identify chemical species based on their molecular vibrations. It can provide structural molecular information from both organic and inorganic samples, which makes it an ideal technique for both analysis of minerals and the detection of biomarkers for life on Earth and other planetary bodies in our solar system. The first Raman spectrometer to enter space is scheduled for launch in 2018 as part of ESA's ExoMars mission. The planetary Mars rover will be equipped with a Raman spectrometer with a green 532 nm laser as the excitation wavelength (Edwards et al., Reference Edwards, Hutchinson and Ingley2012; Lopez-Reyes et al., Reference Lopez-Reyes, Rull, Venegas, Westall, Foucher, Bost, Sanz, Catalá-Espí, Vegas, Hermosilla, Sansano and Medina2013).
Applied on a planetary rover, RS is a suitable technique for making the first selection of possible environments of scientific interests in terms of understanding both past and present geological processes. RS is a fast, non-invasive and generally non-destructive method. Moreover, the instrumentation has low power consumption, low instrumental weight and requires no sample preparation. These features can be combined with the potential for stand-off capability (Angel et al., Reference Angel, Gomer, Sharma and McKay2012) allowing selection of targets at distances of several metres (Skulinova et al., Reference Skulinova, Lefebvre, Sobron, Eshelman, Daly, Gravel, Cormier, Châteauneuf, Slater, Zheng, Koujelev and Léveillé2014) and even up to 120 m (Sharma et al., Reference Sharma, Misra and Sharma2005). RS has in general a non-destructive character but a combination of a certain wavelength and high laser power may destroy specific compounds. Hence, particularly in the case of organic molecules, a compromise is required between laser power, measurement time and Raman signal intensity to avoid sample degradation. Raman spectrometers of the ExoMars type have been tested extensively and are expected to be suitable for the identification of bulk minerals in rocks and powdered samples (Lopez-Reyes et al., Reference Lopez-Reyes, Rull, Venegas, Westall, Foucher, Bost, Sanz, Catalá-Espí, Vegas, Hermosilla, Sansano and Medina2013). The detection of biomarkers of (past) life, however, will likely be much more challenging due to expected low levels of abundance. For instance, Vítek et al. (Reference Vítek, Jehlička, Edwards and Osterrothová2009a) have shown that concentrations of β-carotene can be detected down to 1 ppm through 2 mm transparent crystals of evaporative minerals. Winters et al. (Reference Winters, Lowenstein and Timofeeff2013) detected carotenoids from algae in ancient salt deposits throughout California, and Jorge Villar et al. (Reference Jorge Villar, Edwards and Cockell2005) have successfully used RS to identify colonies of cyanobacteria on samples from the Antarctic cold desert. This paper expands on this growing research field to examine Raman capabilities through thick translucent and transparent samples both for mineral samples containing β-carotene and for microorganisms, and examines the capabilities of time-resolved Raman spectroscopy (TRRS) and resonance Raman spectroscopy (RRS) for identifying organic compounds in inorganic matrices.
Astrobiological context
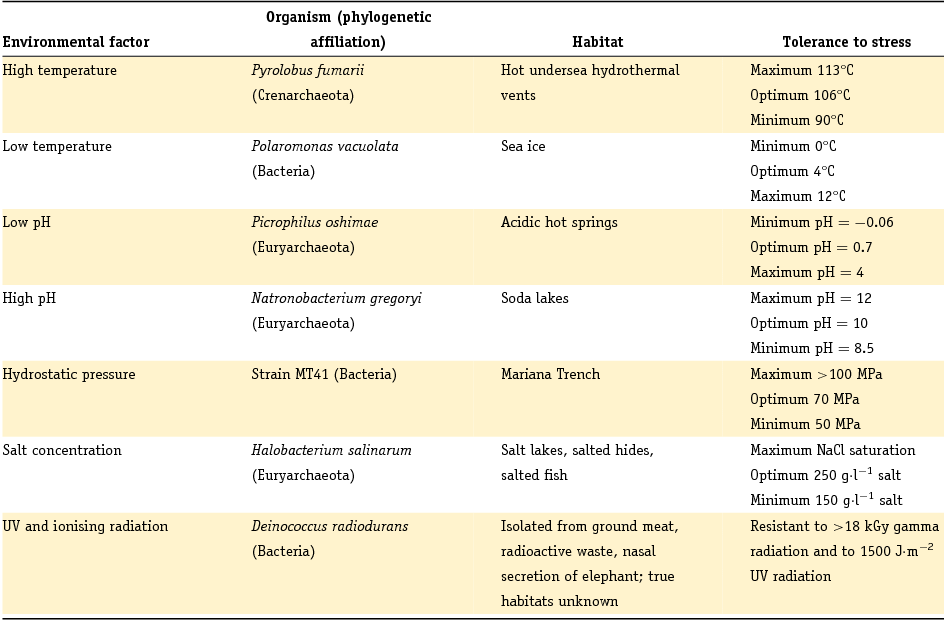
A key aspect of astrobiology research is the focus on extremophiles. These are mainly prokaryotes that survive, live in or even need extreme environments such as very high or low temperatures or pH, saturated levels of sodium chloride (NaCl) or extreme aridity (Rainey & Oren, Reference Rainey and Oren2006). To place this statement in context, Table 1 provides an overview of different terrestrial extremophiles and their habitats.
Extremophiles and their environmental limits (adapted from Rainey & Oren, Reference Rainey and Oren2006).

Potentially, a huge number of biological molecules can be used as a target for in situ detection of life in our solar system. Mars is one of the candidates in the search for life because of the indication of a warmer and wetter environment earlier in its geological history (Fendrihan et al., Reference Fendrihan, Musso and Stan-Lotter2009). The harsh radiation environment on Mars will lead to rapid degradation of organic molecules at its surface, therefore subsurface sampling deeper than 30 cm will be necessary and is planned for ESA's ExoMars mission (Edwards et al., Reference Edwards, Hutchinson and Ingley2012). An overview of the major potential biomarkers is given in Jorge Villar & Edwards (Reference Jorge Villar and Edwards2006).
Carotenoids are among the key components of living organisms. They represent a family of over 700 different compounds that are composed of an alternating double- and single-bond carbon–carbon chain, known as a conjugated system, with different side groups. In general, carotenoids show a reddish colour but because the molecules are sensitive to their electronic environment, they can also appear grey, blue, dark-red or orange (Britton, Reference Britton1995).
In nature, plants and microorganisms are capable of producing carotenoids from isoprenoid building blocks. Mammals, birds, insects, amphibians and reptiles make use of ingested carotenoids for decoration (e.g. feathers), as antioxidants and in their macula (eye). Carotenoids are potent biomarkers from an astrobiological point of view. Of the organisms in Table 1, Deinococcus radiodurans, for example, uses carotenoids as a biological sunscreen to prevent intracellular damage by UV radiation. Many microorganisms living in salt lakes or soda lakes also contain carotenoids, for example bacteriorhodopsin, salinixanthin and bacterioruberin (Jehlička & Oren, Reference Jehlička and Oren2013).
Theory of Raman spectroscopy
The Raman effect is inelastic scattering of light by matter and was first observed by Raman & Krishnan (Reference Raman and Krishnan1928). Normally, when light (a photon) scatters off a material (molecule or mineral lattice), no exchange of energy between photon and material occurs: this is known as elastic or Rayleigh scattering. RS uses the property that in roughly one out of every 107 collisions the photon transfers some of its energy to the molecule, the amount depending on the molecular vibrations of the sample. This is known as inelastic scattering or Stokes Raman scattering. By repeatedly measuring the resulting light, which has lower photon energies and thus longer wavelengths than the original laser excitation source, a spectrum is obtained. This spectrum can be used for identification of the molecular bonds that characterise the compound. A Jablonski diagram (Fig. 1A) illustrates the different energy levels and transitions during the interaction of light with a molecule. In the Raman scattering process, part of the photon energy is transferred to one of the vibrational modes of the molecule. The Raman spectrum (Fig. 1B) shows the corresponding vibrations of the molecule, represented by v1, v2, . . ., vn. Most molecules have many Raman-active molecular vibrations, and this combination of vibrations is unique for every material. Hence, RS is an ideal technique for the identification of most types of molecules and lattices.
A. Jablonski diagram portraying typical vibrational and electronic energy levels of a molecule and the interaction with light during the Rayleigh and Raman scattering processes. Upward arrows depict excitation by a (laser) light source; downward arrows depict the resulting emitted photons that can be detected. The length of the arrow is proportional to the photon energy. Also shown is the competing process of fluorescence. The wiggly line is non-radiative relaxation to the S1-state after photon absorption. B. Example of a Raman spectrum of calcite. The vibrations are indicated with vn and ER is the energy difference between the excitation source at 0 cm−1 (i.e. no Raman shift) and the emitted photons, and corresponds to the energy of a molecular vibration.
In resonance Raman spectroscopy (RRS), a photon energy that overlaps one of the molecule's electronic transitions is used, represented by S1 in Fig 1A. Hence, the laser wavelength should be close to one of the UV/VIS absorption bands of the target compound. For strongly absorbing (coloured) compounds this results in an enhancement of the Raman signal of the chromophoric part of the molecule by three to four orders of magnitude (Smith & Dent, Reference Smith and Dent2005). At the same time, however, the photon can also be absorbed instead of scattered, resulting in unwanted side effects such as sample heating, photo degradation or fluorescence (Puppels et al., Reference Puppels, Olminkhof, Segers-Nolten, Otto, De Mul and Greve1991; Hooijschuur et al., Reference Hooijschuur, Verkaaik, Davies and Ariese2015). These effects are a major concern when tightly focusing the laser to a small spot at the surface, and are strongly reduced when the light is broadly distributed inside a multiple scattering sample (Hooijschuur et al., Reference Hooijschuur, Verkaaik, Davies and Ariese2015).
To assess the applicability of RRS for a certain analyte, the electronic transitions must be known. These transitions can be determined by recording an absorption spectrum covering the available laser wavelengths. If an electronic transition of the analyte and a particular laser wavelength overlap, RRS can be applied. Since mineral matrices are usually highly scattering or even opaque, common transmission UV/VIS spectroscopy is not applicable. UV/VIS diffuse reflectance spectroscopy (DRS) with an integrating sphere can be used, however, to collect spectra of scattering solid analytes. In addition, spectra can be extended to the near-infrared (NIR). Viscarra Rossel et al. (Reference Viscarra Rossel, McGlynn and McBratney2006) used UV/VIS/NIR DRS in combination with chemometrics to determine the composition of mineral-organic mixtures.
Infrared (IR) absorption techniques like Fourier transform infrared (FT-IR) are complementary to RS. Both techniques measure the energy of molecular vibrations, but strong bands in FT-IR are generally weak in RS and vice versa. One important difference between the two is that water is often a major interference in FT-IR but these signals are very weak in RS. This makes RS an ideal tool to detect and observe biological material. In addition, since RS is a scattering technique, it is easily applied to rough surfaces. When RS is combined with microscopy, the spatial resolution (dependent on the wavelength) can be sub-micrometre but as a consequence only areas of a few square millimetres can be examined in a reasonable time span.
Fluorescence interference
The intensity of Raman scattering is roughly proportional to λ−4, where λ is the excitation wavelength. Thus, at an excitation wavelength of 500 nm, 16 times more Raman scatter is produced than at 1000 nm. One drawback of using shorter excitation wavelengths, however, is the probability of fluorescence (see Fig. 1). Fluorescence results from the target molecule or from other compounds or impurities in the sample, but only occurs if the excitation wavelength overlaps with the UV/VIS absorption spectrum of one of the compounds. A variety of minerals and organic materials are highly fluorescent and can overwhelm the Raman signals since RS is an inherently weak effect (~1 in 107 photons). In RS several strategies can be implemented to avoid or reduce the fluorescence background:
First, fewer compounds will be excited by using longer excitation wavelengths, resulting in less background fluorescence, although some interference can still occur (Harvey et al., Reference Harvey, Iping Petterson, Weckhuysen, Gooijer, Ariese and Mank2012). A drawback of using longer excitation wavelengths is the decrease in the quantum efficiency of the charge-coupled device (CCD) detectors and the decrease in scattering efficiency, as mentioned earlier. Both effects lead to lower detection limits.
Second, applying RRS on a sample can be an effective approach to enhance the signal and thus reduce the relative contribution of fluorescence. This is especially effective when exciting close to a higher electronic band of the target compound so any fluorescence would not overlap with the RRS spectrum (Efremov et al., Reference Efremov, Ariese and Gooijer2008; Robert, Reference Robert2009). Because RRS only works for specific compounds, it provides selectivity for that compound over any associated matrix. Examples of this approach include RRS of carotenoid pigments in photosystem II complexes (Tracewell et al., Reference Tracewell, Cua, Bocian, Brudvig, Box and Haven2005) and haem groups inside a cellular matrix (Bonifacio et al., Reference Bonifacio, Millo, Keizers, Boegschoten, Commandeur, Vermeulen, Gooijer and van der Zwan2008). Although this technique is very useful for the detection of particular resonant biomarkers, extraterrestrial life does not necessarily contain chromophores similar to terrestrial molecules, therefore excitation using a tuneable laser source providing variable but controlled irradiance conditions would provide the best chance to excite a broader range of biomarkers by means of resonance. Tuneable lasers are currently not sufficiently developed for space applications, but the history of technical developments suggests that they may soon become suitable for interplanetary missions.
A third solution to overcome fluorescence interfering with Raman signals is the use of TRRS. This approach offers the opportunity to make a distinction between fluorescence and Raman signals based on the timescales of these two processes. Whereas the Raman effect is instantaneous, fluorescence is a slower process, typically in the order of nanoseconds. This means that when short laser pulses are used for excitation, the Raman photons are emitted earlier than fluorescence photons and can be detected separately by means of ultrafast detectors. Long-living luminescence of minerals can be suppressed at a nanosecond (ns) timescale (Soleimaninejad et al., Reference Soleimaninejad, Matroodi and Tavassoli2012), while short-living fluorescence of biological material makes it necessary to use picosecond (ps) time resolution to minimise the contribution of fluorescence (Everall et al., Reference Everall, Jackson, Howard and Hutchinson1986). In this study we make use of a fast-gated (250 ps) intensified CCD camera in combination with low-energy 3-ps laser pulses from a 76-MHz Ti:sapphire laser system (Efremov et al., Reference Efremov, Buijs, Gooijer and Ariese2007). A suspension of the fluorescent cyanobacterium Chroococcidiopsis in a calcite matrix is used to illustrate the effect of TRRS fluorescence suppression in Raman spectroscopy.
A potential asset of TRRS is that depth information of layered samples can be obtained, even when a translucent, scattering material is used as a first layer. The differences in the Raman spectra over time are related to the different layers of the sample (Matousek et al., Reference Matousek, Everall, Towrie and Parker2005). In a previous paper on the subject we have shown that Raman spectra of a second layer can be detected through 10 mm of translucent calcite or 40 mm of transparent halite (Hooijschuur et al., Reference Hooijschuur, Iping Petterson, Davies, Gooijer and Ariese2013). Potentially this technique can be used in a wide variety of research fields, for example it has been successfully applied to the detection of explosive material in plastic containers (Iping Petterson et al., Reference Iping Petterson, López-López, García-Ruiz, Gooijer, Buijs and Ariese2011), for the detection of calcification in breast tumours (Baker et al., Reference Baker, Matousek, Ronayne, Parker, Rogers and Stone2007) and for monitoring a chemical reaction within translucent catalytic pellets (Harvey et al., Reference Harvey, Iping Petterson, Weckhuysen, Gooijer, Ariese and Mank2012).
Project aims
In this research we have used the bacterium D. radiodurans as an example of a carotenoid-containing extremophile. This organism is frequently used in astrobiological research (Pogoda de la Vega et al., Reference Pogoda de la Vega, Rettberg and Reitz2007; Blasius et al., Reference Blasius, Sommer and Hübscher2008; Dartnell et al., Reference Dartnell, Hunter, Lovell, Coates and Ward2010). It can survive doses of gamma radiation up to 18 kGy (Battista, Reference Battista1997), which is 3500 times higher than the lethal dose for humans. Furthermore, it uses carotenoids in its cell membrane to protect itself from harmful UV radiation. The cell membrane of D. radiodurans contains 1–2% carotenoids (Rainey & Oren, Reference Rainey and Oren2006), with deinoxanthin being predominant (Tian et al., Reference Tian, Xu, Sun, Lin and Hua2007; see Fig. 2A). Deinoxanthin and β-carotene have comparable primary structures. Differences in these compounds, however, influence the absorption spectrum. The extra double bond in the chain of the deinoxanthin causes a spectral shift of 7–35 nm to the red (Goodwin, Reference Goodwin1980). The carbonyl (C=O) of the deinoxanthin also contributes to this red shift.
A. Structural formulae of deinoxanthin and β-carotene. Deinoxanthin is a carotenoid in the cell membrane of D. radiodurans with 12 conjugated C=C double bonds and one carbonyl; β-carotene is our model carotenoid with 11 conjugated C=C bonds. B. White light microscope images showing the shape and grain size of the three minerals studied in this work: (a) calcite (CaCO3), (b) gypsum (CaSO4·2H2O) and (c) halite (NaCl).
A second extremophile used in this study is the cyanobacterium Chroococcidiopsis. It is one of the most primitive extremophilic cyanobacteriae known on Earth. It is photosynthetic and able to survive harsh environmental conditions such as both high and low temperatures, ionising radiation, desiccation and high salt concentrations (Baque et al., Reference Baque, Viaggiu, Scalzi and Billi2013). Chroococcidiopsis is found on Earth beneath translucent rocks, which provide condensation of moisture without blocking the sunlight, essential to sustain growth.
Previous work on carotenoids in mineral matrices (Vítek et al., Reference Vítek, Jehlička, Edwards and Osterrothová2009a,Reference Vítek, Osterrothová and Jehličkab) has established that carotenoids can be detected down to 0.1 μg·g−1 in a mineral matrix. The goal of this paper is to explore various Raman spectroscopic methods (including RRS and TRRS) for carotenoid biomarkers and for microorganisms such as D. radiodurans within inorganic matrices. In addition to D. radiodurans, we have studied the influence of the mineral environment on the spectroscopic properties and detection of β-carotene.
In this paper we present the reference Raman spectra and UV/VIS diffuse reflectance spectra of the materials used in the experiments. Subsequently, experimental results are presented demonstrating the detection of β-carotene in mineral matrices and behind mineral layers. We have used β-carotene as a proxy for the deinoxanthin in the cell membrane of D. radiodurans. Ultimately, we discuss the potential of Raman techniques for the detection of organic molecules in future space missions. Given the rate at which the development of laser instrumentation is continuously reducing size, weight and power consumption, Raman approaches using instruments that are currently not yet suitable for space exploration were not a priori rejected.
Methods and materials
The mineral matrices used in the experiments consisted of calcium carbonate (CaCO3, >98% pure, light powder), sodium chloride (NaCl, >99% ACS grade) or calcium sulfate dihydrate (CaSO4·2H2O, >98%) purchased from Fisher Scientific, Geel, Belgium. β-carotene, purum was purchased from Sigma-Aldrich, St Louis, USA and cyclohexane >99% for spectroscopy was purchased from Acros Organics, Fisher Scientific – Geel, Belgium.
A wild strain of D. radiodurans was obtained at the VU University Amsterdam from Wilfred Röling. After incubation on a nutrient agar (NA) plate, the D. radiodurans was grown in 2 days at 30°C. Petri dishes with the colonies were stored in the refrigerator at 4°C for 1 month. After 1 month a few colonies were transferred to a fresh NA plate. The microbiologically tested nutrient agar was purchased from Sigma-Aldrich, St Louis, USA. The Chroococcidiopsis was obtained from the Culture Collection Yerseke (CCY) via Gerard Muyzer of the University of Amsterdam.
Solid mineral samples used as first layers in depth resolution studies were 2.5 mm thick translucent calcite (CaCO3) and 40 mm thick transparent halite (NaCl). Calcite was obtained from the mineral collection at the VU University Amsterdam. Halite was obtained from de Wereldwinkel, Amsterdam. Calcite was used as an example of translucent minerals and halite as a model for transparent minerals.
Sample preparation
The β-carotene mineral mixtures ranging from 104 μg to 10−1 μg of β-carotene per gram of mineral were prepared by mixing weighed amounts of β-carotene with the commercially available powders of three mineral matrices: calcite, gypsum and halite. The mixtures were pulverised and homogenised using a ceramic mortar and pestle. The minerals after pulverisation had variable grain sizes and forms (Fig. 2B). Calcite grains have an aspect ratio of ~5 and range in length between 0.2 and 1 μm. Gypsum has aspect ratios of ~10 and are up to 100 μm in length. Halite is anhedral to subhedral with aspect ratios of ~2 with the largest dimension between 20 and 50 μm.
The D. radiodurans–calcite mixture of 1 mg cells per gram calcite was prepared by first mixing weighed amounts of D. radiodurans colonies with a 0.9% NaCl solution and was mixed using a vortexer. Then 100 μl of the suspension was transferred to 100 mg of calcite and homogenised using a ceramic mortar and pestle. Small amounts of this mixture were transferred to a microscope slide and measured immediately after drying.
The Chroococcidiopsis–calcite mixture of 38 mg cells per gram calcite was prepared by mixing 500 μl of a 38 mg·ml−1Chroococcidiopsis suspension with 500 mg of calcite and was homogenised using a ceramic mortar and pestle. Small amounts of this mixture were transferred to a microscope slide and measured immediately.
Instrumentation
TRRS measurements were conducted with a pulsed laser (3-ps pulses at a 76-MHz repetition rate) at an excitation wavelength of 720 nm and 610 mW of laser power at the sample. Full details of the instrumental setup including a schematic representation are given in Hooijschuur et al. (Reference Hooijschuur, Iping Petterson, Davies, Gooijer and Ariese2013). TRRS time delays are expressed relative to the laser pulse.
Conventional Raman spectra were recorded using a Renishaw InVia Reflex confocal Raman microscope (Wotton-under-Edge, UK) with a Peltier-cooled CCD detector (203 K). The maximum output power of the 532 and 785 nm lasers is 80 and 300 mW, respectively; the much lower powers actually applied at the sample are given in the figure captions. The instrument included a Leica light microscope with 5× and 20× air objectives. The 521 cm−1 Raman shift of an internal silicon standard was used to verify the spectral calibration of the system. Lorentzian fits were used to determine peak centre. Spectra are shown with a y-axis offset for legibility.
UV/VIS DRS measurements were performed on a Shimadzu UV-2501PC UV/VIS spectrophotometer equipped with an Ulbricht integrating sphere, model ISR-240A. Scan speed was set at 600 nm·min−1 with a slit width of 5 nm. The sample, consisting of a mineral matrix mixed with either an organic compound or bacteria, was measured compared to a reference of the pure mineral background. Both the sample and the reference were placed against openings in a metal sphere. Opposite these holes are slits for the incoming light beams. The sphere is internally coated with a highly scattering white powder (BaSO4) and is externally equipped with a photodetector behind another opening. The accompanying spectrophotometer alternately illuminates the sample and the background reference with monochromatic light using an incandescent lamp, monochromator and beam chopper. The powder coating of the sphere efficiently reflects the scattered light from the sample and background reference without affecting it, until it reaches the photodetector. The reflectance of an analyte in a mineral matrix can then be determined by subtracting the spectrum of the reference from the spectrum of the sample.
The UV/VIS transmission spectrum of a non-scattering 10−5 M solution of β-carotene in cyclohexane was obtained with a Varian Cary 50 Bio UV/VIS spectrometer at a scan speed of 300 nm·min−1 and a using 10 mm quartz cuvette.
Analyses and results
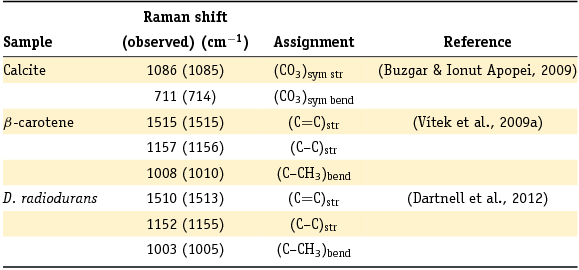
Individual Raman spectra were recorded for all the minerals and organic materials (β-carotene, D. radiodurans and nutrient agar) at both 532 and 785 nm excitation wavelengths. Raman spectra of minerals and the organic materials at an excitation wavelength of 532 nm are presented in Fig. 3A and B, respectively. No major differences in the Raman spectra were observed between the 532 and 785 nm excitation wavelengths except for some fluorescence of a compound in the agar and luminescence from the microscope objective. The peak assignments of the relevant vibrational modes are given in Table 2. As expected, no Raman spectrum could be obtained for the centrosymmetric (trigonal symmetry) halite.
Overview of the major peaks and assigned vibrations of the reference Raman spectra of calcite, β-carotene, and carotenoid-type compounds in D. radiodurans.
Wavenumbers in parentheses refer to this work.
sym, symmetric; str, stretch; bend, bending.
A. Reference Raman spectra of calcite (top), gypsum (middle) and halite (bottom) powders, recorded at 532 nm excitation wavelength and 300, 300 and 3000 μW laser power respectively. B. Reference Raman spectra of β-carotene powder (top), D. radiodurans (middle) and nutrient agar (bottom) recorded at 532 nm excitation wavelength and 30, 0.03 and 300 μW laser power, respectively. All spectra recorded with 10 accumulations of 1 s and a 20× objective; offset y-axis for legibility.
Gated detection of Raman spectra using an intensified CCD camera helps to reduce the contribution of the inherently slower fluorescence signal to a Raman spectrum (Efremov et al., Reference Efremov, Buijs, Gooijer and Ariese2007). A sample of calcite mixed with a suspension of the cyanobacterium Chroococcidiopsis was used as a proxy for highly fluorescent samples. Raman spectra obtained using gated and non-gated detection are shown in Fig. 4 to illustrate the differences. The two measurements were carried out under identical conditions, with a regular CCD and a gated intensified CCD camera mounted to the same spectrograph. The absolute intensities cannot be compared since two different detectors were used. The Raman spectrum with gated detection shows a much better signal-to-background ratio of the calcite peak (indicated with an arrow at 1085 cm−1) than the Raman spectrum of the non-gated signal. The delay time of the gated detector was set at a position that the gate closes just after the laser pulse to detect the instantaneous Raman photons of the calcite. This delay time setting, however, rejects the majority of the fluorescent light from the cyanobacteria that reaches the detector over the course of nanoseconds.
Fluorescence suppression in time-resolved Raman spectroscopy of a Chroococcidiopsis suspension in a calcite matrix. The signal-to-background ratio of the calcite peak at 1085 cm−1 (black arrow) of the gated TRRS spectrum (red) is much higher compared to the calcite peak of the non-gated RS spectrum (black). Both spectra were recorded at a 720 nm excitation wavelength with 10 acquisitions of 10 s for the TRRS and 1000 acquisitions of 0.1 s for RS. Note that the intensity scales of the two detectors cannot be directly compared.
Prior to studying the resonance Raman effects of the pure β-carotene and carotenoids in D. radiodurans, we recorded UV/VIS diffuse reflectance spectra to pinpoint the upper and lower boundaries of the absorption bands of the carotenoids in different physical conditions in vivo and in vitro. These surface absorption spectra were recorded using a UV/VIS spectrometer with an integrating sphere. In Fig. 5A diffuse reflectance spectra are shown of four different samples containing 0.71 mg·g−1 β-carotene in calcite and gypsum matrices, 0.36 mg·g−1 β-carotene in a halite matrix and a dried D. radiodurans suspension on a calcite matrix. Although the concentrations of β-carotene in all three samples were comparable, large differences in the degree of absorption were observed. The absorbance in the halite matrix is more than 20 times stronger than that in the calcite matrix. The spectra in Fig. 5A are normalised at the 488 nm peak of the halite matrix. A broad absorption peak between 350 and 650 nm is shown, which means that the mixture absorbs strongly in the blue and green part of the visible spectrum. Compared to the spectrum in the gypsum matrix, both spectra in halite and calcite matrices are shifted to the red. The large difference in absorption is caused by differences in penetration depth. Differences in optical transparency and the grain size of the mineral crystals have a large influence on the penetration depth of the light in the sample. The further the light penetrates into the sample, the more likely it will be absorbed by the β-carotene.
A. UV/VIS diffuse reflectance spectra of 0.71 mg·g−1 β-carotene in a matrix of calcite (black, dotted) or gypsum (red, dash-dot) and 0.36 mg·g−1 β-carotene in halite (blue, short dash). Spectral intensities are normalised at 488 nm. The diffuse reflectance spectra of β-carotene in a calcite or halite matrix are shifted towards longer wavelengths when compared to the diffuse reflectance spectrum of β-carotene in gypsum. The solid magenta line is a diffuse reflectance spectrum of a dried D. radiodurans suspension on a calcite background. B. UV/VIS transmittance spectrum of a 10−5 M solution of β-carotene in cyclohexane. Compared to the β-carotene spectra in minerals, the spectra of β-carotene in cyclohexane and D. radiodurans on a calcite background are sharper and more shifted toward shorter wavelengths.
The transmittance spectrum of a 10−5 M β-carotene solution in cyclohexane in Fig. 5B helps to understand the reasons for the spectral shifts of carotenoids in different matrices. β-carotene in cyclohexane shows a narrower spectrum than when mixed with a mineral. The carotene molecules are completely dissolved as separate molecules in the cyclohexane, therefore the molecules are in a more homogenous environment than when mixed as a solid with a mineral matrix. A more homogenous, non-polar environment means a narrower distribution of the environmental influences.
The shape of the diffuse reflectance spectrum of D. radiodurans is in between that of the β-carotene solution and those of the mineral matrices. Since the carotenoids of D. radiodurans are located in the cell membrane of that organism, the carotenoid molecules are distributed in the non-polar environment of the phospholipid bilayer. The broadening of the absorption spectrum is probably the result of different carotenoids in the membrane, where deinoxanthin is the most abundant. The largest broadening of the spectra is observed in combination with the mineral matrices. The carotene molecules experience a more heterogeneous environment because the sample is in a mixture of two solid materials and not fully mixed at a molecular level. Minerals are more polar compared to the cell membrane or cyclohexane. Inside a powder particle the carotenoid molecules will be stacked on each other (Britton, Reference Britton1995). Since carotenoids are very sensitive to their electronic environment, large shifts and broadening of the peaks in the diffuse reflectance spectra are observed. Our experiments are in full agreement with this interpretation. It will be important to take this peak broadening into account when interpreting RRS, since the resonance effect of the Raman spectra is dependent on the absorption spectrum of the actual sample, which can be quite different from that in solution. These results indicate that RRS spectra can be recorded with blue and green excitation laser sources.
Our quantitative Raman measurements of different concentrations of β-carotene in the mineral mixtures at 532 and 785 nm excitation (Hooijschuur et al., Reference Hooijschuur, Verkaaik, Davies and Ariese2015) were in agreement with the work reported by Vítek et al. (Reference Vítek, Jehlička, Edwards and Osterrothová2009a) measured at 514.5 and 785 nm excitation wavelengths. In addition, RRS spectra were recorded through minerals at a 532 nm excitation wavelength. Layers of 2.5 mm translucent calcite or 40 mm of transparent halite were placed onto the samples. As expected, the Raman signal of the β-carotene reduced drastically, but concentrations of 104 μg·g−1 of β-carotene in the mineral could still be detected through 40 mm of transparent halite (Fig. 6A) and 2.5 mm of translucent calcite (Fig. 6B).
A. Raman spectrum of a mixture of β-carotene in a NaCl matrix (104 μg·g−1) through a 40 mm transparent halite layer. The 1156 and 1515 cm−1 peaks (indicated with two arrows) of β-carotene are clearly visible. B. Raman spectra of a mixture of β-carotene in a calcite matrix (104 μg·g−1) through a 2.5 mm translucent calcite layer with the focus at the surface (dotted line, black, left scale) and deeper into the sample (solid line, red, right scale). The ratio between the β-carotene peaks at 1010, 1156 and 1515 cm−1 (indicated with three arrows) and the calcite peak at 1085 cm−1 clearly improves when changing from a surface focus to a deep focus. Both samples were measured with 532 nm excitation wavelength, 30 mW laser power, with 10 accumulations of 1 s and a 5× objective.
When measuring through a layer of material with a conventional Raman spectrometer, the ratio between the peak heights of β-carotene in the second layer and those of the mineral in the first layer significantly improves when slightly defocusing the microscope objective. A 15 times improvement of the peak ratio is shown in Fig. 6B. Even though proper focusing is not possible in a strongly scattering matrix, the ratio between the second layer β-carotene peaks (1010, 1156 and 1515 cm−1) and first layer calcite peak (1085 cm−1) significantly improves when comparing focusing at the surface (black, dotted line) and focusing deep inside the sample (red, solid line). This phenomenon was also reported by (Eliasson et al., Reference Eliasson, Claybourn and Matousek2007) and is mainly due to the fact that Raman signals from the surface layer are less optimally collected whereas for Raman photons created deeper inside a multiple scattering matrix the focus is much less critical. As an added bonus, defocusing and depth analysis also means that signals are collected from a larger sample volume, thus reducing the influence of possible sample inhomogeneity.
The final stage in optimising our method was to analyse a sample containing microorganisms in a mineral matrix. Mixtures of the bacterium D. radiodurans and calcite were used to estimate the detection limit of these microorganisms within minerals and appeared homogenous at an optical level. The Raman spectrum is the average of 100 acquisitions of 1 s at a 532 nm excitation wavelength with 3 mW laser power and a 20× objective. The peaks of the carotenoids in the cell membrane of the D. radiodurans that occur at 1155 and 1513 cm−1 were still clearly detectable at a concentration of 1 mg of cells per gram of calcite, as shown in Fig. 7. Repeated measurements at different spots did not show major differences in relative peak intensities. The absolute intensities scaled linearly with the applied laser power (data not shown).
Raman spectrum of D. radiodurans at concentrations of 1 mg cells per gram calcite. The arrows show the 1155 and 1513 cm−1 peaks of the carotenoid compound(s); the other major peaks are from calcite. The Raman spectrum is the average of 100 acquisitions of 1 s, the sample was measured with 532 nm excitation wavelength, 3 mW laser power and a 20× objective.
Discussion and conclusions
We characterised the interaction and influence of the environment on the carotenoids by measuring UV/VIS diffuse reflectance spectra of D. radiodurans and β-carotene in different mineral matrices. This information is considered a first step in the selection of an appropriate excitation wavelength for our future studies and for Raman equipment on a future planetary rover.
The observed detection limits for mixtures of β-carotene and minerals, quantified as 0.1 μg·g−1, were in agreement with earlier work of Vítek et al. (Reference Vítek, Jehlička, Edwards and Osterrothová2009a). Additionally, we have shown that the focal point of a microscope objective is an important but not essential parameter for the detection of compounds. Moreover, the detection of carotene through 2.5 mm of translucent calcite and through 40 mm of transparent halite demonstrates the depth detection capabilities of the technique. Comparison between measurements performed using optimised focus on the surface compared to a deeper focus in the sample can be used to provide information about layering in the sample.
This article does not attempt to answer the question of whether there might be life on Mars, but it has clearly shown that the detection of organic molecules is possible at the sub-ppm level on or behind mineral surfaces, provided care is taken in the choice of excitation wavelength. The conclusion is that the highest sample detection sensitivities are acquired under resonance conditions, suggesting that tuneable lasers should be considered for future planetary missions. The physical size and power consumption of these laser systems, however, are currently too large for space application: further technical developments are expected to reduce the instrumental size and power consumption and planetary rovers equipped with such tuneable laser systems may be applied in the near future. Such systems would offer the possibility of carrying out more sensitive and more selective Raman measurements under resonant conditions (Tracewell et al., Reference Tracewell, Cua, Bocian, Brudvig, Box and Haven2005; Bonifacio et al., Reference Bonifacio, Millo, Keizers, Boegschoten, Commandeur, Vermeulen, Gooijer and van der Zwan2008; Gaft & Nagli, Reference Gaft and Nagli2008). This is needed because, for example, carotenoids are sensitive to their environment and that influences the resonance conditions (Britton, Reference Britton1995; Hooijschuur et al., Reference Hooijschuur, Verkaaik, Davies and Ariese2015).
We still do not know if Raman will meet bacteria on Mars, but we show that Raman spectroscopy offers the possibility for the non-invasive detection of extremophiles living in and on minerals, and ongoing research will elaborate on this subject, for example detection of extremophiles through minerals and stimulated Raman for fast imaging of biomarkers.
Acknowledgements
We would like to express our appreciation to Wilfred Röling of the Department of Molecular Cell Physiology of the VU University Amsterdam for providing us with a strain of wild type Deinococcus radiodurans, and to Gerard Muyzer of Microbial Systems Ecology at the University of Amsterdam for providing the Chroococcidiopsis from the Culture Collection Yerseke. We also thank NWO (Netherlands Space Office) for funding this project (ALW-GO-PL/14). We would like to thank two anonymous reviewers for their constructive criticisms of the manuscript and Sebastiaan de Vet for editorial assistance.