


Impact statement
Drylands areas of West Africa cover 6.8 million square kilometers (km2), with nearly 2.1 million km2 arid. About 53% of West Africa is covered by drylands, in which over 40 million people living in the semi-arid drylands and depending on agriculture and livestock for their livelihoods. Paradoxically, the drylands areas of West Africa are home to many of the poor challenged by harsh agro-climatic conditions, which generally restrict potential of crops, leading to low agricultural productivity and making local populations vulnerable to food insecurity. In this context, to make smallholder farming profitable, it is important to examine sources of inefficiency using rigorous methods. In this perspective, this study explores technical efficiencies of three semi-arid dryland countries in West Africa (Ghana, Mali and Nigeria) using a two-step stochastic metafrontier approach. The results suggest that inefficiency relative to the metafrontier comes mainly from the production technology gap than operating inefficiency especially in Ghana and Mali. Ultimately, we envision this research to support effective technology-led programs prospects accounting for sources of inefficiency in these countries for raising farmers’ agricultural productivity.
Introduction
It has long been recognized that Sub-Saharan Africa (SSA) needs to significantly and sustainably intensify its smallholder agriculture to meet the food demands from a growing population (Livingston et al., Reference Livingston, Schonberger and Delaney2011). Especially, the drylands of Africa are home to over 525 million people who depend on agriculture and livestock for their livelihoods (GCA, 2019). But achieving sustainable increases in smallholders’ productivity is not easy (IFPRI, 2014). Indeed, the dryland regions of Africa are home to many of the poor facing harsh agro-climatic conditions (e.g., uncertainFootnote 1 availability of water both in terms of quantity and timing [erratic rainfall], low soil fertility, climate change) and a lack of infrastructure as well as agriculture support services (Walker et al., Reference Walker, Hash, Rattunde and Weltzien2016). These situations offer limited prospects and few investment incentives for poor farmers, generally restrict potential of crops, leading to low agricultural productivity and making local populations vulnerable to food insecurity. Therefore, there is an urgent need to identify the best means of harnessing the required resources to further advance the agricultural productivity in the dryland zone of Sub-Saharan Africa (SSA). In addition, comparing and contrasting where the challenges to and opportunities for growth in productivity are located and doing so at multiple scales can give us powerful insights that can enrich our understanding to enhance agricultural productivity (ICRISAT, 2014; Li et al., Reference Li, Diop, Hirwa, Maesho, Ning, Tian, Qiao, Faye, Cissé, Guisse, Leng, Peng and Chen2024).
To make smallholder farming profitable through inclusive, market-oriented development, it is important to examine the productivity and efficiency of farmers across countries in this dryland zone and their regional differences. Productivity performance in the agricultural sector is critical to improvement in overall economic well-being and can offer good opportunities for food security and poverty reduction in this region. Farming system in the drylands SSA is diverse, with mixed cropping predominating as a way of protecting against risk (Walker et al., Reference Walker, Hash, Rattunde and Weltzien2016). Smallholder farming systems in the drylands region of SSA are characterized by an integrated set of cash cropping and subsistence food cropping activities. The dynamics between sub-systems can influence the scope for complementarity between their operations, especially considering the seasonality of demand for household labor and management inputs within the farming system which can influence factor productivity and the efficiency of crop production (Coelli and Fleming, Reference Coelli and Fleming2004). In the presence of a typical multi-output multi-input technology, the production cost pertains to the production of all of the outputs, in our case cereal and vegetable crops. In addition, farmers across SSA countries face different production opportunities due to differences in physical, human and financial capital (e.g., capital, labor, credit), economic infrastructure (e.g., access to outputs market, access to extension services), resource endowments (e.g., land, fertilizer) and other characteristics of the physical and socio-economic environment in which production occurs (O’Donnell et al., Reference O’Donnell, Rao and Battese2008; Missiame et al., Reference Missiame, Nyikal and Irungu2021). Thus, smallholder farmers in the dryland zone are heterogeneous in production conditions and in production technology used across countries.
In the efficiency analysis literature, the metafrontier approach is commonly employed to control for production technology heterogeneities (Alem, Reference Alem2021). The metafrontier analysis allows to decompose sources of inefficiency into operatingFootnote 2 inefficiency and technology gap (Mensah and Brümmer, Reference Mensah and Brümmer2016). However, the literature on interregional efficiency for dryland farming systems in West Africa is limited and very few have used the stochastic metafrontier methods for analyzing and comparing farming systems across dryland countries (Adjin and Henning, Reference Adjin and Henning2020; Aminu et al., Reference Aminu, Ayinde and Sanusi2020; Miriti et al., Reference Miriti, Otieno, Chimoita, Bikketi, Njuguna and Ojiewo2021; Missiame et al., Reference Missiame, Nyikal and Irungu2021). The objective of this paper is to measure and compare technical efficiency of smallholder farmers in the dryland countries of SSA, namely, Ghana, Mali and Nigeria, using a stochastic output distance metafrontier approach. First, we investigate intra-country technical efficiency using a technology-constrained model and inter-country technical efficiency differentials among individual farms using the unrestricted technology model (i.e., the metafrontier). Second, we examine whether significant technical efficiency differentials exist between farms in these countries by measuring the gap between the country-specific frontiers and the metafrontier. Technical efficiency is defined as the ability of a farmer to obtain maximal output from a given set of outputs or to use the minimum inputs required to produce a given set of outputs. The output distance concept refers to the ability of a farm to increase all of the outputs by a given multiple with the current set of inputs. If for some reasons, one output is more difficult to increase than the other, then it ends up limiting the multiple by which both outputs can be magnified. Similarly, the addition of inputs may have a limited effect on the growth of both outputs when one of these outputs faces constraints. The output distance function considers these dynamics of multiple output and multiple inputs setting which is the case of farming system in the dryland zone. Finally, we investigate exogenous factors that influence variations in country-specific technical efficiency and the dryland metafrontier technical efficiency.
Unlike previous studies that applied linear programing to measure the metafrontier (Ben Jemaa and Dhif, Reference Ben Jemaa and Dhif2006; O’Donnell et al., Reference O’Donnell, Rao and Battese2008; Bahta et al., Reference Bahta, Baker, Malope and Katjiuongua2015; Gong et al., Reference Gong, Battese and Villano2019; Aminu et al., Reference Aminu, Ayinde and Sanusi2020), we follow Huang et al. (Reference Huang, Huang and Liu2014) and apply stochastic frontier analysis to estimate both country-specific frontiers and the metafrontier. To avoid that points on the estimated metafrontier lie below points on the estimated group frontiers, we assume as recommended by Battese et al. (Reference Battese, Rao and O’Donnell2004) and O’Donnell et al. (Reference O’Donnell, Rao and Battese2008) that the metafrontier is a function enveloping all group frontiers. Moreover, given that the assumption of homogeneous production technology across countries might not be true, we test as in Nyemeck and Nkamleu (Reference Nyemeck and Nkamleu2006) whether the data support separate production frontiers. The paper makes several contributions to the farming systems in the dryland economics literature in Africa. First, we apply the output distance function framework unlike Das et al. (Reference Das, Kumar and Ganga Rao2023) to consider the multi-output and multi-input technology which characterizes the farming systems in the dryland zone in SSA. Second, we control for the heterogeneity of the country-specific production technology differences using two-step output distance stochastic metafrontier approach. Our study is one of the first to develop and apply this technique at a farm level across dryland Africa countries. This enables us to compute the country-specific technical efficiency of farmers, the dryland metafrontier technical efficiency and the technology gap between country-specific frontier and the metafrontier. The empirical analysis of this study is based on a farm survey in Ghana, Mali and Nigeria, where data were collected on crop production in different farming systems.
The rest of the paper is structured as follows. The next section provides a brief description of the drylands farming systems, followed by the theoretical framework and empirical modeling approach. A description of the data is then presented, after which the results are discussed. The paper concludes with remarks and policy implications.
Dryland farming systems in West Africa
The drylands of Africa cover about 2.1 billion ha, with nine countries clustered around the Sahara, each accounting over 100 million ha (Dregne, Reference Dregne2002) and cover 60% of the continent (Kolding et al., Reference Kolding, van Zwieten, Marttin and Poulain2016). The West Africa Drylands represent 53% of the region’s land surface, cover 6.8 million km2, with nearly 2.1 million km2 arid and over 40 million people living in the semi-arid drylands (UNEP, 2005; GCA, 2019). Drylands farming systems are characterized by harsh agro-climatic conditions, notably water stress, extreme climatic variability and land degradation. The lack of water is the main factor that limits profitable agricultural production (IFPRI, 2014; Li et al., Reference Li, Diop, Hirwa, Maesho, Ning, Tian, Qiao, Faye, Cissé, Guisse, Leng, Peng and Chen2024). As a result, productivity is generally low, and production tends to fluctuate considerably from year to year (Walker et al., Reference Walker, Hash, Rattunde and Weltzien2016). Drylands farming systems consist of combinations of plant and animal species and management practices that farmers use to pursue livelihood goals based on several factors, including climate variability, soil, markets, capital and tradition (IFPRI, 2014). Cereal production is extremely widespread in West Africa countries, where pearl millet and sorghum are the main crops especially in Southern Mali, Northern Ghana and Northern Nigeria (Djido et al., Reference Djido, Houessionon, Nikoi, Ouédraogo, Ouédraogo, Segnon and Zougmoré2021; Sangaré et al., Reference Sangaré, Singbo and Tamini2025). There is almost no structured market for certified seeds due to the nature of self-consumption of these two cereals. Farmers use their own seeds, which are often of poor quality. About 5% of farmers supervised by NGOs and development projects use certified seeds (Fall 2011).
Stochastic output distance metafrontier approach
Since the two seminal works of Aigner et al. (Reference Aigner, Lovell and Schmidt1977) and Meeusen and von den Broeck (Meeusen and Van den Broeck, Reference Meeusen and Van den Broeck1977), frontier efficiency analysis has evolved substantially (e.g., see Fried et al., Reference Fried, Lovell and Schmidt2008; Kumbhakar and Lovell, Reference Kumbhakar and Lovell2000 for an overview). The metaproduction function was first introduced by Hayami (Reference Hayami1969) and Hayami and Ruttan (Reference Hayami and Ruttan1970, Reference Hayami and Ruttan1971) but the metafrontier efficiency measurement begins with Battese and Rao (Reference Battese and Rao2002) and Battese et al. (Reference Battese, Rao and O’Donnell2004) that is implicitly underpinned by two data-generating processes, one that explains deviations between observed outputs and specific group frontiers and another that explains deviations between observed outputs and the metafrontier (O’Donnell et al., Reference O’Donnell, Rao and Battese2008). The metafrontier is required because efficiency levels measured relative to one frontier (e.g., the Ghanaian frontier) cannot be compared with efficiency levels measured relative to another frontier (e.g., the Malian frontier). In addition, simply pooling all the data of the various groups is not justifiable, as the so-derived metafrontier would not necessarily envelop the country-specific frontiers (Huang et al., Reference Huang, Huang and Liu2014) and will suffer from the standard drawback. The descriptive statistics in Appendix 2 shows that the observed production inputs and outputs differ significantly across countries providing additional support that the metafrontier analysis is preferable given the substantial observed inter-country heterogeneity. Like O’Donnell et al. (Reference O’Donnell, Rao and Battese2008) and Huang et al. (Reference Huang, Huang and Liu2014), the metafrontier and group frontiers are defined in terms of output sets and output distance functions. Then, we show how output distance functions can be used to decompose the metafrontier into metatechnology ratios and specific group technical efficiencies.
Input and output distance functions are popular tools to model production and measure efficiency in the context of multi-output production technologies. Given the multi-output nature of farming systems in the drylands countries where smallholder farmers usually combine multiple inputs to produce multiple outputs (e.g., cereals, vegetables, legumes, fiber crop and plant), distance functions are better suited than a single-output production function to characterize the technology. Although both output and input distance functions could provide a representation of the production technology used in dryland farming systems, the argument in favor of the output distance is that farmers are not constrained by production limits and increases in the size of farms suggest that these farms have been able to make output adjustments in spite of environmental constraints (Singbo et al., Reference Singbo, Larue and Tamini2020).
Output-oriented distance functions
When using a parametric output distance function (ODF), an output-oriented efficiency measure compares the observed level of output with the maximum output that could be produced with given inputs. The output distance function gives a distance measure (not an output level as in the standard productionFootnote
3 function) when producing multiple outputs, indicating how far the observed output bundle is from the frontier. Estimating this efficiency requires defining the technological set, which is the technically feasible combination of inputs and outputs (Shephard, Reference Shephard1970; Färe and Primont, Reference Färe and Primont1995; O’Donnell et al., Reference O’Donnell, Rao and Battese2008). Let
 $ X $
and
$ X $
and
 $ Y $
be non-negative real input and output vectors of dimension
$ Y $
be non-negative real input and output vectors of dimension
 $ N\times 1 $
and
$ N\times 1 $
and
 $ M\times 1 $
, respectively. The metatechnology set can be defined as follows:
$ M\times 1 $
, respectively. The metatechnology set can be defined as follows:
 $$ T=\left\{\left(X,Y\right):X\in {R}_{+}^N,Y\in {R}_{+}^M;X\hskip0.35em \mathrm{can}\hskip0.35em \mathrm{produce}\;Y\right\}. $$
For any input vector
 $ X $
, let
$ X $
, let
 $ P(X) $
be the output set associated with this metatechnology set,
$ P(X) $
be the output set associated with this metatechnology set,
 $ Y $
, that are obtainable from the input vector
$ Y $
, that are obtainable from the input vector
 $ X $
:
$ X $
:
 $$ P(X)=\left\{Y:\left(X,Y\right)\in T\right\}. $$
We assume that the technology satisfies the standard regularity conditions such as
 $ T $
is a closed setFootnote
4 (not empty) and convex, the output set
$ T $
is a closed setFootnote
4 (not empty) and convex, the output set
 $ P(X) $
is bounded for any
$ P(X) $
is bounded for any
 $ X $
, no free lunch (i.e., no output without input), not producing anything is possible, that is,
$ X $
, no free lunch (i.e., no output without input), not producing anything is possible, that is,
 $ \left(X,0\right)\in T $
for any
$ \left(X,0\right)\in T $
for any
 $ X $
, and inputs and outputs are freely disposableFootnote
5 (Färe and Primont, Reference Färe and Primont1995; Chambers et al., Reference Chambers, Chung and Färe1996). The boundary of this output set represents the output frontier. Then, the output distance function can then be defined in terms of the output set,
$ X $
, and inputs and outputs are freely disposableFootnote
5 (Färe and Primont, Reference Färe and Primont1995; Chambers et al., Reference Chambers, Chung and Färe1996). The boundary of this output set represents the output frontier. Then, the output distance function can then be defined in terms of the output set,
 $ P(X), $
as follows:
$ P(X), $
as follows:
 $$ {\displaystyle \begin{array}{rcl} OD\left(X,Y\right)& =& {\operatorname{inf}}_{\theta}\left\{\theta >0:\left(\frac{Y}{\theta}\right)\epsilon\;P(X)\right\}\\ {}& =& {\min}_{\theta}\left\{\theta >0:\left(\frac{Y}{\theta}\right)\epsilon\;P(X)\right\}\end{array}} $$
The output distance function (ODF) measures the minimum factor
 $ \theta $
by which the output vector can be proportionally divided or the maximum proportion
$ \theta $
by which the output vector can be proportionally divided or the maximum proportion
 $ \tau =\frac{1}{\theta } $
by which the output vector can be proportionally scaled up, to reach the frontier, keeping inputs fixed. Therefore,
$ \tau =\frac{1}{\theta } $
by which the output vector can be proportionally scaled up, to reach the frontier, keeping inputs fixed. Therefore,
 $ \frac{1}{\theta } $
is the proportional expansion of outputs that is required to reach the upper boundary of the output set or the production frontier, holding the inputs constant. The
$ \frac{1}{\theta } $
is the proportional expansion of outputs that is required to reach the upper boundary of the output set or the production frontier, holding the inputs constant. The
 $ OD\left(X,Y\right) $
represents the ratio of the observed output to maximum potential output obtainable from the given inputs. If the observed output vector
$ OD\left(X,Y\right) $
represents the ratio of the observed output to maximum potential output obtainable from the given inputs. If the observed output vector
 $ Y $
is an element of the feasible output set,
$ Y $
is an element of the feasible output set,
 $ P(X) $
then
$ P(X) $
then
 $ OD\left(X,Y\right)= OA/ OB<1 $
. But if
$ OD\left(X,Y\right)= OA/ OB<1 $
. But if
 $ Y $
is on the boundary of the output set or production frontier,
$ Y $
is on the boundary of the output set or production frontier,
 $ OD\;\left(X,Y\right)= OB/ OB=1 $
(see figure in Appendix 1). This also illustrates that Farrell (Reference Farrell1957)’s output-oriented measure of technical efficiency (
$ OD\;\left(X,Y\right)= OB/ OB=1 $
(see figure in Appendix 1). This also illustrates that Farrell (Reference Farrell1957)’s output-oriented measure of technical efficiency (
 $ TE $
), defined as the maximum radial expansion of the output vector, can be represented as the reciprocal of the output distance function (ODF) with
$ TE $
), defined as the maximum radial expansion of the output vector, can be represented as the reciprocal of the output distance function (ODF) with
 $ TE=1/ OD\left(X,Y\right) $
.
$ TE=1/ OD\left(X,Y\right) $
.
 $ TE $
lies between one and infinity. If
$ TE $
lies between one and infinity. If
 $ Y $
is located on the outer boundary of the feasible output set,Footnote
6
$ Y $
is located on the outer boundary of the feasible output set,Footnote
6
 $ TE=1 $
, indicating technical efficiency. In contrast, if
$ TE=1 $
, indicating technical efficiency. In contrast, if
 $ Y $
is in the interior of the production possibility set, this indicates technical inefficiency. The ODF inherits its regularity properties from the regularity properties of the output set
$ Y $
is in the interior of the production possibility set, this indicates technical inefficiency. The ODF inherits its regularity properties from the regularity properties of the output set
 $ T $
that are non-decreasing, positively linearly homogeneousFootnote
7 and convex in
$ T $
that are non-decreasing, positively linearly homogeneousFootnote
7 and convex in
 $ Y $
, and non-increasing and quasi convex in
$ Y $
, and non-increasing and quasi convex in
 $ X $
, and meets the representationFootnote
8 property.
$ X $
, and meets the representationFootnote
8 property.
Technical efficiencies and metatechnology ratios
Huang et al. (Reference Huang, Huang and Liu2014) proposed the two-step stochastic metafrontier (SMF) technique, which relies on stochastic frontier analysis in the second stepFootnote
9 to investigate the technical efficiencies of firms across different groups adopting distinct technologies. This technique offers several advantages. First, standard statistical inferences can be performed without relying on simulations or bootstrapping. Second, it allows for direct estimation of technology gaps by treating them as a conventional one-sided error term, which enables the separation of random shocks from the technology gaps. Finally, these technology gaps can be further specified as a function of environmental variables. The metafrontier represents the boundary of an unrestricted metatechnology set
 $ (T) $
. The country-specific frontiers represent the boundaries of restricted technology sets where the restrictions may be due to specific constraints prevailing in the countries, which limit smallholder farmers from using the full range of technologies potentially available (O’Donnell et al., Reference O’Donnell, Rao and Battese2008). From Equations (1) and (2), let us consider the case where the semi-arid dryland zones can be divided into
$ (T) $
. The country-specific frontiers represent the boundaries of restricted technology sets where the restrictions may be due to specific constraints prevailing in the countries, which limit smallholder farmers from using the full range of technologies potentially available (O’Donnell et al., Reference O’Donnell, Rao and Battese2008). From Equations (1) and (2), let us consider the case where the semi-arid dryland zones can be divided into
 $ K $
countries (three in our case). The input–output combinations available to farms in the
$ K $
countries (three in our case). The input–output combinations available to farms in the
 $ k- th $
country are contained in the country-specific technology set:
$ k- th $
country are contained in the country-specific technology set:
 $$ {T}^k=\left\{\left(X,Y\right):X\in {R}_{+}^K,Y\in {R}_{+}^M;X\;\mathrm{can}\;\mathrm{be}\;\mathrm{used}\ \mathrm{in}\ \mathrm{country}\;k\;\mathrm{to}\ \mathrm{produce},Y\right\} $$
Thus, the country-specific output sets and output distance functions for
 $ k=1,2,\dots, K $
, are defined as follows:
$ k=1,2,\dots, K $
, are defined as follows:
 $$ {P}^k(X)=\left\{Y:\left(X,Y\right)\in {T}^k\right\} $$
 $$ {\displaystyle \begin{array}{rcl}{OD}^k\left(X,Y\right)& =& {\operatorname{inf}}_{\theta}\left\{\theta >0:\left(\frac{Y}{\theta}\right)\epsilon\;{P}^k(X)\right\}\\ {}& =& {\min}_{\theta}\left\{\theta >0:\left(\frac{Y}{\theta}\right)\epsilon\;{P}^k(X)\right\}\end{array}} $$
If the output sets,
 $ {P}^k(X) $
, satisfy standard regularity properties, then the distance functions,
$ {P}^k(X) $
, satisfy standard regularity properties, then the distance functions,
 $ {OD}^k\left(X,Y\right) $
, also satisfy standard regularity properties. Irrespective of these properties:
$ {OD}^k\left(X,Y\right) $
, also satisfy standard regularity properties. Irrespective of these properties:
-
- If
 $ \left(X,Y\right)\in {T}^k $
for any
$ k $
, then
$ \left(X,Y\right)\in T $
;
$ \left(X,Y\right)\in {T}^k $
for any
$ k $
, then
$ \left(X,Y\right)\in T $
; -
- If
$ \left(X,Y\right)\in T $
, then
$ \left(X,Y\right)\in {T}^k $
for some
$ k $
; -
-
$ T=\left\{{T}^1U\;{T}^2U\dots U\;{T}^K\right\} $
; -
-
$ {OD}^k\left(X,Y\right)\ge OD\left(X,Y\right) $
for all
$ k=1,2,\dots, K $
, meaning that the restricted output sets are subset of the unrestricted output set. -
- Convex
$ P(X) $
does not necessarily imply convex group output sets,
$ {P}^k(X) $
,
$ k=1,2,\dots, K $
; and vice versa.


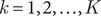
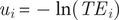
The stochastic metafrontier (SMF) is assumed to be a smooth (not a segmented) function that envelopes all the production frontiers of the individual countries as shown in Figure 1.
Country frontiers and the metafrontier.

More generally, an output-oriented measure of the technical efficiency of an observed pair
 $ \left(X,Y\right) $
with respect to the metatechnology is
$ \left(X,Y\right) $
with respect to the metatechnology is
 $ MTE=1/ OD\left(X,Y\right) $
and the output-oriented measure of technical efficiency with respect to the technology of country
$ MTE=1/ OD\left(X,Y\right) $
and the output-oriented measure of technical efficiency with respect to the technology of country
 $ k $
is
$ k $
is
 $ {TE}^k=1/{OD}^k\left(X,Y\right) $
. The closeness of each country frontier to the estimated metafrontier, called the metatechnology ratio (MTR) or the technology gap ratio (TGR), is computed as a ratio of the metafrontier (MTE) to the country-specific frontier (TE) as follows:
$ {TE}^k=1/{OD}^k\left(X,Y\right) $
. The closeness of each country frontier to the estimated metafrontier, called the metatechnology ratio (MTR) or the technology gap ratio (TGR), is computed as a ratio of the metafrontier (MTE) to the country-specific frontier (TE) as follows:
 $$ {MTR}^k\left(\mathrm{X},\mathrm{Y}\right)=\frac{\mathrm{OD}\left(X,Y\right)}{{\mathrm{OD}}^{\mathrm{k}}\left(X,Y\right)}=\frac{\mathrm{MTE}\left(X,Y\right)}{{\mathrm{TE}}^{\mathrm{k}}\left(X,Y\right)}\le 1 $$
Since the metafrontier (potential or best production technology overall) is assured to envelop the country-
 $ k $
frontier (existing production technology), MTR or TGR can take a value less or equal to 1. Then,
$ k $
frontier (existing production technology), MTR or TGR can take a value less or equal to 1. Then,
 $ \mathrm{MTE} $
can be derived as follows:
$ \mathrm{MTE} $
can be derived as follows:
 $$ \mathrm{MTE}\left(X,Y\right)={\mathrm{TE}}^{\mathrm{k}}\left(X,Y\right)\times {MTR}^k\left(\mathrm{X},\mathrm{Y}\right) $$
Econometric specification
Following Cuesta and Orea (Reference Cuesta and Orea2002) and Ku and Hao (Reference Ku-H and Hao-2011), the general form of the stochastic output distance function in the case of a cross-sectional data for a farm
 $ i $
can be written as follows:
$ i $
can be written as follows:
 $$ 1= OD\left({Y}_i,{X}_i,\beta \right)\;h\left({\varepsilon}_i\right),\hskip4em h\left({\varepsilon}_i\right)=\exp \left(-{u}_i+{v}_i\right) $$
where deviations from 1 are accommodated in the specification of
 $ h\left(\bullet \right) $
,
$ h\left(\bullet \right) $
,
 $ {Y}_i $
and
$ {Y}_i $
and
 $ {X}_i $
are outputs and inputs vector, respectively, as defined above, and
$ {X}_i $
are outputs and inputs vector, respectively, as defined above, and
 $ \beta $
is a vector of parameters. Technically inefficiency is accommodated in the specification of
$ \beta $
is a vector of parameters. Technically inefficiency is accommodated in the specification of
 $ h(.) $
, as
$ h(.) $
, as
 $ {\varepsilon}_i $
is a composed error term comprised of
$ {\varepsilon}_i $
is a composed error term comprised of
 $ {v}_i $
which is a standard noise component and
$ {v}_i $
which is a standard noise component and
 $ {u}_i $
which is a one-sided efficiency component. Imposing the homogeneity in outputs on the distance function and then normalizing arbitrarily by the M-
$ {u}_i $
which is a one-sided efficiency component. Imposing the homogeneity in outputs on the distance function and then normalizing arbitrarily by the M-
 $ \mathrm{th} $
output facilitate the estimation as follows (Singbo et al., Reference Singbo, Larue and Tamini2020):
$ \mathrm{th} $
output facilitate the estimation as follows (Singbo et al., Reference Singbo, Larue and Tamini2020):
 $$ OD\left(X,\pi Y\right)=\pi OD\left(X,Y\right), with\;\pi =1/{Y}_M>0 $$
 $$ OD\left(X,\frac{Y}{Y_M}\right)=\frac{OD\left(X,Y\right)}{Y_M} $$
Assuming
 $ {Y}_i^{\ast }=\left({Y}_{1,i}/{Y}_{M,i},{Y}_{2,i}/{Y}_{M,i},\dots, {Y}_{M-1,i}/{Y}_{M,i}\right) $
and rearranging terms the above general form becomes
$ {Y}_i^{\ast }=\left({Y}_{1,i}/{Y}_{M,i},{Y}_{2,i}/{Y}_{M,i},\dots, {Y}_{M-1,i}/{Y}_{M,i}\right) $
and rearranging terms the above general form becomes
 $ \frac{1}{Y_{M,i}}= OD\left({Y}_i^{\ast },{X}_i,\beta \right)\;h\left({\varepsilon}_i\right) $
. Finally, after assuming the Translog (transcendental logarithmic) functional form to represent the technology, the final estimable output-oriented distance can be represented as follows:
$ \frac{1}{Y_{M,i}}= OD\left({Y}_i^{\ast },{X}_i,\beta \right)\;h\left({\varepsilon}_i\right) $
. Finally, after assuming the Translog (transcendental logarithmic) functional form to represent the technology, the final estimable output-oriented distance can be represented as follows:
 $$ -\ln {Y}_{M,i}={\displaystyle \begin{array}{l}{\varphi}_0+{\sum}_{k=1}^K{\alpha}_k\ln \left({X}_{k,i}\right)+{\sum}_{m=1}^{M-1}{\beta}_m\ln \left({Y}_{m,i}^{\ast}\right)\\ {}+\hskip2px \frac{1}{2}{\sum}_{k=1}^K{\sum}_{s=1}^K{\alpha}_{k,s}\ln \left({X}_{k,i}\right)\ln \left({X}_{s,i}\right)\\ {}+\hskip2px \frac{1}{2}{\sum}_{m=1}^{M-1}{\sum}_{j=1}^{M-1}{\beta}_{m,j}\ln \left({Y}_{m,i}^{\ast}\right)\ln \left({Y}_{j,i}^{\ast}\right)\\ {}+\hskip2px {\sum}_{k=1}^K{\sum}_{m=1}^{M-1}{\theta}_{k,m}\ln \left({X}_{k,i}\right)\ln \left({Y}_{m,i}^{\ast}\right)-{u}_i+{v}_i\end{array}} $$
where
 $ {Y}_{m,i}^{\ast }={Y}_{m,i}/{Y}_{M,i} $
,
$ {Y}_{m,i}^{\ast }={Y}_{m,i}/{Y}_{M,i} $
,
 $ k=1,2,\dots, K $
and
$ k=1,2,\dots, K $
and
 $ s=1,2,\dots, K $
are indices for inputs;
$ s=1,2,\dots, K $
are indices for inputs;
 $ m=1,2,\dots, M $
and
$ m=1,2,\dots, M $
and
 $ j=1,2,\dots, M $
are indices for outputs;
$ j=1,2,\dots, M $
are indices for outputs;
 $ {\varphi}_0 $
,
$ {\varphi}_0 $
,
 $ \alpha $
,
$ \alpha $
,
 $ \beta $
and
$ \beta $
and
 $ \theta $
are unknown parameters to be estimated;
$ \theta $
are unknown parameters to be estimated;
 $ {v}_i $
is the two-sided statistical noise with
$ {v}_i $
is the two-sided statistical noise with
 $ {v}_i\sim N\left(0,{\sigma}_v^2\right) $
and
$ {v}_i\sim N\left(0,{\sigma}_v^2\right) $
and
 $ {u}_i $
represents the non-negative truncation error term of the inefficiency effect with the distribution assumption that
$ {u}_i $
represents the non-negative truncation error term of the inefficiency effect with the distribution assumption that
 $ {u}_i\sim {N}^{+}\left({w}_g\left({Z}_{g,i}\right),{\sigma}_u^2\left({Z}_{g,i}\right)\right) $
, where
$ {u}_i\sim {N}^{+}\left({w}_g\left({Z}_{g,i}\right),{\sigma}_u^2\left({Z}_{g,i}\right)\right) $
, where
 $ g=1,2,\dots, G $
is an index for environmental variables. The variation of the technical efficiency measures is then associated with exogenous or environmental variables
$ g=1,2,\dots, G $
is an index for environmental variables. The variation of the technical efficiency measures is then associated with exogenous or environmental variables
 $ {Z}_g $
, indicating
$ {Z}_g $
, indicating
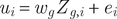 $ {u}_i={w}_g{Z}_{g,i}+{e}_i $
with
$ {u}_i={w}_g{Z}_{g,i}+{e}_i $
with
 $ {w}_g $
a vector of parameters to be estimated and
$ {w}_g $
a vector of parameters to be estimated and
 $ {e}_i $
accounts for statistical noise which is normally distributed with mean zero and variance
$ {e}_i $
accounts for statistical noise which is normally distributed with mean zero and variance
 $ {\sigma}_e^2 $
. The inefficiency term
$ {\sigma}_e^2 $
. The inefficiency term
 $ {u}_i=-\ln \left({TE}_i\right) $
– with
$ {u}_i=-\ln \left({TE}_i\right) $
– with
 $ TE $
representing technical efficiency – is non-negative, truncated from below at zero and is assumed to be independent of
$ TE $
representing technical efficiency – is non-negative, truncated from below at zero and is assumed to be independent of
 $ {v}_i $
. Terms involving
$ {v}_i $
. Terms involving
 $ {Y}_m^{\ast } $
in the above expression are over
$ {Y}_m^{\ast } $
in the above expression are over
 $ M-1 $
and not over
$ M-1 $
and not over
 $ M $
to avoid a value of one for this ratio and zero for its logarithm. Restrictions required for symmetry is imposed to the second order parameters that is
$ M $
to avoid a value of one for this ratio and zero for its logarithm. Restrictions required for symmetry is imposed to the second order parameters that is
 $ {\alpha}_{ks}={\alpha}_{sk} $
and
$ {\alpha}_{ks}={\alpha}_{sk} $
and
 $ {\beta}_{mj}={\beta}_{jm} $
(Young’s theorem). Parameters are estimated using maximum likelihood estimation techniques.
$ {\beta}_{mj}={\beta}_{jm} $
(Young’s theorem). Parameters are estimated using maximum likelihood estimation techniques.
The Translog specification is more preferred in the literature since this functional form is flexible, is easy to calculate and enables cross-effects between inputs and outputs (substitutability) as well as the imposition of homogeneity (e.g., Färe et al., Reference Färe, Grosskopf, Norris and Zhang1994; Singbo et al., Reference Singbo, Emvalomatis and Oude Lansink2021). This is a generalization of the well-known Translog functional form which utilizes the transformation proposed by Battese (Reference Battese1997) for the zero variables, thus overcoming some undesirable properties of the Translog for the case of multiproduct and multi-input (Singbo et al., Reference Singbo, Larue and Tamini2020). In estimating the Translog and the Cobb–Douglas functional forms, one needs to transform each included output and input variables into their respective logarithm to properly estimate the production functions. However, it is not possible to compute the logarithm for zero values. In this respect and to cope with the number of zero observations for some inputs
 $ X $
and outputs
$ X $
and outputs
 $ Y $
to consistently estimate the production functions, Battese (Reference Battese1997) has developed a consistent technique that has been used in other studies (e.g., Tsekouras et al., Reference Tsekouras, Pantzios and Karagiannis2004; Singbo et al., Reference Singbo, Emvalomatis and Oude Lansink2021). In the dryland system, zero observations for some inputs especially for fertilizer are structurally meaningful. For instance, farmers using fertilizer may differ from non-users in terms of their level of productivity. It is then empirically consistent to consider this choice in the production function since the level of the constant for the two categories of farmers may be different. In the above specification (Equation 11),
$ Y $
to consistently estimate the production functions, Battese (Reference Battese1997) has developed a consistent technique that has been used in other studies (e.g., Tsekouras et al., Reference Tsekouras, Pantzios and Karagiannis2004; Singbo et al., Reference Singbo, Emvalomatis and Oude Lansink2021). In the dryland system, zero observations for some inputs especially for fertilizer are structurally meaningful. For instance, farmers using fertilizer may differ from non-users in terms of their level of productivity. It is then empirically consistent to consider this choice in the production function since the level of the constant for the two categories of farmers may be different. In the above specification (Equation 11),
 $ {D}_1 $
is a dummy variable for vegetable production with
$ {D}_1 $
is a dummy variable for vegetable production with
 $ {D}_1=1 $
if
$ {D}_1=1 $
if
 $ \mathrm{Vegetable}\ \mathrm{output}\ \mathrm{quantity}=0 $
and
$ \mathrm{Vegetable}\ \mathrm{output}\ \mathrm{quantity}=0 $
and
 $ {D}_1=0 $
if
$ {D}_1=0 $
if
 $ \mathrm{Vegetable}\ \mathrm{output}\ \mathrm{quantity}>0 $
; and
$ \mathrm{Vegetable}\ \mathrm{output}\ \mathrm{quantity}>0 $
; and
 $ \mathrm{Vegetable}\ \mathrm{output}\ \mathrm{quantity}\mathrm{included}\ \mathrm{in}\ \mathrm{the}\ \mathrm{estimation}=\operatorname{Max}\left(\mathrm{Vegetable}\ \mathrm{output}\ \mathrm{quantity},{D}_1\right) $
. Similarly,
$ \mathrm{Vegetable}\ \mathrm{output}\ \mathrm{quantity}\mathrm{included}\ \mathrm{in}\ \mathrm{the}\ \mathrm{estimation}=\operatorname{Max}\left(\mathrm{Vegetable}\ \mathrm{output}\ \mathrm{quantity},{D}_1\right) $
. Similarly,
 $ {D}_2 $
is a dummy variable for fertilizer quantity with
$ {D}_2 $
is a dummy variable for fertilizer quantity with
 $ {D}_2=1 $
if
$ {D}_2=1 $
if
 $ \mathrm{Fertilizer}\ \mathrm{quantity}=0 $
and
$ \mathrm{Fertilizer}\ \mathrm{quantity}=0 $
and
 $ {D}_2=0 $
if
$ {D}_2=0 $
if
 $ \mathrm{Fertilizer}\ \mathrm{quantity}>0 $
; and
$ \mathrm{Fertilizer}\ \mathrm{quantity}>0 $
; and
 $ \mathrm{Fertlizer}\ \mathrm{quantity}\ \mathrm{in}\mathrm{cluded}\ \mathrm{in}\ \mathrm{the}\ \mathrm{estimation}=\operatorname{Max}\mathrm{Fertlizer}\mathrm{quantity},{D}_2 $
. The environmental factors
$ \mathrm{Fertlizer}\ \mathrm{quantity}\ \mathrm{in}\mathrm{cluded}\ \mathrm{in}\ \mathrm{the}\ \mathrm{estimation}=\operatorname{Max}\mathrm{Fertlizer}\mathrm{quantity},{D}_2 $
. The environmental factors
 $ (Z) $
include socio-demographic characteristics of famers or farmer-specific factors (household size, gender, age, marital status) to investigate the sources of variation for country-specific technical efficiency measures and institutional factors (credit, agricultural cooperative, extension services and distance to outputs market) to analyze the sources of variation for the metafrontier technical efficiency measures.
$ (Z) $
include socio-demographic characteristics of famers or farmer-specific factors (household size, gender, age, marital status) to investigate the sources of variation for country-specific technical efficiency measures and institutional factors (credit, agricultural cooperative, extension services and distance to outputs market) to analyze the sources of variation for the metafrontier technical efficiency measures.
Data and descriptive statistics
Study areas
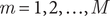
This study was conducted in the northern Ghana, the southern Mali and the northern Nigeria regions, which are part of the dryland’s regions of West Africa. As shown in Figure 2, dryland regions – defined to include arid, semi-arid, dry sub-humid and wet sub-humid zones – make up 43% of Africa’s land surface, account for 75% of the area used for agriculture, and are home to 50% of the population, including a disproportionate share of the poor (Walker et al., Reference Walker, Hash, Rattunde and Weltzien2016). Mali, Ghana and Nigeria are among West African countries having a large dryland region (Li et al., Reference Li, Diop, Hirwa, Maesho, Ning, Tian, Qiao, Faye, Cissé, Guisse, Leng, Peng and Chen2024). The West African drylands cover 6.8 million km2 (53% of West Africa), including 2.1 million km2 arid. The major land uses are grassland 12%, wooded 24%, crops 8%, “Barren land” 51%, urban <1% (GCA, 2019).
Drylands areas in Africa. Sources: IPCC (2019).

Data sources
The data used come from a rich baseline survey conducted in 2011 and 2012Footnote 10 by the International Crops Research Institute for the Semi-Arid Tropics (ICRISAT) one of the sixteen Consultative Group on International Agricultural Research (CGIAR) in the framework of the Dryland Systems Collaborative Research Program (DSCRP). This research program aims at achieving sustainable agricultural intensification and vulnerability reduction in farming systems. Based on key criteria,Footnote 11 the CGIAR research centers and partners have defined representative action sites which include in West Africa the Kano-Katsina-Maradi Transect in Nigeria and Niger, Wa-Bobo-Sikasso Transect in Ghana, Burkina Faso and Mali as well as Tolon-K and Cinzana along the West African Sahel and dryland savannas in Ghana and Mali.
The farm-level data were collected in three West African dryland countries of Ghana, Mali and Nigeria. For each randomly selected farm, an extensive body of information on disaggregate sources of revenue and cost and on the physical and financial structure of the farm was collected. A typical production plan includes cereal, cotton and vegetable production, livestock production associated with farm size. For these production processes, the data provide a detailed breakdown of revenue and expenditures. For most items, both price and quantity information are available and help to computing implicit prices. The resulting farm sample comprises a total of 455 farms with 50 farms in Ghana, 91 farms in Mali and 314 farms in Nigeria. This distribution reflects the relative availability and accessibility of farm-level data across the three countries, ensuring sufficient representation to capture variations in farm practices, technology adoption and efficiency levels.
Model specification
Various specification tests of hypotheses regarding the parameters in the frontier and inefficiency model were performed using the generalized likelihood ratio (LR) test statistic.Footnote
12 These tests examined the functional form of the production function, the assumption of homogeneous technology across countries, and the presence of inefficiency effects. For the choice of the functional form, the null hypothesis was that the coefficients of the interaction terms in the Translog production function are zero (i.e.,
 $ {H}_0:{\beta}_{mj}=0 $
), implying that the Cobb–Douglas production function provides the most appropriate specification. The generalized likelihood ratio test rejected the null hypothesis for the three countries (Ghana: LR chi2 = 36.20 and p = 0.0208; Mali: LR chi2 = 45.35 and p = 0.0016; Nigeria: LR chi2 = 186.06 and p = 0.0000; Pooled: LR chi2 = 46.03 and p = 0.0013), implying that the Translog functional form (i.e., including additional variables) was the most appropriate for each country, notably Ghana, Mali and Nigeria in that order, as well as for the pooled sample.
$ {H}_0:{\beta}_{mj}=0 $
), implying that the Cobb–Douglas production function provides the most appropriate specification. The generalized likelihood ratio test rejected the null hypothesis for the three countries (Ghana: LR chi2 = 36.20 and p = 0.0208; Mali: LR chi2 = 45.35 and p = 0.0016; Nigeria: LR chi2 = 186.06 and p = 0.0000; Pooled: LR chi2 = 46.03 and p = 0.0013), implying that the Translog functional form (i.e., including additional variables) was the most appropriate for each country, notably Ghana, Mali and Nigeria in that order, as well as for the pooled sample.
The second hypothesis tested for the presence of inefficiency effects in country models, as well as in the pooled model. The null hypothesis for absence of technical inefficiency was stated as H
0:
 $ \gamma ={\sigma}_u^2/\left({\sigma}_u^2+{\sigma}_v^2\right)=0 $
or
$ \gamma ={\sigma}_u^2/\left({\sigma}_u^2+{\sigma}_v^2\right)=0 $
or
 $ {\sigma}_u^2 $
= 0 and implies that the
$ {\sigma}_u^2 $
= 0 and implies that the
 $ {u}_i $
term should be removed from the model, which can be consistently estimated using ordinary least squares (OLS). The generalized likelihood ratio test could not sustain the null hypothesis (Ghana: p > = chibar2 = 1.000; Mali: Prob > = chibar2 = 1.000; Nigeria: p > = chibar2 = 0.000; Pooled: p > = chibar2 = 0.004), implying the presence of inefficiency effects in each country and pooled models.
$ {u}_i $
term should be removed from the model, which can be consistently estimated using ordinary least squares (OLS). The generalized likelihood ratio test could not sustain the null hypothesis (Ghana: p > = chibar2 = 1.000; Mali: Prob > = chibar2 = 1.000; Nigeria: p > = chibar2 = 0.000; Pooled: p > = chibar2 = 0.004), implying the presence of inefficiency effects in each country and pooled models.
The final hypothesis tested whether the three countries operated the same production technology. The generalized likelihood ratio test rejected the null hypothesis (H0) of homogeneous or identical production technology between the three countries (LR chi2 = 481.28 and p = 0.0000). This implies that the stochastic frontier for pooled model would not be appropriate to compare the technical efficiencies of the three countries, justifying the choice of metafrontier approach.
Variable definition and descriptive statistics
For the purpose of estimating the output distance function, the production of the sample farms is aggregated into two outputs as cereal crops and vegetable products. The input variablesFootnote
13 include labor, land, fertilizer, capital and livestock. For each of the three countries, we constructed the price indexes for the outputs and inputs using the multilateral Törnqvist price index proposed by Caves et al. (Reference Caves, Christensen and Diewert1982). This procedure compares the price faced by firm
 $ k $
to the geometric mean of prices (Mosheim and Lovell, Reference Mosheim and Lovell2009):
$ k $
to the geometric mean of prices (Mosheim and Lovell, Reference Mosheim and Lovell2009):
 $$ \ln {P}_k^{CCD}=\frac{1}{2}\sum \limits_{i=1}^N\left({\omega}_{ik}+{\overline{\omega}}_i\right)\left(\ln {p}_{ik}-\overline{\ln {p}_i}\right) $$
where
 $ k=1,2,\dots, N $
, are the number of farms,
$ k=1,2,\dots, N $
, are the number of farms,
 $ i=1,2,\dots, M $
, are the number of commodities;
$ i=1,2,\dots, M $
, are the number of commodities;
 $ {\omega}_{ik}=\frac{p_{ik}{q}_{ik}}{\sum_{i=1}^M{p}_{ik}{q}_{ik}} $
is the value of the
$ {\omega}_{ik}=\frac{p_{ik}{q}_{ik}}{\sum_{i=1}^M{p}_{ik}{q}_{ik}} $
is the value of the
 $ i $
th commodity for the
$ i $
th commodity for the
 $ k $
th farm and
$ k $
th farm and
 $ {\overline{\omega}}_i=\frac{1}{N}\sum \limits_{k=1}^N{\overline{\omega}}_{ik} $
and
$ {\overline{\omega}}_i=\frac{1}{N}\sum \limits_{k=1}^N{\overline{\omega}}_{ik} $
and
 $ \overline{\ln {p}_i}=\frac{1}{N}\sum \limits_{k=1}^N\ln {p}_{ik} $
.
$ \overline{\ln {p}_i}=\frac{1}{N}\sum \limits_{k=1}^N\ln {p}_{ik} $
.
Thus, we constructed an implicit cereal quantity index
 $ {y}_1 $
by dividing total cereal revenues by a price index
$ {y}_1 $
by dividing total cereal revenues by a price index
 $ {p}_1 $
, using price available in the data set. In a similar fashion, we constructed a vegetable quantity index
$ {p}_1 $
, using price available in the data set. In a similar fashion, we constructed a vegetable quantity index
 $ {y}_2 $
using prices available from the data set and by deflating total vegetable revenue by the obtained Törnqvist price index. The number of livestock is converted in Tropical Livestock Units (TLU), where a coefficient of 1 is assigned to draft cattle, 0.7 to other cattle, 1 to horses, 0.5 to donkeys, 0.2 to pigs, 0.1 to goats/sheep and 0.01 to poultry. The farm size is the total area of cultivated land or productive land in hectare. The number of farm workers is determined by assigning values between 0 and 1.2 as Full-Time Equivalent worker units to each household member according to its age. For example, a household member is considered as 0.25 worker when being between 7 and 14 years, while he/she will be taken as 1, 0.5, 0 worker, when being, respectively, between 15 and 65 years, greater than 65 years and lower than 7 years. Capital consists of agricultural machinery and equipment and is assessed in terms of total asset value. Like all other monetary values, capital value is also converted in US dollars purchase power parity (PPS).
$ {y}_2 $
using prices available from the data set and by deflating total vegetable revenue by the obtained Törnqvist price index. The number of livestock is converted in Tropical Livestock Units (TLU), where a coefficient of 1 is assigned to draft cattle, 0.7 to other cattle, 1 to horses, 0.5 to donkeys, 0.2 to pigs, 0.1 to goats/sheep and 0.01 to poultry. The farm size is the total area of cultivated land or productive land in hectare. The number of farm workers is determined by assigning values between 0 and 1.2 as Full-Time Equivalent worker units to each household member according to its age. For example, a household member is considered as 0.25 worker when being between 7 and 14 years, while he/she will be taken as 1, 0.5, 0 worker, when being, respectively, between 15 and 65 years, greater than 65 years and lower than 7 years. Capital consists of agricultural machinery and equipment and is assessed in terms of total asset value. Like all other monetary values, capital value is also converted in US dollars purchase power parity (PPS).
Prior to estimation, all output and input variables are normalized to their geometric mean. Appendix 2 presents the summary statistics and their comparison across the three countries. In addition to the production variables, farmer socio-economic characteristics and institutional factors are also included in the estimations as the determinants of technical inefficiency in the first step estimation of the country-frontiers and second step estimation of the metafrontier, respectively. Following Singbo et al. (Reference Singbo, Oude and Emvalomatis2014) and Singbo and Oude Lansink (Reference Singbo and Oude Lansink2010), eight socio-economic and institutional variables are considered, namely, household size, gender of the household head, age of the household head, marital status as the determinants of country-specific technical efficiency (first-step); access to credit, membership in agricultural cooperatives or farmer organization, access to extension service and distance to the output marketFootnote 14 as the determinants of the metafrontier technical efficiency (second step). These environmental variables have been also used in estimating production efficiency for developing countries in Africa (Dogba et al., Reference Dogba, Kosura and Chumo2021; Miriti et al., Reference Miriti, Otieno, Chimoita, Bikketi, Njuguna and Ojiewo2021; Missiame et al., Reference Missiame, Nyikal and Irungu2021). Household size: it is a major source of labor, and larger households contribute to a higher technical efficiency (Dogba et al., Reference Dogba, Kosura and Chumo2021). On the other hand, Miriti et al. (Reference Miriti, Otieno, Chimoita, Bikketi, Njuguna and Ojiewo2021) indicated that an increase in the household size increases expenditure that the household incurs, thus there might be little, or no resources, left to invest in farms, thus reducing the farmer’s efficiency level. Therefore, a mixed sign is expected. Gender: A mixed sign is expected. In fact, Dogba et al. (Reference Dogba, Kosura and Chumo2021) found a negative influence of Gender (1 = Female) in Bomi region (Liberia), while its positive influence was observed on the metatechnical efficiency. As mentioned in Missiame et al. (Reference Missiame, Nyikal and Irungu2021), differences in resource endowments could be the reason why female-managed farms were less efficient than male-managed farms. Age of producer: age of producer is considered as the number of years and is supposed to have a positive influence on technical efficiency. In principle, older farmers are more efficient due to experience gained and networks they can exploit to produce more output (Miriti et al., Reference Miriti, Otieno, Chimoita, Bikketi, Njuguna and Ojiewo2021). However, older farmers may lack up to date technology, machinery, equipment or structures (Singbo and Oude Lansink, Reference Singbo and Oude Lansink2010).
Marital status: the effect of marital status is mixed and difficult to predict. For instance, married women are known to be responsible for many intrahousehold activities (cooking, fetching and carrying water, etc.), which decrease their efficiency. In contrast, older married women tend to have more family labor at their disposal, which is expected to increase their efficiency. Thus, this variable could have either a positive or negative effect on farmers’ efficiency (Singbo and Oude Lansink, Reference Singbo and Oude Lansink2010). Access to credit is supposed to have a positive influence on efficiency. Indeed, access to credit improves the possibility of acquiring input faster and paying for required production resources (Adegbola and Gardebroek, Reference Adegbola and Gardebroek2007). Member to farmers’ cooperative or organization: Farmers’ cooperatives are useful avenues for learning and sharing of skills that possibly increase farmers’ capacity to adopt more advanced technology and take advantage of productivity-enhancing practices (Gong et al., Reference Gong, Battese and Villano2019; Miriti et al., Reference Miriti, Otieno, Chimoita, Bikketi, Njuguna and Ojiewo2021). Thus, a positive influence on technical efficiency is expected. Contact with extension services is supposed to influence positively technical efficiency since extension services strengthen their human capital. Such contacts may engender a positive attitude among farmers toward the adoption of improved technologies, which may enhance the managerial performance (Adegbola and Gardebroek, Reference Adegbola and Gardebroek2007). Distance to the output market: the proximity to output market is supposed to improve technical efficiency. A positive sign is expected for this variable since proximity to output market can positively influence efficiency (Fafchamps and Hill, Reference Fafchamps and Hill2005; Das et al., Reference Das, Kumar and Ganga Rao2023).
Descriptive statistics of variables for the three country-specific farming systems is presented in Appendix 2. These statistics indicate that there were considerable differences within and among the three farming systems in terms of the means and standard deviations of the outputs and inputs. On average, farmers in Ghana achieve higher outputs than those in Nigeria and Mali. The largest farm size is observed in Mali followed by Nigeria and Ghana. Labor input has the highest value in Mali, then Nigeria and Ghana. The highest investment in capital use is noted in Nigeria compared to Mali and Ghana successively. Farms in Mali have more livestock TLU than those of Nigeria and Ghana.
Regarding farmers’ characteristics, farming system in these countries is dominated by men (at least 80% of farms). Overall, the average age of farmers is 49 years. The mean household size is 9 persons on average. Most farmers are married (at least 65% of the households’ heads). In terms of institutional factors, on average, farmers in Ghana are relatively closer to output markets compared to farmers in Mali and Nigeria; 93.4% of farmers are members of agricultural cooperatives in Mali against 56% in Ghana and only 3% in Nigeria. Farmers have more access to agricultural extension services in Mali (75.8%) followed by Nigeria (51.9%) and only 14% in Ghana.
Empirical results and discussion
Country-specific technical efficiency
The Translog output distance stochastic frontier analysis estimates of the parameters for each of the three countries are presented in the table in Appendix 3.Footnote 15 Results show that vegetable output influenced negatively the cereal output in Ghana and Nigeria. A negative and significant influence was also noted for its corresponding dummy (1 = No vegetable) in all countries, indicating that farmers who do not produce vegetable tend to produce more cereal (substitution effect). Capital and fertilizer had a positive and significant influence on the cereal output in Mali and Nigeria at 1% and 10%, respectively. This result aligns with Mekonnen et al. (Reference Mekonnen, Spielman, Fonsah and Dorfman2015) and Mensah and Brümmer (Reference Mensah and Brümmer2016) who found a positive and significant effect of fertilizer on agricultural output. The cereal output is negatively influenced by the quantity of TLU livestock when considering Ghana, whereas the significant influence is positive in Mali.
The labor input had a negative and significant influence at 5% on the cereal output in Mali. Unlike our results, those of Mekonnen et al. (Reference Mekonnen, Spielman, Fonsah and Dorfman2015) and Mensah and Brümmer (Reference Mensah and Brümmer2016) found a positive influence of this input on agricultural output. Our result implies that labor cannot easily adjust to output level in Mali. Like most countries in SSA, the labor market is constrained, especially in rural areas where workers have a limited set of alternatives to remunerate their labor. In addition, neither hired and family labor nor the labor inputs of different family members are perfectly substitutable in agricultural production. In many non-parametric estimations, labor is assumed to be a quasi-fixed input because a large share of total labor consisted of family labor (Singbo and Oude Lansink, Reference Singbo and Oude Lansink2010). The cultivated land area had a negative and significant influence on the cereal output in Mali and Nigeria. This implies a decreasing marginal productivity in both countries. This can be explained by the fact that these countries face population pressure on potential agricultural land. In contrast, Mekonnen et al. (Reference Mekonnen, Spielman, Fonsah and Dorfman2015) found a positive influence of arable land area on agricultural output.
In addition, results of the determinants of variation in technical efficiency of farmersFootnote 16 indicate that an increase of the household size leads to an improvement of the technical efficiency in Nigeria. This finding is consistent with that of Missiame et al. (Reference Missiame, Nyikal and Irungu2021) and Dogba et al. (Reference Dogba, Kosura and Chumo2021), who found that household size improves technical efficiency of cassava farmers. This confirms the theories arguing a positive relationship between household size and agricultural production. On the contrary, Miriti et al. (Reference Miriti, Otieno, Chimoita, Bikketi, Njuguna and Ojiewo2021) found a negative influence of household size on efficiency. In addition, married households head were more efficient than their non-married counterparts when considering the pooled data.
Meta-technical efficiency and technology gap ratios
Parameter estimates of the output distance stochastic metafrontier
As farmers in each country are assumed to operate using different technology, the estimated parameters of the Translog output distance stochastic metafrontier technique are presented in the table in Appendix 4. Like the country-specific frontier, the metaproduction is negatively and significantly influenced at 1% by vegetable output and its corresponding dummy (1 = No vegetable). Regarding inputs, capital, fertilizer, labor and the dummy fertilizer (1 = No fertilizer) had a positive and significance influence on the metaproduction of cereal, while the significant influence of cultivated area and livestock are negative at 1%.
Institutional exogenous factors influencing significantly the metafrontier were credit, cooperative membership and distance to outputs market. At 5% level, access to credit improved the metatechnical efficiency of cereal output, whereas the proximity to outputs market and being member of cooperative (1 = Member) reduced it. This result is supported by Dogba et al. (Reference Dogba, Kosura and Chumo2021), who found that access to credit improves metatechnical efficiency of casava farmers in Liberia. On the contrary, Miriti et al. (Reference Miriti, Otieno, Chimoita, Bikketi, Njuguna and Ojiewo2021) observed a negative effect of access to credit on farmers’ technical efficiency in Uganda. As mentioned by Miriti et al. (Reference Miriti, Otieno, Chimoita, Bikketi, Njuguna and Ojiewo2021), our result regarding distance to market can be explained by the fact that a longer distance indicates the possibility of farmers leasing in land for crops cultivation as well as having many scattered plots. Such farmers tend to be commercially oriented, and they tend to use various farm inputs more efficiently, thus leading to an increase in technical efficiency. This finding is not consistent with that of Missiame et al. (Reference Missiame, Nyikal and Irungu2021) who found that proximity to market centers significantly improved the technical efficiency of maize farmers in Ethiopia. Considering the cooperative membership, there is mixed literature. Indeed, Adjin and Henning (Reference Adjin and Henning2020) observed significant differences in metatechnical efficiency in favor of non-members. However, Gong et al. (Reference Gong, Battese and Villano2019) and Miriti et al. (Reference Miriti, Otieno, Chimoita, Bikketi, Njuguna and Ojiewo2021) found that member farms had the highest technical efficiency compared to non-member farms.
Elasticities, monotonicity and returns to scale
Estimated coefficients in Appendices 3 and 4 are used to compute the input elasticities and are summarized in Table 1. Considering Young theorem and that inputs are measured relative to their geometric means, the Translog production functional form of input elasticities at the means (partial elasticities) would simply be the sum of input coefficients. The elasticity of output with respect to capital is positive in Ghana and Nigeria but negative in Mali. The output elasticity for fertilizer and the output elasticity for labor are positive for all countries. The livestock elasticity of output is negative in Ghana and Nigeria but positive in Mali. The elasticity of output with respect to land is positive in Ghana but negative in Mali and Nigeria. As indicated by Miriti et al. (Reference Miriti, Otieno, Chimoita, Bikketi, Njuguna and Ojiewo2021), the negative influence of the cultivated land area might indicate that output depends more on how well the land area is used rather than the amount of land in hectare. It could also be due to the difficulty of managing or monitoring large land area, thus decreasing efficiency compared to small land area.
Elasticities of output distance function at sample mean and monotonicity

Note: The “+” and “−” denote the scale elasticity for data points that are larger and smaller than one in absolute value.
*** p < 0.01 or significant at 99% confidence level.
The test for returns to scale (H0: constant returns to scale, i.e., scale elasticityFootnote 17 = 1) indicates that, on average, Ghana farmers exhibit a constant return to scale (CRS) technology as the underlying mean does not differ from 1. But returns to scale for Mali and Nigeria as well as for the Metafrontier exhibit a variable return to scale (VRS) since the underlying means are different from 1. It can be noted that monotonicity fails for the five inputs in all countries and for the metafrontier. Still Table 1 shows that sample farms across countries operate at different technological levels. Indeed, Ghana farmers adopt IRSFootnote 18 or DRS in the same proportion of 50%. Mali farmers are inclined to operate on IRS technology (with only 13.18% exception), meaning their productivity can be improved by a larger percentage than the percentage increase in all inputs. Nigeria farmers are inclined to operate at a DRS technology (with only a 4.77% exception), meaning their productivity can be increased by a smaller percentage as the inputs. These results support previous studies in drylands of Africa that concluded that there are increasing and/or decreasing scale economics in the agricultural production (Mensah and Brümmer, Reference Mensah and Brümmer2016; Aminu et al., Reference Aminu, Ayinde and Sanusi2020; Miriti et al., Reference Miriti, Otieno, Chimoita, Bikketi, Njuguna and Ojiewo2021).
Technical efficiency and metatechnology ratio measures
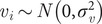
Table 2 presents the summary of estimates of country-specific technical efficiency (TE), the metafrontier technical efficiency (MTE) and the metatechnology ratio (MTR) also called technology gap ratio (TGR) derived from the estimated stochastic frontiers. Figure 3 shows their distributions across countries.
Summary of technical efficiencies and metatechnology ratio (MTR)

*** p < 0.01 or significant at 99 percent confidence level.
Distribution of TE, MTE and MTR/TGR of the three countries.

The MTR values capture the average performance shortfall because of the technology gap facing each country when their performance is compared with the dryland metafrontier. A higher MTR (with the maximum equals to one) indicates a smaller technology gap between the country frontier and the metafrontier and vice versa. If, for a country, MTR = 1, it means this country frontier is tangent to the metafrontier, at least at one point (Gong et al., Reference Gong, Battese and Villano2019). The average MTRs were 0.29, 0.57 and 0.80 for Ghana, Mali and Nigeria, respectively, meaning that, on average, farmers produce 29%, 57% and 80% of their potential outputs with their existing production technologies, respectively. Consequently, on average, Nigeria is more productive (51% and 23% percentage points) than Ghana and Mali, respectively. This further implies that if all factors are held constant, farmers in Nigeria will reach the maximum potential output for agricultural production in the dryland farming system of West Africa faster than other countries. Aminu et al. (Reference Aminu, Ayinde and Sanusi2020) found values of 0.87, 0.77 and 0.64 for Ghana, Nigeria and Benin, respectively.
The average technical efficiency score relative to the metafrontier (MTEs) are 0.28, 0.46 and 0.64 for Ghana, Mali and Nigeria, respectively. This implies that the metatechnical efficiency of Nigeria is the highest among the three countries, whereas the meta-efficiency of Ghana is the lowest. Still in West Africa, Aminu et al. (Reference Aminu, Ayinde and Sanusi2020) found values of 0.87, 0.70 and 0.52 for Nigeria, Ghana and Benin, respectively.
The average TE with respect to the country-specific frontiers was 0.78, 0.79 and 0.96, respectively, for Mali, Nigeria and Ghana. This indicates that all countries have the potential to raise their output under their given production technologies. By eliminating the inefficiency sources, farmers of these countries could possibly increase their output by 22%, 21% and 4%, respectively. This result aligns with the finding of Diamoutene et al. (Reference Diamoutene, Diakite and Coulibaly2018), who found that the average TE score for sorghum producers is 0.67 in Mali. Aminu et al. (Reference Aminu, Ayinde and Sanusi2020) found values of 0.89, 0.80 and 0.75 for Nigeria, Ghana and Benin, respectively.
Even though Ghana farmers achieved a high average output performance of 96% with respect to their own country frontier, their managerial performance still lags the potential overall performance, with a technology gap of 70.1% (versus 42.5% and 19.4% for Mali and Nigeria, respectively). The mean TE is greater than the mean MTR in Ghana and Mali, indicating that the production inefficiency in both countries with respect to the metafrontier comes mainly from technology gap, rather than operating (production) inefficiency. On the contrary, in Nigeria, the inefficiency comes primarily from operating inefficiency than technology gap since the mean TE is smaller than the mean MTR.
The distribution of TEs, MTRs and MTEs is illustrated using the kernel density plots. As depicted in Figure 3, most farmers in Ghana (94%), Nigeria (58%) and Mali (55%) had a technical efficiency (TE) greater or equal to 0.8, showing a right-side skewness distribution. The MTRs of famers in Nigeria (58.6%) and Mali (37.4%) were concentrated between 0.8 and 1, while majority of farmers in Ghana (34%) were in the range from 0.2 to 0.4.
Conclusions and policy implications
Productivity performance in the agricultural sector is critical to improvement in overall economic well-being and can offer good opportunities for food security and poverty reduction in the dryland region of Sub-Saharan Africa. This paper applies the output distance stochastic metafrontier approach to analyze regional differences in technical efficiencies of farms across three semi-arid dryland countries of West Africa, namely, Ghana, Nigeria and Mali. Unlike standard frontier approach, the metafrontier approach helps to consider the observed inter-country production heterogeneity in the dryland farming systems. The output distance function considers the dynamics of multiple output and multiple input setting, which is the case of farming system in the dryland zone. The paper also investigates exogenous factors that influence variations in country-specific and the dryland metafrontier technical efficiencies. The data set comes from a rich baseline survey conducted by the International Crops Research Institute for the Semi-Arid Tropics (ICRISAT) under a research program that aims at achieving sustainable agricultural intensification and vulnerability reduction in farming systems.
The first step results show average metafrontier technical efficiencies (MTE) of 0.28, 0.46 and 0.64 for farmers in Ghana, Mali and Nigeria, respectively. The corresponding metatechnology ratios (MTR/TGR) are 0.29, 0.57 and 0.80. The mean MTE for farmers in Ghana is lower than that in Mali and for Mali’s mean is lower than for Nigeria’s, indicating that Ghanaian farmers are technically inefficient than Malian farmers and both are technically inefficient than Nigerian farmers. Similarly, the mean MTR is lower in Ghana than for both Mali and Nigeria, implying that Ghanaian farmers are far below the metafrontier.
Average technical efficiencies (TE) are 0.96, 0.78 and 0.79 for Ghana, Mali and Nigeria, respectively, indicating suboptimal use of available production technology and possible managerial economic performance improvements. The fact that the mean TE is greater than the mean MTR in Ghana and Mali shows that the production inefficiency in the two countries with respect to the metafrontier comes mainly from technology gap, rather than operating inefficiency. In Nigeria, the inefficiency with respect to the metafrontier comes primarily from operating inefficiency than technology gap as the mean TE is smaller than the mean MTR.
To address the issue of why inefficiency is so pervasive, the second results show that variation in country-specific TE (intra-country TE) and variation in the metafrontier TE (inter-country TE) are explained by socioeconomic factors, such as household size, access to credit and distance to output market. This study shows that there is economic and food security gain in enhancing farmer managerial performance strategies in the dryland zone.
Policy implications and recommendations
According to our findings, it is crucial for policy makers to reduce the gap and help farmers achieve highest possible output on the metafrontier. Since the inefficiency in Ghana and Mali comes mainly from the technology gap, policy makers may help farmers in Ghana and Mali to improve their knowledge about highly productive technologies, to invest more in research to develop new technologies and especially to adapt Nigerian improved technology and practices to increase their efficiency. In Nigeria, improving the managerial skills (better management) and technical capacity of farmers using available resources can be useful as the inefficiency comes primarily from operating inefficiency.
To address the significant inefficiency sources, the study recommends improving access to credit toward innovative and tailored credit (e.g., insurance, formalization of existing local forms of credit), better targeting by financial institutions, continuous monitoring to ensure an appropriate use of the credit.
Limitation and future research
Even though our analysis has provided some insights into the levels and sources of inefficiencies of farmers in some countries of drylands in West Africa, it is necessary that future research in the study areas considers the climate change among the environmental variables. In addition, it might be interesting to see the dynamics of the findings using a panel data.
Open peer review
For open peer review materials, please visit http://doi.org/10.1017/dry.2026.10033.
Supplementary material
The supplementary material for this article can be found at http://doi.org/10.1017/dry.2026.10033.
Data availability statement
Data will be made available by the corresponding author, upon reasonable request.
Acknowledgements
The authors thank the coordinator of the collaborative research of dryland system (CRP-DS) for making their baseline data available. They also thank the International Research Institute for the Semi-Arid Tropics (ICRISAT), especially Cynthia Bantilan, former Research Program Director-Markets, Institutions and Policies for allowing this study to be undertaken.
Author contribution
Conceptualization: A.S., A.B.; Data analysis and writing: A.B.; Data collection and first version writing: P.S.T.; Data curation: A.S., R.A.; Formal analysis: A.S., R.A., P.C.K.; Methodology: A.S., R.A.; Software: A.S., R.A.; Validation: A.S., R.A.; Writing – original draft: A.S., R.A., P.C.K.; Writing – review and editing: A.S. All authors contributed to the article and approved the submitted version.
Financial support
The authors acknowledge funding from Bill & Melinda Gates Foundation through the project “Harnessing Opportunities for Productivity Enhancement (HOPE)” to the International Crops Research Institute for the Semi-Arid Tropics (ICRISAT).
Competing interests
The authors have no competing interests to declare.


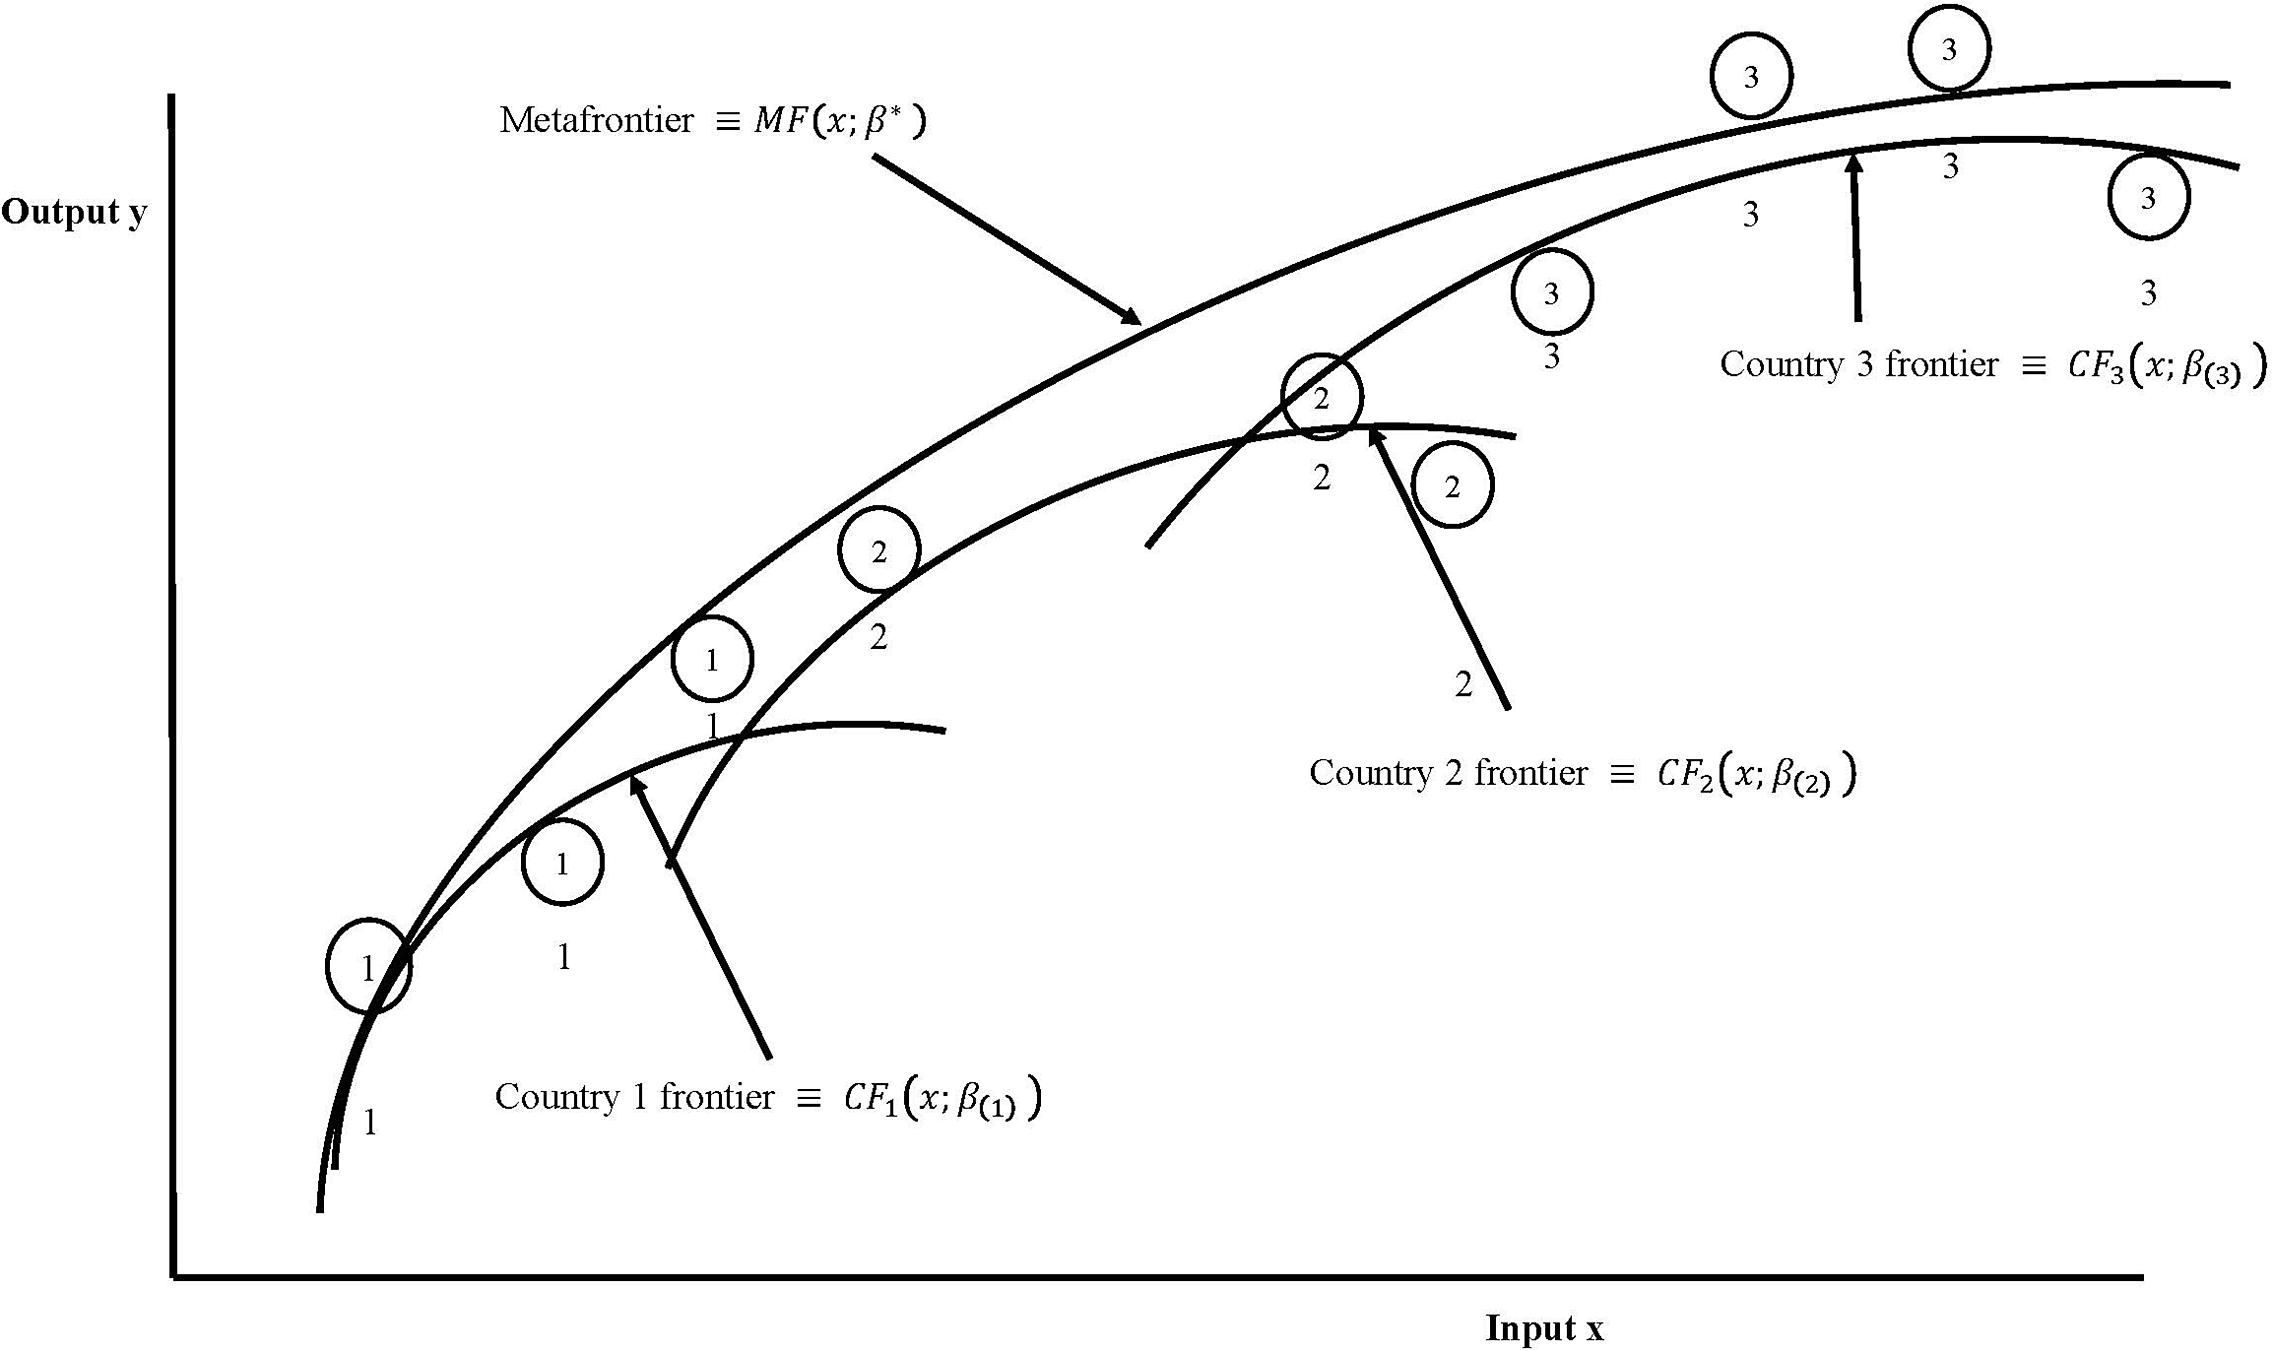


 Open access
Comments
September 12, 2025
Editor, Cambridge Prisms: Drylands
R.E.: Submission of manuscript entitled “Regional Differences of Technical Efficiencies of Farmers in West African Drylands: A Stochastic Output Distance Metafrontier Approach” for publication in Cambridge Prisms: Drylands.
My co‐authors, Mr. Raoul Adéguélou, Dr. Alice Bonou, Dr. Pierre Sibiry Traoré, Dr. Patrice Kpadé, and I would like you to consider for publication our manuscript entitled “Regional Differences of Technical Efficiencies of Farmers in West African Drylands: A Stochastic Output Distance Metafrontier Approach” for publication in Cambridge Prisms: Drylands. We believe that our manuscript makes original contributions to the literature in several ways. The drylands of Africa cover about 2.1 billion ha, with nine countries clustered around the Sahara, each accounting over 100 million ha and cover 60% of the continent is home to over 525 million people who depend on agriculture and livestock for their livelihoods. Paradoxically, the drylands are home to many of the poor. To make smallholder farming profitable through inclusive, market-oriented development, it is important to examine the economic performance of these farmers. The literature on interregional efficiency for dryland systems in West Africa is limited and very few have used rigorous methods for analyzing and comparing production systems using stochastic approaches. We extend the two-step stochastic metafrontier approach to multiple-output farms to investigate technology gap in the dryland areas of West Africa. Using data from randomly selected farmers in Ghana, Nigeria and Mali, we compare technical efficiencies and technology gap ratios of farmers. Under an output-oriented distance function framework, we apply a multi-output and multi-input stochastic frontier analysis. We find that that the metafrontier technical efficiencies (MTE) is greater than the technology gap ratios (TGR) for farmers in Ghana, Mali and Nigeria. Hence, technical inefficiency of farmers relative to the metafrontier comes primarily from the technology gap than from farmer (operating) inefficiency. Concerning sources of inefficiencies, socioeconomic factors such as household size, access to credit, and distance to outputs market improve technical efficiency. These findings imply that country-specific programs targeting these factors are needed to enhance farmers’ productivity.
Our manuscript has not been submitted to any other publication outlet, nor will it be while under review by Cambridge Prisms: Drylands.
Alphonse Singbo, Ph.D.
Associate professor
Department of Agricultural Economics and Consumer Science
Laval University, 2425 de l’Agriculture st., Paul-Comtois bldg., Québec, QC, G1V0A6, Canada, Tel. +1418 656 2131
Email: alphonse.singbo@eac.ulaval.ca