


Introduction
Soft Budget Constraint (SBC) syndrome appears when an organisation – a public administrative body, in this case – has no incentive to control its expenditure and balance its budget owing to the existence of another agent – the central government, in this case – that will provide assistance in the event of financial difficulties. Although this problem was initially described to investigate the economic behavior of certain enterprises in socialist economies, it was quickly utilised to analyse the fiscal relations between, on the one hand, regional and local governments and, on the other, central government. This phenomenon may also emerge in certain situations involving supranational entities, such as the European Union.
In the late 1970s, Spain experienced a transition to democracy. The new constitution, approved in 1978, and subsequent legislative changes, devolved numerous competencies to the newly created regional governments, known as Autonomous Communities. Spain has seventeen Autonomous Communities, two of which (Basque Country and Navarre) are excluded from the regional financing system. The Constitution devolves to the Basque Country and Navarre the privilege to collect taxes (under the same regulation) within their territory and the duty to make an annual transfer of money to the central government, computed as the value of the services provided by national institutions in these two “historic” regions.
The financing system of the regional governments has experienced several reforms (Atienza and Hierro Reference Atienza and Hierro2005; De la Fuente and Gundin Reference De la Fuente and Gundin2008; Zabalza and Lopez-Laborda Reference Zabalza and Lopez-Laborda2011) and remains a controversial issue in Spain. From the time the regional bodies were created in the mid-1980s, until 2001, financing of the regions was heavily dependent on central government transfers and was under continuous revision.
The reform approved in 2001 was intended to put an end to this transition period. The competencies assumed by the 15 regions were homogenised, several tax revenues were transferred to regional governments, thus, reducing discretionary transfers from the central government, and regions gained autonomy over several tax rates and the creation of new taxes. Nevertheless, despite further modifications to the system in 2009 that gave greater fiscal autonomy to regional governments, the system remains rigid. Tax revenues are distributed across regions mostly according to demographic variables, the autonomy to alter certain tax rates is limited by the central government, and current transfers, although significantly reduced, remain an important part of regional budgets. The new system also did not seem to introduce relevant incentives for strong tax competition at the regional level in the main tax categories either (Lopez-Laborda et al. Reference Lopez-Laborda, Martínez-Vázquez and Monasterio2006 ).
Since the creation of this regional financing system, the problem of SBC has been regularly discussed. There is no legislative plan to deal with episodes of insolvency, and the electoral cost, together with secessionist tensions, makes the prospect of regional default unconceivable. Some regional governments are promoting system reforms that will give them greater autonomy. At the same time, since the recent fiscal crisis, pressure from the European Union and the Eurozone has mounted for greater fiscal discipline and stronger institutions. Reformation of the financing system is expected soon. Therefore, an evaluation of the current state and evolution of the system is apposite.
This study analyses the existence of SBC in Spain’s regional financing system and, in particular, estimates whether the 2001 reform significantly reduced the SBC problem. For that purpose, panel data from the period 1984–2019 were used to estimate the determinants of public deficit at the regional level, with particular attention paid to fiscal policy indicators. The results unambiguously support the hypothesis that Spanish regional budgets have been considerably hardened post-reform. Increases in expenditure more heavily affect the public balance and are not compensated as much by additional central government transfers as before.
The remainder of the paper is structured as follows: “Insights from economic theory: determinants of soft budget constraint” section revises the literature on the theoretical determinants of Soft Budget Constraint. “Methodology” section describes the analysis methodology and specifies the econometric model. “Results” section presents and discusses the results. “Robustness tests” section develops some robustness tests. “Conclusions” section offers the conclusion.
Insights from economic theory: determinants of soft budget constraint
An early definition for SBC was by Kornai (Reference Kornai1979). Later, Kornai et al. (Reference Kornai, Maskin and Roland2003) developed the concept for public companies within the context of socialist economies. Wildasin (Reference Wildasin1997) constructed a two-level model for public administration. According to this model, SBC is optimal for central governments in the presence of positive externalities provoked by public expenditure at the local level. Wildasin’s study concluded that the budget constraint is softer the larger the importance of these externalities, and that SBC is more likely among relatively larger administrations. This is a recurring result in the literature.
Qian and Roland (Reference Qian and Roland1998) expanded the model by introducing the additional budget constraints of local government-controlled firms. The model, designed to replicate several aspects of the Chinese economy, concluded that increasing fiscal decentralisation can tighten the budget constraint, but at the expense of generating incentives for over-investment at the local level. In fact, the relationship between SBC and degree of fiscal decentralisation has proven to be a popular research topic, with most studies concluding that fiscal autonomy contributes to the tightening of budget constraint (see Vigneault (Reference Vigneault2005) for a detailed review).
Inman (Reference Inman, Rodden, Litvack and Eskeland2003) modeled the issue as a three-stage sequential game: in the first stage, the central government announces its transfers policy; in the second stage, local governments make their fiscal policy decisions; and, in the third stage, if any local administration is in a state of insolvency, the central government decides on the terms of the bailout. SBC emerges in the second stage, when the local government internalises the possibility of a bailout.
Other studies have focused attention on the political institutions that foment SBC. Goodspeed (Reference Goodspeed2002) demonstrated that a bailout could be an optimal strategy for a government to maximise the number of voters even when there are not externalities in the provision of the public good. In this model, the central government has no incentive to predetermine a credible bailout strategy ex ante. However, Robinson and Torvik (Reference Robinson and Torvik2009) identified conditions under which it is optimal to announce future bailouts of financed projects in circumstances when failure can be anticipated. This result appears in a framework in which politicians cannot commit to undertaking policies that are not optimal ex post. This happens, in particular, when the bailout implies a redistribution of income towards voters who could not otherwise attract public resources.
Besfamille and Lockwood (Reference Besfamille and Lockwood2008) developed a model in which SBC is optimal if the local government makes an effort to raise the likelihood of the success of investment projects. Otherwise, local governments may under-provide the public good owing to the deviation of resources to support the investment project. Finally, Catalán-Hoffmann (Reference Catalán Hoffmann2012) came to a similar conclusion in a framework that more accurately replicates intergovernmental relations. In the context of asymmetric regional shocks and intertemporal exchange, the use of discretionary transfers to mitigate the volatility of consumption caused by the shocks could be desirable. In conclusion, a trade-off exists between fiscal insurance against a local shock and fiscal discipline.
Methodology
Related studies
This section focuses on three specific aspects of related empirical literature: the alternative explanatory and dependent variables used to estimate the SBC problem, the methodological approach considered, and the interpretation of the estimated coefficient. This review illustrates how far scholars are from reaching consensus with respect to the three aspects under consideration.
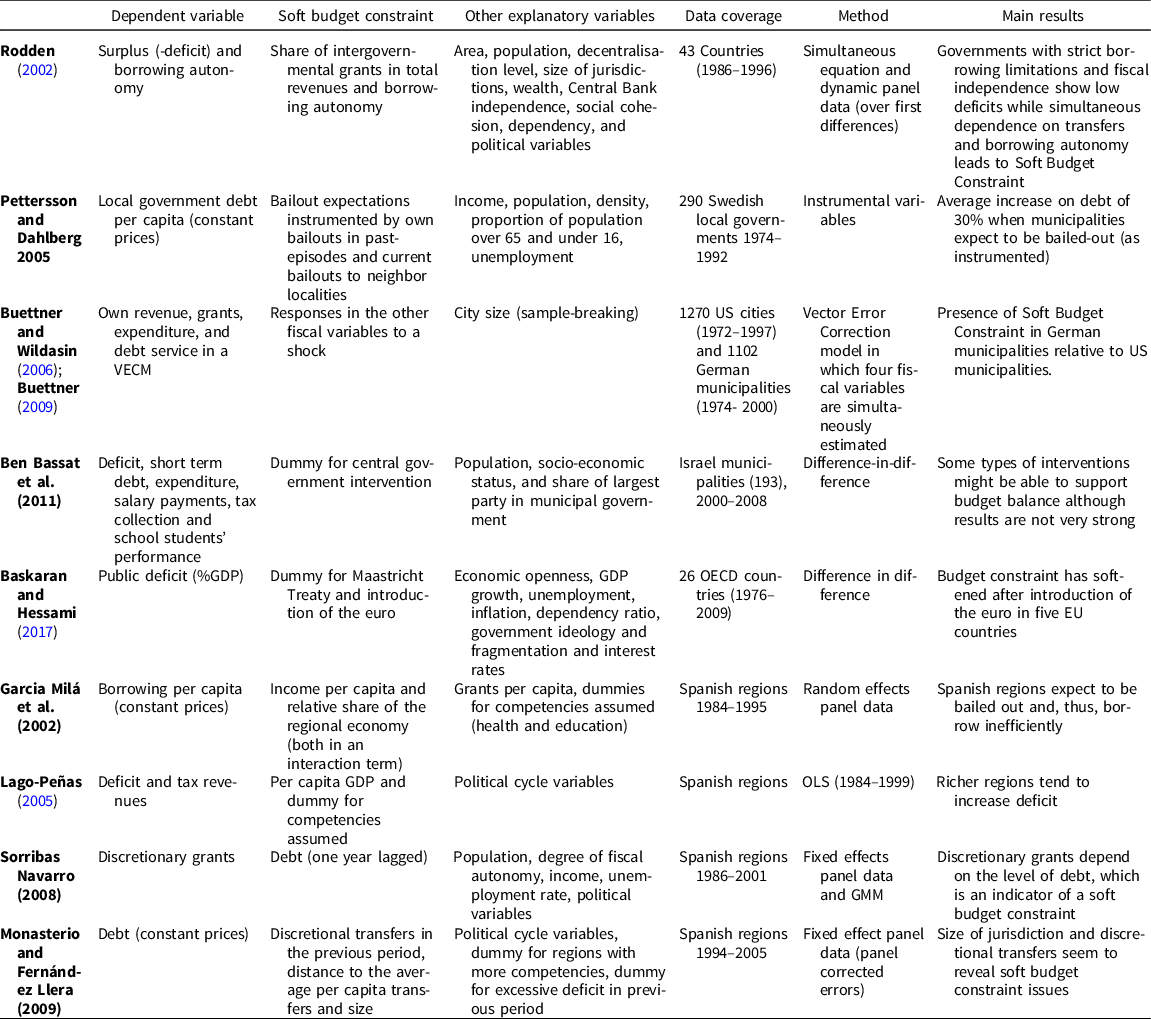
Rodden (Reference Rodden2002) estimated SBC determinants using panel data from 43 countries for the period 1986–1996. His work takes very seriously the presence of endogeneity and addresses this issue with two alternative methodological approaches: the use of a simultaneous equation model, in which borrowing autonomy is, in addition to budgetary deficit, a simultaneously generated dependent variable; and a dynamic generalised method of moments (GMM) panel data model similar to that used in this study but including most variables in first differences. In addition to the discretionary definition of the borrowing autonomy index, the main shortcoming of the simultaneous equation approach is the lack of dynamic behavior of some of the variables used to construct the model. This impedes the exploitation of the panel’s time dimension.
Buettner and Wildasin (Reference Buettner and Wildasin2006) and Buettner (Reference Buettner2009) use a Vector Error Correction Model (VECM) to estimate the dynamics of fiscal adjustment based on panel data from USA and German municipalities. Esteller-More et al. (Reference Esteller-More, Sole-Olle and Sorribas-Navarro2002) applied a similar analysis to 137 Spanish municipalities (1992–1999) and found no evidence of SBC. Their methodological approach explored the dynamic relationship between the main accounts of the public budget, and this was particularly useful with local-level data as the large number of coefficients to be estimated demanded the availability of a large number of observations.
Based on a panel estimation of SBC for 260 Swedish municipalities, Pettersson-Lidbom and Dahlberg (Reference Pettersson-Lidbom and Dahlberg2005) use past bailout episodes and current bailouts of neighboring governments as the instrument for bailout expectations. This instrument seemed to work relatively well, and estimated a significant increase of public debt (around 30%) when bailout expectations showed up. The use of this instrument, however, is only possible given the specific characteristics of Swedish local institutions which face, constitutionally, no borrowing restrictions.
Ben-Bassat, Daham and Klor (Reference Ben-Bassat, Daham and Klor2016) estimated whether several types of local government interventions recently introduced by a legislative change in Israel made budget constraint in these localities harder. For this purpose, they used the difference-in-difference method for their panel data model. This method exploits the comparison of outcomes between units that have suffered intervention with those that have not. This methodological approach is valid when a sample of simultaneously comparable units is available, of which some have been treated and some have not. However, the intervention threat introduced by legislative change may itself influence the degree of softness of budget constraint in all units. To capture SBC, the authors used six alternative dependent variables, although some were extremely characteristic of their local-level data. Budgetary deficit, debt, and expenditures were among the alternative dependent variables, while the dummy variables were explanatories that represented the three alternative types of central government intervention, population size, socioeconomic development, and the share of the largest party in each municipal government.
From a panel of 26 Organisation for Economic Co-operation and Development (OECD) countries (1975–2009), Baskaran and Hessami (Reference Baskaran and Hessami2017) estimated the impact of the Maastricht Treaty and the introduction of the euro in the budget constraint of EU member states. They used fiscal deficit as the dependent variable (with three versions: primary deficit, current deficit, and cyclically adjusted deficit), expressed as a share of Gross Domestic Product (GDP) and economic openness, GDP per capita growth, unemployment rate, inflation rate, dependency ratio, political dummies, and interest rates as explanatories. Applying a difference-in-difference methodology, their conclusions are only relevant when the methodology is applied to a subset of five European Monetary Union countries and yields the result that, while signing the Maastricht Treaty reduced public deficits in these countries, the introduction of the euro softened their budget constraint again.
Due to the particularities and subsequent reforms of the financing of Spanish regional governments, some attention has been paid to the analysis of SBC applied to this particular problem. Garcia-Mila et al. (Reference Garcia-Mila, Goodspeed and McGuire2002) constructed a model based on a theoretical framework in which a regional government’s borrowing decision is driven by its expectations that the central government will partly assume previously generated debt. Their dependent variable was the level of regional borrowing expressed in per capita (constant) euros. The explanatory variables capturing hard (soft) budget constraint were income per capita (as their model predicted, under SBC, a positive relationship between income per capita and the dependent variable) and the income share of the region (over the total national economy). If deficits incurred by regional governments are ultimately paid by the central administration, then income share plays a role due to the SBC implications for national taxation. Therefore, larger regions will have fewer incentives to increase their deficit.
Monasterio-Escudero and Fernández-Llera (Reference Monasterio Escudero and Fernández Llera2009) also used the relative size of regions as an indicator of the existence of SBC. However, as an alternative, they also considered central government per capita transfers and per capita discretional transfers (one period lagged). The motivation to use these variables lies in the assumption that the larger the transfer (or the discretional transfer) received, the softer the regional administration perceives the budget constraint. Similar to Lago-Peñas (Reference Lago-Peñas2005), they concluded that political variables are not determinants of regional deficits. Nevertheless, Lago-Peñas considered the size of the region to be irrelevant and investigated the use of taxation revenues as an alternative dependent variable to capture the existence of SBC, although his study did not yield interesting results in this respect. The general concern, as explicitly explored in Sorribas-Navarro (Reference Sorribas-Navarro2011), was that the frequent adjustments of the financing system during the nineties served as implicit bailout episodes.
Many other studies, although not specifically focused on estimating the presence of SBC, have estimated the determinants of budget imbalance, bailout episodes, and related variables. Establishing the degree to which this empirical evidence measures the existence of SBC may be difficult, as this is not the main focus of these studies.
For example, Von Hagen, et al. (Reference Von Hagen, Bordignon, Dahlberg, Grewal, Petterson and Seitz2000) and Hernández-Trillo et al. (Reference Hernández Trillo, Díaz Cayeros and Gamboa González2002) estimated the determinants of bailouts of subnational governments for four OECD countries and Mexican states, respectively, Nicolini, et al. (Reference Nicolini, Posadas, Sanguinetti and Tommasi2002) and Sorribas-Navarro (Reference Sorribas-Navarro2011) estimated the determinants of certain discretionary transfers to explore whether these behaved as implicit bailout instruments, and Esteller-Moré and Solé-Ollé (Reference Esteller-Moré and Solé-Ollé2004) estimated the determinant of fiscal adjustment in Spanish regions. This literature yields interesting results that will be referred to throughout this paper and will be used to decide on the variables and the functional form of our empirical model.
Table 1 includes the main features of selected empirical studies that have sought to determine the existence of SBC in intergovernmental relations, with a particular focus on studies exploring Spain’s Autonomous Communities.
Empirical estimation of the soft budget constraint from panel data models. Selected literature review
Modelling
This article uses annual data for the period 1984–2019 from the 15 regional governments under the regional financing system. In 2002, a reform of the law that rules the financing system of Spanish regions (called LOFCA) came into force. The reform enlarged the tax autonomy of regional governments and significantly altered the distribution of income in Spanish regions. This statement is further analysed in Appendix A. We aim to study whether the implementation of this normative change tightened or loosened the budget constraints of Spanish regional governments.
To formally establish the existence of a breakpoint in our dataset, we first run structural break tests for unknown breakpoints, as discussed in Bai and Perron (Reference Bai and Perron1998) and Bai and Perron (Reference Bai and Perron2003), and their application for panel data, as discussed in Ditzen et al. (Reference Ditzen, Karavias and Westerlund2021) and Karavias et al. (Reference Karavias, Narayan and Westerlund2021). We simultaneously tested whether our dependent and budget-related independent variables contained a break at an unknown date. These tests led to the conclusion that, at the 1% confidence level, there was a break in 2001–2002. This remains the case with or without controlling for cross-sectional dependence, heteroskedasticity, and autocorrelation in the panel.
To capture the identified break in our regressions, we used a dummy variable called Post Reform, which takes value 1 from 2002 onwards and value 0 for the previous periods.
The dependent variable
We focus on the deficit (-surplus) of the regional administration, measured as its level over regional GDP, as the dependent variable.
Regional primary deficit reflects the summary of the consequences of the decisions taken by the regional government, and of the decisions taken by the central government that affect local public accounts. Consequently, most of the literature assessing the SBC uses a fiscal stance as the dependent variable.
Our choice of dependent variable may raise some concerns. On the one hand, as described in the previous section, scholars are not in agreement regarding which dependent variable to use. Although deficit is the most often chosen, other studies (Monasterio-Escudero and Fernández-Llera Reference Monasterio Escudero and Fernández Llera2009; Vallés Reference Vallés2002; Garcia-Mila et al. Reference Garcia-Mila, Goodspeed and McGuire2002) use debt. Nevertheless, Pettersson-Lidbom (Reference Pettersson-Lidbom2010) shows that the results for the estimate of the level of the soft budget effect – which he defines as the probability that the central government provides lump-sum grants or transfers to a local government – are very similar notwithstanding if the fiscal stance of the (Swedish) local government is measured as level of debt, change in debt (i.e. deficit), cash deficit (i.e. primary deficit), or total spending.
On the other hand, GDP, the scaling variable for our fiscal components might generate endogeneity concerns. Table 4 presents the regression results for primary deficit over GDP. Even so, to address these issues, in Appendix, we include the regressions for models with debt and primary deficit in per capita terms as dependent variables. The results do not change our conclusions.
Finally, one might consider measuring the change in the hardness of the budget constraint by using current expenditure or current transfers as the dependent variable and the lagged fiscal stance (primary deficit or debt) as the main regressor. However, current transfers and current expenditure only embed one side of the decisions of the local government. Therefore, a relevant part of the story is veiled.
Very few papers address SBC related questions in this “reverse” way. Mello (Reference Mello2007) tests the presence of a stable long-run statistical association between changes in transfer receipts and sub-national net worth for a panel of countries. He argues that causality may be found in both directions, depending on the econometric technique used. He finds evidence in favor of the largely extended deficit-bias hypothesis when a dynamic fixed-effects model is estimated. This hypothesis sustains that, due to a range of institutional and political-economy factors, dependence on grants and transfers from higher levels of government creates a deficit bias at the sub-national level because it encourages recipient jurisdictions to underutilise their own tax bases at the expense of sharable bases and/or to spend beyond their means. Therefore, this evidence goes in favor of the general view that uses deficit or debt as the dependent variable.
His second hypothesis suggests that Indebtedness causes transfers. When sub-national jurisdictions are free to borrow, they form expectations about how the central government reacts to their financial stance. He finds evidence in favor of this hypothesis when a dynamic Ordinary Least Square (OLS) regression is run, but not in the case you include the lag of the dependent variable as a regressor, as we do, to account for the high persistence of these variables.
In view of Mello’s (Reference Mello2007) conclusions and the partial picture it would provide to us, we stick by the generally used dependent variables and develop our analysis with GMM dynamic panel data models that account for potential endogeneities and two-way causality. We leave the “reverse” option in Appendix (See Table 10).
Regressors
Among the control variables, current expenditure is assumed to capture the potential existence and importance of SBC. The coefficient attached to this variable describes the relationship between political expenditure decisions and their impact on budgetary deficit, controlling for the main sources of income. Therefore, the larger the value of the estimated coefficient, the tighter the budget constraint in Spanish regions. We introduce an iteration term of this variable with the dummy, in order to estimate whether the reform has balanced the budget constraint.
Our models had to, of necessity, omit one of the main budget variables to avoid multicollinearity. In the regressions, we decided to exclude either tax revenues or current transfers. In consequence, we are making a crucial implicit assumption that affects the interpretation of the main coefficient (see Kneller et al. Reference Kneller, Bleaney and Gemmell1999)Footnote 1 – since we controlled for changes in one income variable, the changes in current expenditure are assumed to be partially financed (or compensated) by the other omitted income variable. For this reason, there is no coefficient of 1 for current expenditure (i.e. not all the extra expenditure is transferred to the deficit). The larger the coefficient for current expenditure, the less the omitted variable cares for the contention of deficit. Therefore, when the omitted variable is tax revenues, this coefficient also implicitly accounts for the carefulness of the regional government in containing its deficit via tax revenue adjustments, which is consistent with the smaller coefficient obtained in this version of the model. When the omitted variable is current transfers, the coefficient for current expenditure also implicitly accounts for the level of rescuer behavior exerted by the central government on regional governments (i.e. the larger the coefficient the less the central government compensates with transfers).
Other control variables used are agriculture intensity, measured as the importance of the primary sector in the value added to the region, which seeks to capture the role of the sectoral distribution of income; growth, measured as the GDP growth rate, which represents the importance of the business cycle; population, which captures the effect of the size of the jurisdiction; pop>64 and pop<16, which capture the impact of population pyramid; and, employment rate, which is a proxy for the level of relative wealth of the region. Existing literature, cited in “Related studies”, reveals that the use of political and electoral cycle variables yields poor results. Table 2 describes the variables and data sources, while Table 3 reports the summary statistics. All variables are defined over the period 1984–2019, except agriculture intensity, which is only available from 1986 onwards, and debt, from 1995 onwards.
Variable description and sources of data
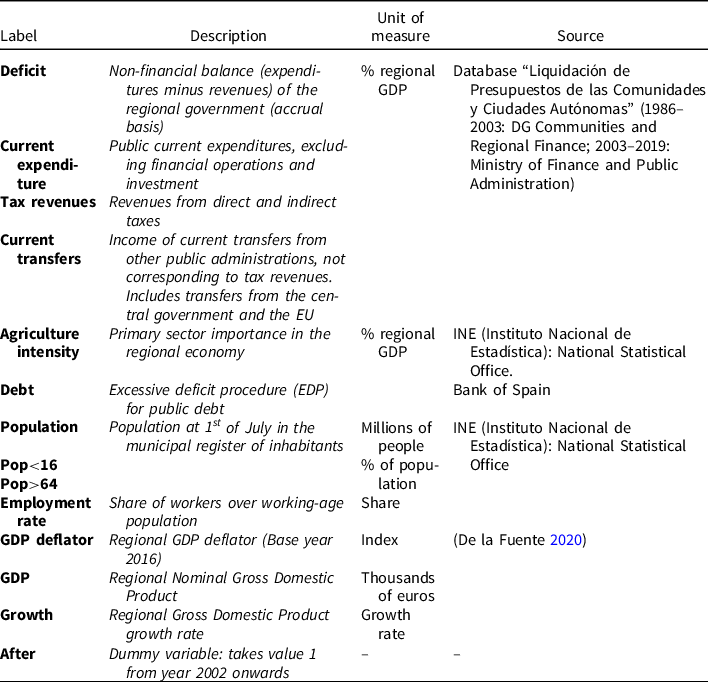
Note: Variables in per capita terms are real-term variables, after being multiplied by the regional deflator, and divided by Population.
Summary statistics

Determinants of the primary deficit. Dynamic panel data estimates
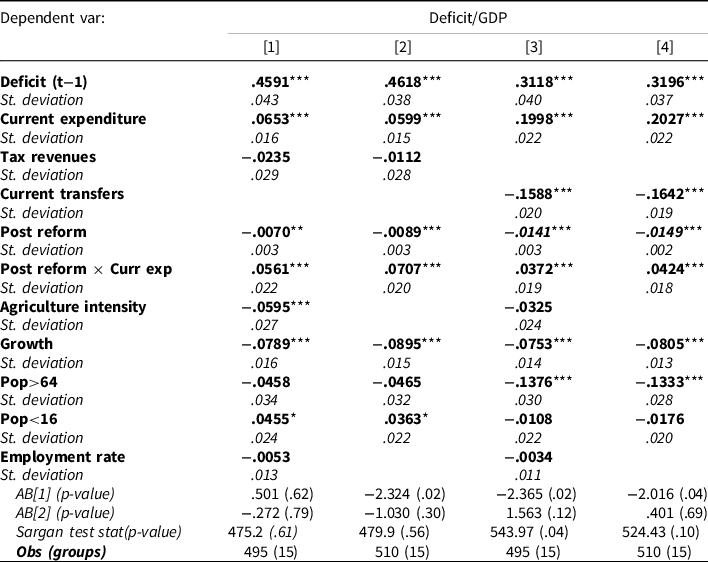
*, **, and *** indicate statistical significance at the ten, five, and one percent levels, respectively.
The reference model used in this study estimates the impact of political expenditure decisions at the regional level concerning the public deficit of Spanish regional administrations, during the period 1984–2019. With this purpose, a dynamic panel data model with regional public deficit as the dependent variable and regional current expenditure among the set of control variables is estimated:
 $$defici{t_{it}} = \rho \,defici{t_{it}}_{ - 1} + {\beta _1}current\_expenditur{e_{it}} + {\beta _2}incom{e_{it}} + \gamma \,{m_{it}} + {\mu _i} + {\varepsilon _{it}}$$
where sub-indexes i and t denote region and year, respectively. The variable income represents one of two alternative sources of income – tax income and current transfers. mit is a vector composed of the remaining explanatory variables, that includes a dummy variable for the post-reform period and the iteration of the dummy with current transfers, μi is the idiosyncratic effect and ϵit is the error term. To control the endogeneity of the control variables and capture the dynamic behavior of the dependent variable,Footnote 2 the Arellano and Bond (Reference Arellano and Bond1991) GMM estimator is used to estimate equation 1. This estimator internalises fiscal variables are endogenous and the variable representative of the cycle is predetermined, thus controlling this source of bias.
In Appendix B “Spatial dependence”, we explore the persistence of our results with the introduction of spatial dependence (this involves some degree of “contagion” between regions with fiscal variables that depend both on the value of the control variables and on the evolution of the same fiscal variables in other regions). The main conclusions regarding the variables of interest remain practically unchanged for that version.
Results
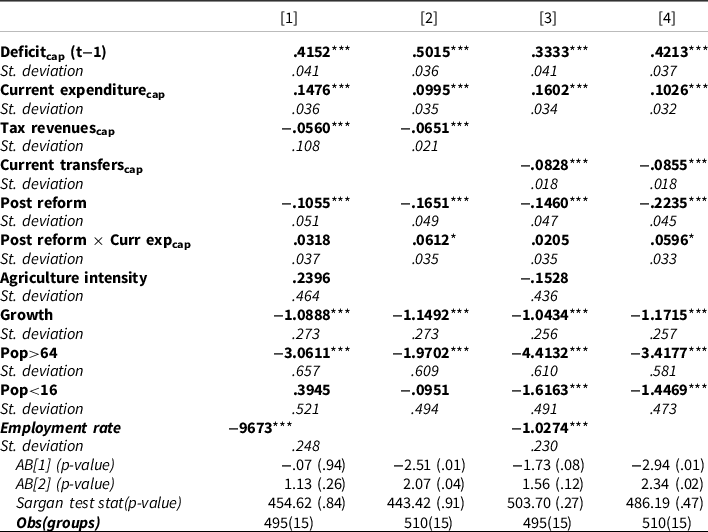
Table 4 reports the outcome for the estimations of equation (1), making use of the Arellano and Bond (Reference Arellano and Bond1991) estimator. We assume that fiscal variables are endogenous and that growth is predetermined.Footnote 3 Other studies (Durán Reference Durán2007; De la Fuente and Gundin Reference De la Fuente and Gundin2008) have already assumed this reform of the financing system as a breakpoint and that it was due to relevant changes in size and sources of income, the development of further taxation autonomy, and the assumption of additional competencies.
Primary deficit as a ratio of GDP at the regional level is the dependent variable in Table 4. Models [1] and [2] include tax revenues and omit current transfers, while models [3] and [4] do the opposite.Footnote 4 As we have previously argued, the explanatory variable capturing the hardness of the budget constraint is current expenditure. Its coefficient captures the extent to which public expenditure decisions are transferred to deficit alterations, keeping constant the income source included in the regression. However, when interpreting the coefficients in these regressions, we must bear in mind that the omission of one main component of the budget imposes an implicit assumption on the financing sources of changes in the included expenditure variable. This explains why the coefficient of current expenditure is largely different when models [1] and [2] are compared with models [3] and [4].
When the omitted variable is current transfers, the estimated coefficients assume that expenditure alterations are partially backed by transfers from other levels of public administration. Therefore, this captures the extent to which central government acts as a rescuer (i.e. the smaller the coefficient for current expenditure the softer the budget constraint, thanks to help from the central government). When the omitted variable is tax revenues, the coefficients assume that part of the variation in expenditure is compensated by tax income adjustments. Therefore, this captures how much regional governments care about (the self-contention of) their deficits.
Note that the coefficient for the dummy variable, Post Reform, is negative and significant at the 1% confidence level. This indicates that regional deficits have reduced once we control for current expenditure and economic growth. This is true regardless of which main income component is included.
The coefficient of the interaction term, Post reform × Current expenditure, indicates whether the transmission of current expenditure alterations changed following the reform of the financing system. This coefficient is also significant and positive in the four models. Hence, after the reform, a larger share of any increase in current expenditure is converted into deficit.
Both phenomena reveal that the budget constraint has hardened somewhat since 2001. Intergovernmental transfers seem to respond better to computational rules rather than serving as instruments used discretionarily by the central government to cover short-term increases in regional expenditure.
The size and significance level of the other control variables are reasonable and are not subjected to deep analysis in this study. We should mention, however, that the coefficients are quite robust in alternative versions of the model.
Robustness tests
Apart from our analysis of legislative reform, some other factors may have affected the Spanish regional economy. A summary of the evolution and expected impact of these factors is shown in Table 5. This table is expanded in Appendix A, with reference to other legislative, institutional, and macroeconomic changes that occurred during the period under consideration.
Time evolution of the main determinants of a soft budget constraint in the Spanish regional administration
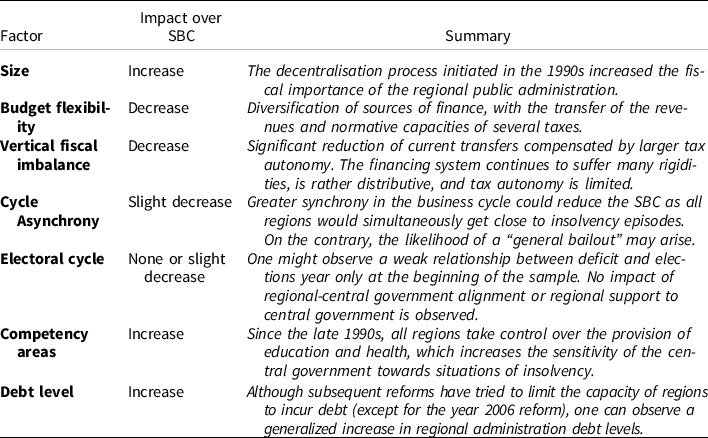
The legislative reform we identify as the main source of SBC change also affects two of the factors identified in Table 5: It partially equilibrates the vertical fiscal imbalance (the asymmetric degree of control over the expenditure and revenues side of the budget) and gives larger budget flexibility to regional governments.
The evolution of the other factors does not seem to mitigate SBC. The business cycle is slightly less synchronous between regions. However, this does not seem powerful enough to change fiscal trends, and the literature is not conclusive about its effects, as there are opposing forces. The electoral cycle does not seem to play an important role in determining budget imbalances, and the alignment of regional governments with the national government is also not associated with the larger budgetary deficit.
Finally, the nature of the additional competencies assumed by regional governments, namely, health and education, and the regulation and evolution of regional debt, favor an increase in, rather than the mitigation of, the SBC problem. In conclusion, financing and legislative reform appear to be the main causes of the results we obtained.
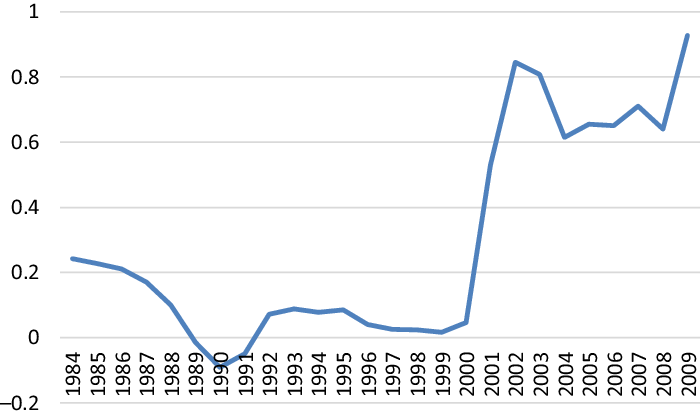
We run two other robustness tests. First, Figure 1 reports the evolution of the current expenditure estimated coefficient, omitting the intercept and using a rolling sample of eight years. The estimated coefficient jumped when the sample covered the period 2001–2008 and remained stable at a value of approximately 0.7 until the last reported sample. The figure supports our hypothesis for the breakpoint in 2002.
Evolution of the coefficient attached to the variable Current Expenditures in the baseline model for an eight-year rolling window.
The horizontal axis represents the starting year of the eight-year rolling sample used to estimate the coefficient.
Second, for historical reasons, the Basque Country and Navarre are not part of the financing system. Given that they have particular financing systems, but assume similar competencies and structures as the other regions, they represent a suitable reference to evaluate whether the observed changes have been effectively caused by the reform. As a robustness test, we estimated regression models containing all 17 Spanish regions. The results are shown in Table 6. These models include interaction variables for all the fiscal components we accounted for, with a dummy which identifies the two “historic” regions. We also included a three-term interaction variable: Post reform × hist × current expenditure, to establish whether the coefficient for current expenditure also changed in these two regions after the reform. The outcome of the estimation and its interpretation are reported in Appendix B “Joint analysis of regional governments not included in the standard financing system” We conclude that the value of the coefficients estimated for the 15 regions under the general financing system converged to the (more stable) value in these two historic regions. This, again, supports the hypothesis that the observed changes were caused by the 2002 reform.
Conclusions
SBC in public administration appears when policymakers find incentives to overspend in the hope of a bailout from another, usually superior, level of the administration in the event of insolvency. The current Spanish Constitution, approved in 1978, includes the deployment of regional bodies, called Autonomous Communities, with multiple competencies devolved from the central government. Since the creation of this regional system, the financing of the Autonomous Communities has been controversial. Initial financing agreements were based on massive transfers from the central government, which were generally perceived as discretionary. Several studies have shown that subsequent agreements were used as implicit bailout instruments.
The financing system, as well as other aspects of regional organisation, were substantially reformed in 2001. Regional income became more dependent on tax revenue, and regional governments increased their capacity to alter rates and create new taxes. Their dependence on transfers from the central government was substantially reduced, although not eliminated. The tax autonomy of Autonomous Communities remains limited. For instance, regarding the two main sources of tax revenue, the central government only permits alterations to the regional share of income tax within a range, while the regions have no control over the VAT rate.
Consequently, there were doubts that the reform was a useful tool for the imposition of further fiscal discipline in the Spanish regions. This paper investigated if the SBC problem of Spanish regional governments has been partially solved with the reform of the financing system. The (disperse) econometric methodology used by other scholars was reviewed to design an econometric model that could estimate the relationship between regional expenditure and deficit for the panel data of 15 Spanish regions. The analysis incorporates a dummy variable and its interaction with fiscal variables turning 1 in 2002, when the reform was enforced. We used the Arellano-Bond GMMs estimator for panel data which controls for the endogeneity of some control variables. As an innovation assimilated by recent studies using fiscal variables at the regional level, an extension of the baseline model also incorporated a spatial lag in the dependent variable, in the form of an SAR model, to capture imitation and contagion across regions.
The results undoubtedly reveal that the relationship between expenditure and deficit has been tightened, substantially reducing the SBC problem; regional governments are now more responsible for their own expenditure decisions and increases in expenditure are not supported by additional governmental transfers with the same strength as in the years before the reform.
Although the results of this study are conclusive, the problem is far from being resolved. During the latest crisis, the Spanish regions accumulated sizeable deficits. The primary deficit has returned, in most cases, to reasonable levels, but the financial situation of some regions is problematic. A substantial reform of the financing system is expected and, depending on the political situation, this reform could partly reverse the progress made in regional fiscal discipline. Meanwhile, regional redistribution of fiscal power is expected in many other European countries, for which the results reported here might offer valuable insight.
Finally, our results may be relevant to other countries or levels of public administration. As the most decentralised countries in the European Union, Germany and Spain have relatively similar degrees of fiscal autonomy and sources of finance (see De la Fuente et al. Reference De la Fuente, Thöne and Kastrop2016). This problem is relevant given that other European countries, such as Italy (Breton and Fraschini Reference Breton and Fraschini2016) and Poland (Holesch Reference Holesch2018), are in the process of giving more fiscal autonomy to their regions (Alber and Valdescalici Reference Alber and Valdescalici2012). In fact, the Council of European Municipalities and Regions recognises that 36 out of its 41 member states are implementing territorial reforms affecting regional or local administration, half of which are considered major reforms. This organisation points out that the goal of the reforms “is no longer exclusively to advance decentralisation but also to adjust the functioning of local and regional authorities to the budgetary and operational restrictions imposed by the central governments” (CEMR 2013).
The findings of this study suggest that further fiscal autonomy in budget expenditure should be accompanied by equivalent tax transfers if the aim is to maintain fiscal discipline. This result is compatible with previous evaluations of fiscal decentralisation outcomes. Governatori and Yim (Reference Governatori and Yim2012) found that, for a panel of 27 EU countries, the fiscal autonomy of subnational governments may harm budgetary discipline when it is financed by transfers from the central government rather than by subnational taxes. Rodríguez-Pose and Krøijer (Reference Rodríguez-Pose and Krøijer2009) found fiscal decentralisation to have a similar impact on economic growth for a panel of 16 central and eastern European countries.
Data Availability Statement
Replication data and code are available via Dataverse: https://doi.org/10.7910/DVN/NKAYZV
Funding
This work has benefited from research funding from the Ministry of Science, Innovation and Universities of Spain (Grant numbers ECO2014–52,999-R, RTI2018–097,434-B-I00, PGC2018–094,364-B-100 and RTI2018–093,543-B-100, MCIU/AEI/FEDER, UE); from the Government of Catalonia through the grant “Beca per a la realització de treballs individuals” awarded by the Institut d’Estudis Autonòmics; and from Junta de Andalucía through grant B-SEJ-544-UGR20 from the Programa Operativo FEDER de Andalucía 2014–2020. Funding for open access charge: Universidad de Málaga / CBUA.
Competing interests declaration
The authors have no relevant financial or non-financial interests to disclose.
Appendix A. Main determinants of SBC in Spanish regional governments: time evolution.
This Appendix expands the information reported in Table 5 by analysing the evolution of the factors that previous studies have identified as determinants of SBC. One of the more relevant factors is the relative size of jurisdictions. When regions are “too big to fail”, the central government may be politically and financially compromised by a default (Hernández-Trillo et al. (Reference Hernández Trillo, Díaz Cayeros and Gamboa González2002) provide empirical evidence in this respect). Nevertheless, the lower financial cost of the bailout of smaller regions may also be considered a clashing force (Fernández-Llera et al. Reference Fernández Llera, Lago Peñas and Martínez-Vazquez2012).
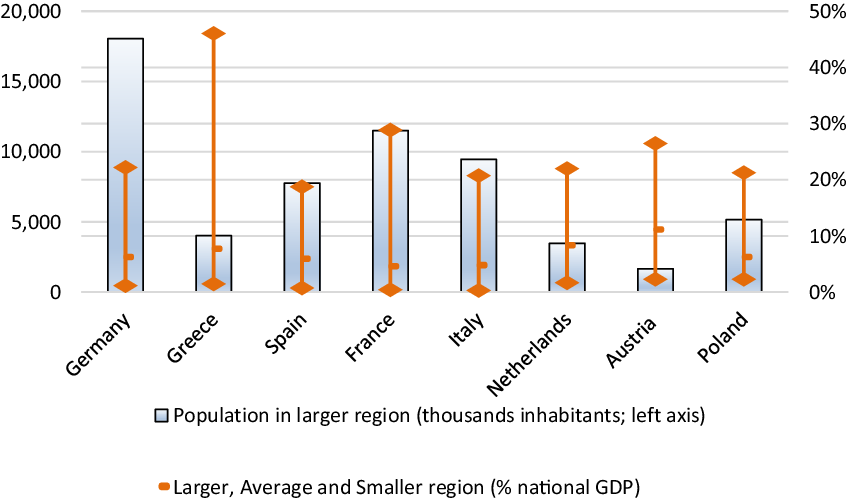
Figure 2 illustrates the relative size of Spanish regions in comparison to other countries in its economic environment. The relative size of North Rhine-Westphalia, in Germany, Ⓘle-de-France, in France, Lombardy, in Italy, or Mazowieckie, in Poland is slightly larger than the relative importance of the Catalan economy to Spain. In all cases, we compared the largest region of each country with regard to the share of GDP. In terms of population, the average size of Spanish regions lies around 2.4 million inhabitants, which is slightly below most countries, with the exception of Germany (with an average regional population size of 5.4 million).
Size of the largest region (thousand inhabitants) and size of the largest, average, and smaller region (% national GDP; right axis).
Source: Eurostat
The size of the regional administration
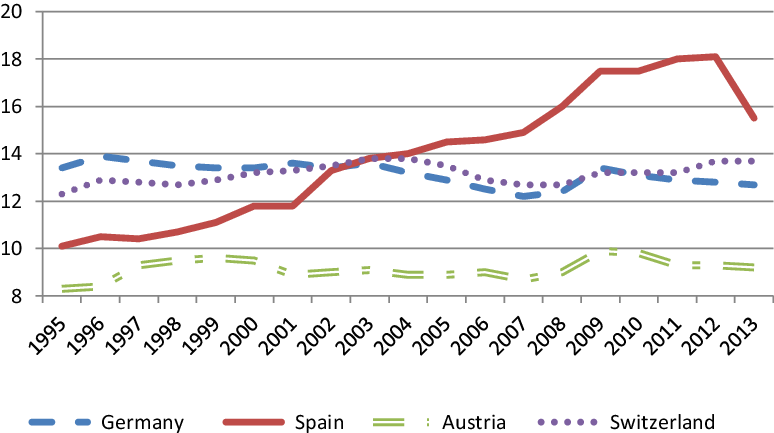
Another dimension to take into consideration when analysing relative size is the importance of the regional administration in the public sector. Figure 3 shows how the relative size of the Spanish regional administration has increased in recent decades (see Molero Reference Molero2001). It now lies above other federal states, such as Germany and Switzerland.
Evolution of regional/state expenditure in decentralised countries (% GDP).
Source: Eurostat
Budget flexibility and vertical fiscal imbalance
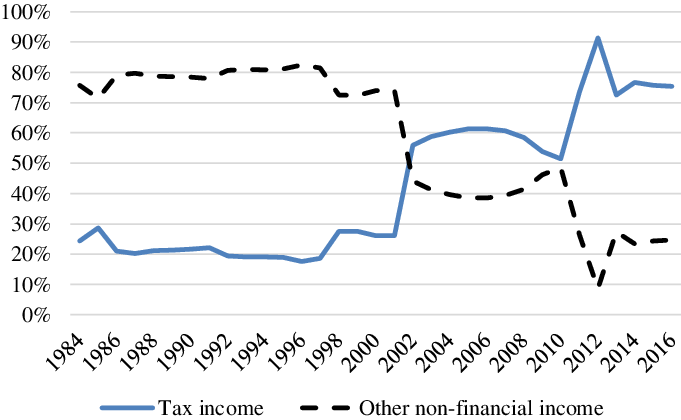
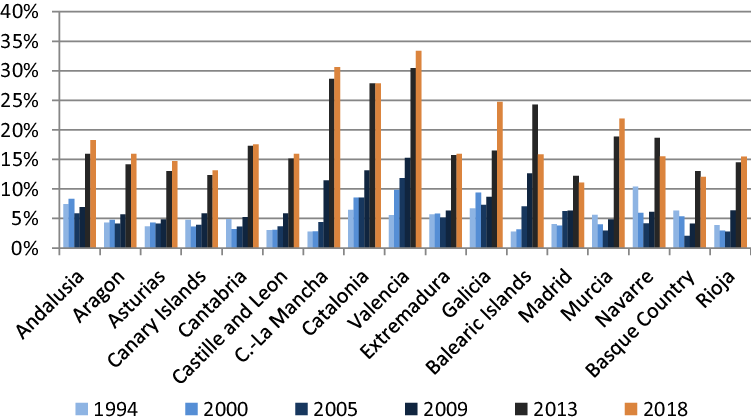
The lack of flexibility of financing sources (Vigneault Reference Vigneault2005) and the discretionary nature of intergovernmental transfers (Rodden Reference Rodden2002) are identified as determinants of SBC. In fact, most studies of the Spanish regional financing system recognise the existence of a vertical fiscal imbalance toward the central government as the primary anomaly (see, for example, Garcia-Mila et al. Reference Garcia-Mila, Goodspeed and McGuire2002; Fernández-Llera et al. Reference Fernández Llera, Lago Peñas and Martínez-Vazquez2012)). It should be noted that the system has experienced subsequent reforms since its creation in the 1980s. These reforms have been exhaustively described (Atienza and Hierro Reference Atienza and Hierro2005; De la Fuente and Gundin Reference De la Fuente and Gundin2008; Zabalza and Lopez-Laborda Reference Zabalza and Lopez-Laborda2011; Bassols et al. Reference Bassols, Bosch and Vilalta2010). Since 1993, when Spain’s regions begin to participate in the collection of the major taxes, and subsequent reforms in 1997, 2002, and 2010, there have been increases in both regional participation in national tax collection (see Figure 4) and normative capacity over those taxes (González González Reference González González2000; Durán Reference Durán2007).
Evolution of public revenues at the regional level. Tax revenues versus other sources. (Excluding Basque Country and Navarre).
Source: Eurostat
Although tax autonomy depends not only on the volume of tax revenue managed by each jurisdiction, but also on normative capacity over tax rates, Atienza and Hierro (Reference Atienza and Hierro2005) constructed an indicator of tax autonomy that describes the rising leeway available to Spanish regions to alter taxes.
Cycle synchronisation
Some studies (Fernández-Llera et al. Reference Fernández Llera, Lago Peñas and Martínez-Vazquez2012) consider that the degree of asymmetry in how episodes of financial crisis affect different jurisdictions could affect regional budget constraint. When a jurisdiction is only one among many to suffer an insolvency that the central government can afford, the likelihood of a bailout is greater.
Figure 5 illustrates the evolution of business cycle synchronisation modeled as the standard deviation of the GDP growth rate. Except for years with more volatile behavior, the data are compatible with the hypothesis of more synchronised cycles across Spanish regions over time.
Cycle Synchronisation.
Source: Eurostat

Electoral cycle
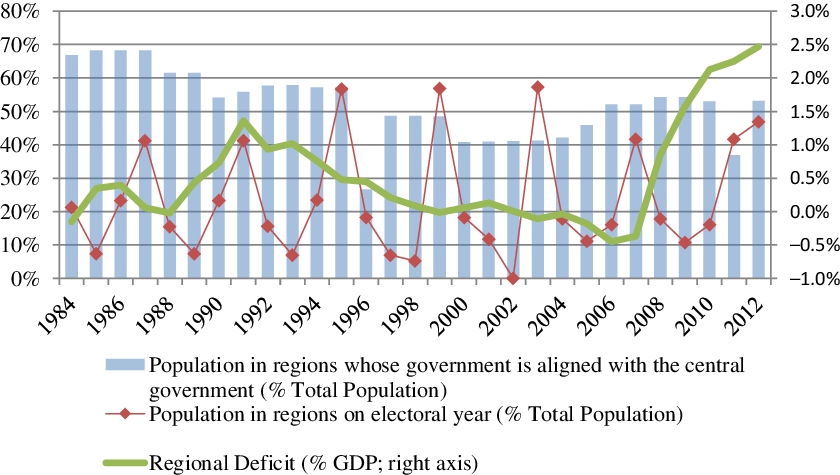
Some studies suggest that the electoral cycle and the political alignment and strength of the government can affect the distribution of the public budget and increase the deficit. However, none of the studies we consulted that analyse these relationships in the context of the Spanish regions found evidence to support this (Sorribas-Navarro Reference Sorribas-Navarro2008; Lago-Peñas Reference Lago-Peñas2005; Monasterio-Escudero and Fernández-Llera Reference Monasterio Escudero and Fernández Llera2009). With the exception of three terms (1996–2000, 2004–2008, and from 2016 to the present), the central government has been supported by an absolute majority. The evolution of regional imbalances does not seem to be affected by this. Prior to the mid-1990s, the electoral cycle seemed to be slightly correlated with regional deficits. However, at the end of the sample, this also seems to be unrelated to regional budgets (See Figure 6).
Electoral cycle and regional budgetary balance.
Source: Eurostat
Policy areas administrated
Some studies (see Rodden et al. Reference Rodden, Eskenland and Litvack2003) point to the types of policies under the control of regional administrations as determinants of the likelihood of a bailout and, consequently, the existence of SBC. This situation can be aggravated when the central government sets a minimum level of provision of certain services and when the provision of these services generates externalities in other regions. In this respect, the general assumption of the provision of public health and education from 1999 onwards, represents the most noticeable milestone. Until that point, only five regions administered these policies (Garcia-Mila et al. Reference Garcia-Mila, Goodspeed and McGuire2002).
Debt and financial autonomy
Since 1980, the capacity for Spanish local and regional governments to become indebted has been heavily limited. The General Law of Budgetary Stability, approved in 2001, prevents these administrations from having a deficit in normal times. However, reform in 2006 softened the rigidity of the previous law by imposing a multi-annual balance and allowing for further exemptions (Paúl-Gutiérrez et al. Reference Paúl Gutiérrez, Salinas Jiménez and Uxó González2010). Finally, the reform of Article 135 of the Spanish Constitution, developed in the Organic Law of Budgetary Stability and Financial Sustainability, introduces additional restrictions to the deficit at all levels of public administration, conditioned to European Union forecasts (Carrasco Durán Reference Carrasco Durán2013).
In sum, with the exception of the 2006 reform, all previous legislative changes were intended to limit the capacity of Spanish regions to accumulate budgetary deficits. Nevertheless, Argimon and Hernández de Cos (Reference Argimon and Hernández de Cos2012) and, more recently, Delgado-Téllez et al. (Reference Delgado Téllez, Lledó and Pérez2016) concluded that these reforms have no significant impact on the evolution of regional fiscal imbalances. In fact, as we can see in Figure 7, in practice, regional governments have, in recent years, had no limitations to becoming indebted.
Debt of the Spanish regional governments (% GDP).
Source: Eurostat
Appendix B
Joint analysis of regional governments not included in the standard financing system
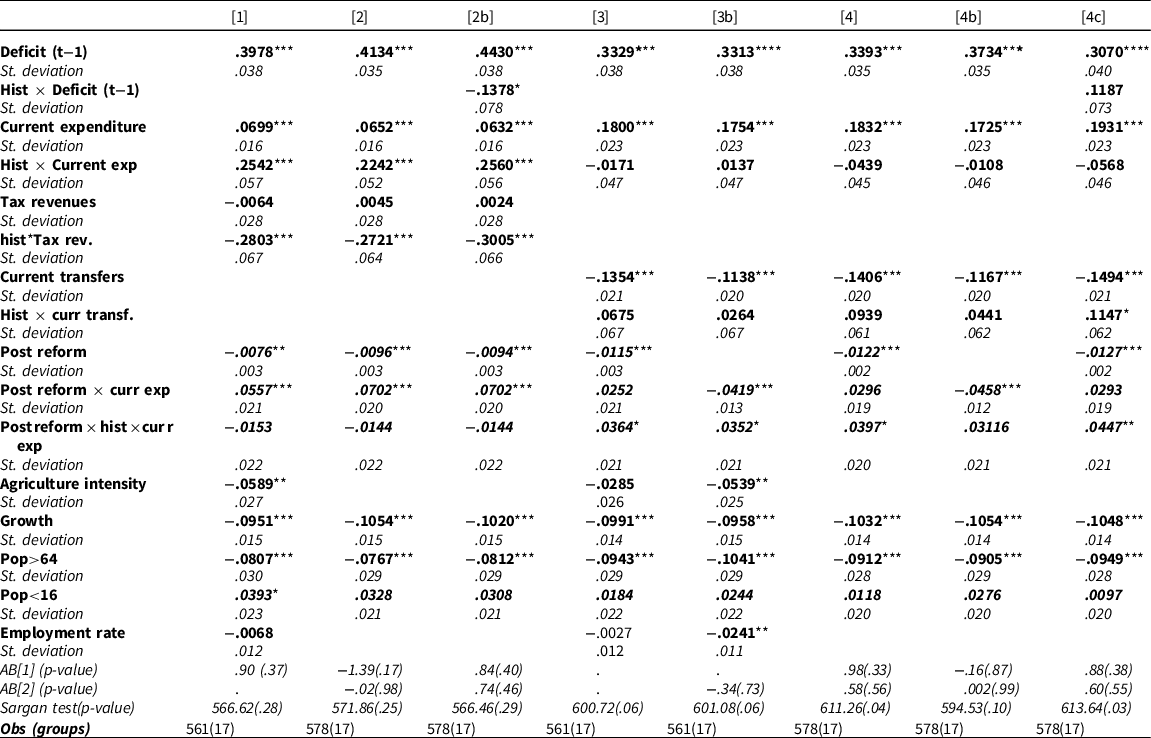
Table 6 shows the results of the regressions which include all 17 Spanish Autonomous regions. Two of these, Basque Country and Navarre, are the so-called “historic regions” and are subject to a different financing system that remained unchanged following the 2002 reform. The models include the interaction of a dummy variable called hist, which identifies the historic regions, with the fiscal variables included in our study. Moreover, we also interacted this dummy with the interaction term Post reform × current expenditure, which we analysed in Table 4. The latter three-term interaction variable indicates differences in the transmission of expenditure to deficit between the two historic regions and the other 15 regions in the post-reform period.
Determinants of primary deficit before and after the reform of the financing system. Estimation of baseline models including autonomous regions outside the general scheme
*, **, and *** indicate statistical significance at the ten, five, and one percent levels, respectively.
Given that the “group” of historic regions is limited to two, we must be cautious when interpreting the results in Table 6. Despite being aware of this limitation, we proceed here to treat them as our control group.
Models [1], [2], and [2b] omit current transfers. Model [2b] includes the interaction term between hist and last-period deficit (Deficit (t−1)). The introduction of the latter variable does not produce relevant variations in other coefficients, and it is only significant at the 10% level. Models from [3] to [4c] omit tax revenues, [3b] and [4b] omit the dummy variable Post reform but retain the interaction term with current expenditure. Finally, model [4c] includes, again, the interaction hist × Deficit (t−1).
The sign and significance of variables already present in Table 4 are maintained here. The first result to highlight is the non-significance of the interaction term Post reform × hist × current expenditure.Footnote 5 This supports the use of this group of regions as the control, as it sustains that this group did not experience a breakpoint during the time-period when the financing system reform entered into force. Second, the interaction term hist × tax revenues is negative and significant, meaning that equal size increases in tax revenues translate into larger deficit reductions in the historic regions compared to the other regions in the entire analysis period. Instead, hist × current transfers is non-significant. Finally, hist × current expenditure is only (highly) significant when current transfers is the omitted variable. When this is the case, the sign is positive, and the coefficient is relatively large. This suggests that, over the entire period under analysis, the historic regions had a stronger budget constraint than the other regions. For instance, in model [1], the entire coefficient of current expenditure for the historic regions is .3241 (i.e. .2542+.0699), compared to .0699 for the other regions.
Estimation results reveal that both fiscal variables, current expenditures, and tax revenues were significantly larger in absolute value in the historic regions before the reform of the financing system, but there was no statistically significant difference in the post-reform period. There is no relevant gap, however, in the lag of the dependent variable.
These results are fully compatible with our main hypothesis. The two historic regions collect taxes in their territories, but under the same regulation used by the central government in the rest of the country. The income of the historic regions does not depend on the financing system applied to the other 15 regions, but mostly depends on the evolution of tax revenue. This explains the stronger impact of the current expenditures variable during the first period, as it was unlikely that unexpected expenditure needs would be covered by discretional transfers from the central government. This gap, however, fades out in the second period, when the revenues of the other regions also depended more strongly on a methodic procedure based on tax revenues and socioeconomic variables rather than on makeshift distribution criteria.
Spatial dependence
Alternatively, a different methodological approach examines the persistence of the results to the introduction of spatial dependence between the variables. This involves some degree of “contagion” between regions with fiscal variables that may depend both on the value of the control variables of the reference region and on the evolution of the same fiscal variables in other regions. Based on the results of preliminary estimates and their specification tests, we used the Spatial Autoregressive model (SAR) in which a spatial lag of the dependent variable is introduced into the set of explanatory variables. Otherwise, the model conserved the assumed dynamics and the control variables are identical to the model in Equation (1):
 $$defici{t_{it}} = dW\,\,defici{t_{jt}} + {\beta _1}current\_expenditur{e_{it}} + {\beta _2}incom{e_{it}} + \gamma \,{m_{it}} + {\mu _i} + {\varepsilon _i}$$
The coefficient δ represents the indirect effect on region “i” of alterations to the dependent variable in other regions “j”, in addition to the direct effect caused by the remaining control variables. The weighting matrix W represents the distance, or the relative importance, of these contagion effect across regions. In this model, the matrix W is constructed using the physical distance between the capital cities of each region.Footnote 6 The effects analysed in equation (2) are called indirect global effects,Footnote 7 and are propagated between all units (regions) even if the value of wij is zero (see Elhorst Reference Elhorst2012).
Results
Table 7 reports the outcome of the estimation of the spatial model described by equation (2), using a distance matrix constructed from the inverse of the great circle distance between the capital cities of each region. Here, the value of the dependent variable in a given region depends on the value of the control variables in that region and on the value of the dependent variable (deficit) in the other regions weighted by the distance separating them.Footnote 8 This is the Spatial Autoregressive model (SAR) which captures imitation between regions as well as shocks for which the intensity is related to their geographical situation. These estimates were obtained using the same GMM Arellano-Bond estimator used in previous sections, under identical assumptions regarding endogeneity and dynamics.
Determinants of primary deficit. Spatial dynamic panel data
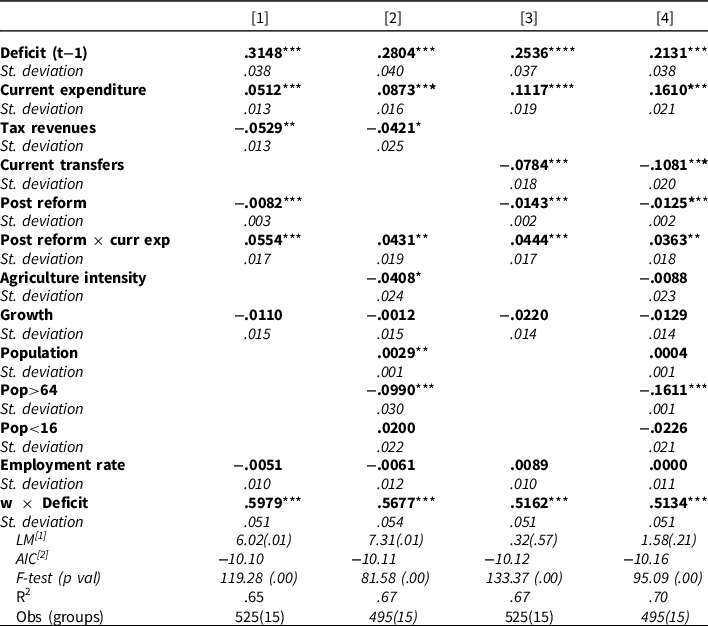
*, **, and *** indicate statistical significance at the ten, five, and one percent levels, respectively.
The main conclusions regarding the variable of interest remain unchanged, since the size and significance of the coefficients for current expenditure are similar to those in Table 4. This is also valid for the other two fiscal variables, while the coefficient for the dynamic component is slightly smaller. The impact of current expenditure on fiscal deficit is, therefore, stronger after the financing system reform.
Regarding other control variables, the situation is similar to that of Table 4, with the exception of the variables agriculture intensity and growth, which become statistically insignificant in this table, but which exhibit remarkable levels of significance in Table 4.
Finally, the coefficient for the spatially lagged value of the dependent variable is statistically significant and of similar size in all versions of the model. This reveals the existence of a strong imitation effect or regional contagion of shocks affecting the dependent variable. There is no possible interpretation, however, for the size of this coefficient, as it is affected by the weighted matrix and its row-normalisation process.
Deficit and debt per capita as dependent variables
Determinants of primary deficit per capita before and after the reform of the financing system. Dynamic panel data estimates
*, **, and *** indicate statistical significance at the ten, five, and one percent levels, respectively.
Determinants of regional public debt per capita at constant prices. Dynamic panel data estimates
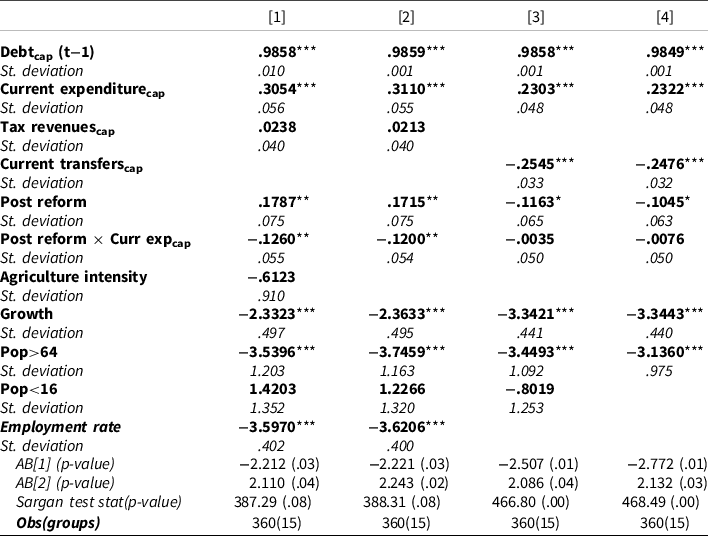
*, **, and *** indicate statistical significance at the ten, five, and one percent levels, respectively.
Determinants of regional current expenditures and transfers per capita at constant prices. Dynamic panel data estimates
*, **, and *** indicate statistical significance at the ten, five, and one percent levels, respectively.
Current expenditure and current transfers per capita as dependent variables
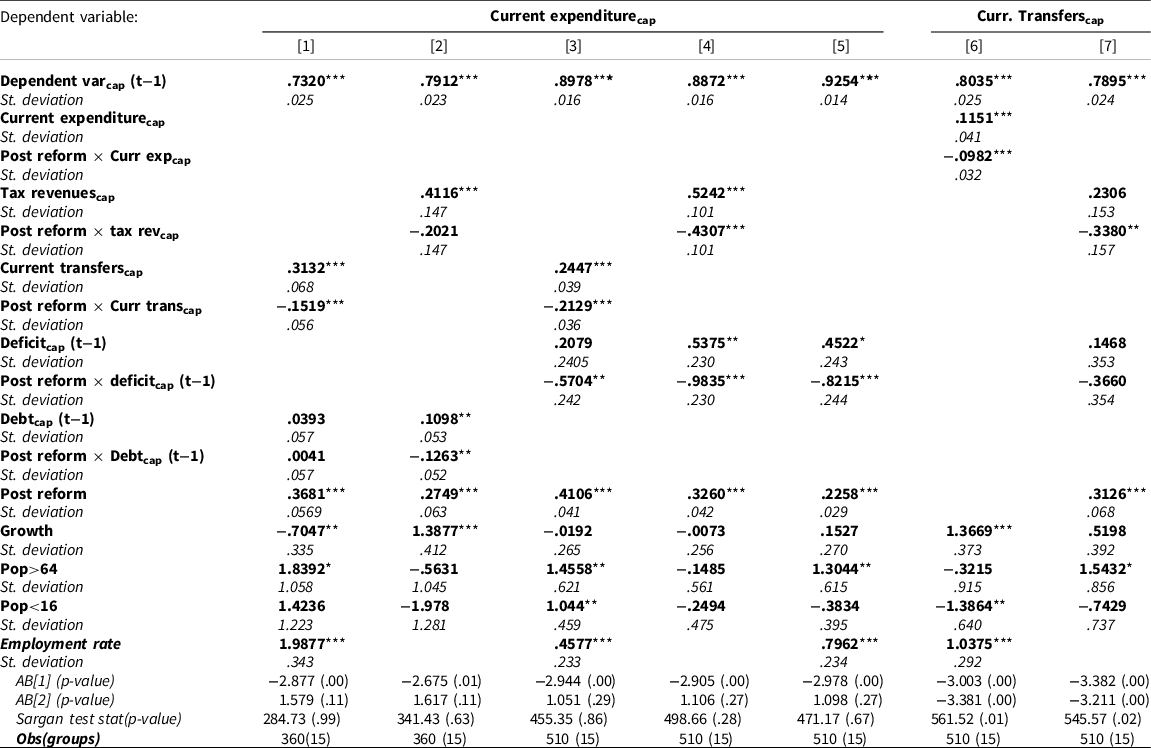
Dumitrescu–Hurlin tests for causality in panel data determine a two-way causality between our variables. In all tests for current transfers and primary deficit, and for current expenditure and primary deficit, the null hypothesis that x does not Grange-cause y is rejected at 5% level of confidence. The test also rejects the null hypothesis for debt and current expenditure, although the rejection is only at the 10% level of confidence when x is current expenditure and y is debt, all in per capita terms. As we explain in “Modelling”, all our regression models have been designed with this in mind and control for endogeneity. Nevertheless, as a robustness check, this section reports the results for what we called the “reverse” models.
Table 10 shows the results of the regressions when we use regional governments’ current expenditure (Models [1] to [5]) and current transfers from the central government to the regional governments (Models [6] and [7]) as the dependent variable. These alternative dependent variables and the fiscal accounts used as regressors are all in per capita terms.
In “Modelling”, we argued one must be cautious when relying on the results in Table 10. This said, we conclude that the estimated coefficients sustain our main result: the budget constraint is harder in the post-reform period. Specifically, the increase of current transfers per capita after the reform imply a smaller increase in current expenditure compared to the pre-reform period. Moreover, a larger deficit or debt at t-1 implies a reduction of the current expenditures at t (See Models [1], [2], and [3]). Model [4] shows how increases in tax revenues are used to increase public expenditures much less after the reform. Hence, they are used to contain the deficit.
In Model [6], current expenditure and the interaction term between it and the post-reform dummy are the regressors. We see that, after the reform, the increase of current expenditure motivates a smaller increase in current transfers. Finally, Model [7] regresses current transfers on tax revenues and lagged primary deficit and their interaction terms with the post reform dummy variable. It seems that, after 2001, increases in tax revenue translate into decreases in current expenditure. Most probably, the extra income is used to contain deficit. Indeed, although the coefficient is not significant, last period increases of deficit imply reductions in today’s current transfers.


 Open access