


Introduction
Long-distance migratory shorebirds are highly dependent on strings of adequate habitats for their survival, not least the wintering sites where they spend most of the year. Recent international counts have raised concerns about declines in shorebird populations along flyways worldwide (Conklin et al. Reference Conklin, Verkuil and Smith2014, van Roomen et al. Reference Roomen, Nagy, Foppen, Dodman, Citegetse and Ndiaye2015, Piersma et al. Reference Piersma, Lok, Chen, Hassell, Yang, Boyle, Slaymaker, Chan, Melville, Zhang and Ma2016). This includes the East Atlantic Flyway, where apparent problems occur at listed World Heritage Sites such as the Wadden Sea in western Europe and the Parc National du Banc d’Arguin in Mauritania (Boere and Piersma Reference Boere and Piersma2012, van Roomen et al. Reference Roomen, Nagy, Foppen, Dodman, Citegetse and Ndiaye2015). Much of the research and long-term surveys along the East Atlantic Flyway have been conducted at staging sites on the European coast; data from the sub-Saharan wintering sites are scarce.
The Banc d’Arguin (Figure 1) includes about 500 km2 of intertidal mudflats and harbours more wintering shorebirds than any other place along the East Atlantic Flyway (Engelmoer et al. Reference Engelmoer, Piersma, Altenburg, Mes, Evans, Goss-Custard and Hale1984, Delany et al. Reference Delany, Scott, Dodman and Stroud2009); it also provides the resources for Arctic- and temperate-breeding shorebirds to prepare the fuelling for the first leg of the spring migration (Ens et al. Reference Ens, Piersma, Wolff and Zwarts1990). The area also has the largest breeding colonies of seabirds in West Africa (Campredon Reference Campredon2000). Yet, little is known about the dynamics of bird populations at Banc d’Arguin.
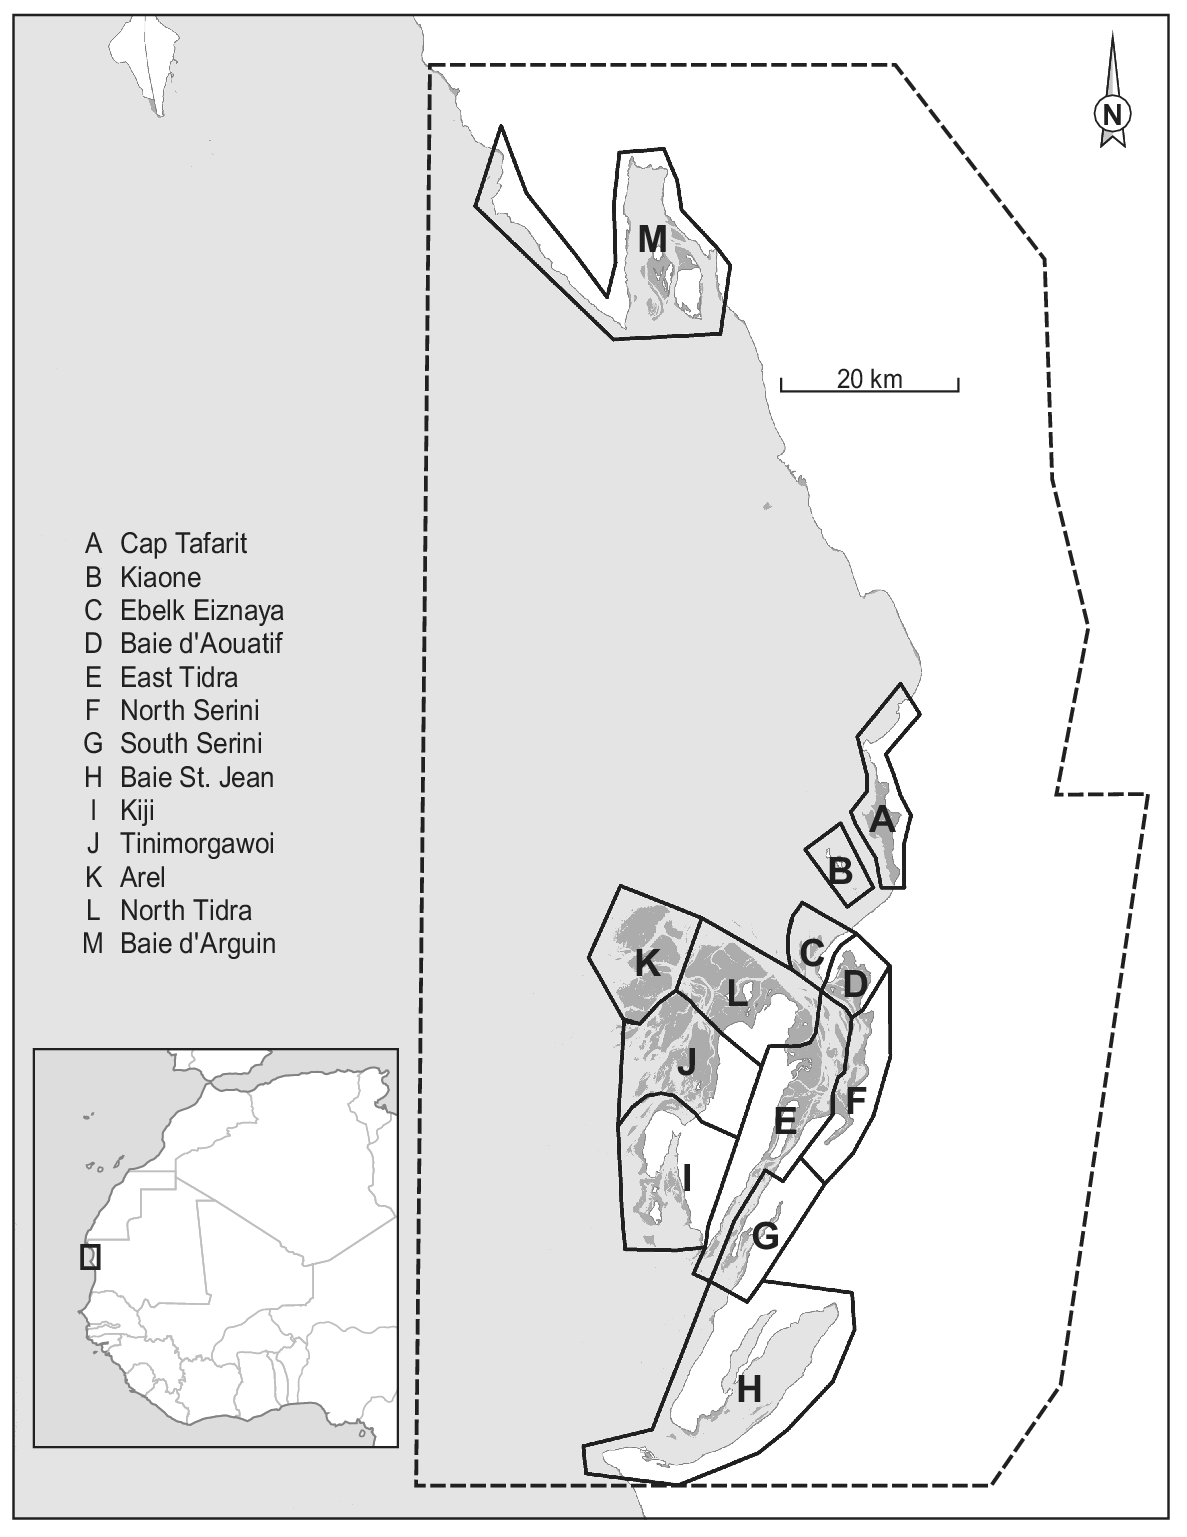
Map of Parc National du Banc d’Arguin, Mauritania, with dark grey representing intertidal flats, light grey depicting the sea, and white colour showing the land. The dashed line represents the Park boundary. The division into 12 sections (A to L) is based on Zwarts et al. (Reference Zwarts, Van Der Kamp, Overdijk, Van Spanje, Veldkamp, West and Wright1998a). The underlying map is based on publicly available Landsat imagery. The Iwik region is defined as the combined sections C and D.
Two different waterbird groups use the Banc d’Arguin either as a wintering or as a breeding area (see Table S1 in the online supplementary material for details): (1) birds that breed in the Arctic, subarctic, and temperate regions and spend the winter in the area, a group dominated by intertidal-feeding shorebirds (Charadrii) (Wymenga et al. Reference Wymenga, Engelmoer, Smit and Van Spanje1990), and (2) Afrotropical birds that breed in the area and migrate south afterwards, most of which are fish-eaters. The latter group includes two endemic subspecies that remain at Banc d’Arguin throughout the year: The populations of Mauritanian Spoonbill Platalea leucorodia balsaci (Piersma et al. Reference Piersma, Van Der Velde, El-Hacen, Lok and Overdijk2012) and Mauritanian Grey Heron Ardea cinerea monicae.
Since the first complete shorebird count in January/February 1980 (Altenburg et al. Reference Altenburg, Engelmoer, Mes and Piersma1982), six more complete winter counts have been conducted: in 1997 (Zwarts et al. Reference Zwarts, Van Der Kamp, Overdijk, Van Spanje, Veldkamp, West and Wright1998a), 2000 (Hagemeijer et al. Reference Hagemeijer, Smit, De Boer, Van Dijk, Ravenscroft, Van Roomen and Wright2004), 2001, 2006 (Diagana and Dodman Reference Diagana and Dodman2006), 2014 (van Roomen et al. Reference Roomen, Nagy, Foppen, Dodman, Citegetse and Ndiaye2015), and 2017 (Kidé and Diakhite Reference Kidé, Diakhite, Agblonon, Nsabagasani, Langendoen and Roomen2017). In addition to the integral counts, in the Iwik region (sections C and D in Figure 1) winter counts were performed each year by NIOZ/PNBA teams from December 2003 onwards (see e.g. van Gils et al. Reference Gils, Geest, Leyrer, Oudman, Lok, Onrust, De Fouw, Van Der Heide, van den Hout, P, Spaans, Dekinga, Brugge and Piersma2013). Except for a comparison between the two counts of 1980 and 1997 (Zwarts et al. Reference Zwarts, Van Der Kamp, Overdijk, Van Spanje, Veldkamp, West and Wright1998a), the counts and possible changes in waterbird numbers since the 1980s have never been analysed.
Here, we report on the changes in waterbird numbers in the Banc d’Arguin over the last four decades. Our objectives were to evaluate changes in species abundances and bird community composition between 1980 and 2017, with a first discussion of possible local and global ecological drivers of these changes. We also reflect on the required frequency of future counts to allow better inferences on the cause of change in the waterbird community.
Methods
Study area
The Parc National du Banc d’Arguin, Mauritania (Figure 1) is the largest marine protected area in Africa with an area of 12,000 km2. The marine part (half of the protected area) is characterised by shallow waters (< 20 m; Sevrin-Reyssac Reference Sevrin-Reyssac1993), extensive intertidal flats (453 km2; calculation based on Murray et al. Reference Murray, Phinn, Dewitt, Ferrari, Johnston, Lyons, Clinton, Thau and Fuller2019), and over 15 differently sized uninhabited islands (Campredon Reference Campredon2000). Shorebirds find predictable intertidal feeding habitats adjacent to relatively undisturbed islands for roosting, while seabirds use these islands for breeding, and feed in the subtidal and offshore areas that are known to be rich in fish (Guénette et al. Reference Guénette, Meissa, Gascuel, Froese and Torres2014) and shrimp (Schaffmeister et al. Reference Schaffmeister, Hiddink and Wolff2006). The area borders the Sahara, with no large alternative feeding grounds for shorebirds in the vicinity (the Bijagós Archipelago is 1,000 km to the south). This isolation emphasises the crucial importance of this area for waterbirds.
Our study area comprises the central part of Banc d’Arguin (Figure 1; about 1,500 km2). It includes > 90% of the intertidal area and > 95% of the total bird numbers in the Parc (Zwarts et al. Reference Zwarts, Van Der Kamp, Overdijk, Van Spanje, Veldkamp, West and Wright1998b). Baie d’Arguin (section M in Figure 1) was not visited on all counts and was not included in this analysis.
Bird surveys
The first bird count of Banc d’Arguin was carried out in 1973 and covered only part of the area (Knight and Dick Reference Knight and Dick1975), as was the case during a second attempt in 1978 (Trotignon et al. Reference Trotignon, Baillou, Dejonghe, Duhautois and Lecomte1980). Building on these experiences, seven more or less complete winter counts of the Banc d’Arguin have been carried out in January/February, and are included in this analysis: 1980, 1997, 2000, 2001, 2006, 2014, and 2017.
All counts were carried out in periods centred on dates of spring tide and used similar tools (telescopes and binoculars) to estimate bird numbers at high-tide roosts. The study area was divided into twelve different sections (Figure 1; Zwarts et al. Reference Zwarts, Van Der Kamp, Overdijk, Van Spanje, Veldkamp, West and Wright1998a), each subdivided into 2–12 counting units. To minimise the influence of shifts in the use of high-tide roosts by individual birds, counting units within a section were usually counted on the same or successive dates. In the 2006 count, the channel between the mainland and the island of Tidra was not visited. In some of the other counts, a few counting units were not covered adequately. Bird numbers in these counting units were replaced by numbers observed there during the nearest successful count, corrected for between-year differences in the species’ overall totals on the Banc d’Arguin. About 8% of the total waterbird number and between 3% and 25% (mean 8%) of the totals per species were thus imputed in 2017, and 3% (0–15% by species) in 2014. The slight dependency that this causes between data points reduces the accuracy of the statistical analysis, but we decided that this would be less problematic than using incomplete counts.
From December 2003 onward, annual complete counts were made in Baie d’Aouatif and Ebelk Eiznaya (sections C and D in Figure 1), hereafter collectively called the Iwik region (NIOZ, unpublished data). These counts were carried out on a single date close to spring tide in December or January.
Data analyses
In the analyses, we combined Western Reef Heron Egretta gularis and Little Egret E. garzetta as a single taxon, as they were not distinguished properly in most counts. For the same reason the following (sub)species were analysed together: all large falcons Falco spp. (Peregrine F. peregrinus, Barbary F. pelegrinoides, Lanner F. pelegrinoides, and Saker F. cherrug), Mauritanian Spoonbill Platalea leucorodia balsaci with Eurasian Spoonbill leucorodia, and the Mauritanian Grey Heron Ardea cinerea monicae with European Grey Heron cinerea. Little Tern Sterna albifrons was omitted from the analyses because its numbers fluctuated excessively, by more than a factor 10.
Changes in waterbird numbers over time were assessed by linear regressions on the totals of the seven complete counts as well as of each of the 32 common waterbird species in the area (Table S1). Trends in the yearly count in the Iwik region between the winters of 2003/2004 and 2016/2017 were inspected for linear trends in the same way and compared with the trends for the whole Banc d’Arguin. Furthermore, relative population growth rate (calculated as the slope of the linear regression of population size over time, divided by the mean population size) was calculated for both the seven complete counts and the Iwik yearly counts. Spearman’s rank correlation test was performed to determine possible correlations between relative population growth rates in the Iwik region and in the whole Banc d’Arguin.
Permutational multivariate analysis of variance (PERMANOVA) was used to evaluate the effect of time and region (sections in Figure 1) on Euclidean distance matrix of species composition with 9,999 random permutations (Anderson Reference Anderson2017). Furthermore, factors that showed significance in the PERMANOVA were visualised with non-parametric multidimensional scaling (NMDS) based on Bray-Curtis distance matrices of species composition (Clarke Reference Clarke1993, Legendre and Legendre Reference Legendre and Legendre2012). The count of Kiaone region (section B in Figure 1) was omitted from these analyses because of missing data. Sections C and D as well as G and F were combined to represent Iwik and Serini regions, respectively, because they were not counted separately in all years.
Finally, the effects of various ecological variables on population dynamics were explored by comparing the explanatory power of a series of linear models, using each of the common bird species as one sample. Relative population growth rate was used as the response variable. The explanatory values we chose were based on the lifestyle at Banc d’Arguin and during the rest of the annual cycle. For the time at Banc d’Arguin we considered habitat and diet, for the rest of the year we considered whether or not a species was migratory and the details of the staging and breeding grounds used. Specifically, the tested explanatory variables included “Habitat” (relating to the foraging habitat; either subtidal/pelagic or intertidal), “Diet” (the diet outside the breeding season, split into five categories: fish, molluscs, crustaceans, worms, algae, or mixed), and three two-level variables that together distinguish between different migratory strategies. These are “Breeding” (whether or not birds breed in Africa: Southern or Northern breeders), “Siberia” (whether or not Northern birds breed in Siberia), and “Wadden Sea” (whether or not birds migrate via the Wadden Sea). The categorisation of each variable in all species can be found in Table S1. We tested for dependency between all pairs of explanatory variables by calculating the Pearson correlation coefficient. We compared linear regression models with all potential combinations of these variables, using corrected Akaike’s Information Criterion (AICc) to select the most parsimonious model (Burnham and Anderson Reference Burnham and Anderson2002). To limit the number of models in the comparison, we did not consider any interactions between variables.
Results
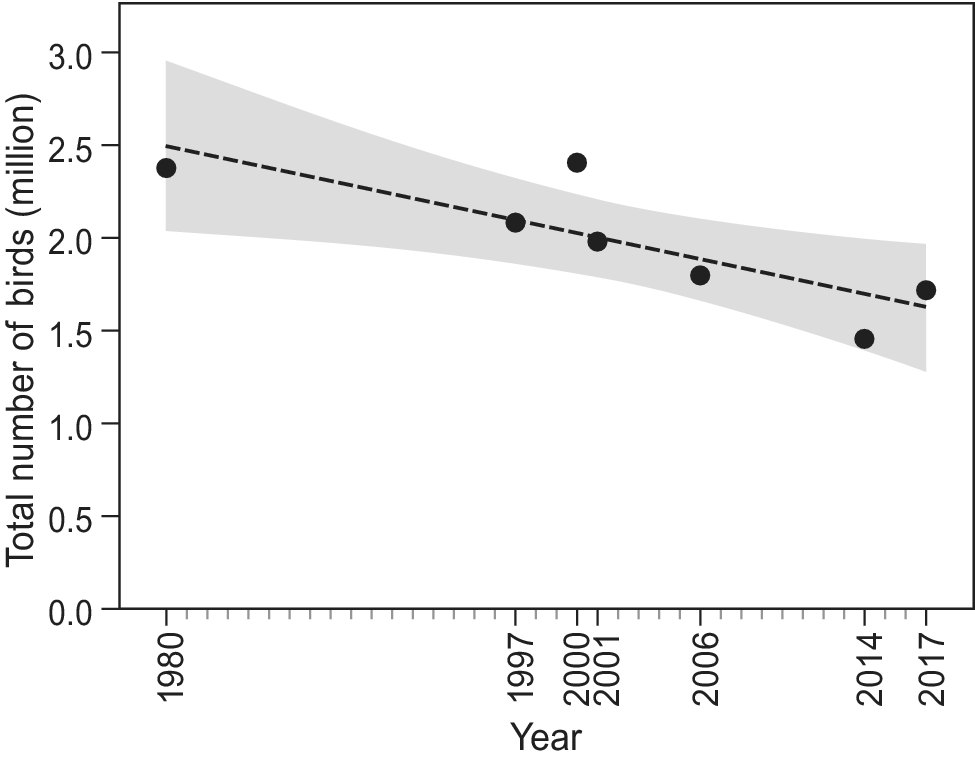
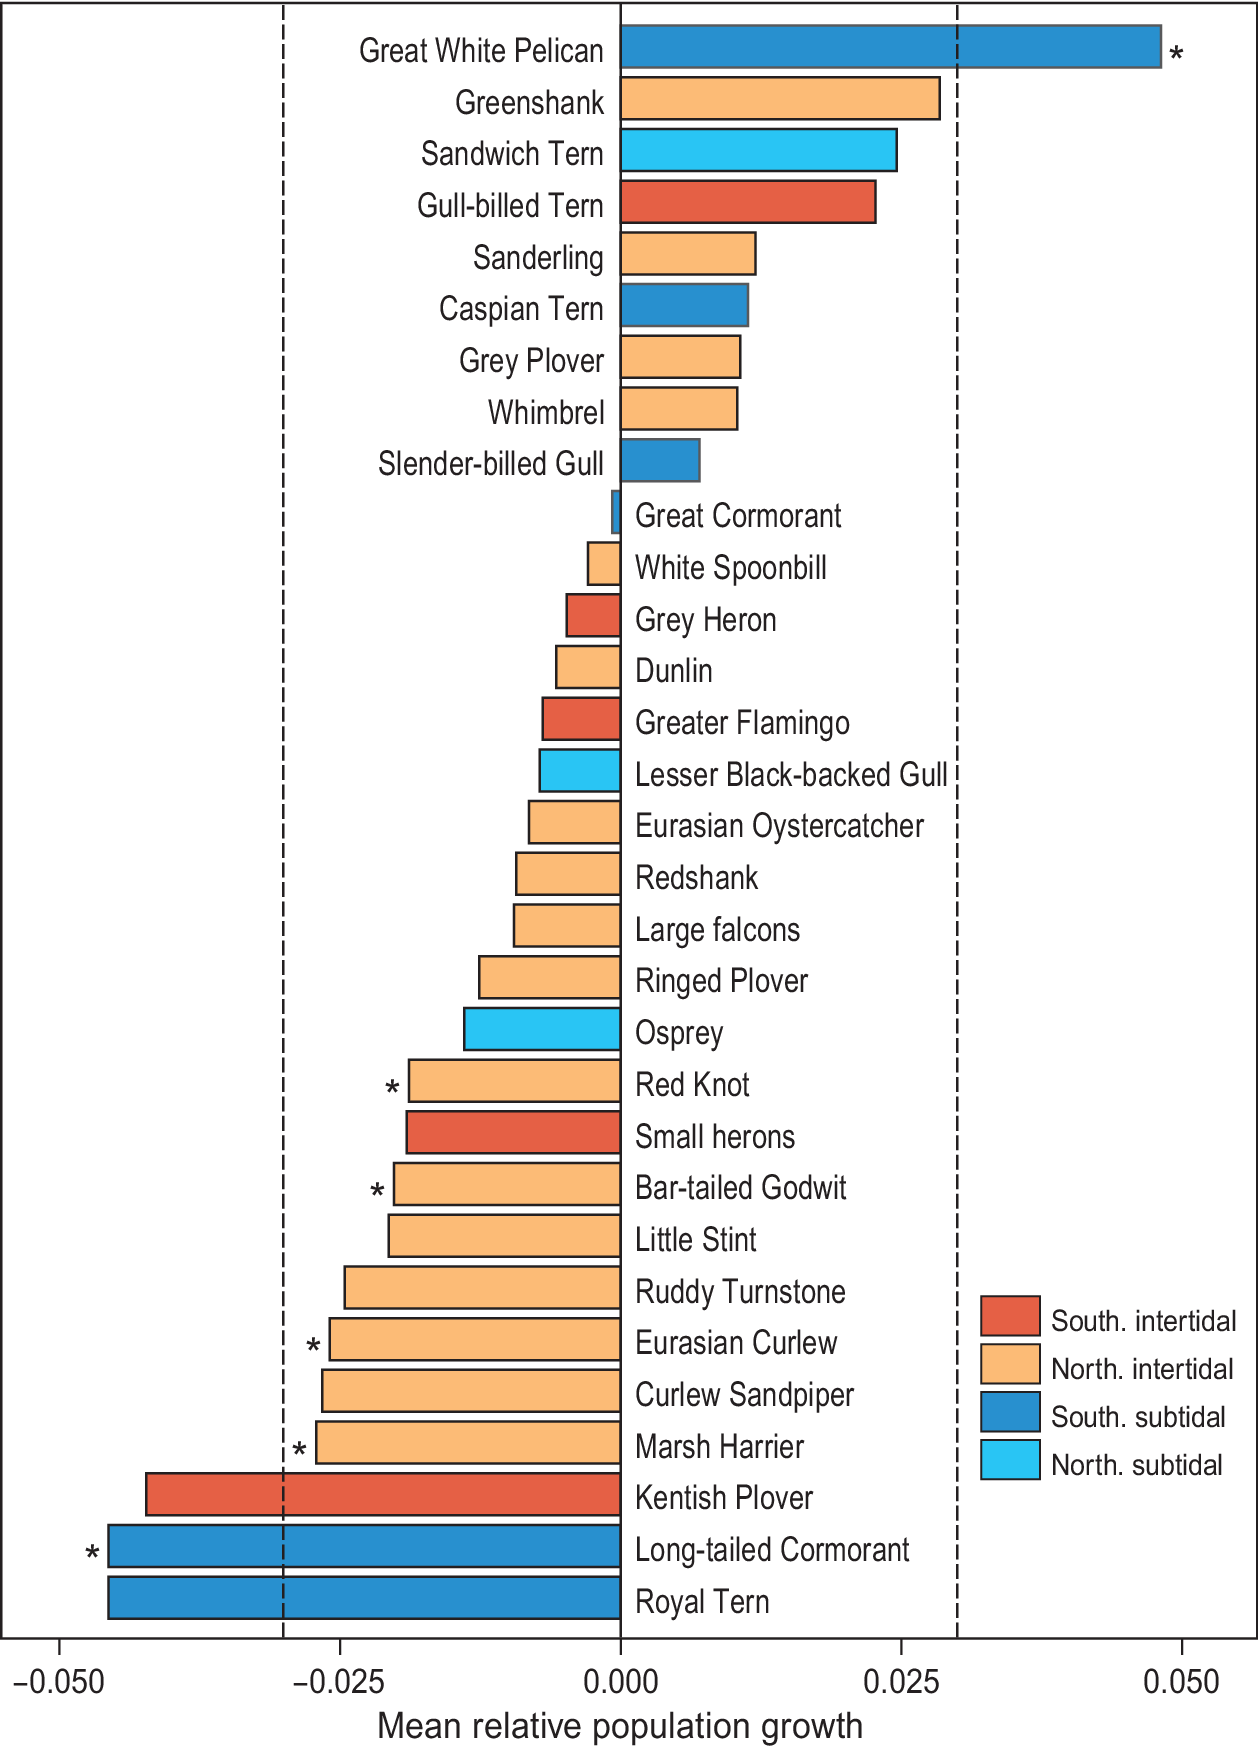
Since the first count of 1980, which yielded an estimated total of 2.38 million waterbirds, the total number of birds has shown a significant decline (F1,6 = 10.6, R2 = 0.61, P = 0.02; Figure 2). Over the study period, 22 species showed a negative trend, while nine other species showed an increase (Figure 3). However, trends were only significant in six species, five of which showed a decline (Long-tailed Cormorant Phalacrocorax africanus, Western Marsh Harrier Circus aeruginosus, Red Knot Calidris canutus, Eurasian Curlew Numenius arquata, and Bar-tailed Godwit Limosa lapponica), and one an increase (Great White Pelican Pelecanus onocrotalus (F1,6 = 6.8, R2= 0.49, P = 0.048; Table S1).
Total waterbird numbers over time in Banc d’Arguin based on seven complete counts in January and/or early February. Shaded area shows the 95% CI.
Waterbird dynamics, expressed as mean relative growth rate, in Banc d’Arguin between 1980 and 2017. The red bars represent Southern breeding intertidal foraging species, orange Northern breeding intertidal foragers, dark blue Southern breeding subtidal foragers, and turquoise bars represent Northern breeding subtidal foragers. Spoonbill includes the Mauritanian subspecies Platalea leucorodia balsaci with Eurasian Spoonbill P. l. leucorodia. Grey Heron includes the Mauritanian Grey Heron Ardea cinerea monicae with European Grey Heron A. c. cinerea. Small herons include Western Reef Heron Egretta gularis and Little Egret E. garzetta.
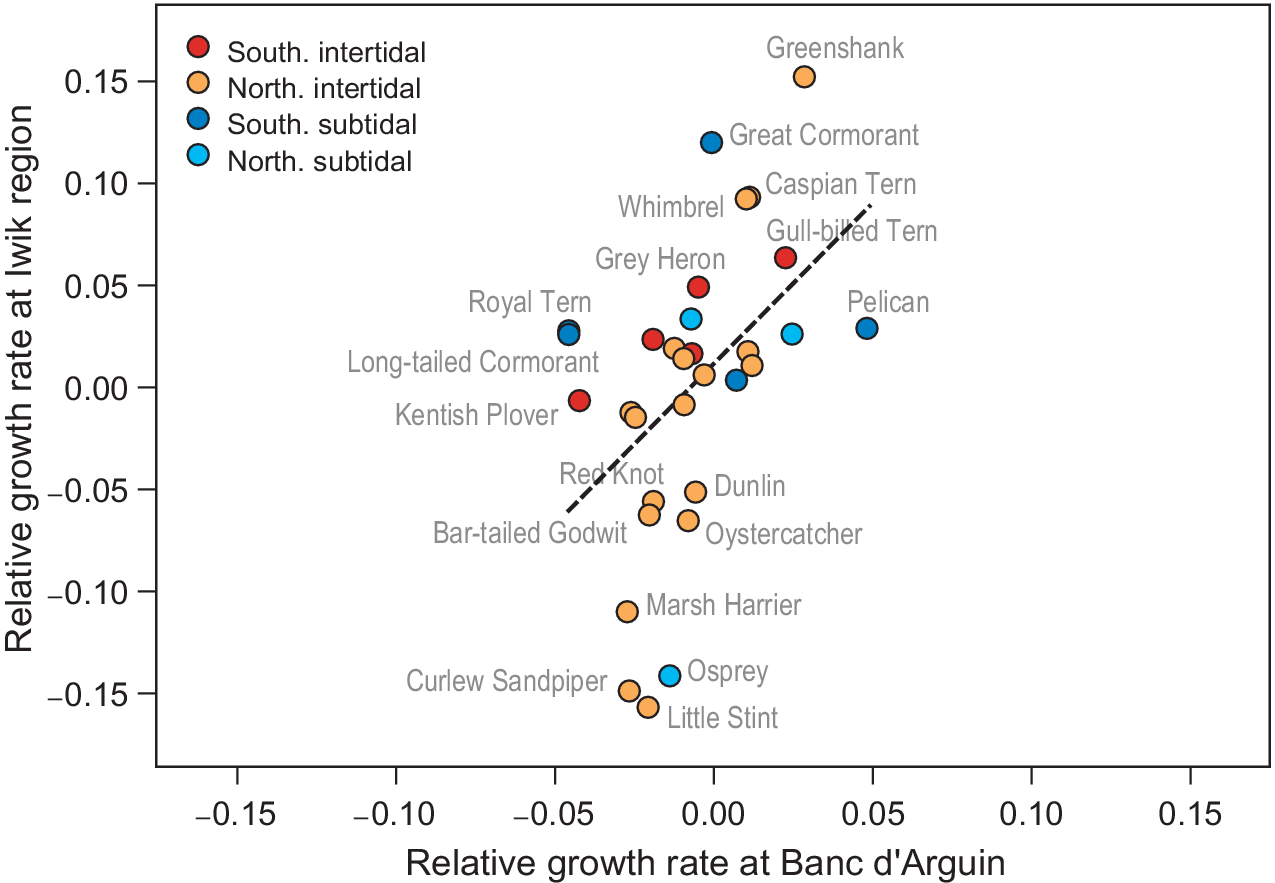
In the yearly counts of Iwik region, nine species showed significant trends (Table S2): three species increased (Grey Heron, Common Greenshank Tringa nebularia, and Whimbrel Numenius phaeopus), and six species decreased (Marsh Harrier, Osprey Pandion haliaetus, Oystercatcher Haematopus ostralegus, Curlew Sandpiper Calidris ferruginea, Red Knot, and Bar-tailed Godwit). We found a significant positive association between relative population growth rates in Iwik region and those of Banc d’Arguin as a whole (Spearman rank correlation, rs = 0.55, P = 0.001; Figure 4).
Correlative trends in population growth per species compared between the total Banc d’Arguin (x-axis) and the Iwik region (y-axis). Each point is one species. The red/orange points are intertidal foraging species and the blue/turquoise points are subtidal foragers. The two rates show a positive correlation (Spearman rank correlation, rs = 0.55, P = 0.001, dashed line). Banc d’Arguin growth rates are measured from 1980 to 2017, and Iwik growth rates from 2003 to 2017.
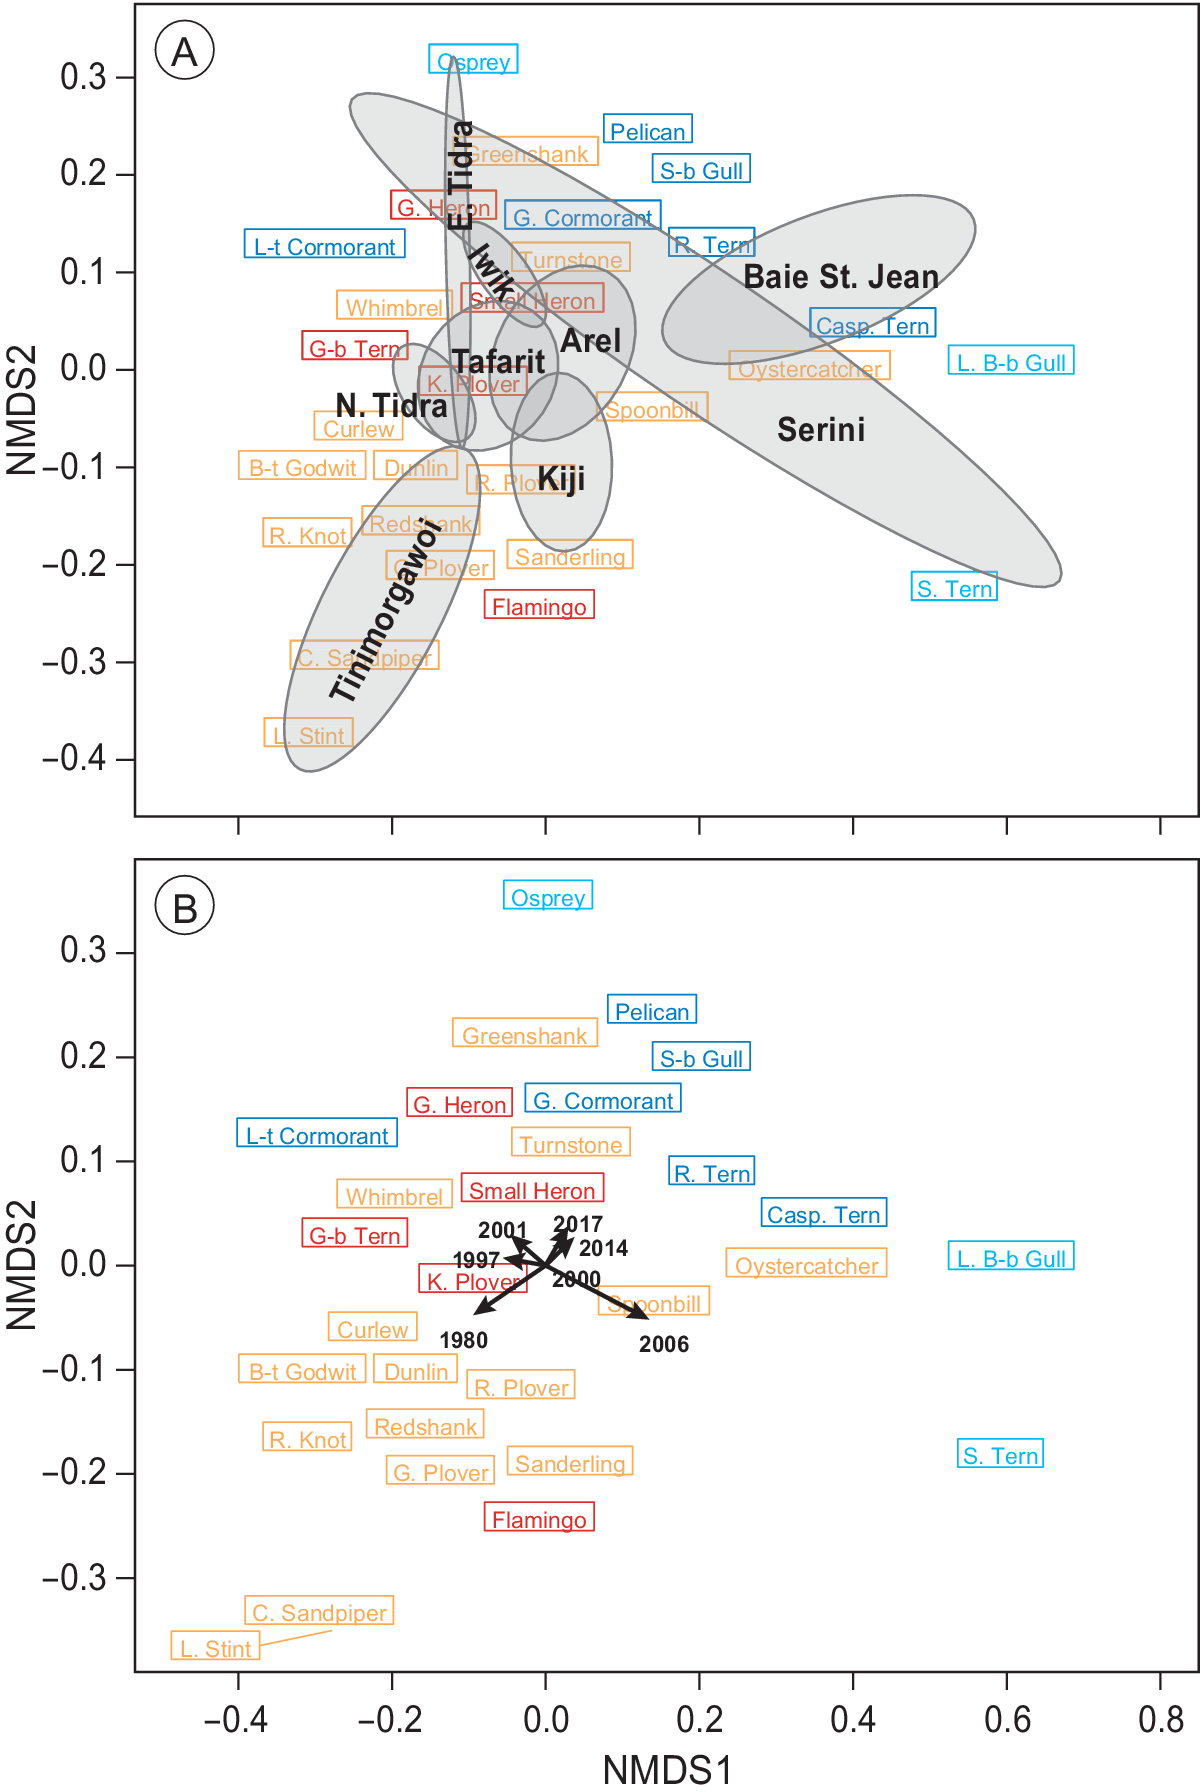
The PERMANOVA analysis revealed that species composition was significantly affected by both time (F (6, 65) = 1.2, P = 0.002) and region (section; F (8, 65) = 9.2, P < 0.001), but not their interaction (P > 0.05). These spatial and temporal dissimilarities in species composition were further corroborated with an NMDS ordination (Figure 5), which demonstrated a clear segregation between regions (Figure 5a) as well as between the early counts and the more recent ones (Figure 5b). The observed segregations (stress = 0.09) were caused mainly by changes in communities of intertidal-dependent vs. sublittoral-dependent species (Figure 5).
Non-parametric NMDS ordination analysis of all species per section in all seven years. Species that are plotted close together (centre of rectangle denotes position on the plane) tend to show the same spatial and temporal abundance patterns. Subtidal/pelagic foragers are shown in blue/turquoise and intertidal species in red/orange. (a) Mean positions of the different sections are shown in black including their convex hull. (b) Mean positions of the different counts are plotted including vectors indicating the position of the different years. Lengths of vectors indicate the significance of year parameter. Sections C and D as well as G and F (Figure 1) were combined to represent Iwik and Serini regions, respectively.
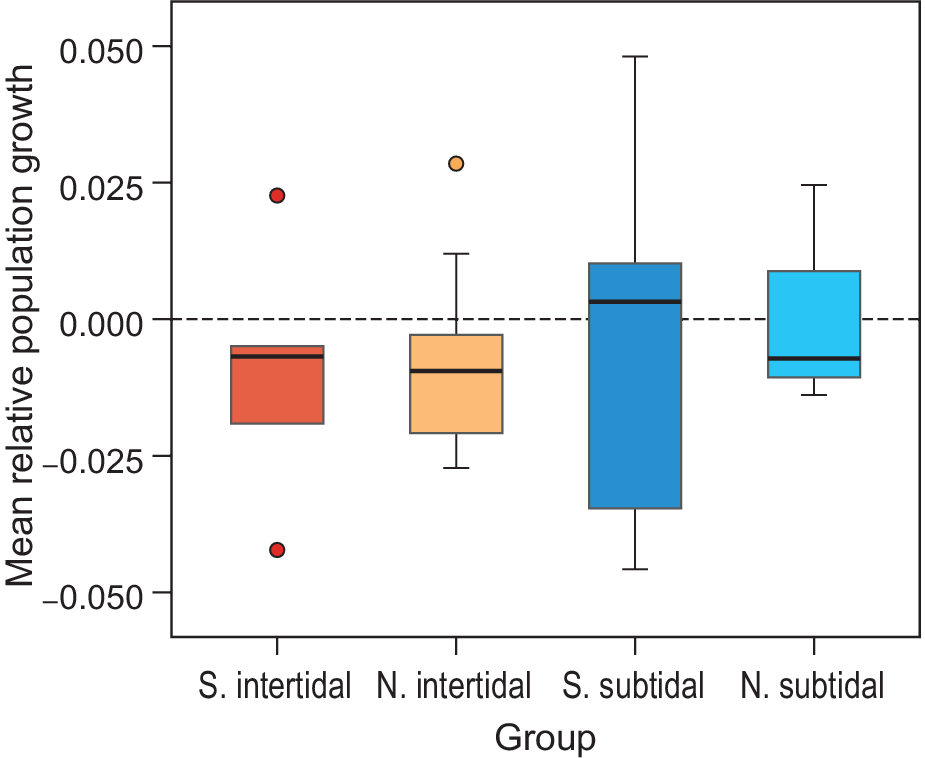
The mean relative growth rate of all waterbird populations combined also showed a general decrease, but not significantly so (mean -0.007, SE = 0.003, P > 0.05; model 1 in Table S3). The African-breeding subtidal bird populations showed a median relative growth rate just above zero, while northern-breeding subtidal birds and both northern- and African-breeding intertidal birds showed a negative median growth rate (Figure 6). These differences were not significant (Table S3). Other explanatory variables (Diet, Wadden Sea usage, and whether birds breed in Siberia or not) did not correlate with the observed growth rates (Table S3). None of the pairs of explanatory variables were highly correlated; all Pearson correlation coefficients were below 0.5, except for the pair Habitat-Diet, which was 0.57.
Mean relative growth rates per species guild. The average trend over all common species is significantly negative. This appears to be due to intertidal species (red/orange) and not the subtidal/pelagic fish eaters (red/turquoise). Northern (N.) and Southern (S.) breeding species show similar trends for both intertidal feeders and seabirds.
Discussion
Since the first complete count in 1980, the total number of waterbirds at Banc d’Arguin has been in decline. Red Knot, Bar-tailed Godwit, Eurasian Curlew and Marsh Harrier all decreased by 50% or more in less than four decades. The strongest decline was shown by the piscivorous Long-tailed Cormorant, which lost 70% of the population. In contrast, White Pelicans showed a tenfold increase (from 600 to 6,000 birds) in the course of the study period. Other species such as Curlew Sandpiper and Royal Tern Thalasseus maximus showed strong declines that were not statistically significant (Figure 3).
Sources of uncertainty
We must stress that the results should be interpreted with caution. The chance of the occurrence of a type I error (the observation of a significant change where in fact the population size did not change) is high because we carried out many linear regressions (one for each species), as is the likelihood of a type II error (no significant change in population size observed, where in fact it has changed) due to low sample sizes (seven counts only). In addition, counting up to two million similar-looking waterbirds will always have a substantial error margin, especially in a large and logistically complex area where most high-tide roosts can only be reached by boat, and tidal height has a strong influence on the number and distribution of roosting birds. Consequently, the observed changes in numbers between separate counts may not always represent the true magnitude of changes, as the counts themselves are likely to have large error margins (see Rappoldt et al. Reference Rappoldt, Kersten and Smit1985).
Firstly, the random error in the count estimate of large roosting bird flocks, even by experienced counters, is known to be high (Rappoldt et al. Reference Rappoldt, Kersten and Smit1985 found an average random error of 37%). This error is expected to be cancelled out when counts consist of many counts of small flocks, but flocks on the Banc d’Arguin can be very large, and for several species the totals are dominated by a few large roosts (Altenburg et al. Reference Altenburg, Engelmoer, Mes and Piersma1982, Reference Altenburg, Engelmoer, Mes and Piersma1983). In 2014, for example, 16–43% (mean 27%) of the species totals (both of all common species and of 10 most abundant ones) occurred in the one counting unit with the highest numbers. In 2006, almost 1.1 million birds (more than half of the total count) were counted at Tinimorgawoi (Figure 1), a high sand bank roost west of Tidra.
Secondly, roosting waders at Banc d’Arguin often occur in mixed flocks, leading to potential misidentification of certain species. For instance, it is easy to underestimate less conspicuous and less common species that occur among common ones (e.g. Curlew Sandpipers and Little Stints among flocks of Dunlins). Varying experience of the observers may also influence the results. In addition, some fish-eating species may not be roosting during high tide but continue foraging far from the coast, leading to a variable degree of underestimation. An example is the Long-tailed Cormorant, in which the total observed at high-tide roosts was 2,900 birds in 2017, while 4,100 were seen arriving at their main night roost on the isle of Zira during one dedicated evening count.
Thirdly, combining resident and migratory populations into one taxon might have resulted in misleading outcomes. For example, total Spoonbill numbers (Mauritanian Spoonbill Platalea leucorodia balsaci plus Eurasian Spoonbill P. l. leucorodia) in Banc d’Arguin showed a decrease (Figure 3), while Eurasian Spoonbill numbers showed a profound increase over the last three decades throughout their breeding range (Lok et al. Reference Lok, Overdijk, Hor and Piersma2009, Oudman et al. Reference Oudman, Goeij, Piersma and Lok2017). Thus, the observed decrease in Spoonbill numbers is probably due to a decline in the size of the population of Mauritanian Spoonbills.
Finally, flocks may be counted twice (or not at all) if different roosting areas used by the same birds over time are not counted simultaneously. This source of error is potentially important in Banc d’Arguin because of our limited knowledge of patterns in area use of individual birds in relation to the spatiotemporal variation in tidal levels. This applies particularly to outlying areas such as the region west of Tidra (Sections I and J in Figure 1), where the largest mudflat area and bird numbers occur at Tinimorgawoi. These problems are reduced by counting sections with presumably interconnected roosts on the same day as often as possible, but the scale of the area is such that this is not always feasible; counts of the entire Banc d’Arguin have taken between 10 and 25 days. For a few species, double counts may arise because it is difficult to assess in which counting unit they are. This mainly applies to Flamingos, which often stand far away in shallow water between counting areas, and to White Pelicans of which flocks sometimes spend much of the high-tide period in soaring flight.
However, the fact that similar trends were obtained for both the seven complete counts and the yearly monitoring in the Iwik region (i.e. over a shorter period but with a higher frequency of counts) substantiates our findings. Thus, we conclude that the overall results are likely to represent true changes in the numbers of waterbirds in the area and not changes inherited from the low sample size and counting errors. In addition, the yearly subunit counts prove to be useful in detecting global trends in the numbers of waterbirds, especially in remote and complex systems such as Banc d’Arguin. The yearly subunit counts can be optimized by increasing the number of units to compensate the lack of annual complete counts. Furthermore, some of the above-mentioned issues related to counting schemes may be partly resolved by using consistent counting techniques and by regular training of the observers.
Interpreting trends in bird numbers
From the seven complete counts of the Banc d’Arguin, it is clear that bird numbers are changing in the area, but also that the frequency as well as the accuracy of the counts since 1980 are too low to accurately determine temporal trends with great confidence for most species. Nonetheless, the average relative population growth rate is significantly negative (mean -0.007, SE = 0.003; model 1 in Table S3) and tends to be lower (although not significantly) in intertidal foraging species than for species foraging at sea. This applies to both African breeders and northern migrants. More data are needed to validate this trend and determine whether species staging in the Wadden Sea during migration and breeding in Siberia have lower population growth than other migrants, as has been suggested earlier (e.g. van Roomen et al. Reference Roomen, Nagy, Foppen, Dodman, Citegetse and Ndiaye2015). The observed patterns in northern shorebirds and southern fish-eating migrants are likely caused by different mechanisms related variously to phenomena occurring at Banc d’Arguin or elsewhere along the migration routes.
For shorebirds, the decline within Banc d’Arguin is likely due to food availability changes (van Gils et al. Reference Gils, Van der Geest, Jansen, Govers, De Fouw and Piersma2012). Seagrass cover is known to affect the benthic assemblage in the area (Honkoop et al. Reference Honkoop, Berghuis, Holthuijsen, Lavaleye and Piersma2008), and thus seagrass dynamics may affect shorebirds through a cascading effect on benthic community structure. Seagrass beds are the main primary producer, thus driving the functioning and stability of the intertidal flat communities (Folmer et al. Reference Folmer, Geest, Jansen, Olff, Anderson, Piersma and Gils2012, van der Heide et al. Reference Heide, Govers, De Fouw, Olff, Geest, Kajwijk, Piersma, Koppel, Silliman, Smolders and Gils2012, de Fouw et al. Reference De Fouw, Govers, Koppel, Belzen, Dorigo, Sidi Cheikh, Christiansen, Reijden, Geest, Piersma, Smolders, Olff, Lamers, Gils and Heide2016). Seagrass cover has increased in Banc d’Arguin since the early 1970s as a result of the Sahel drought, resulting in a shift in benthic community from a polychaete-dominated to a bivalve-dominated system (El-Hacen et al. Reference El-Hacen, Sidi Cheikh, Bouma, Olff and Piersmasubmitted), with a sharp decline in worms and the bivalve Dosinia isocardia, and an increase in one prey species, the bivalve Loripes orbiculatus (El-Hacen et al. Reference El-Hacen, Sidi Cheikh, Bouma, Olff and Piersmasubmitted). However, due to the sulphide-based metabolism of Loripes, foragers need other prey species to complement a diet of Loripes (van Gils et al. Reference Gils, Geest, Leyrer, Oudman, Lok, Onrust, De Fouw, Van Der Heide, van den Hout, P, Spaans, Dekinga, Brugge and Piersma2013, Oudman et al. Reference Oudman, Onrust, De Fouw, Spaans, Piersma and Van Gils2014). Indeed, Bar-tailed Godwits and Red Knots, two shorebird species that are known to depend heavily on polychaetes and Dosinia respectively, have declined in Banc d’Arguin according to both the total counts as the yearly Iwik ones. Other polychaete eaters such as Curlew Sandpiper, Kentish Plover, and Ringed Plover have shown a decline as well (Figure 3). A contributing cause of a decline in shorebirds could be a cascading effect of human fisheries on the benthic community. The illegal fishing of Lusitian Cownose Ray Rhinoptera marginata and Bull Ray Pteromylaeus bovinus is expected to have changed the dynamics of seagrass beds. These rays eat the large West African bloody Cockles Senilia senilis, which may outcompete the similarly suspension-feeding Dosinia isocardia, now that their stocks are so much greater (Sidi Yahya et al. in prep.). Previous research has shown that annual Dosinia densities explain year to year differences in the survival of Red Knots (van Gils et al. Reference Gils, Geest, Leyrer, Oudman, Lok, Onrust, De Fouw, Van Der Heide, van den Hout, P, Spaans, Dekinga, Brugge and Piersma2013).
Obviously, beyond local causes, simultaneous changes also occur in other areas along the flyway, yielding regulatory factors which may interact with the factors acting locally (van Roomen et al. Reference Roomen, Nagy, Citegetse and Schekkerman2018). For example, research on Red Knots and Bar-tailed Godwits has shown that rapid climate warming in the High Arctic region of Russia is involved in their population declines (van Gils et al. Reference Gils, Lisovski, Lok, Meissner, Ozarowska, De Fouw, Rakhimberdiev, Soloviev, Piersma and Klaasen2016, Rakhimberdiev et al. Reference Rakhimberdiev, Duijns, Karagicheva, Camphuysen, Castricum, Dekinga, Dekker, Gavrilov, Ten Horn, Jukema, Saveliev, Soloviev, Tibbitts, Van Gils and Piersma2018). Also, habitat deterioration and disturbance at staging sites elsewhere along the flyway may contribute to population declines (Dias et al. Reference Dias, Granadeiro, Lecoq, Santos and Palmeirim2006, Catry et al. Reference Catry, Alves, Andrade, Costa, Dias, Fernandes, Leal, Lourenco, Martins, Moniz, Pardal, Rocha, Santos, Encarnacao and Granadeiro2011, van Roomen et al. Reference Roomen, Laursen, Van Turnhout, Van Winden, Blew, Eskildsen, Günther, Hälterlein, Kleefstra, Potel, Schrader, Luerssen and Ens2012). For instance, in the 1990s Red Knots temporarily lost key food resources in the Wadden Sea in spatial and temporal association with the detrimental effects of mechanical dredging for shellfish (Kraan et al. Reference Kraan, Piersma, Dekinga, Koolhaas and Van Der Meer2007, Reference Kraan, Van Gils, Spaans, Dekinga and Piersma2010, Compton et al. Reference Compton, Bodnar, Koolhaas, Dekinga, Holthuijsen, Horn, McSweeney, Van Gils and Piersma2016), previously shown to be an important staging area for Red Knots between Siberia and West Africa (Nebel et al. Reference Nebel, Piersma, Van Gils, Dekinga and Spaans2000).
For fish-eating birds the observed population changes may have resulted from food web alterations within or outside the Banc d’Arguin. For now, the effect of commercial fishing of rays and sharks in Banc d’Arguin on prey availability for seabirds remains unclear. However, the legal commercial fishing practices may also have affected the food web at Banc d’Arguin. They particularly aim at large-bodied fish, which in many cases leads to an increase in small-bodied fish of other species (Pauly et al. Reference Pauly, Christensen, Dalsgaard, Froese and Torres1998, Jackson et al. Reference Jackson, Kirby, Berger, Bjorndal, Botsford, Bourque, Bradbury, Cooke, Erlandson, Estes, Hughes, Kidwell, Lange, Lenihan, Pandolfi, Peterson, Steneck, Tegner and Warner2001, Olden et al. Reference Olden, Hogan, Zanden and Vander2007), and also of smaller size classes of the same species (van Leeuwen et al. Reference Leeuwen, De Roos and Persson2008). In addition, elimination of top predators such as rays and sharks can release their prey from predatory control (Friedlander and DeMartini Reference Friedlander and Demartini2002, Worm and Myers Reference Worm and Myers2003, Olden et al. Reference Olden, Hogan, Zanden and Vander2007, Myers et al. Reference Myers, Baum, Shepherd, Powers and Peterson2007). Hence, piscivorous birds in Banc d’Arguin which forage mainly on small prey may have profited from both the removal of the top predators and commercial fisheries. This bird group, however, consists of species with different ecological requirements (Veen et al. Reference Veen, Dallmeijer and Veen2018), so the specific reasons will differ between species.
Deterioration of the extent and quality of wetlands and changes in fishing practices outside Banc d’Arguin may have contributed to the observed increase in Afrotropical species within the Banc d’Arguin. For instance, the Senegal delta, just 350 km to the south, has experienced major ecological and hydrological changes over the last four decades (Triplet and Yésou Reference Triplet and Yésou2000, Zwarts et al. Reference Zwarts, Bijlsma, Van Der Kamp and Wymenga2009), especially the construction of the Diama (1986) and Manantali (1988) dams, which have destroyed important feeding habitats for waterbirds. The offshore area there has also been subjected to severe overfishing over the last few decades (Laurans et al. Reference Laurans, Gascuel, Chassot and Thiam2004), which may have affected the food availability of seabirds in the entire region. These pronounced changes in habitats and food availability may have pushed the more southern seabird populations to seek shelter and food in Banc d’Arguin. Hence, the tenfold increase in White Pelicans at Banc d’Arguin may at least partly be due to immigration and not to reproduction of the local population. In addition, White Pelicans have benefited from a special conservation program in the Senegal Delta over the last 20 years through controlled flooding, the construction of artificial nesting sites, and occasional food provisioning (personal communications). Thus, the observed increase of pelican numbers in Banc d’Arguin could also be a result of an overspill from the Senegal Delta region due to exceeding the carrying capacity over there.
Recommendations for improving the monitoring quality
We recognise that the occurrence of the above phenomena in Banc d’Arguin is mostly speculative and stress that precisely their speculative nature calls for more targeted research to unravel the causes underlying the population dynamics of the waterbirds at Banc d’Arguin. A first step is a more precise quantification of the changes. Given the unavoidably substantial error margin associated with complete counts of Banc d’Arguin (see discussion above), the principal way to achieve this will be to conduct such complete counts more frequently, preferably employing a more permanent team of observers. Increasing the frequency of counts will allow better separation of the trends from the sampling noise. Repetition by the same team will help building experience on the terrain, tides, and bird movements, enabling to optimise the planning of the counts and standardise the methodology. A preliminary exploration of the potential to use annual counts of a sample of counting units as an index of changes in numbers of birds on the entire Banc d’Arguin suggested that this approach for now seems to have limited potential due to variation in bird distribution within the studied area and the substantial sampling error in the counting unit counts themselves.
Simultaneous with an increased frequency of counts, long-term studies of the functioning of the system (e.g. seagrass, benthos and fish) will improve our understanding of the causes behind the overall change in bird communities. Finally, we like to emphasise that a yearly count would also mean that all regions of the Banc d’Arguin ecosystem will be visited and inspected on a regular basis, which will improve the capacity to detect important ecological changes as early as possible.
Supplementary Materials
To view supplementary material for this article, please visit http://dx.doi.org/10.1017/S0959270919000431.
Acknowledgements
The Parc National du Banc d’Arguin, Programma Rijke Waddenzee, Fondation MAVA, Bird Life International, Royal NIOZ, Alterra, the Waddden Sea Flyway Initiative, a Prins Bernhard Cultuurfonds voor Natuurbehoud prize to TP, and the Waddenfonds project ‘Metawad’, all contributed pieces of the support (including funding, permissions, and logistics) that this research has built on over the years. We thank all the counters and field workers that made this work possible. Special thanks to Antonio Araujo for the valuable advice and facilitations that made many of these counts possible and also for his reflections on the paper. We are also indebted to Han Olff, who provided many of insights on the potential interactions between bird population dynamics and the entire ecosystem dynamics of the Banc d’Arguin, as well as advice on the multivariate analyses. The workshop at Iwik in January 2017, which triggered this analysis and publication, was made possible by Manon Tentij (Birdlife Netherlands and Programma Rijke Waddenzee). We thank the anonymous reviewers for constructive feedback. Dick Visser made the final drawings.


 Open access