


1. Introduction
Critical illness insurance (CII) is one of the most significant insurance products and provides coverage against a wide range of diseases, including cancer. Cancer remains one of the most common causes of morbidity and mortality worldwide with an estimated 19.3 million new cases and almost 10 million deaths occurred in 2020 (Sung et al., Reference Sung, Ferlay, Siegel, Laversanne, Soerjomataram, Jemal and Bray2021). Meanwhile, in the aftermath of the COVID-19 pandemic, cancer has been one of the diseases impacted the most due to the dramatic changes in relevant healthcare pathways introduced as a response to the pandemic (Alagoz et al. Reference Alagoz, Lowry, Kurian and Mandelblatt2021; Lai et al., Reference Lai, Pasea and Banerjee2020; Maringe et al., Reference Maringe, Spicer, Morris, Purushotham, Nolte and Sullivan2020; Sud et al., Reference Sud, Torr and Jones2020).
Our focus is on breast cancer (BC). This is one of the most common cancers diagnosed in women and one of the leading causes of death for women in several countries (American Cancer Society, 2021; McDonald et al., Reference McDonald, Hertz and Pitman Lowenthal2008). Besides, BC is one of the most common causes of CII claims, e.g., accounting for 44% of female CII claims in the UK in 2014 (CMI, 2011; Aviva, 2015). Also, BC is one of the cancer types with significantly higher cancer survival as compared to other cancer types, e.g., lung cancer. This, combined with a better understanding of BC risk, has led to changes in insurance practice, such as the "right to be forgotten" initiative in Europe, with more and more BC survivors being insurable and with new insurance options being available to women with medical history (iamInsured, 2023; Insurance Europe, 2021; SCOR, 2020; The Insurance Surgery, 2023).
It is also important to note that BC is one of the key cancer types for which screening is often available. The availability of screening is crucial for early diagnosis of cancer, which is also a main determinant of cancer survival. Unfortunately, national-level lockdowns, introduced as a response to the COVID-19 pandemic, had significant consequences leading, for instance, to suspension of cancer screening programs and treatments between March and June 2020 in the UK (CRUK, 2021).
In this paper, we build on and extend earlier work (Arık et al., Reference Arık, Cairns, Dodd, Macdonald and Streftaris2023, Reference Arık, Cairns, Dodd, Macdonald and Streftaris2024), to derive BC and other cause mortality at a wide range of age groups, and provide pricing for a specialized accelerated CII contract and a life insurance contract, for both healthy and post-cancer women. Our modeling allows the inclusion of cancer stage and results are obtained under various scenarios relating to cancer diagnosis and treatment. We also consider a commonly used modeling framework for pricing (Baione & Levantesi, Reference Baione and Levantesi2018; CMI, 1991) and provide detailed comparisons between these approaches. The comparisons showcase the diverse implications arising from varying modeling assumptions in the context of life insurance.
Specifically, we consider two main multiple state models in a continuous time framework for modeling BC, e.g., see Soetewey et al. (Reference Soetewey, Legrand, Denuit and Silversmit2022, Reference Soetewey, Legrand, Denuit and Silversmit2023), Baione & Levantesi (Reference Baione and Levantesi2018), Ozkok Dodd et al. (Reference Ozkok Dodd, Streftaris, Waters and Stott2014). First, we consider an industry-based Markov model (Reynolds & Faye, Reference Reynolds and Faye2016) with 4 states, also discussed in Baione & Levantesi (Reference Baione and Levantesi2018), as our baseline model. This model is similar to the 3-state (healthy-ill-dead) model used by Soetewey et al. (Reference Soetewey, Legrand, Denuit and Silversmit2022), but the latter is within a semi-Markov framework. The difference between these models stems from how death is defined. In the industry-based model, death is divided into two categories: due to critical illness or other causes. Since we are interested in pricing both CII and traditional life insurance contracts, we focus on the 4-state model rather than the 3-state model. Moreover, these earlier literature models account for cancer incidence in a single state. An exception is the study by Soetewey et al. (Reference Soetewey, Legrand, Denuit and Silversmit2023). They introduce cancer stage into the model, while retaining all-cause mortality for death.
As an alternative to the existing models, we propose to use a semi-Markov model as the second approach that differentiates between life histories on the basis of cancer stage and whether or not cancer diagnosis is made while maintaining two distinct causes of death (Arık et al. Reference Arık, Cairns, Dodd, Macdonald and Streftaris2024). The model presented in Arık et al. (Reference Arık, Cairns, Dodd, Macdonald and Streftaris2024) is further developed here in the following ways: (i) we consider a collection of semi-Markov models for a wider age range starting from age 30 and (ii) we apply generalised additive models to define transition intensities to account for changes in rates of transition over time for a given cohort. We are particularly interested in understanding how combining specific events, like BC registrations across different cancer stages at the time of diagnosis as assumed by the industry-based model, affects insurance cash flows, especially when there is not enough data available. Thus, we show how both modeling frameworks can be implemented to quantify net insurance premiums for specialized insurance products for women aged 35 to 60 years at the time of purchase. At the same time, we address differences raised by different model assumptions. This includes clarifying the consequences of relying on the more compact model and ignoring duration dependence in this specific case. Additionally, we highlight the potential benefits of incorporating duration dependence by examining a special case of the proposed semi-Markov model. This is achieved through comparisons of insurance premiums calculated under the semi-Markov model and its special case. This is relevant to ongoing discussions around as-if-Markov modeling as a substitute for semi-Markov processes for more refined actuarial (reserve) calculations (Christiansen, Reference Christiansen2021).
Calibrating BC risk in the absence of comprehensive data is complex, but we demonstrate a suitable approach based on a pragmatic combination of publicly available cancer registrations and deaths data in England from the Office for National Statistics (ONS), and published clinical studies. Our study discusses shortcomings of the earlier literature ( CMI 1991; Baione & Levantesi, Reference Baione and Levantesi2018; Reynolds & Faye, Reference Reynolds and Faye2016) based on comparisons of estimated BC incidence and mortality with observed rates. We also clarify the definition of a certain method, known as
 $k_x$
-method, practised by the insurance industry to determine other causes of death through critical illness deaths. Overall, we conclude that the earlier literature model (which we call the industry-based model) is more sensitive to model assumptions and should be approached with caution. We later show differences in net single premiums for a specialized CII contract and a life insurance contract tailored for women at ages 35 to 60 under different considerations associated with diagnosis and treatment. Our calculations highlight each model’s capacity to adapt to shifts in insurance practice. We demonstrate that our approach could be useful for underwriting more inclusive life insurance products whilst capturing important features of BC risk, in contrast to the industry-based model.
$k_x$
-method, practised by the insurance industry to determine other causes of death through critical illness deaths. Overall, we conclude that the earlier literature model (which we call the industry-based model) is more sensitive to model assumptions and should be approached with caution. We later show differences in net single premiums for a specialized CII contract and a life insurance contract tailored for women at ages 35 to 60 under different considerations associated with diagnosis and treatment. Our calculations highlight each model’s capacity to adapt to shifts in insurance practice. We demonstrate that our approach could be useful for underwriting more inclusive life insurance products whilst capturing important features of BC risk, in contrast to the industry-based model.
The remainder of this paper is organized as follows. In Section 2, we introduce the multiple state models used in this study. In Section 3, we describe available data. In Section 4, we explain how to calibrate, implement, and validate the models. In Section 5, we describe specialized insurance contracts and present estimated net insurance premiums under various scenarios linked to BC diagnosis and treatment. In Section 6, we examine the sensitivity of the industry-based model using an alternative calibration. In Section 7, we discuss our main findings and their implications for the insurance industry.
2. Multiple state models
This section introduces the three models used in the paper to define the life history of an individual exposed to BC risk (Table 1). In Section 2.1, we first present an industry-based 4-state Markov model (M0), while in Section 2.2 we introduce a semi-Markov multiple state model (M1) and a related simplified Markov version (M2). While Model 0 is based on an earlier study by Baione & Levantesi (Reference Baione and Levantesi2018), Model 1 is a recently developed framework from Arık et al. (Reference Arık, Cairns, Dodd, Macdonald and Streftaris2024). Models M1 and M2 are further discussed and extended in later sections.
Multiple state models used in the numerical results

2.1 An industry-based multiple state model
We consider a multiple state model with four states as shown in Fig. 1. This model is used as a CII industry model in Reynolds & Faye (Reference Reynolds and Faye2016) and is similar to the multiple state models discussed in CMI (1991) and Baione & Levantesi (Reference Baione and Levantesi2018).
Industry-based 4-state Markov model, M0, as in Baione & Levantesi (Reference Baione and Levantesi2018). Intensities
 $\mu$
are functions of age
$\mu$
are functions of age
 $x$
.
$x$
.
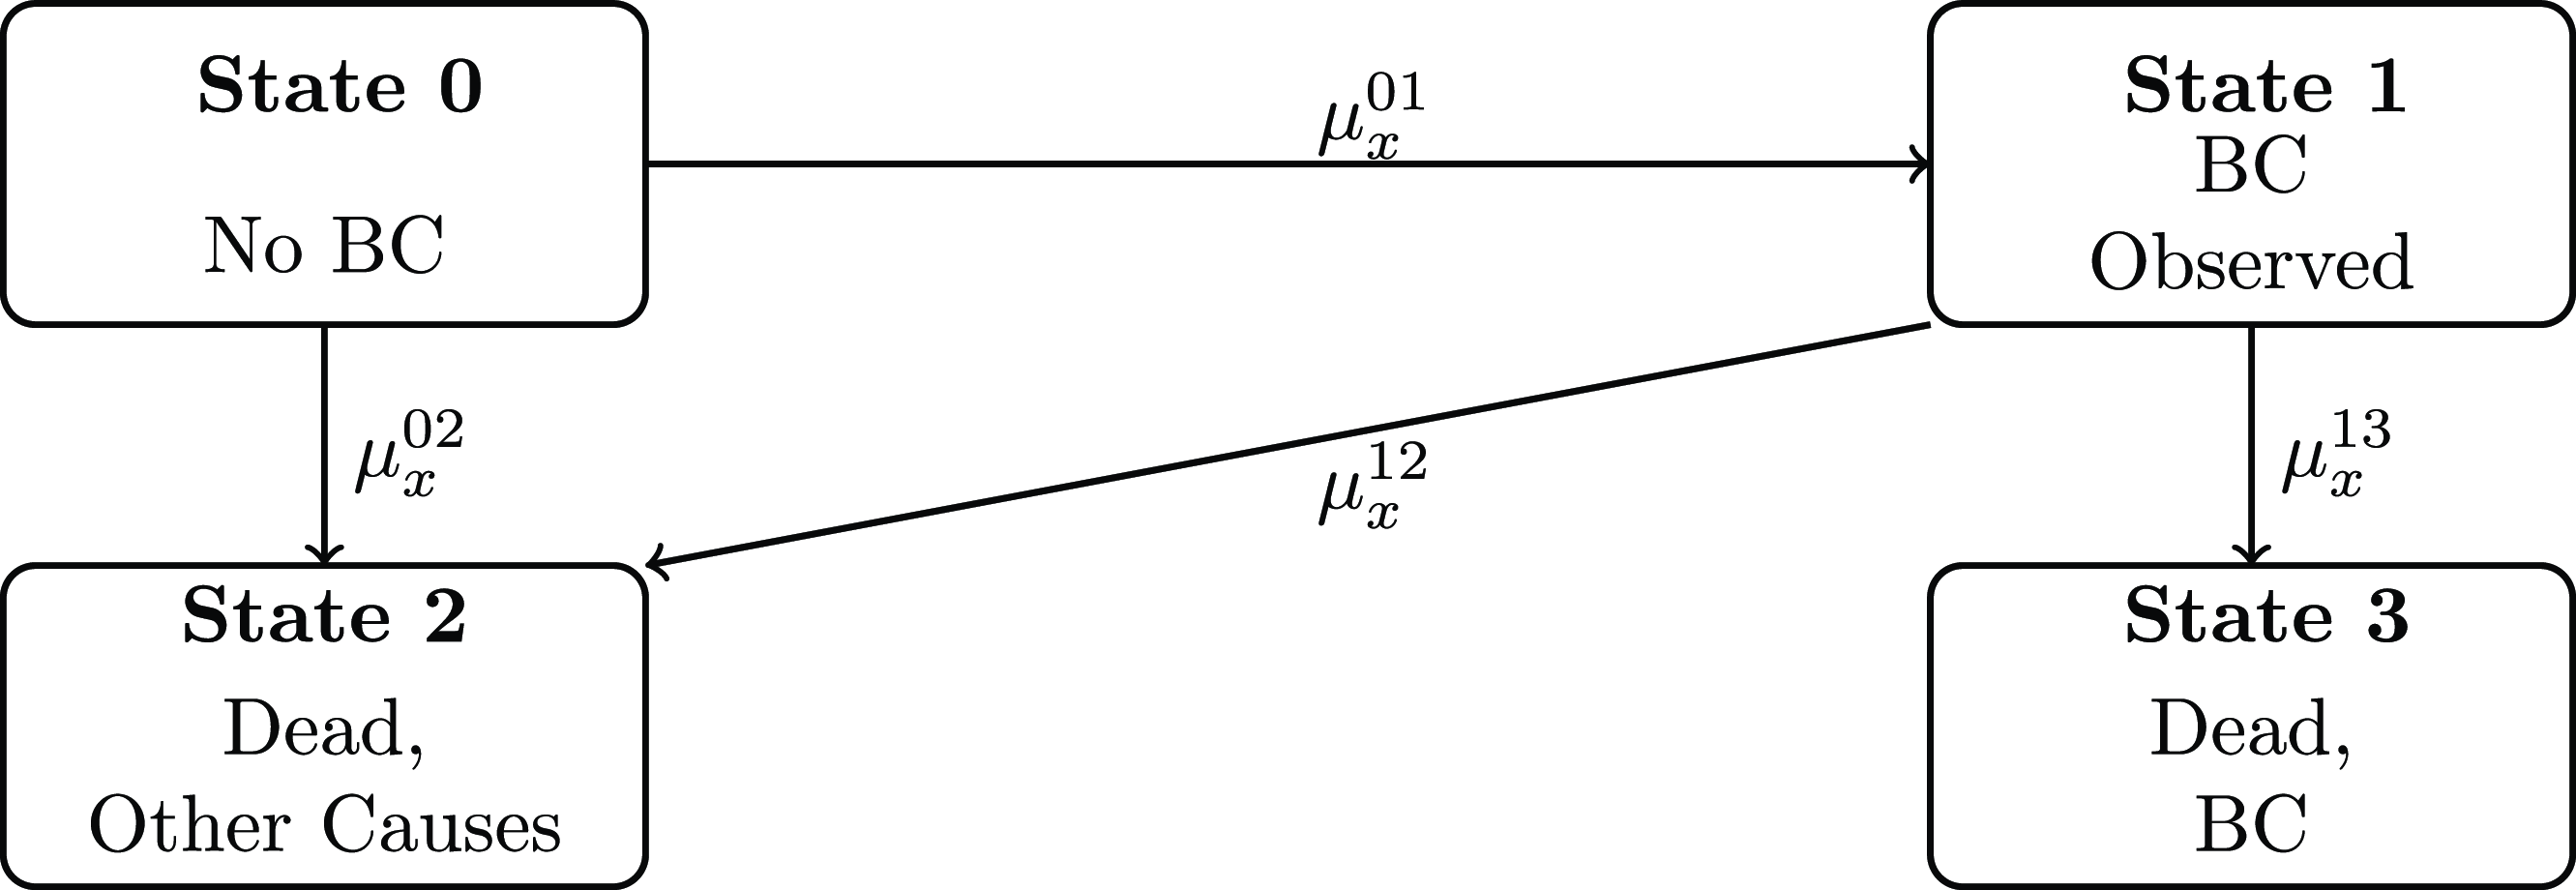
Fig. 1 demonstrates the life history of an insured individual in a continuous time setting. Transition intensities from state
 $i$
to state
$i$
to state
 $j$
at age
$j$
at age
 $x$
are denoted by
$x$
are denoted by
 $\mu ^{ij}_x$
.
$\mu ^{ij}_x$
.
While four states allow us to price a contract paying a benefit on death specifically from other causes (see Section 5), we would need additional states to describe different stages of BC, or observed and unobserved cases. Such extensions are easily accommodated if necessary by expanding the Kolmogorov equations for Model M0 provided in Appendix A.
2.2 Semi-Markov multiple state model
Fig. 2 displays a continuous time semi-Markov model with 6 states for the life history of a policyholder. This model, recently developed by Arık et al. (Reference Arık, Cairns, Dodd, Macdonald and Streftaris2024), presents an enhanced modeling approach for BC risk by offering an improved accuracy in related estimates. It describes the development of a single policy depending on age-specific transition intensities from state
 $i$
to state
$i$
to state
 $j$
at age
$j$
at age
 $x$
, denoted by
$x$
, denoted by
 $\mu ^{ij}_x$
, and age- and duration-dependent transition intensities at age
$\mu ^{ij}_x$
, and age- and duration-dependent transition intensities at age
 $x$
and duration
$x$
and duration
 $z$
from state
$z$
from state
 $i$
to state
$i$
to state
 $j$
, denoted by
$j$
, denoted by
 $\mu ^{ij}_{x,z}$
.
$\mu ^{ij}_{x,z}$
.
A breast cancer semi-Markov model, M1. Intensities
 $\mu$
are functions of age
$\mu$
are functions of age
 $x$
and/or duration
$x$
and/or duration
 $z$
.
$z$
.
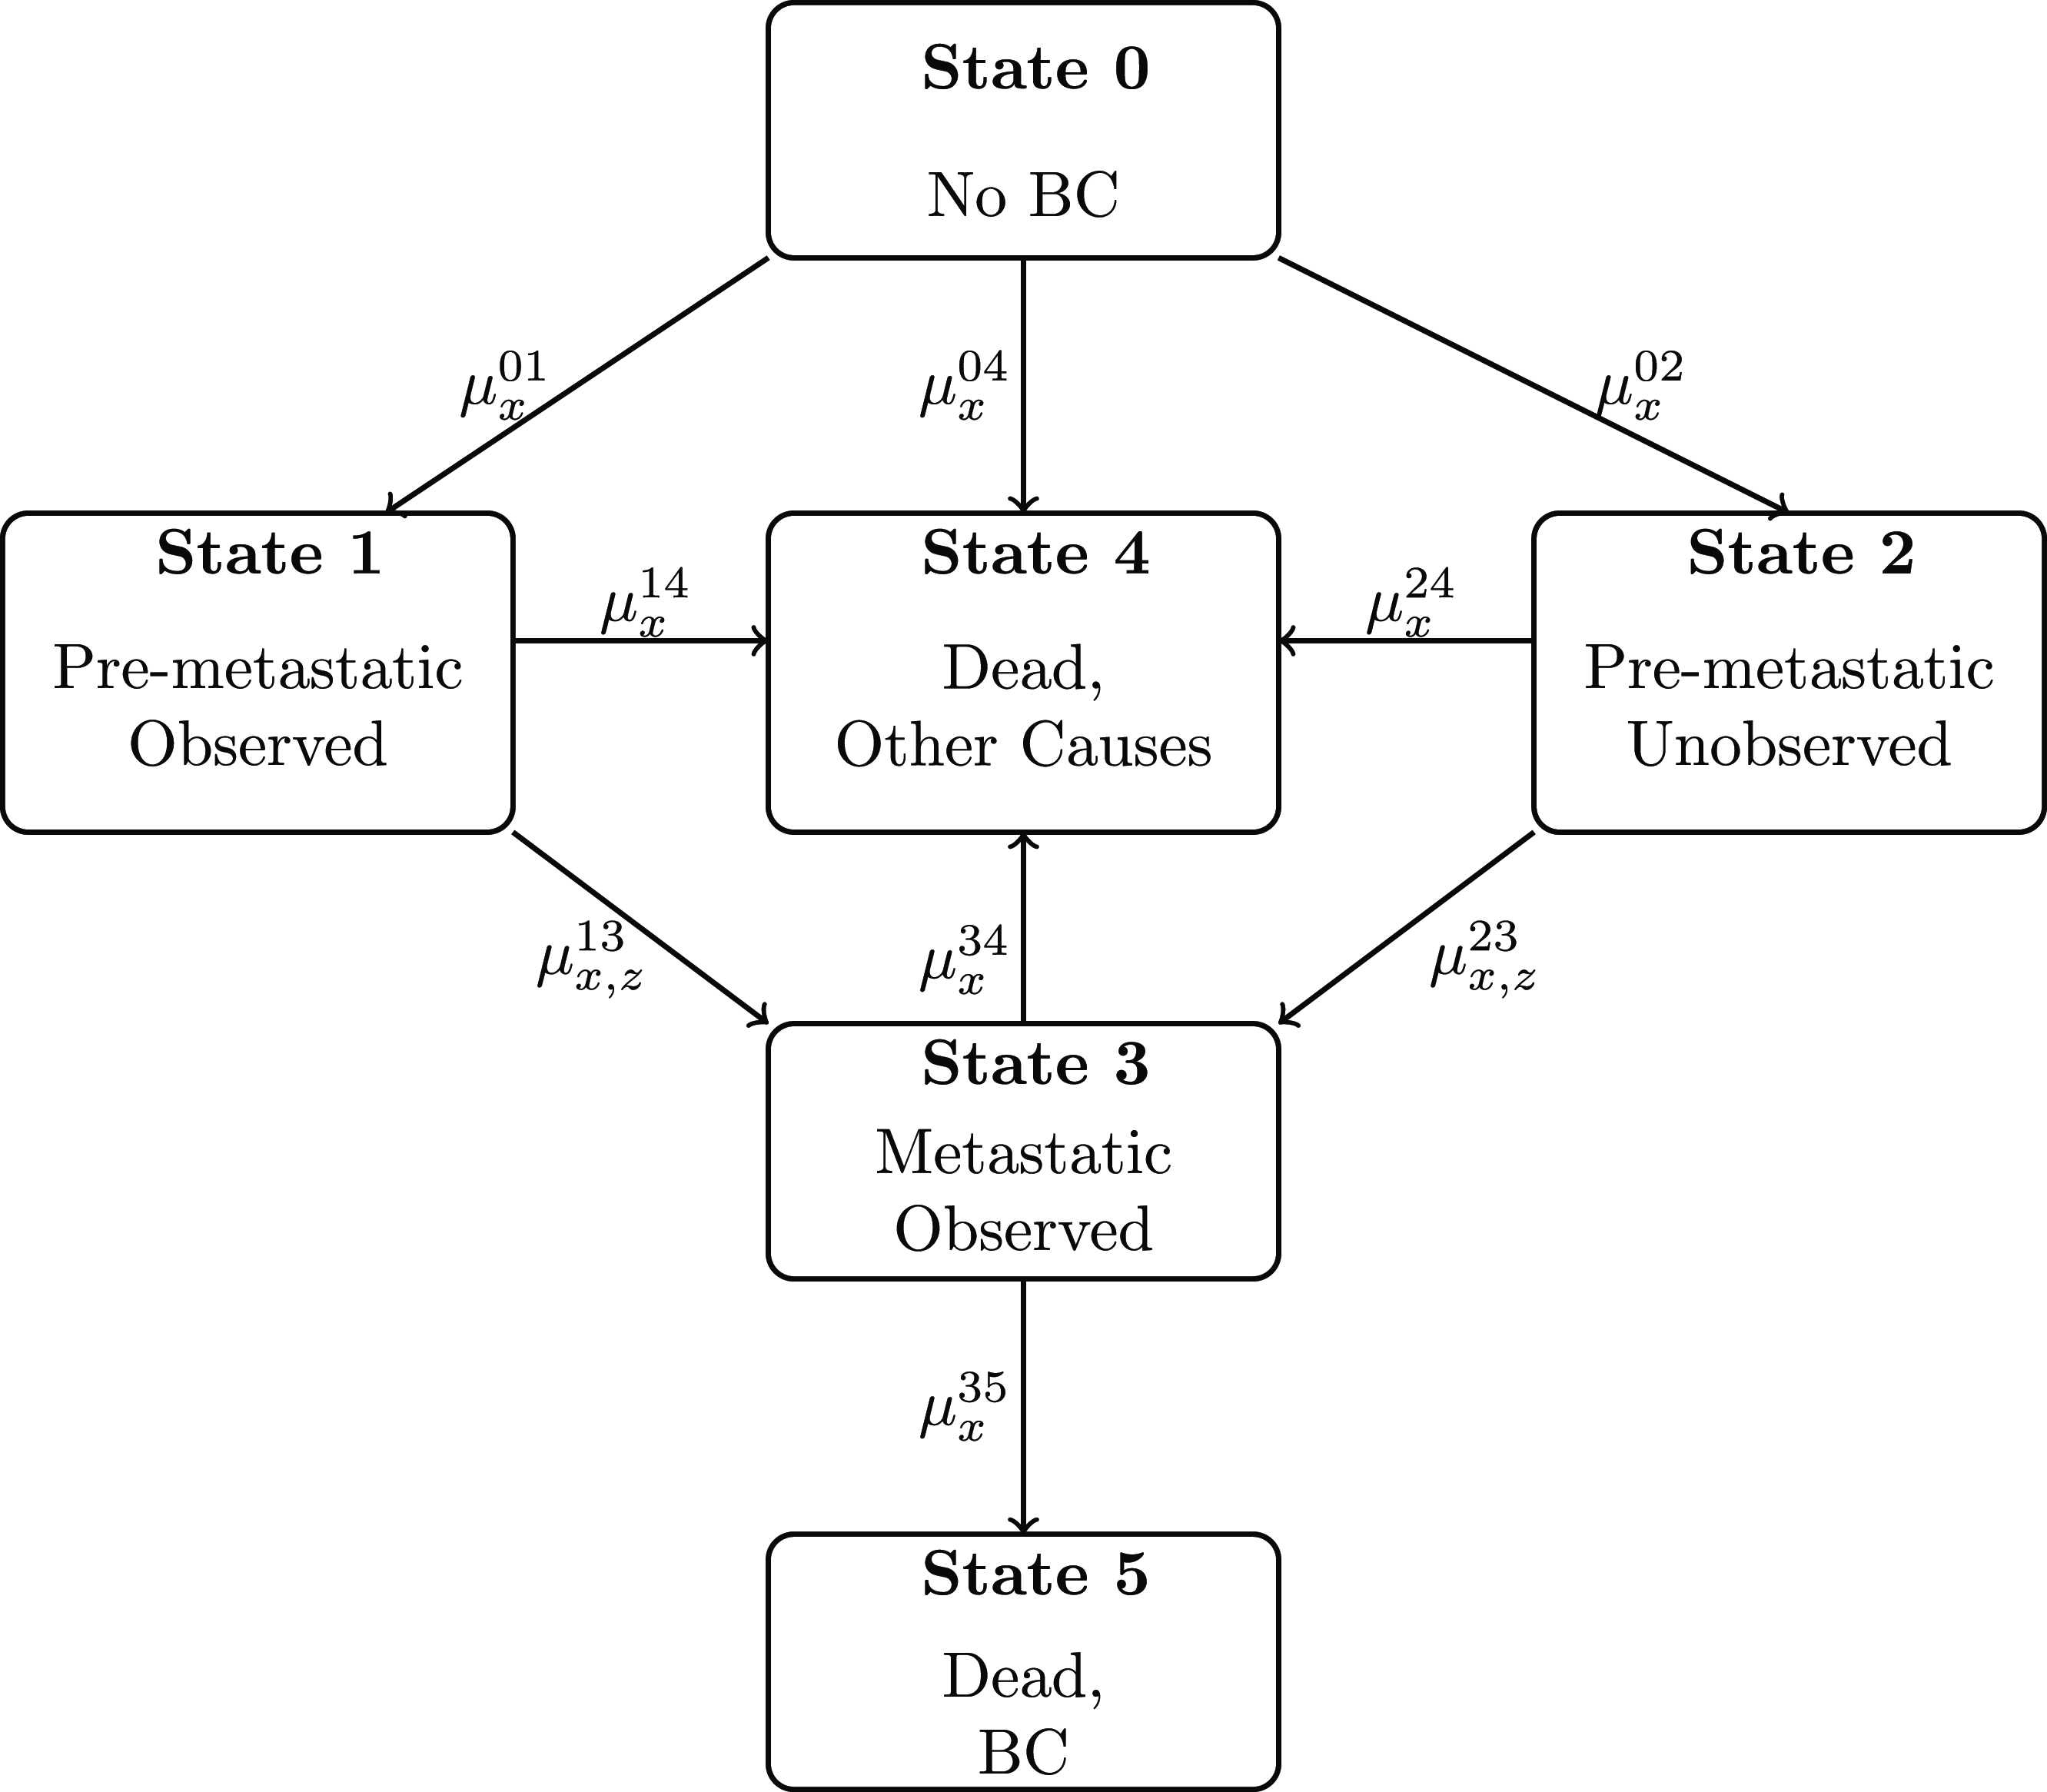
In this model, State 0 represents individuals free of BC. Fig. 2 distinguishes between observed and unobserved BC cases. In particular, State 1 and State 3 show observed BC cases, whereas State 2 shows unobserved BC cases. Note that observed and unobserved BC are distinguished with respect to the availability of BC diagnosis. Incorporating unobserved BC cases as a separate state allows for a more realistic health trajectory for each individual. This approach also enables us to develop scenarios concerning BC diagnosis and the availability of BC treatment (Section 5.2). States 4 and 5 correspond to death from other causes and BC, respectively.
Based on this model, the onset of BC, that is, new cancer cases at a given age
 $x$
, can be determined by the sum of the rates of transition from State 0 to State 1 and to State 2 such that
$x$
, can be determined by the sum of the rates of transition from State 0 to State 1 and to State 2 such that
 \begin{equation} \mu _x^{01} + \mu _x^{02} = \mu _x^*, \end{equation}
where
 $ \mu _x^*$
corresponds to all new BC cases. (1) leads to a convenient parametrisation such that
$ \mu _x^*$
corresponds to all new BC cases. (1) leads to a convenient parametrisation such that
 \begin{equation} \mu _x^{01} = \alpha _x \, \mu _x^*, \qquad \mu _x^{02} = (1 - \alpha _x) \, \mu _x^*, \end{equation}
where
 $0\lt \alpha _x\lt 1$
quantifies a proportional relationship between
$0\lt \alpha _x\lt 1$
quantifies a proportional relationship between
 $\mu ^{01}_x$
and
$\mu ^{01}_x$
and
 $\mu ^{02}_x$
. See Arık et al. (Reference Arık, Cairns, Dodd, Macdonald and Streftaris2024) for a detailed discussion about the model assumptions.
$\mu ^{02}_x$
. See Arık et al. (Reference Arık, Cairns, Dodd, Macdonald and Streftaris2024) for a detailed discussion about the model assumptions.
As part of the model, duration dependence is considered only in certain states, e.g., from pre-metastatic BC to metastatic BC by following the related medical literature (e.g. Colzani et al., Reference Colzani, Johansson, Liljegren and Foukakis2014). Besides, it is assumed that individuals in State 1 may have treatments for BC, whereas this would not be possible for individuals in State 2. Thus, we assume a lower rate of transition to metastatic BC from State 1, compared to State 2, such that
 \begin{equation} \mu _{x,z}^{13} = \beta _{x,z} \, \mu _{x, z}^{23}, \end{equation}
where
 $0\lt \beta _{x,z} \lt 1$
.
$0\lt \beta _{x,z} \lt 1$
.
Model M1 in Fig. 2 is characterised by a set of modified Kolmogorov equations where a system of integral-differential equations is involved due to the existence of duration dependence from States 1 and 2 to State 3. These equations are explicitly provided in Appendix B. A fourth-order Runge–Kutta scheme is applied to numerically solve the (modified) Kolmogorov equations under consideration.
2.3 A special case of the semi-Markov multiple state model
A Markov model (M2) is also considered as a special case of the semi-Markov model (M1) in Fig. 2. This assumes a simplification of the semi-Markov model, where no duration dependence is considered in any of the model states. In particular, (3) is modified as follows:
 \begin{equation*} \mu _{x}^{13} = \beta _{x} \, \mu _{x}^{23}, \end{equation*}
where
 $0\lt \beta _{x} \lt 1$
.
$0\lt \beta _{x} \lt 1$
.
Model M2 is introduced with the purpose of demonstrating differences in BC rates and related insurance prices caused by duration dependence (e.g. Section 4). The relevant differences are reported through a comparison between the semi-Markov and Markov models.
3. Data
In this section, we describe available data. The data were also used in Arık et al. (Reference Arık, Cairns, Dodd, Macdonald and Streftaris2024), which focused on older age groups (65+). Here, our primary interest lies in the insured age groups, specifically ages 30–60. However, the model calibration spans ages 30–89, as detailed in Section 4.
Specifically, the data consist of numbers of deaths by cause-of-death and cancer incidence registrations in England for the following age groups: 30–49, 50–54, 55–59, …, 85–89. The cause-specific number of deaths data are available up to age 89 from 2001 to 2022, whereas the cancer registrations data are available from 2001 to 2020.
Cancer registrations are stratified by five-year age-at-diagnosis groups, type of tumor, single calendar year, and gender, for the years between 2001 and 2020. These data are provided by the ONS up to 2017 and later by the Health and Social Care Information Centre of the National Health Service (NHS) of England, also known as NHS Digital. Cause-specific death numbers, provided by the ONS, have similar granularity, where the data are split by five-year age-at-death groups, causes of death defined based on ICD 10 classification, single calendar year, and gender, between 2001 and 2022. Mid-year population estimates up to 2022 are also available from the ONS.
Fig. 3 shows age-specific BC incidence and mortality along with mortality from other causes over time. This builds on a similar figure presented in Arık et al. (Reference Arık, Cairns, Dodd, Macdonald and Streftaris2024), incorporating more recent data in the current version. Here, BC incidence is defined as new BC registrations at a certain age-at-diagnosis group in a given year, divided by the related mid-year population estimates. Mortality from other causes is defined similarly, with deaths from BC being excluded.
Breast cancer incidence, mortality, and mortality from other causes (excluding breast cancer).

Fig. 3a demonstrates that BC is a greater risk for women from age 50 onward. Also, BC incidence mostly exhibits an increasing trend at different ages over calendar years apart from 2020, where we observe a sharp decline, as low as 25% at ages 60–64 (see also Fig. 4a). This is more evident for women older than 30–49, reflecting a reduction in cancer registrations due to the changes in availability of cancer services, e.g., a halt in cancer screening from late March 2020 till June 2020, as a result of national lockdowns introduced as a response to the COVID-19 pandemic (CRUK, 2021).
Change (%) in breast cancer incidence and mortality, and in mortality from other causes,in 2020 as compared to 2019.

Fig. 3b and c show a generally decreasing trend in BC and other-cause mortality. This trend was interrupted by COVID-19 in 2020, with increasing mortality from other causes at all considered ages by 10–13% as compared to 2019 (Fig. 4c). BC mortality increased in 2020, up around 7%, for older ages, while it decreased for younger ages (Fig. 4b).
4. Model calibration and validation
In this section, we first present key transition intensities used to calibrate the models described in Section 2. We show our main findings based on different modeling assumptions, summarised in Table 1. Each model across M0–M2 is calibrated for women aged 30 to 89 years, partly using the population data of England (see Section 3). However, only M1 is accounting for duration dependence, and the other two models (M0 and M2) do not involve duration dependence. We exclude the calendar years 2020–2022, while calibrating the models, as the COVID-19 pandemic has had a major impact not only on cancer diagnoses and treatments but also on health-seeking behavior in general. The models are then used to estimate age-specific occupancy probabilities in future years, starting from 1 January 2020 onward. The occupancy probabilities are subsequently used to derive net cancer survival at different ages of diagnosis.
4.1 Transition intensities
Key transition intensities used in this paper are summarised in Table 2. In the models tabulated in Table 1, we use available data as introduced in Section 3, up to 2019. To be specific, we use average cancer incidence and type-specific mortality between 2001 and 2019 to determine age-specific rates of transition in the models under consideration, and by doing so we ignore the time trend. This is mainly for easiness of computation. We then fit generalised additive models to these rates, see Section 4.2, while obtaining insurance premiums to account for changes in incidence and mortality rates at different ages.
Age-specific transition intensities for the BC models M0–M2 based on available data and medical literature

Hereby, we use average cancer incidence in England to determine age-specific rates of transition from State 0 to State 1,
 $\mu ^{01}_x$
. We note that BC registrations by stage in England are available between years of diagnosis 2012–2015 (ONS, 2016). Following Table 1 in ONS (2016b), 81% of new cancer registrations between 2001 and 2019 is used to represent Stages 1–3 BC, i.e. transitions to State 1 in M1 and M2.
$\mu ^{01}_x$
. We note that BC registrations by stage in England are available between years of diagnosis 2012–2015 (ONS, 2016). Following Table 1 in ONS (2016b), 81% of new cancer registrations between 2001 and 2019 is used to represent Stages 1–3 BC, i.e. transitions to State 1 in M1 and M2.
Furthermore, in the models summarized in Table 1, we use average mortality from other causes between 2001 and 2019 to determine age-specific rates of transition from State 0 to death from other causes, i.e.,
 $\mu ^{02}_x$
in M0 and
$\mu ^{02}_x$
in M0 and
 $\mu ^{04}_x$
in M1 and M2. Survival probabilities from other causes for BC patients could be different than the ones for women with no BC (Cho et al., Reference Cho, Mariotto, Mann, Klabunde and Feuer2013). Particularly, BC patients could be more susceptible to die from other causes due to additional risk factor (cancer incidence) (Andersen & Keiding, Reference Andersen and Keiding2012). However, in the absence of comprehensive data, we assume that transitions to death due to other causes from all live states are equal to the transition to death due to other causes from State 0, i.e.,
$\mu ^{04}_x$
in M1 and M2. Survival probabilities from other causes for BC patients could be different than the ones for women with no BC (Cho et al., Reference Cho, Mariotto, Mann, Klabunde and Feuer2013). Particularly, BC patients could be more susceptible to die from other causes due to additional risk factor (cancer incidence) (Andersen & Keiding, Reference Andersen and Keiding2012). However, in the absence of comprehensive data, we assume that transitions to death due to other causes from all live states are equal to the transition to death due to other causes from State 0, i.e.,
 \begin{equation*} \mu ^{12}_x = \mu ^{02}_x, \end{equation*}
in M0, and
 \begin{equation*} \mu ^{14}_x = \mu ^{24}_x = \mu ^{34}_x = \mu ^{04}_x, \end{equation*}
in M1 and M2.
We determine rates of transition to death from BC denoted by
 $\mu ^{13}_x$
, in M0, and by
$\mu ^{13}_x$
, in M0, and by
 $\mu ^{35}_x$
in M1 and M2, using the information reported in Zhao et al. (Reference Zhao, Xu and Guo2020). Moreover, we refer the study of Colzani et al. (Reference Colzani, Johansson, Liljegren and Foukakis2014) to determine rates of transition for developing metastatic BC after being diagnosed with pre-metastatic BC, denoted as
$\mu ^{35}_x$
in M1 and M2, using the information reported in Zhao et al. (Reference Zhao, Xu and Guo2020). Moreover, we refer the study of Colzani et al. (Reference Colzani, Johansson, Liljegren and Foukakis2014) to determine rates of transition for developing metastatic BC after being diagnosed with pre-metastatic BC, denoted as
 $\mu ^{13}_{x,z}$
in M1. See Arık et al. (Reference Arık, Cairns, Dodd, Macdonald and Streftaris2024) for an in-depth discussion about the appropriateness of these sources for model calibration purposes. Note that we assume
$\mu ^{13}_{x,z}$
in M1. See Arık et al. (Reference Arık, Cairns, Dodd, Macdonald and Streftaris2024) for an in-depth discussion about the appropriateness of these sources for model calibration purposes. Note that we assume
 $\mu ^{13}_x=0.0194$
in M2, which is a special case of M1. This value is consistent with first distant metastasis rates based on Table 1 in Colzani et al. (Reference Colzani, Johansson, Liljegren and Foukakis2014).
$\mu ^{13}_x=0.0194$
in M2, which is a special case of M1. This value is consistent with first distant metastasis rates based on Table 1 in Colzani et al. (Reference Colzani, Johansson, Liljegren and Foukakis2014).
Rates of transition for developing metastatic BC in the absence of cancer diagnosis and treatment, i.e.,
 $\mu ^{23}_{x,z}$
, are determined based on
$\mu ^{23}_{x,z}$
, are determined based on
 $\mu ^{13}_{x,z}$
(see (3)). Thus, under M1,
$\mu ^{13}_{x,z}$
(see (3)). Thus, under M1,
 $\mu ^{23}_{x,z}$
accounts for duration dependence, whereas duration
$\mu ^{23}_{x,z}$
accounts for duration dependence, whereas duration
 $z$
is ignored under M2, with
$z$
is ignored under M2, with
 $\mu ^{13}_x=0.0194$
.
$\mu ^{13}_x=0.0194$
.
There is no reliable data to support a particular assumption regarding the choice of
 $\alpha _x$
and
$\alpha _x$
and
 $\beta _{x,z}$
(see (2)–(3)). Thus, an extensive scenario analysis is carried out by considering a range of values of
$\beta _{x,z}$
(see (2)–(3)). Thus, an extensive scenario analysis is carried out by considering a range of values of
 $\alpha _x = \alpha = \{ 0.1, 0.2, \ldots, 0.9 \}$
and
$\alpha _x = \alpha = \{ 0.1, 0.2, \ldots, 0.9 \}$
and
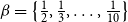
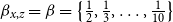 $\beta _{x,z} = \beta = \big \{ \frac {1}{2}, \frac {1}{3}, \ldots, \frac {1}{10} \big \}$
in the context of life insurance premiums (see Section 5.2). Furthermore, following Arık et al. (Reference Arık, Cairns, Dodd, Macdonald and Streftaris2023), we assume
$\beta _{x,z} = \beta = \big \{ \frac {1}{2}, \frac {1}{3}, \ldots, \frac {1}{10} \big \}$
in the context of life insurance premiums (see Section 5.2). Furthermore, following Arık et al. (Reference Arık, Cairns, Dodd, Macdonald and Streftaris2023), we assume
 $\alpha _x = \alpha = 0.6$
and
$\alpha _x = \alpha = 0.6$
and
 $\beta _{x,z}= \beta = 1/7$
, in M1 and M2, while providing comprehensive discussions regarding BC risk and related insurance products in Sections 4–5.
$\beta _{x,z}= \beta = 1/7$
, in M1 and M2, while providing comprehensive discussions regarding BC risk and related insurance products in Sections 4–5.
4.2 Generalized additive models for key transition intensities
We consider Markov (M0 and M2), and semi-Markov (M1) models, and we model transition intensities as a smooth function of age by using a generalized additive model. Hereby, we apply generalized additive models of the following form to the observed transition intensities in Table 2:
 \begin{align} g(E(y_i)) = \alpha + \sum _{p}{ s_p( x_{ip}) },\\[-13pt]\notag \end{align}
where
 $\alpha$
is the intercept;
$\alpha$
is the intercept;
 $g(.)$
is a smooth monotonic link function used to transform the expectation of the outcome
$g(.)$
is a smooth monotonic link function used to transform the expectation of the outcome
 $y$
; and
$y$
; and
 $y$
is modeled as the sum of smooth functions,
$y$
is modeled as the sum of smooth functions,
 $s(.)$
, of covariates
$s(.)$
, of covariates
 $x$
(Wood, Reference Wood2017). We use cubic splines as basis functions.
$x$
(Wood, Reference Wood2017). We use cubic splines as basis functions.
Fig. 5 displays observed, provided in Table 2, and fitted values of key transition intensities, as functions of (attained) age based on the additive models in (4). The plots in Fig. 5 demonstrate smooth fitted rates across different ages. Fig. 5a shows, once again, a significant difference in BC morbidity before and after age 50, where the increase in BC incidence seems to slow down from age 65 onward. Fig. 5b and c exhibit increasing mortality rates from other causes and BC, respectively, for higher ages. Fig. 5d suggests a decrease in developing a higher stage of BC, i.e., a more progressed BC, after being diagnosed with BC over time. Note that this is taken as fixed for each age.


4.3 Occupancy probabilities for different insured ages
In Markov-type models, the occupancy probability,
 ${_ {t}} p^{ij}_x$
, is defined to be the probability that an individual in state
${_ {t}} p^{ij}_x$
, is defined to be the probability that an individual in state
 $i$
at age
$i$
at age
 $x$
will be in state
$x$
will be in state
 $j$
at age
$j$
at age
 $x+t$
(Macdonald et al., Reference Macdonald, Richards and Currie2018).
$x+t$
(Macdonald et al., Reference Macdonald, Richards and Currie2018).
Fig. 6 presents occupancy probabilities for an individual aged between 30 and 60 years, with no BC at the beginning of the insurance contract, based on M0. Note that these probabilities can be associated with a policyholder at these ages at the time of purchase of a particular insurance product. Hereby, in the figure, we assume that time spent on the contract depends on the policyholder’s age at purchase. We also assume that the maximum age for these insurance contracts is 90. This means that the policy purchased by a person who is aged 50 years could be in-force for at most 40 years, whereas policy purchased by a 60 year old could be in-force for at most 30 years. Accordingly, in each subplot, we see shorter time periods for higher ages on
 $x$
axis.
$x$
axis.
Occupancy probabilities for a policyholder with no breast cancer, at different contract entry ages, based on the industry-based model M0.

Similarly, Fig. 7 displays occupancy probabilities for women with different ages ranging from 30 to 60, with no BC at time zero, based on M1.
Occupancy probabilities for a policyholder with no breast cancer, at different contract entry ages, based on the semi-Markov model M1.
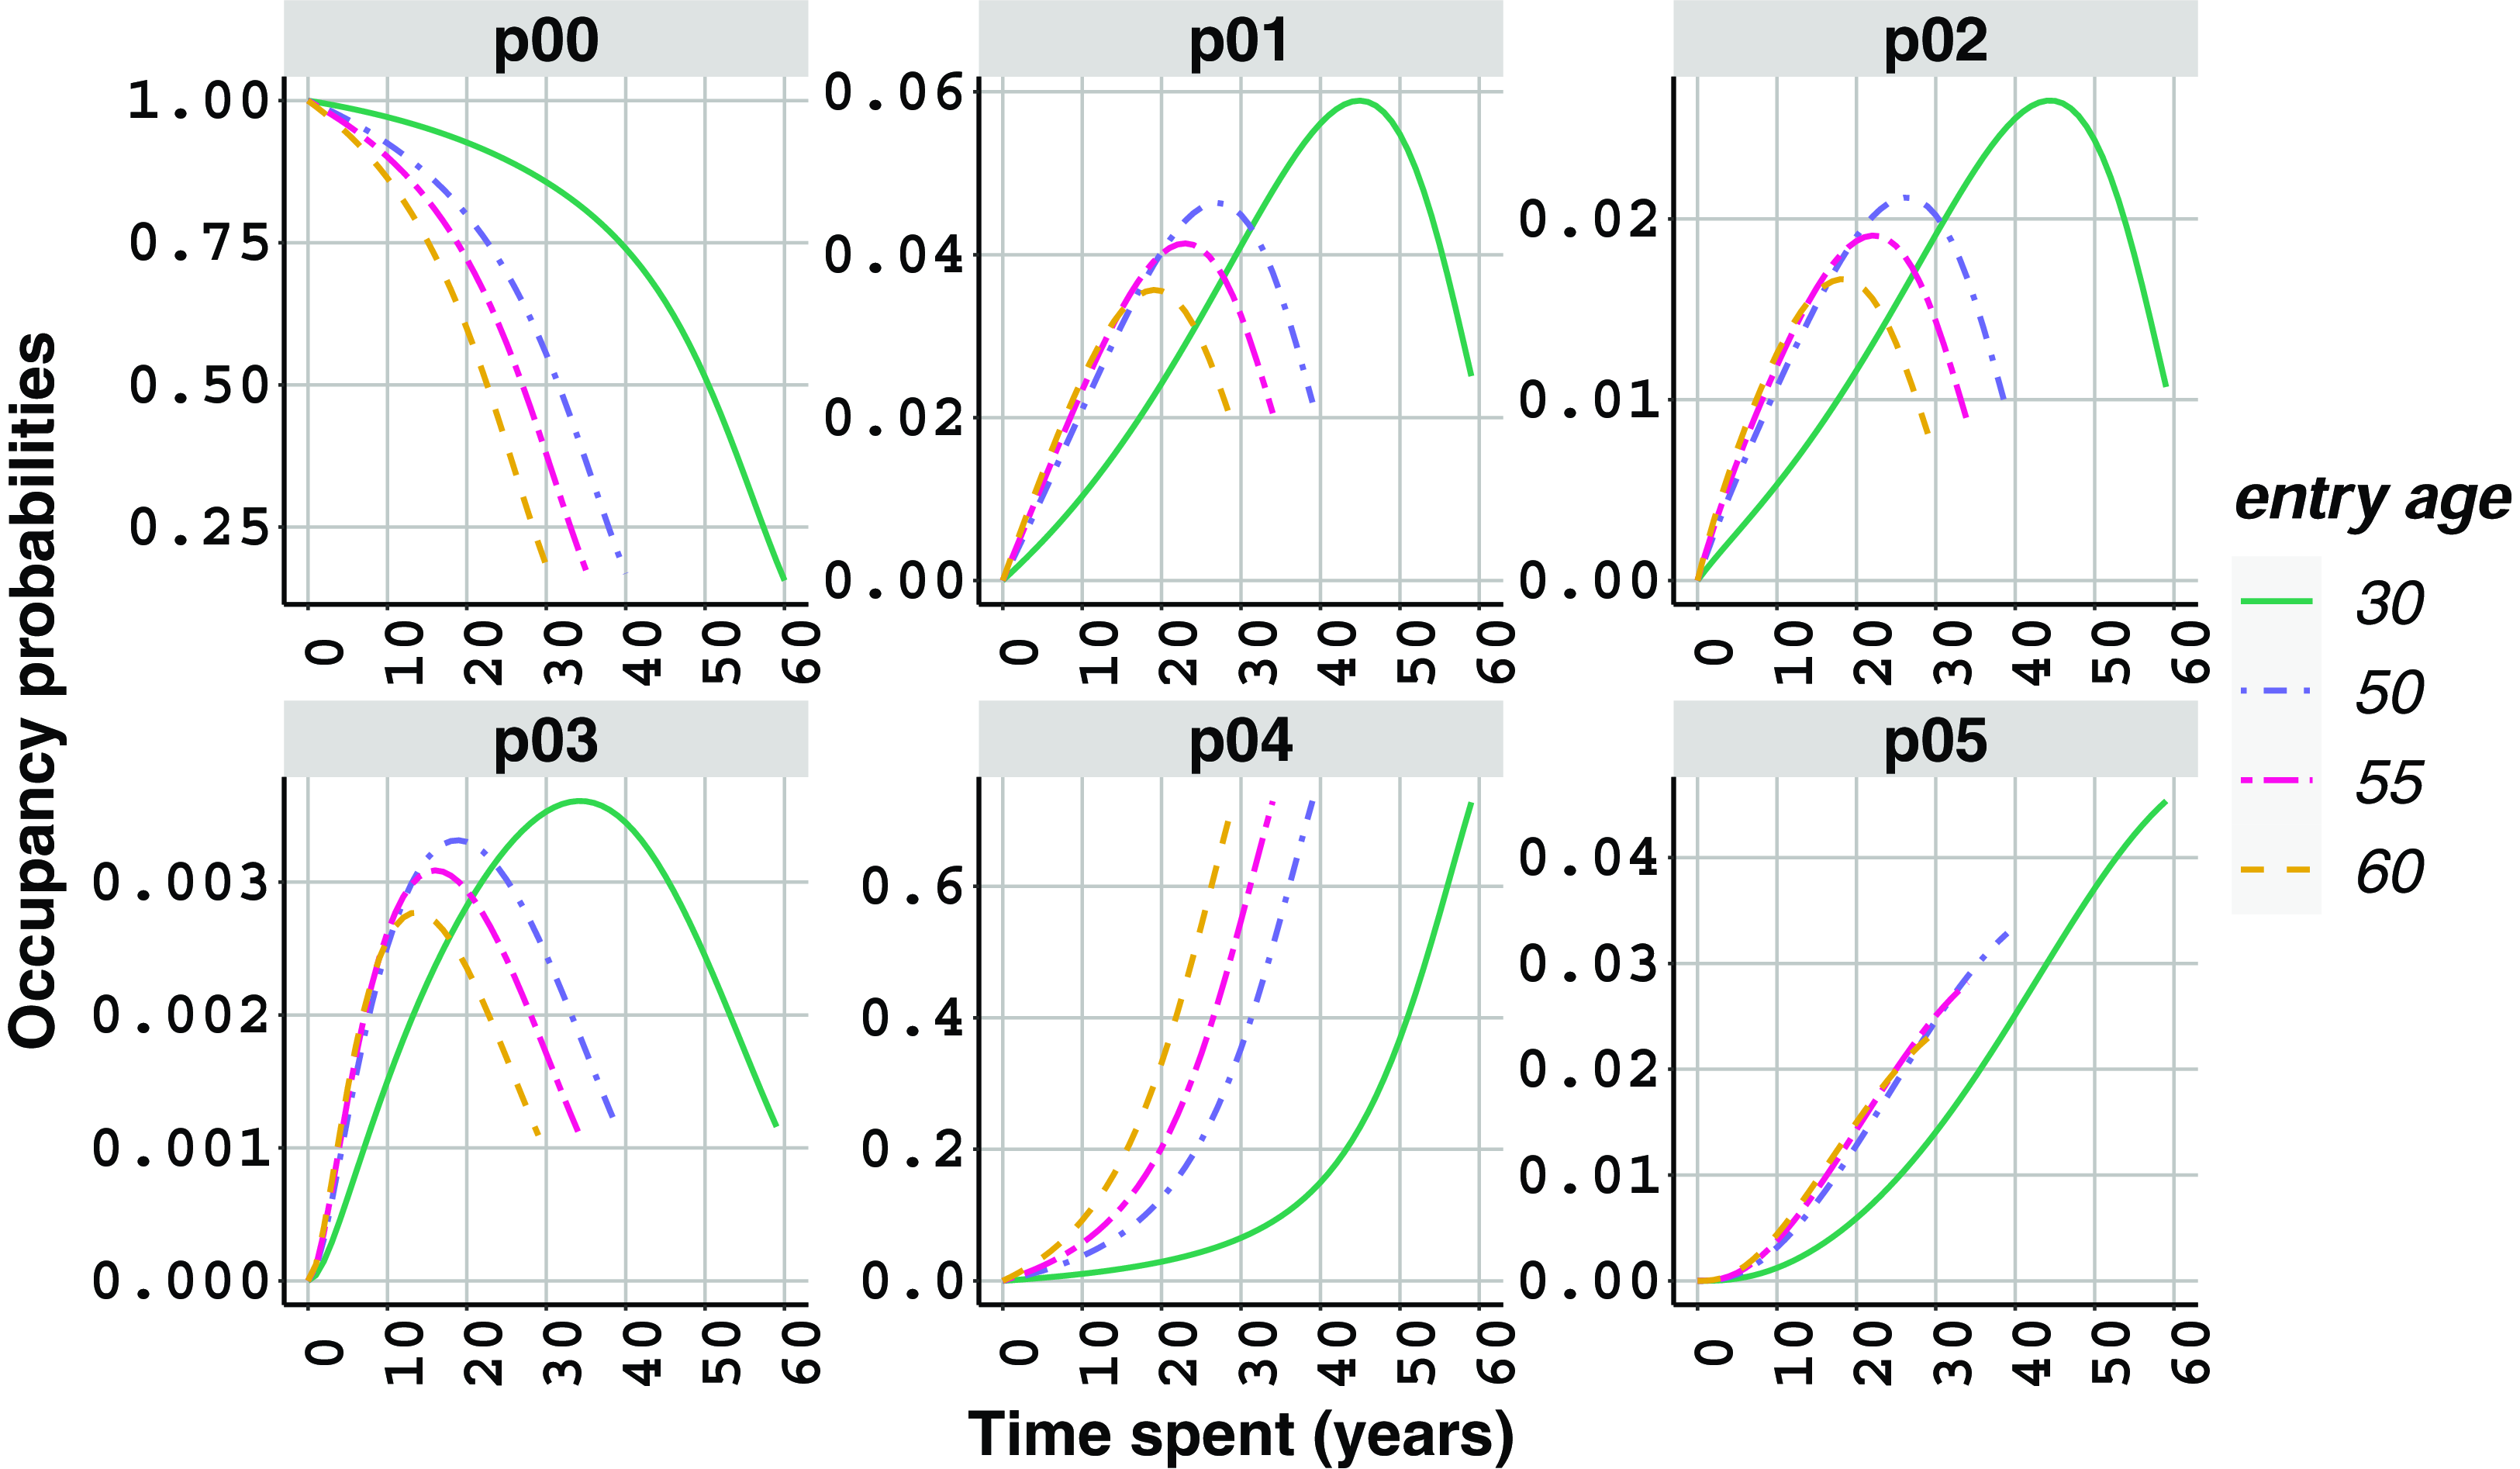
We note that the death probabilities from BC for a healthy woman under M0,
 ${_{t}} p^{03}_x$
, are estimated as significantly higher than those under the semi-Markov model, M1,
${_{t}} p^{03}_x$
, are estimated as significantly higher than those under the semi-Markov model, M1,
 ${_{t}} p^{05}_x$
, for the same
${_{t}} p^{05}_x$
, for the same
 $t$
. This is related to the assumption about the risk of dying from BC after receiving a BC diagnosis, that is
$t$
. This is related to the assumption about the risk of dying from BC after receiving a BC diagnosis, that is
 $\mu ^{13}_x$
under M0. In the absence of relevant data, we use a similar assumption for
$\mu ^{13}_x$
under M0. In the absence of relevant data, we use a similar assumption for
 $\mu ^{35}_x$
under M1, leading to high deaths from BC (Table 2). See Section 6 for further discussion related to this assumption.
$\mu ^{35}_x$
under M1, leading to high deaths from BC (Table 2). See Section 6 for further discussion related to this assumption.
4.4 Model validation: Breast cancer survival
We calculate age-specific net cancer survival, following the ONS definition (ONS, 2019b), with the aim of comparing our results with the ONS findings. This measures survival from a given cancer type after receiving a diagnosis, assuming that this cancer can be the only cause of death (Mariotto et al., Reference Mariotto, Noone, Howlader and Cho2014; Swaminathan and Brenner, Reference Swaminathan and Brenner2011). As an example, we can consider a woman diagnosed with pre-metastatic BC at age
 $x$
. BC survival of this woman in
$x$
. BC survival of this woman in
 $t$
years can be obtained, based on M1, as follows:
$t$
years can be obtained, based on M1, as follows:
 \begin{equation} \frac {1 - {_{t}} p^{14}_x \, - {_{t}} p^{15}_x \, }{1 - {_{t}} p^{14}_x }, \end{equation}
where
 ${_{t}} p^{14}_x$
represents mortality from other causes, and
${_{t}} p^{14}_x$
represents mortality from other causes, and
 ${_{t}} p^{15}_x$
represents mortality from BC at age
${_{t}} p^{15}_x$
represents mortality from BC at age
 $x$
in
$x$
in
 $t$
years time.
$t$
years time.
Fig. 8 shows net cancer survival from pre-metastatic and metastatic BC for a woman diagnosed with the related BC at different ages, based on M1. The relationship between BC survival with a pre-metastatic BC and age, Fig. 8a, demonstrates an inverse pattern, where survival seems to increase from age 30 to 60. These estimates are aligned with BC statistics in England. For instance, 5-year cancer survival for women aged 15–39 years at diagnosis between 2010 and 2014, followed up to 2015, is reported to be 85.5%, whereas the same survival for women aged 40–69 years is between 90.7% and 93.0%. Note that these figures do not distinguish cancer stages. Higher survival at older ages may be linked to the availability of BC screening for women aged 50–70 years at the time (ONS, 2016). Another reason might be the type of BC, which is more likely to be a more aggressive cancer for younger women as compared to older women (ONS, 2019a).
Estimated net cancer survival at different ages under the semi-Markov model M1, for a woman diagnosed with: (a) pre-metastatic breast cancer and (b) metastatic breast cancer.

At the same time, Fig. 8b points out significantly lower cancer survival estimates for women with metastatic BC, as compared to those with pre-metastatic BC (in Fig. 8a), where higher age is associated with lower cancer survival. One- and 5-year age standardised survival rates for women diagnosed with Stage 4 BC in 2012 to 2016, followed up to 2017, are reported to be 66% and 27.9%, respectively, while even 5-year survival estimates remain very high for women diagnosed with Stages 1–3 BC, which is above 96.5% (ONS, 2019a). It is important to highlight that while the age-standardized rates reported by the ONS are based on ages from 15 to 99 years, our estimates specifically focus on insured ages ranging from 30 to 60 years.
Note that survival estimates obtained under M0 are identical to the ones in Fig. 8b due to the assumptions about rates of transition to death from BC and other causes, respectively (see Table 2).
4.5 Model validation: The proportion of breast cancer deaths over all deaths
Model M0 in Fig. 1 is widely applied in CII by the insurance industry. Also, in the absence of reliable cause of death data, a particular approach, known as
 $k_x$
-method, is employed based on this model (Dash & Grimshaw, Reference Dash and Grimshaw1990; SAS, 2011; Institute and Faculty of Actuaries, 2014; Reynolds & Faye, Reference Reynolds and Faye2016). Specifically, this approach aims to identify the proportion of deaths from other causes in a given year depending on an input:
$k_x$
-method, is employed based on this model (Dash & Grimshaw, Reference Dash and Grimshaw1990; SAS, 2011; Institute and Faculty of Actuaries, 2014; Reynolds & Faye, Reference Reynolds and Faye2016). Specifically, this approach aims to identify the proportion of deaths from other causes in a given year depending on an input:
 $k_x$
. This input,
$k_x$
. This input,
 $k_x$
, is defined to be the proportion of deaths from a certain critical illness condition over all deaths at a given age
$k_x$
, is defined to be the proportion of deaths from a certain critical illness condition over all deaths at a given age
 $x$
. Appendix F provides a detailed account of derivation of
$x$
. Appendix F provides a detailed account of derivation of
 $k_x$
as outlined, e.g., in Reynolds & Faye (Reference Reynolds and Faye2016). Note that the related derivation shall be read in conjunction with the assumptions made under M0 (see Section 4.1).
$k_x$
as outlined, e.g., in Reynolds & Faye (Reference Reynolds and Faye2016). Note that the related derivation shall be read in conjunction with the assumptions made under M0 (see Section 4.1).
We understand that the motivation behind
 $k_x$
-method is to find a reasonable and simple approach to differentiate between critical illness and other causes of death in the absence of a comprehensive dataset. Particularly,
$k_x$
-method is to find a reasonable and simple approach to differentiate between critical illness and other causes of death in the absence of a comprehensive dataset. Particularly,
 $k_x$
values are used to indirectly estimate other causes of deaths in practice. Here, we attempt to define model-based
$k_x$
values are used to indirectly estimate other causes of deaths in practice. Here, we attempt to define model-based
 $k_x$
values under each model considered as part of this study. Afterward, the model-based
$k_x$
values under each model considered as part of this study. Afterward, the model-based
 $k_x$
values are compared with BC statistics in England to further validate model results.
$k_x$
values are compared with BC statistics in England to further validate model results.
Particularly, we define the proportion of model-based BC deaths at attained age
 $x$
as
$x$
as
 \begin{align*} \hat {k}_{x} = \frac { { {_{x}} p^{01}_0} \mu ^{13}_x}{ {_{x}} p^{00}_0 \mu ^{02}_x + {_{x}} p^{01}_0 \mu ^{12}_x + { {_{x}} p^{01}_0} \mu ^{13}_x }, \end{align*}
based on M0; and
 \begin{align*} \hat {k}_{x} = \frac { { {_{x}} p^{03}_0 \mu _{x}^{35} } }{{ {_{x}} p^{00}_0 \mu _{x}^{04} + {_{x}} p^{01}_0 \mu _{x}^{14} + {_{x}} p^{02}_0 \mu _{x}^{24} + {_{x}} p^{03}_0 \mu _{x}^{34} +{_{x}} p^{03}_0 \mu _{x}^{35} } }, \end{align*}
based on M1 and M2. Note that, for simplicity, the formulas above are defined for a cohort starting in State 0 at age 0.
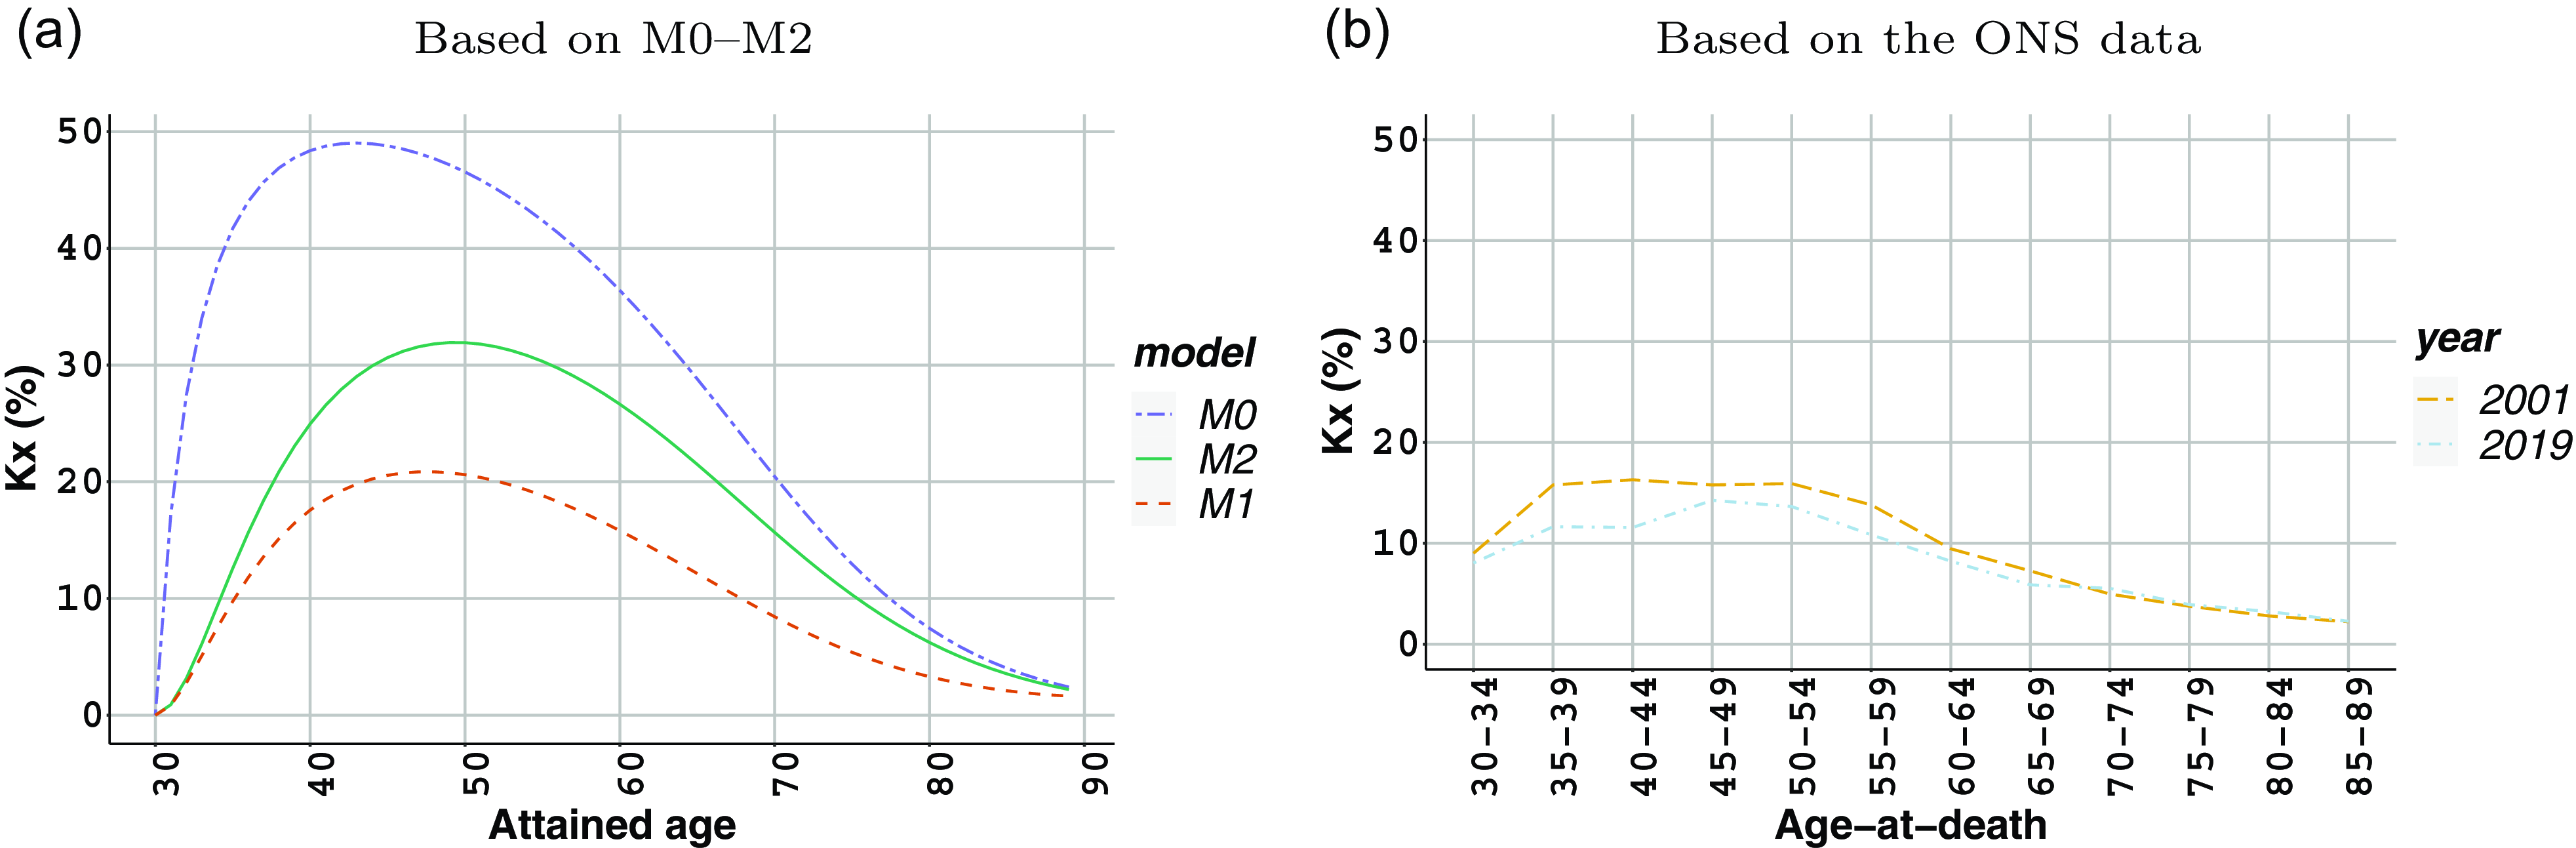
Fig. 9 exhibits model based and observed values of
 $k_x$
. Specifically, Fig. 9a shows estimated BC deaths over all deaths for policyholders aged 30 years, with no BC (State 0), at time zero. Note that the models are calibrated as described in Sections 4.1–4.2 with a boundary condition
$k_x$
. Specifically, Fig. 9a shows estimated BC deaths over all deaths for policyholders aged 30 years, with no BC (State 0), at time zero. Note that the models are calibrated as described in Sections 4.1–4.2 with a boundary condition
 ${_ {0}} p^{00}_{30} =1$
(Appendices A and B). Meanwhile, Fig. 9b displays the proportion of BC deaths over all deaths, based on the population data of England in 2001 and 2019. We see significantly higher estimates based on M0 as compared to the observed values, such as around 48%, for a woman aged 30 years, after staying for 10 years in State 0. The same value is estimated to be 18% and 25% based on M1 and M2, respectively, which are more aligned with the observed value at ages 40–44. The main reason for this difference is that the rates of transition to death from BC after a diagnosis under M0, have been defined using the mortality of women with metastatic BC. It is important to note that this assumption, made in the absence of relevant data, results in higher than expected BC deaths in that modeling setting. Nonetheless, this indicates high sensitivity to model assumptions under M0, urging to be cautious with the related assumptions. Provided that we rely on average rates of transition in 2001–2019, we see that the estimates based on M1 (primarily) and M2 in Fig. 9a are broadly aligned with the empirical values shown in Fig. 9b, with an obvious discrepancy at age 30 due to the boundary condition.
${_ {0}} p^{00}_{30} =1$
(Appendices A and B). Meanwhile, Fig. 9b displays the proportion of BC deaths over all deaths, based on the population data of England in 2001 and 2019. We see significantly higher estimates based on M0 as compared to the observed values, such as around 48%, for a woman aged 30 years, after staying for 10 years in State 0. The same value is estimated to be 18% and 25% based on M1 and M2, respectively, which are more aligned with the observed value at ages 40–44. The main reason for this difference is that the rates of transition to death from BC after a diagnosis under M0, have been defined using the mortality of women with metastatic BC. It is important to note that this assumption, made in the absence of relevant data, results in higher than expected BC deaths in that modeling setting. Nonetheless, this indicates high sensitivity to model assumptions under M0, urging to be cautious with the related assumptions. Provided that we rely on average rates of transition in 2001–2019, we see that the estimates based on M1 (primarily) and M2 in Fig. 9a are broadly aligned with the empirical values shown in Fig. 9b, with an obvious discrepancy at age 30 due to the boundary condition.
 $\hat {k}_{x}$
values (a) based on different models, and observed
$\hat {k}_{x}$
values (a) based on different models, and observed
 $k_x$
values (b) based on the ONS data.
$k_x$
values (b) based on the ONS data.
5. Net premium rates: Definitions and results
In this section, we first introduce two main types of insurance contracts and explain calculation of related net insurance premiums. Then, we examine the insurance premiums for the CII contract described in (7) and the life insurance contract described in (9) under various scenarios linked to BC diagnosis and treatment. Last, we present and compare net insurance premiums for a wider range of life insurance contracts for women across varying ages under different modeling assumptions.
5.1 Net single premiums for different insurance contracts
CII is a popular insurance contract that covers cancer as one of the core diseases, also including heart attack, stroke, and so on. Alongside, BC life insurance has recently been attracting more attention in the life insurance industry. This is possibly linked to increasing demands from people with existing conditions or, perhaps, with a related medical history. However, premium rates for the latter contract are noted to vary significantly from one insurance company to another, as a result of several factors impacting the underwriting process (iamInsured, 2023). For instance, age, a common risk factor, can be a strong determinant of a BC premium, due to the distinctive age-specific curve in BC incidence resulting from very large changes in estrogen level of women after age 50 (Bray et al., Reference Bray, McCarron and Parkin2004; Henderson et al., Reference Henderson, Ross and Bernstein1988). At the same time, provided high survival rates from BC, increasing chances of preventing recurrence with more advanced medical technology and a better understanding of the disease over time, it would be possible to tailor a contract for an individual surviving BC. In that case, other factors, such as cancer stage and time since the end of treatment, can become the main determinants of the insurance premium (The Insurance Surgery, 2023).
We consider two different insurance contracts here, noting that our focus is on the impact of different modeling assumptions. Following the study of Baione & Levantesi (Reference Baione and Levantesi2018), the first is a special accelerated CII contract, where a single benefit is paid when the insured
-
(i) is either diagnosed with BC for the first time; or
-
(ii) dies from other causes before being diagnosed with BC.
The net single premium for this contract is an accelerated death benefit along with a benefit paid at the time of diagnosis, and this can be calculated based on the industry-based model, M0, in Fig. 1 as
 \begin{eqnarray} {_ {\text {CI}, 1}}\bar {A}_{x} = \int _{0}^{\infty }{ e^{-\delta t} {_ {t}} p^{00}_x \bigg ( \mu ^{01}_{x+t} + \mu ^{02}_{x+t} \bigg ) dt}. \end{eqnarray}
The net single premium for the same contract, based on the semi-Markov model, M1, in Fig. 2, can be determined as
 \begin{eqnarray} {_ {\text {CI}, 2}}\bar {A}_{x} &= & \int _{0}^{\infty }{ e^{-\delta t} {_ {t}} p^{00}_x \bigg ( \mu ^{01}_{x+t} + \mu ^{04}_{x+t} \bigg ) dt} \\ & + & \int _{0}^{\infty }{ e^{-\delta u} {_ {u}} p^{00}_x \mu ^{02}_{x+u} \int _{0}^{\infty }{ e^{-\delta t} {_ {t}} p^{22}_{[x+u]} \bigg ( \mu ^{23}_{[x+u]+t} + \mu ^{24}_{[x+u]+t} \bigg ) dt} \,\,du }.\nonumber \end{eqnarray}
Here,
 $\delta$
is the instantaneous constant force of interest rate, and we assume that
$\delta$
is the instantaneous constant force of interest rate, and we assume that
-
(i) the insured purchases the product before being diagnosed with BC, i.e., in State 0 “No BC”; and
-
(ii) there is no waiting time between cancer diagnosis and the insurance payment.
Note that, in order to make the formulae clearer, we have slightly modified earlier notation and have used actuarial selection notation. For instance,
 $\mu ^{23}_{x,z}$
is presented based on select attained age
$\mu ^{23}_{x,z}$
is presented based on select attained age
 $[x]$
with duration
$[x]$
with duration
 $z$
, such that
$z$
, such that
 $\mu ^{23}_{x,z} = \mu ^{23}_{[x]+z}$
.
$\mu ^{23}_{x,z} = \mu ^{23}_{[x]+z}$
.
The second contract under consideration is a life insurance contract that can also be purchased with an existing BC condition and provides a single death benefit at the time of death. The net single premium for this contract, that is a death benefit from any cause for an insured person with no BC at the time of purchase, can be expressed based on the industry-based model as
 \begin{eqnarray} {_ {\text {LI}, 1}}\bar {A}_{x} = \int _{0}^{\infty }{ e^{-\delta t} \bigg ( {_ {t}} p^{00}_x \mu ^{02}_{x+t} + {_ {t}} p^{01}_x \big ( \mu ^{12}_{x+t} + \mu ^{13}_{x+t} \big ) \bigg ) dt }, \end{eqnarray}
while under the semi-Markov model it can be written as
 \begin{eqnarray} {_ {\text {LI}, 2}}\bar {A}_{x} & = & \int _{0}^{\infty }{ e^{-\delta t} \bigg ( {_ {t}} p^{00}_x \mu ^{04}_{x+t} + {_ {t}} p^{01}_x \mu ^{14}_{x+t} + {_ {t}} p^{02}_x \mu ^{24}_{x+t} \bigg ) dt} \\ & + & \int _{0}^{\infty }{ e^{-\delta u} {_ {u}} p^{01}_x \mu ^{13}_{x+u} \int _{0}^{\infty }{ e^{-\delta t} {_ {t}} p^{33}_{[x+u]} \bigg ( \mu ^{34}_{[x+u]+t} + \mu ^{35}_{[x+u]+t} \bigg ) dt} \,\,du } \nonumber \\ & + & \int _{0}^{\infty }{ e^{-\delta u} {_ {u}} p^{02}_x \mu ^{23}_{x+u} \int _{0}^{\infty }{ e^{-\delta t} {_ {t}} p^{33}_{[x+u]} \bigg ( \mu ^{34}_{[x+u]+t} + \mu ^{35}_{[x+u]+t} \bigg ) dt} \,\,du }.\nonumber \end{eqnarray}
At the same time, the net single premium for the same contract, for an insured individual with BC at the time of purchase, can be determined based on the industry-based model as
 \begin{eqnarray} {_ {\text {LI}, 3}}\bar {A}_{x} &= & \int _{0}^{\infty }{ e^{-\delta t} {_ {t}} p^{11}_x \bigg ( \mu ^{12}_{x+t} + \mu ^{13}_{x+t} \bigg )dt}, \end{eqnarray}
and the premium for an insured person with pre-metastatic BC, is written based on the semi-Markov model as
 \begin{eqnarray} {_ {\text {LI}, 4}}\bar {A}_{x} &= & \int _{0}^{\infty }{ e^{-\delta t} {_ {t}} p^{11}_x \mu ^{14}_{x+t} dt} \\ & + & \int _{0}^{\infty }{ e^{-\delta u} {_ {u}} p^{11}_x \mu ^{13}_{x+u} \int _{0}^{\infty }{ e^{-\delta t} {_ {t}} p^{33}_{[x+u]} \bigg ( \mu ^{34}_{[x+u]+t} + \mu ^{35}_{[x+u]+t} \bigg ) dt} \,\,du }.\nonumber \end{eqnarray}
Note that the net single premiums of the contracts under consideration, defined in (6)–(11), are expressed for whole life insurance contracts. The upper bound of related integrals in each formula would change in the case of term insurance contracts. We also note that the net single premiums for these contracts under the special case of the semi-Markov model, M2, can be found in Appendix E.
5.2 Different diagnosis and treatment considerations
In this section, we examine estimated net insurance premiums under various considerations relating to BC diagnosis and treatment in the semi-Markov model (M1). This is done by choosing a range of values for parameters
 $\alpha$
and
$\alpha$
and
 $\beta$
, such that
$\beta$
, such that
 $\alpha = \{ 0.1, 0.2, \ldots, 0.9 \}$
and
$\alpha = \{ 0.1, 0.2, \ldots, 0.9 \}$
and
 $\beta = \big \{ \frac {1}{2}, \frac {1}{3}, \ldots, \frac {1}{10} \big \}$
.
$\beta = \big \{ \frac {1}{2}, \frac {1}{3}, \ldots, \frac {1}{10} \big \}$
.
Particularly, the value of parameter
 $\alpha$
is associated with BC diagnosis, allowing us to distinguish between diagnosed and undiagnosed BC cases, by considering the proportion of BC diagnoses out of all BC cases. We consider a range of
$\alpha$
is associated with BC diagnosis, allowing us to distinguish between diagnosed and undiagnosed BC cases, by considering the proportion of BC diagnoses out of all BC cases. We consider a range of
 $\alpha$
values changing from 0.1 to 0.9, while all other model quantities are calibrated as before. Note that
$\alpha$
values changing from 0.1 to 0.9, while all other model quantities are calibrated as before. Note that
 $\alpha$
is defined within the range
$\alpha$
is defined within the range
 $0\lt \alpha \lt 1$
(see (2)), where
$0\lt \alpha \lt 1$
(see (2)), where
 $\alpha =0.1$
is associated with, e.g., a health system with notably poor BC diagnosis (representing 10% of all BC cases) while
$\alpha =0.1$
is associated with, e.g., a health system with notably poor BC diagnosis (representing 10% of all BC cases) while
 $\alpha =0.9$
corresponds to high BC diagnosis (representing 90% of all BC cases).
$\alpha =0.9$
corresponds to high BC diagnosis (representing 90% of all BC cases).
The value of parameter
 $\beta$
is used to differentiate between rates of transition from pre-metastatic BC, whether observed or unobserved, to metastatic BC. In other words, this parameter can be considered as a proxy to the rate of BC metastasis in the absence of cancer treatment since BC treatment would not be accessible to the women with undiagnosed cancer. We consider a set of
$\beta$
is used to differentiate between rates of transition from pre-metastatic BC, whether observed or unobserved, to metastatic BC. In other words, this parameter can be considered as a proxy to the rate of BC metastasis in the absence of cancer treatment since BC treatment would not be accessible to the women with undiagnosed cancer. We consider a set of
 $\beta$
values from
$\beta$
values from
 $\frac {1}{2}$
to
$\frac {1}{2}$
to
 $\frac {1}{10}$
within the range
$\frac {1}{10}$
within the range
 $0\lt \beta \lt 1$
(see (3)). Here,
$0\lt \beta \lt 1$
(see (3)). Here,
 $\beta = \frac {1}{2}$
is associated with a higher-level access to BC treatment, whereas
$\beta = \frac {1}{2}$
is associated with a higher-level access to BC treatment, whereas
 $\beta = \frac {1}{10}$
is relating to a lower-level access to BC treatment.
$\beta = \frac {1}{10}$
is relating to a lower-level access to BC treatment.
Net single premium rates for a specialized life insurance contract, (9), for policyholders without breast cancer at the time of purchase, £1,000 benefit, payable at the time of death, based on the semi-Markov model M1.

Our analysis suggests that changes in the values of
 $\alpha$
and
$\alpha$
and
 $\beta$
have no impact on life insurance premiums, described in (11) and (12), for women with (pre-metastatic) BC (see (2)–(3) and Table 2 for the definitions of related transition intensities). However, any adjustment in the value of
$\beta$
have no impact on life insurance premiums, described in (11) and (12), for women with (pre-metastatic) BC (see (2)–(3) and Table 2 for the definitions of related transition intensities). However, any adjustment in the value of
 $\alpha$
or
$\alpha$
or
 $\beta$
does impact insurance premiums for a healthy woman. Thus, we examine changes in net insurance premiums for the accelerated life insurance and CII contracts, in (9) and (7), respectively, for a woman with no BC medical record at the time of purchase based on various values of
$\beta$
does impact insurance premiums for a healthy woman. Thus, we examine changes in net insurance premiums for the accelerated life insurance and CII contracts, in (9) and (7), respectively, for a woman with no BC medical record at the time of purchase based on various values of
 $\alpha$
and
$\alpha$
and
 $\beta$
in Figs. 10 and 11.
$\beta$
in Figs. 10 and 11.
Specifically, Fig. 10 presents the net single premiums for a whole life and 10-year life insurance contract for a woman aged 35 years, Fig. 10a and c, respectively, and for a woman aged 60 years, Fig. 10b and d, where the effective rate of interest is 2% per year. As expected, for a given
 $\alpha$
and
$\alpha$
and
 $\beta$
, higher net insurance premiums are shown as a result of a higher insured age. Our results demonstrate sensitivity to the choice of
$\beta$
, higher net insurance premiums are shown as a result of a higher insured age. Our results demonstrate sensitivity to the choice of
 $\alpha$
and
$\alpha$
and
 $\beta$
parameters, particularly in extreme cases. Importantly, a poor BC diagnosis, where
$\beta$
parameters, particularly in extreme cases. Importantly, a poor BC diagnosis, where
 $\alpha \lt 0.4$
, leads to greater sensitivity in the model results, especially in the context of limited access to BC treatment (lower values of
$\alpha \lt 0.4$
, leads to greater sensitivity in the model results, especially in the context of limited access to BC treatment (lower values of
 $\beta$
). However, when BC diagnosis is reasonably high, e.g.,
$\beta$
). However, when BC diagnosis is reasonably high, e.g.,
 $\alpha \gt 0.5$
, more consistent net premium rates are obtained for different purchasing ages and maturities.
$\alpha \gt 0.5$
, more consistent net premium rates are obtained for different purchasing ages and maturities.
Fig. 11 shows the estimated net single insurance premiums for the accelerated CII insurance contract at selected maturities for women aged 35 years, Fig. 11a and c, and aged 60 years, Fig. 11b and d. Similar to the estimates in Fig. 10, an
 $\alpha$
value associated with a poor BC diagnosis seems to be the main reason of greater sensitivity in our findings.
$\alpha$
value associated with a poor BC diagnosis seems to be the main reason of greater sensitivity in our findings.
Our findings are also calculated at a different effective rate of interest, 4%, which corroborates the conclusions drawn from the results presented in Figs. 10 and 11 (see Appendix G).
Net single premium rates for a specialized CII contract, (7), for policyholders without breast cancer at the time of purchase, £1,000 benefit, payable at the time of event, based on the semi-Markov model M1.

5.3 Net single premium results
Fig. 12 displays the estimated net single premiums for the accelerated CII contracts, in (6) and (7), and the life insurance contracts, in (8)–(11), calculated based on M0–M2 at varying maturities, across different policyholders aged between 35–60 for
 $\alpha =0.6$
and
$\alpha =0.6$
and
 $\beta =1/7$
. We use 2% and 4% effective rates of interest, respectively. The figure mainly compares the estimated net single premiums for a woman with no BC, with those for a woman with pre-metastatic BC diagnosis at the time of purchase or 5 years before the time of purchase. As expected, a higher age-at-purchase, a longer maturity, or a lower rate of interest lead to higher net single premiums.
$\beta =1/7$
. We use 2% and 4% effective rates of interest, respectively. The figure mainly compares the estimated net single premiums for a woman with no BC, with those for a woman with pre-metastatic BC diagnosis at the time of purchase or 5 years before the time of purchase. As expected, a higher age-at-purchase, a longer maturity, or a lower rate of interest lead to higher net single premiums.
We note that additional analysis is carried out by examining specific values of
 $\alpha$
, namely 0.4 and 0.8, while keeping all other model parameters calibrated consistently, and assuming
$\alpha$
, namely 0.4 and 0.8, while keeping all other model parameters calibrated consistently, and assuming
 $\beta$
to be
$\beta$
to be
 $\frac {1}{7}$
. Similarly, we explore selected values of
$\frac {1}{7}$
. Similarly, we explore selected values of
 $\beta$
, specifically
$\beta$
, specifically
 $\frac {1}{5}$
and
$\frac {1}{5}$
and
 $\frac {1}{10}$
, again with other model parameters calibrated consistently, and assuming
$\frac {1}{10}$
, again with other model parameters calibrated consistently, and assuming
 $\alpha$
to be 0.6. Details can be found in Appendix H.
$\alpha$
to be 0.6. Details can be found in Appendix H.
Differences in net premiums across different models. Pricing differences across different models can be justified with respect to the following points: (i) number of departures from State 0 and (ii) definition of State 1. Specifically, under M1 and M2, we allow three departures from State 0. One of these three departures, to "Pre-metastatic Unobserved," is not considered under M0. Meanwhile, one of the other two departures, to State 1, linked to cancer registrations, is defined differently (see Section 4.1). These have two main consequences. First, the occupancy probability
 ${_ {t}} p^{00}_x$
, which is crucial for pricing purposes, is estimated to be lower under M1 and M2, as compared to M0, because of the higher number of departures in the former model(s). Second, State 1 in M1 and M2 is defined to be a state involving pre-metastatic BC cases, i.e., Stages 1–3 BC, whereas State 1 in M0 combines all BC registrations into a single state without accounting for cancer stage information. This then implies that we have lower rates of transition to State 1,
${_ {t}} p^{00}_x$
, which is crucial for pricing purposes, is estimated to be lower under M1 and M2, as compared to M0, because of the higher number of departures in the former model(s). Second, State 1 in M1 and M2 is defined to be a state involving pre-metastatic BC cases, i.e., Stages 1–3 BC, whereas State 1 in M0 combines all BC registrations into a single state without accounting for cancer stage information. This then implies that we have lower rates of transition to State 1,
 $\mu ^{01}_{x}$
, in M1 and M2, in comparison to the rates used in M0 (Table 2).
$\mu ^{01}_{x}$
, in M1 and M2, in comparison to the rates used in M0 (Table 2).
Differences between CII and life insurance premiums. We can see smaller net single premiums in Fig. 12 for the life insurance contracts for a woman with no BC, as compared to those calculated for the CII contracts. Note that the differences between related premiums are much smaller under M0 due to the definition of State 1 and the assumption linked to BC deaths. The main reason for observing smaller life insurance premiums in general is that BC morbidity is a bigger risk than BC mortality for a healthy woman, and both BC diagnosis or death from other causes lead to a benefit payment under the CII contract. Meanwhile, only death from any cause leads to a benefit payment under the life insurance contract.
Net single premium rates for specialized critical illness, (6)–(7), and life insurance contracts, (8)–(11), and (12), for policyholders with or without breast cancer at the time of purchase, £1,000 benefit, payable at the time of event, based on M0–M2 in Table 1, when
 $\alpha = 0.6$
and
$\alpha = 0.6$
and
 $\beta = 1/7$
.
$\beta = 1/7$
.

Differences in life insurance premiums with BC diagnosis. We observe considerably higher premium estimates for a woman with BC diagnosis at the time of purchase under M0, in comparison to the estimates for a woman with pre-metastatic BC diagnosis under M1–M2. This highlights the importance of our more detailed modeling in M1 and M2.
Our findings for women with pre-metastatic BC under M1 and M2 point toward the significance of modeling for the time spent with observed and unobserved pre-metastatic BC. The combined impact on the insurance premiums leads to higher premiums under M1, as compared to M2. This is more evident for a contract with shorter maturity. We can see, e.g., in a whole life insurance contract under M1, that the differences in the estimated premiums for women with no BC or pre-metastatic BC diagnosis at the time of purchase get smaller with higher age-at-purchase or age-at-diagnosis and a longer time to maturity (Fig. 12a and b). This can be because the risk of developing a metastatic cancer, after being diagnosed with pre-metastatic BC, becomes fairly stable after about 5 years with a peak at about the first 2 years (also see Fig. 1 in Colzani et al., Reference Colzani, Johansson, Liljegren and Foukakis2014), where BC risk becomes a relatively lower risk as opposed to other risk factors.
Life insurance premiums 5-year after pre-metastatic BC diagnosis. We have estimated net single premiums for a life insurance contract for a woman diagnosed with pre-metastatic BC 5 years ago at time of purchase, under M1. This aims to determining the impact of eliminating the high-risk years of developing metastatic BC on the net insurance premiums, where we would expect lower insurance premiums by allowing the insurance contract to be tailored in a way to be more inclusive. This calculation can be carried out by modifying (11) as follows:
 \begin{eqnarray} {_ {\text {LI}, 4}}\bar {A}_{x} &= & \int _{0}^{\infty }{ e^{-\delta t} {_ {t}} p^{11}_{[x-5]+5} \mu ^{14}_{x+t} dt} \\ & + & \int _{0}^{\infty }{ e^{-\delta u} {_ {u}} p^{11}_{[x-5]+5} \mu ^{13}_{[x-5]+5+u} \int _{0}^{\infty }{ e^{-\delta t} {_ {t}} p^{33}_{x+u} \bigg ( \mu ^{34}_{x+u+t} + \mu ^{35}_{x+u+t} \bigg ) dt} \,\,du },\nonumber\\[-12pt]\nonumber \end{eqnarray}
where the upper boundary in the integrals would be set differently for a term life insurance contract.
Our findings suggest lower premiums for a woman after 5 years of BC diagnosis, where smaller differences are observed with an increasing time to maturity. Our results demonstrate intuitive outcomes, aligned with medical observations. Yet, these premiums can be higher than expected by considering, for instance, the premiums for a woman after 5 years of BC diagnosis under "right to be forgotten" initiative (Insurance Europe, 2021). The difference between the estimated premiums under M1 and the premiums, e.g., under the "right to be forgotten" initiative could be linked to two assumptions that we maintained during our calculations: (i) the woman with pre-metastatic BC is assumed to be in State 1 at the time of purchase, where the implicit assumption is that the woman is not free of BC, even after 5 years, but the risk of developing metastatic BC has been considerably reduced and (ii) we have not accounted for time trend in any of the transition rates in our modeling, including the trend in the risk of developing metastatic BC, which may have improved significantly as a result of medical advances (Colzani et al., Reference Colzani, Johansson, Liljegren and Foukakis2014).
We note that a similar calculation as (12) under M2 would lead to the same results for a woman with pre-metastatic BC diagnosis due to the lack of duration dependence assumption in M2. Also, such calculation would not be possible under M0 since this model does not distinguish between different cancer stages, and it does not account for duration dependence in transition intensities after BC diagnosis.
6. Post-cancer Mortality from breast cancer under Model M0
Under M0, in the absence of data, we have assumed that the rates of transition from BC to death could be determined using the rates based on the risk of death from BC for women with metastatic BC (Section 4.1). In other words, in Section 5, these transition rates have been calibrated by considering the risk of death from BC for women with metastatic BC (Zhao et al., Reference Zhao, Xu and Guo2020). However, State 1 in M0 involves all BC registrations, where rates of transition from State 1 to death from BC,
 $\mu ^{13}_x$
, at a given age
$\mu ^{13}_x$
, at a given age
 $x$
, should be determined by considering the risk of death from BC for women with any type of BC.
$x$
, should be determined by considering the risk of death from BC for women with any type of BC.
Although we can assume that death from BC without metastatic BC is rare enough to ignore (Redig & McAllister, Reference Redig and McAllister2013), this assumption suggests that everyone in State 1, under M0, has the same risk of death from BC, similar to a woman with metastatic BC. Thus, this leads to unrealistic net premiums, as compared to M1. We therefore consider the sensitivity of the main findings to a different set of
 $\mu ^{13}_x$
values.
$\mu ^{13}_x$
values.
Giannakeas et al. (Reference Giannakeas, Sopik and Narod2020) estimate the risk of death from BC for women diagnosed with primary ductual carcinoma in situ (DCIS) between 1995 and 2014, based on the SEER database. DCIS is the appearance of cancer cells or tumors within the breast area without showing any presence beyond that area. Hereby, this type of cancer can be associated with early stage BC, such as Stage 1 BC. The risk of dying from BC has been found to be approximately threefold greater than that for women at the same age with no BC in the general population (Giannakeas et al., Reference Giannakeas, Sopik and Narod2020). Following this study, we can determine
 $\mu ^{13}_x$
by using the population mortality from BC in England (Fig. 3b). In particular, we use average mortality from BC between 2001 and 2019, with this being increased by a factor of 3 for all ages (Table 3). Note that the rates in Table 3 accept that everybody in State 1 would be exposed to the same risk of death from BC similar to a woman with DCIS at the time of diagnosis. Although this would lead to lower estimates than expected, we could consider these rates to be, perhaps, a lower boundary to define
$\mu ^{13}_x$
by using the population mortality from BC in England (Fig. 3b). In particular, we use average mortality from BC between 2001 and 2019, with this being increased by a factor of 3 for all ages (Table 3). Note that the rates in Table 3 accept that everybody in State 1 would be exposed to the same risk of death from BC similar to a woman with DCIS at the time of diagnosis. Although this would lead to lower estimates than expected, we could consider these rates to be, perhaps, a lower boundary to define
 $\mu ^{13}_{x}$
.
$\mu ^{13}_{x}$
.
Modified rates of transition from State 1 to State 3 at different ages in the industry-based model M0

Changing rates of transition to death from BC has a significant impact on
 $\hat {k}_x$
values. As a result of using the rates of transition in Table 3, we have found that the proportion of estimated BC deaths over all deaths has dramatically declined to a level that is lower than that obtained under M1 (Fig. I22 in Appendix I). This result is aligned with the medical literature. The risk of death from BC with DCIS within 20 years is very low, such that approximately 3% of the women with DCIS would be expected to die from BC (Narod et al., Reference Narod, Iqbal, Giannakeas, Sopik and Sun2015). This clearly demonstrates that the rates of transition to death from BC,
$\hat {k}_x$
values. As a result of using the rates of transition in Table 3, we have found that the proportion of estimated BC deaths over all deaths has dramatically declined to a level that is lower than that obtained under M1 (Fig. I22 in Appendix I). This result is aligned with the medical literature. The risk of death from BC with DCIS within 20 years is very low, such that approximately 3% of the women with DCIS would be expected to die from BC (Narod et al., Reference Narod, Iqbal, Giannakeas, Sopik and Sun2015). This clearly demonstrates that the rates of transition to death from BC,
 $\mu ^{13}_{x}$
, under M0 have a crucial role in identifying
$\mu ^{13}_{x}$
, under M0 have a crucial role in identifying
 $k_x$
values, and they should be determined with caution.
$k_x$
values, and they should be determined with caution.
It is also important to highlight the impact of the change in
 $\mu ^{13}_{x}$
values, on net cancer survival (Fig. I21). As expected, setting
$\mu ^{13}_{x}$
values, on net cancer survival (Fig. I21). As expected, setting
 $\mu ^{13}_{x}$
with respect to the women with DCIS leads to higher cancer survival rates, which is more in line with net cancer survival from a pre-metastatic BC. However, the model seems not to be able to capture the adverse pattern in age-specific cancer survival observed in Fig. 8a.
$\mu ^{13}_{x}$
with respect to the women with DCIS leads to higher cancer survival rates, which is more in line with net cancer survival from a pre-metastatic BC. However, the model seems not to be able to capture the adverse pattern in age-specific cancer survival observed in Fig. 8a.
The impact on life insurance premiums is also relevant, with premiums obtained with
 $\mu ^{13}_{x}$
in Table 3 under M0 being shown in Fig. I23, along with the related insurance premiums under M1 and M2, when
$\mu ^{13}_{x}$
in Table 3 under M0 being shown in Fig. I23, along with the related insurance premiums under M1 and M2, when
 $\alpha = 0.6$
and
$\alpha = 0.6$
and
 $\beta = 1/7$
. As a result of having considerably fewer BC deaths due to the change in
$\beta = 1/7$
. As a result of having considerably fewer BC deaths due to the change in
 $\mu ^{13}_{x}$
(see Table 3), the estimated premiums for a life insurance contract, with or without BC diagnosis at the time of purchase, based on M0, are estimated to be considerably lower. For example, they are lower than the premiums for a woman after 5 years of pre-metastatic BC diagnosis under M1. Note that the impact on CII insurance pricing is not discussed here, since the definition of
$\mu ^{13}_{x}$
(see Table 3), the estimated premiums for a life insurance contract, with or without BC diagnosis at the time of purchase, based on M0, are estimated to be considerably lower. For example, they are lower than the premiums for a woman after 5 years of pre-metastatic BC diagnosis under M1. Note that the impact on CII insurance pricing is not discussed here, since the definition of
 $\mu ^{13}_{x}$
is not relevant to the pricing of the CII contract under M0 (see, e.g., (6)).
$\mu ^{13}_{x}$
is not relevant to the pricing of the CII contract under M0 (see, e.g., (6)).
7. Discussion
We have examined actuarial net premiums for two important insurance products by considering three related models: an industry-based Markov model (M0), a semi-Markov model (M1), and a Markov model (M2), which represents a simplified case of the semi-Markov model. We have obtained net single premiums for a specialized CII contract for healthy women and have compared the estimated premiums under these models. Alongside, we have examined net single premiums for a specialized life insurance contract for women with and without (pre-metastatic) BC. The differences in premiums for a given insurance contract across different models seem to be reduced with increasing age and longer time to maturity.
Our findings under the semi-Markov model are broadly in agreement with the empirical evidence related to net cancer survival from pre-metastatic or metastatic BC, and the proportion of BC deaths over all deaths (Figs. 9, H17 and H20). Furthermore, our work shows that the semi-Markov model has demonstrated insightful results by combining important information, such as cancer stage and the availability of BC diagnostic and treatment services, in a pragmatic way. Our results also show the significance of assuming duration dependence in the modeling, i.e., accounting for the time spent with pre-metastatic BC.
We also note that the overall impact of the COVID-19 pandemic years on insurance premiums is considered by including observations from 2020 to 2022 whilst defining the rates of transition from State 0 to State 1 and State 4, i.e.,
 $\mu ^{01}_x$
and
$\mu ^{01}_x$
and
 $\mu ^{04}_x$
, under M1 and M2 (Section 3). We have found that net single premiums would only differ by less than 1% in all cases, as compared to the earlier results based on the dataset between 2001 and 2019.
$\mu ^{04}_x$
, under M1 and M2 (Section 3). We have found that net single premiums would only differ by less than 1% in all cases, as compared to the earlier results based on the dataset between 2001 and 2019.
There are three major strengths of this study. First, we have demonstrated how to implement a recently developed semi-Markov modeling approach (Arık et al. Reference Arık, Cairns, Dodd, Macdonald and Streftaris2024) in the context of life insurance. Second, we have provided comparisons between this modeling approach and an industry-based model in terms of pricing of BC risk. Last, we have provided separate estimates of net insurance premiums associated with availability of cancer diagnosis and treatment in the semi-Markov model. Our findings point out sensitivity to the model parameters associated with BC diagnosis and treatment only in extreme cases, such as significantly lower BC diagnosis, e.g., 10%, among all BC cases. While overinterpretation of the absolute numerical results should be avoided, our findings suggest that the industry-based model should be approached with caution, since it is particularly sensitive to model assumptions, such as the risk of death from BC for women with BC diagnosis (i.e., definition of
 $\mu ^{13}_x$
). Besides, the industry-based model is not able to capture the relationship between age and BC survival in general. Thus, the semi-Markov model, together with our findings, can help life insurers understand the impact of different modeling assumptions on insurance cash flows and pricing calculations. This is relevant when considering new insurance products developed to meet the needs of individuals with medical history of BC.
$\mu ^{13}_x$
). Besides, the industry-based model is not able to capture the relationship between age and BC survival in general. Thus, the semi-Markov model, together with our findings, can help life insurers understand the impact of different modeling assumptions on insurance cash flows and pricing calculations. This is relevant when considering new insurance products developed to meet the needs of individuals with medical history of BC.
There are ongoing efforts to develop new medical technologies, such as liquid biopsy, or increase the availability of – and access to -–cancer screening programs in order to improve early cancer diagnosis. In this context, the semi-Markov model can serve as a valuable tool, for instance in quantifying the effect of early BC diagnosis on BC survival. The model could also be extended to include a separate state representing eligibility for a cancer screening program, with clinical diagnosis determined in the model as a separate state (e.g., see Bhatt et al., Reference Bhatt, van den Hout and Antoniou2024). This approach would help to estimate the age of onset and quantify the impact of screening on cancer risk. Such extension would be particularly relevant to medical underwriting for related insurance contracts. In particular, the semi-Markov model can help insurers implement a more inclusive approach for underwriting related life insurance as demonstrated in Section 5.3.
Our study has certain limitations. First, in the absence of comprehensive data, we have grouped ages 30–49 to be a single age group, and Stages 1–3 BC to represent pre-metastatic BC. These groupings may be too broad given the nature of BC. Second, we note that our modeling has not taken into account BC potential recovery from pre-metastatic BC, which could have an impact on exposure in State 0 "No BC." This implies that the exposure in the initial state used in the modeling may have been lower than expected. Furthermore, we have not accounted for a time trend in cancer incidence, type-specific mortality, or the risk of developing metastatic BC. This is particularly relevant in understanding the impact of the COVID-19 pandemic on insurance pricing, as the pandemic significantly affected overall mortality and indirectly influenced cancer incidence in 2020 and 2021. Also, it will be useful to consider competing risks when assessing COVID-19 and its broader implications on the insurance prices. Thus, further research needs to be carried out for incorporating a possible time trend in these aspects of the models. Additionally, we calibrated the models primarily using general population data from England. This may introduce additional risk, as BC risk could differ in insured populations. Insured individuals may belong to higher socioeconomic groups, which are typically associated with better access to healthcare services. This could lead to higher cancer awareness and earlier diagnoses, together with better access to cancer treatment, potentially influencing BC incidence and mortality.
We further highlight the challenge posed by the lack of comprehensive data in determining transition rates within the models under consideration. As a result of this constraint, we rely on point estimates derived from publicly available data in England and medical literature. It is important to acknowledge the uncertainty surrounding transition intensities, which contributes to the overall uncertainty in calculating net single premium rates for insurance contracts. To address uncertainties surrounding BC diagnoses and availability of any treatment, and their implications for insurance premiums, we employ a scenario-based approach. While scenario-driven methods have inherent limitations, we have reinforced our analysis by grounding assumptions in the existing literature and comparing results with available empirical evidence, such as net cancer survival rates provided by the ONS. Last, we have used a constant interest rate when determining net premium rates, rather than variable rates. This is driven by the need to focus on the impact of uncertainty linked to incidence and mortality rates across different models, together with varying modeling assumptions.
Data availability statement
All models in the manuscripts are implemented using our own-developed R code. No other specific package has been used. To help with replicating calculations independently, we provide in the manuscript all relevant transition intensities, along with corresponding assumptions, that would be inputs in related (modified) Kolmogorov equations outlined in the Appendices. Relevant code can be available on request, following publication of the work.
Funding statement
ED and GS acknowledge funding from the Society of Actuaries, under a research project entitled "Predictive Modelling for Medical Morbidity Trends related to Insurance". AA and GS acknowledge funding from SCOR Foundation for Science, under a project entitled "Estimating The Impact of The COVID-19 Pandemic on Breast Cancer Deaths – An Application on Breast Cancer Life Insurance."
Competing interests
The author(s) declare none.
Appendix
A. Kolmogorov equations in the alternative model
Kolmogorov equations for the industry-based Markov model are given as follows:
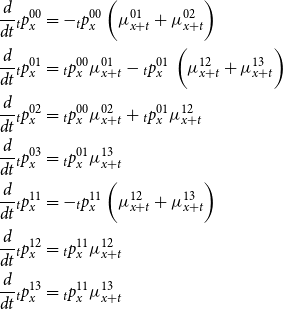 \begin{align*} \frac {d}{dt} {_ {t}} p^{00}_x &= - {_ t} p^{00}_x \, \bigg ( \mu ^{01}_{x+t} + \mu ^{02}_{x+t} \bigg ) \\ \frac {d}{dt} {_ {t}} p^{01}_{x} &= {_ {t}} p^{00}_x \mu ^{01}_{x+t} - {_ t} p^{01}_{x} \, \, \bigg ( \mu ^{12}_{x+t} + \mu ^{13}_{x+t} \bigg ) \\ \frac {d}{dt} {_ {t}} p^{02}_{x} &= {_ {t}} p^{00}_x \mu ^{02}_{x+t} + {_ {t}} p^{01}_x \mu ^{12}_{x+t} \\ \frac {d}{dt} {_ {t}} p^{03}_{x} &= {_ {t}} p^{01}_x \mu ^{13}_{x+t} \\ \frac {d}{dt} {_ {t}} p^{11}_{x} &= - {_ t} p^{11}_x \, \bigg ( \mu ^{12}_{x+t} + \mu ^{13}_{x+t} \bigg ) \\ \frac {d}{dt} {_ {t}} p^{12}_{x} &= {_ t} p^{11}_x \mu ^{12}_{x+t} \\ \frac {d}{dt} {_ {t}} p^{13}_{x} &= {_ t} p^{11}_x \mu ^{13}_{x+t} \end{align*}
The appropriate boundary conditions are
 ${_ {0}} p^{00}_x = {_ {0}} p^{11}_x = 1$
;
${_ {0}} p^{00}_x = {_ {0}} p^{11}_x = 1$
;
 ${_ {0}} p^{01}_{x} = {_ {0}} p^{02}_{x} = {_ {0}} p^{03}_{x} = 0$
; and
${_ {0}} p^{01}_{x} = {_ {0}} p^{02}_{x} = {_ {0}} p^{03}_{x} = 0$
; and
 ${_ {0}} p^{12}_{x} = {_ {0}} p^{13}_{x} = 0$
.
${_ {0}} p^{12}_{x} = {_ {0}} p^{13}_{x} = 0$
.
B. Modified Kolmogorov equations with duration dependence in the Semi-Markov model
Modified Kolmogorov equations for the semi-Markov BC model are given as below. Note that more details can be found in CMI (1991), based on a 3-state multiple model, allowing recovery from the disease under inspection along with duration dependence. Here, in order to make integrals clearer, we introduce actuarial selection notation. For instance,
 $\mu ^{13}_{x,t}$
is shown based on select attained age
$\mu ^{13}_{x,t}$
is shown based on select attained age
 $[x]$
with duration
$[x]$
with duration
 $t$
, specifically
$t$
, specifically
 $\mu ^{13}_{x,t} = \mu ^{13}_{[x]+t}$
.
$\mu ^{13}_{x,t} = \mu ^{13}_{[x]+t}$
.
 \begin{align*} \frac {d}{dt} {_ {t}} p^{00}_x &= - {_ t} p^{00}_x \, \bigg ( \mu ^{01}_{x+t} + \mu ^{02}_{x+t} +\mu ^{04}_{x+t} \bigg ) \\ \frac {d}{dt} {_ {t}} p^{01}_{x} &= {_ {t}} p^{00}_x \mu ^{01}_{x+t} - {_ t} p^{01}_{x} \, \, \mu ^{14}_{x+t} - \int _{u=0}^t{ {_ {u}} p^{00}_x \,\, \mu ^{01}_{x+u} \,\, {_ {t-u}} p^{11}_{[x+u]} \,\, \mu ^{13}_{[x+u]+t-u}\,\, du } \\ \frac {d}{dt} {_ {t}} p^{02}_x &= {_ {t}} p^{00}_x \mu ^{02}_{x+t} - {_ {t}} p^{02}_x \mu ^{24}_{x+t} - \int _{u=0}^{t} { {_ {u}} p^{00}_x \,\, \mu ^{02}_{x+u} \,\, {_ {t-u}} p^{22}_{[x+u]} \,\, \mu ^{23}_{[x+u]+t-u}\,\, du } \\ \frac {d}{dt} {_ {t}} p^{03}_x &= \int _{u=0}^{t} { {_ {u}} p^{00}_x \,\, \mu ^{01}_{x+u} \,\, {_ {t-u}} p^{11}_{[x+u]} \,\, \mu ^{13}_{[x+u]+t-u}\,\, du } +\\ & \int _{u=0}^{t} { {_ {u}} p^{00}_x \,\, \mu ^{02}_{x+u} \,\, {_ {t-u}} p^{22}_{[x+u]} \,\, \mu ^{23}_{[x+u]+t-u}\,\, du } - {_ t} p^{03}_x \, \bigg ( \mu ^{34}_{x+t} + \mu ^{35}_{x+t} \bigg ) \\ \frac {d}{dt} {_ {t}} p^{04}_x &= {_ {t}} p^{00}_x \mu ^{04}_{x+t} + {_ {t}} p^{01}_x \mu ^{14}_{x+t} + {_ {t}} p^{02}_x \mu ^{24}_{x+t} + {_ {t}} p^{03}_x \mu ^{34}_{x+t} \\ \frac {d}{dt} {_ {t}} p^{05}_x &= {_ {t}} p^{03}_x \mu ^{35}_{x+t} \end{align*}
We note that the select notation on age
 $[x]$
is kept in the equations below, where this is based on the assumption of being in the relevant initial state.
$[x]$
is kept in the equations below, where this is based on the assumption of being in the relevant initial state.
 \begin{align*} \frac {d}{dt} {_ {t}} p^{11}_{[x]} &= - {_ t} p^{11}_{[x]} \, \bigg ( \mu ^{13}_{[x]+t} + \mu ^{14}_{[x]+t} \bigg ) \\ \frac {d}{dt} {_ {t}} p^{13}_{[x] } &= {_ {t}} p^{11}_{[x]} \,\, \mu ^{13}_{[x]+t} - {_ {t}} p^{13}_{[x]} \mu ^{34}_{[x]+t} - {_ {t}} p^{13}_{[x]} \mu ^{35}_{[x]+t} \\ \frac {d}{dt} {_ {t}} p^{14}_{[x] } &= {_ {t}} p^{11}_{[x]}\,\, \mu ^{14}_{[x]+t} + {_ {t}} p^{13}_{[x]} \mu ^{34}_{[x]+t} \\ \frac {d}{dt} {_ {t}} p^{15}_{[x]} &= {_ {t}} p^{13}_{[x]} \mu ^{35}_{[x]+t} \\ \frac {d}{dt} {_ {t}} p^{22}_{[x]} &= - {_ t} p^{22}_{[x]} \, \bigg ( \mu ^{23}_{[x]+t} + \mu ^{24}_{[x]+t} \bigg ) \\ \frac {d}{dt} {_ {t}} p^{23}_{[x]} &= {_ {t}} p^{22}_{[x]} \,\, \mu ^{23}_{[x]+t} - {_ {t}} p^{23}_{[x]}\, \bigg ( \mu ^{34}_{[x]+t} + \mu ^{35}_{[x]+t} \bigg ) \\ \frac {d}{dt} {_ {t}} p^{24}_{[x]} &= {_ {t}} p^{22}_{[x]} \,\, \mu ^{24}_{[x]+t} + {_ {t}} p^{23}_{[x]} \,\, \mu ^{34}_{[x]+t} \\ \frac {d}{dt} {_ {t}} p^{25}_{[x]} &= {_ {t}} p^{23}_{[x]} \,\, \mu ^{35}_{[x]+t} \\ \frac {d}{dt} {_ {t}} p^{33}_{[x]} &= - {_ t} p^{33}_{[x]} \, \bigg ( \mu ^{34}_{[x]+t} + \mu ^{35}_{[x]+t} \bigg ) \\ \frac {d}{dt} {_ {t}} p^{34}_{[x]} &= {_ t} p^{33}_{[x]} \,\, \mu ^{34}_{[x]+t} \\ \frac {d}{dt} {_ {t}} p^{35}_{[x]} &= {_ t} p^{33}_{[x]} \,\, \mu ^{35}_{[x]+t} \end{align*}
The appropriate boundary conditions are
 ${_ {0}} p^{00}_x = {_ {0}} p^{11}_{[x]} = {_ {0}} p^{22}_{[x]} = {_ {0}} p^{33}_{[x]} = 1$
;
${_ {0}} p^{00}_x = {_ {0}} p^{11}_{[x]} = {_ {0}} p^{22}_{[x]} = {_ {0}} p^{33}_{[x]} = 1$
;
 ${_ {0}} p^{01}_{x} = {_ {0}} p^{02}_{x} = {_ {0}} p^{03}_{x} = {_ {0}} p^{04}_{x} = {_ {0}} p^{05}_x = 0$
;
${_ {0}} p^{01}_{x} = {_ {0}} p^{02}_{x} = {_ {0}} p^{03}_{x} = {_ {0}} p^{04}_{x} = {_ {0}} p^{05}_x = 0$
;
 ${_ {0}} p^{13}_{[x]} = {_ {0}} p^{14}_{[x]} = {_ {0}} p^{15}_{[x]} = 0$
;
${_ {0}} p^{13}_{[x]} = {_ {0}} p^{14}_{[x]} = {_ {0}} p^{15}_{[x]} = 0$
;
 ${_ {0}} p^{23}_{[x]} = {_ {0}} p^{24}_{[x]} = {_ {0}} p^{25}_{[x]} = 0$
; and
${_ {0}} p^{23}_{[x]} = {_ {0}} p^{24}_{[x]} = {_ {0}} p^{25}_{[x]} = 0$
; and
 $ {_ {0}} p^{34}_{[x]} = {_ {0}} p^{35}_{[x]} = 0$
.
$ {_ {0}} p^{34}_{[x]} = {_ {0}} p^{35}_{[x]} = 0$
.
C. Runge–Kutta method for breast cancer model in Fig. 2
Runge–Kutta methods estimate function values in a given small interval, and then use those values to obtain a better estimate of the function under inspection. A fourth-order Runge–Kutta scheme is based on four recursive estimates of the increment in the function value per time step (Macdonald et al., Reference Macdonald, Richards and Currie2018).
We have a 6-state model in Fig. 2, and hence, in full, a
 $6 \times 6$
matrix of occupancy probabilities denoted by
$6 \times 6$
matrix of occupancy probabilities denoted by
 $ {_ {h}} p^{ij}_x \equiv y_t$
as
$ {_ {h}} p^{ij}_x \equiv y_t$
as
 \begin{equation*} y_t = \begin{bmatrix} {_ {t}} p^{00}_x \\ {_ {t}} p^{01}_x \\ {_ {t}} p^{02}_x \\ \vdots \\ {_ {t}} p^{55}_x \\ \end{bmatrix}, \frac {d}{dt} y_t = \begin{bmatrix} \frac {d}{dt} {_ {t}} p^{00}_x \\ \frac {d}{dt} {_ {t}} p^{01}_x \\ \frac {d}{dt} {_ {t}} p^{02}_x \\ \vdots \\ \frac {d}{dt} {_ {t}} p^{55}_x \\ \end{bmatrix} = f(t, y_t). \end{equation*}
Now, suppose we would like to solve
 $\frac {d}{dt} y_t = f(t, y_t)$
,
$\frac {d}{dt} y_t = f(t, y_t)$
,
 $y_{t_0}= y_0$
. Then, we could write
$y_{t_0}= y_0$
. Then, we could write
 \begin{align*} y_{t_{n+1}} = y_{t_n} + \frac {h}{6} \bigg ( k_1 + 2 k_2 + 2 k_3 + k_4 \bigg ), \end{align*}
for
 $ t_{n+1} = t_{n} + h$
and
$ t_{n+1} = t_{n} + h$
and
 \begin{align*} k_1 &= f(t_n, y_{t_n})\\ k_2 &= f\bigg ( t_n + \frac {h}{2}, y_{t_n} + h \frac {k_1}{2} \bigg )\\ k_3 &= f\bigg ( t_n + \frac {h}{2}, y_{t_n} + h \frac {k_2}{2} \bigg )\\ k_4 &= f\bigg ( t_n + h, y_{t_n} + h {k_3}\bigg ). \end{align*}
Here, the four intermediate steps, denoted by
 $k_1,\, k_2,\, k_3$
, and
$k_1,\, k_2,\, k_3$
, and
 $k_4$
, are also vector quantities such that
$k_4$
, are also vector quantities such that
 \begin{equation*} k_1 = \begin{bmatrix} k_1^{00} \\ k_1^{01} \\ k_1^{02} \\ \vdots \\ k_1^{55} \\ \end{bmatrix}, k_2 = \begin{bmatrix} k_2^{00} \\ k_2^{01} \\ k_2^{02} \\ \vdots \\ k_2^{55} \\ \end{bmatrix}, k_3 = \begin{bmatrix} k_3^{00} \\ k_3^{01} \\ k_3^{02} \\ \vdots \\ k_3^{55} \\ \end{bmatrix}, k_4 = \begin{bmatrix} k_4^{00} \\ k_4^{01} \\ k_4^{02} \\ \vdots \\ k_4^{55} \\ \end{bmatrix}. \end{equation*}
D. Computation of insurance premiums in the Semi-Markov model
We take the net single premium for the CII contract, without a death rider, described in (7), as an example, that is
 \begin{eqnarray*} {_ {\text {CI}, 2}}\bar {A}_{x} &= & \int _{0}^{\infty }{ e^{-\delta t} {_ {t}} p^{00}_x \mu ^{01}_{x+t} dt} \\ & + & \int _{0}^{\infty }{ e^{-\delta u} {_ {u}} p^{00}_x \mu ^{02}_{x+u} \int _{0}^{\infty }{ e^{-\delta t} {_ {t}} p^{22}_{[x+u]} \mu ^{23}_{[x+u]+t} dt} \,\,du }. \end{eqnarray*}
The first component in the equation above is straightforward to carry out. That is why we focus on the second component between time zero and
 $n h$
which is
$n h$
which is
 \begin{equation*} \int _{u=0}^{ T= n h}{ e^{-\delta u} {_ {u}} p^{00}_x \mu ^{02}_{x+u} \int _{ t=0}^{nh - u }{ e^{-\delta t} {_ {t}} p^{22}_{[x+u]} \mu ^{23}_{[x+u]+t} dt} \,\,du }, \end{equation*}
where we can simplify this expression by denoting the inner integral by
 $g(x+u, T-u)$
as
$g(x+u, T-u)$
as
 \begin{equation*} \int _{u=0}^{ T= n h}{ e^{-\delta u} {_ {u}} p^{00}_x \mu ^{02}_{x+u} \,\, g(x+u, T-u) du }, \end{equation*}
and we can approximately calculate this part of the premium by choosing each time step to be equal to
 $h$
, e.g., based on trapezoidal rule, as follows:
$h$
, e.g., based on trapezoidal rule, as follows:
 \begin{eqnarray*} \int _{u=0}^{ T= n h}{ e^{-\delta u} {_ {u}} p^{00}_x \mu ^{02}_{x+u} \,\, g(x+u, T-u) du } & \approx & \frac {h}{2} \Bigg ( e^{-\delta 0} {_ {0}} p^{00}_x \,\, \mu ^{02}_{x} \,\, g(x, nh) \\ &+ &2 e^{-\delta h} {_ {h}} p^{00}_x \,\, \mu ^{02}_{x+h} \,\, g(x + h, nh - h) \\ &+ &2 e^{-\delta 2h} {_ {2h}} p^{00}_x \,\, \mu ^{02}_{x+2h} \,\, g( x +2 h, nh - 2h) + \ldots \\ &+ &e^{-\delta nh} {_ {nh}} p^{00}_x \,\, \mu ^{02}_{x + nh} \,\, g( x+nh, nh-nh) \Bigg ). \end{eqnarray*}
Here, the important thing to notice is that
 $g(x+u, T-u)$
shows different net single premiums to be paid at the time of diagnosis for policyholders with unobserved BC at selected ages
$g(x+u, T-u)$
shows different net single premiums to be paid at the time of diagnosis for policyholders with unobserved BC at selected ages
 $[x+u]$
.
$[x+u]$
.
E. Net single premiums for different insurance contracts under M2
Section 5.1 explains how to calculate the net single premiums for a special CII contract and a couple life insurance contracts based on M0 and M1. This section further explains how to calculate net single premiums for these contracts under M2.
The net single premium for the CII contract, formulated in (7), can be redefined under M2 as
 \begin{eqnarray} {_ {\text {CI}, 2}}\bar {A}_{x} &= & \int _{0}^{\infty }{ e^{-\delta t} {_ {t}} p^{00}_x \bigg ( \mu ^{01}_{x+t} + \mu ^{04}_{x+t} \bigg ) dt} \\ & + & \int _{0}^{\infty }{ e^{-\delta t} {_ {t}} p^{02}_x \bigg ( \mu ^{23}_{x+t} + \mu ^{24}_{x+t} \bigg ) dt }.\nonumber \end{eqnarray}
The net single premiums for the life insurance contracts for a woman without BC, (9), and with pre-metastatic BC, (11), can be redefined under M2, as well, where (E2) shows the premium for a healthy woman at the time of purchase as
 \begin{eqnarray} {_ {\text {LI}, 2}}\bar {A}_{x} & = & \int _{0}^{\infty }{ e^{-\delta t} {_ {t}} p^{00}_x \mu ^{04}_{x+t} + {_ {t}} p^{01}_x \mu ^{14}_{x+t} + {_ {t}} p^{02}_x \mu ^{24}_{x+t} + {_ {t}} p^{03}_x \big ( \mu ^{34}_{x+t} +\mu ^{35}_{x+t} \big ) dt}, \end{eqnarray}
whereas (E3) shows the premium for a woman with a pre-metastatic BC diagnosis at the time of purchase as
 \begin{eqnarray} {_ {\text {LI}, 4}}\bar {A}_{x} &= & \int _{0}^{\infty }{ e^{-\delta t} {_ {t}} p^{11}_x \mu ^{14}_{x+t} dt} \\ & + & \int _{0}^{\infty }{ e^{-\delta t} {_ {t}} p^{13}_x \bigg ( \mu ^{34}_{x+t} + \mu ^{35}_{x+t} \bigg ) dt}.\nonumber \end{eqnarray}
F. Deriving an expression for
 $\mu ^{02}_x$
in the absence of cause of death data
$\mu ^{02}_x$
in the absence of cause of death data

All-cause mortality, denoted by
 $\hat {\mu }_x$
, can be estimated as follows:
$\hat {\mu }_x$
, can be estimated as follows:
 \begin{align*} \hat {\mu }_x = \frac {D_x }{E^{0}_x + E^{1}_x }, \end{align*}
with
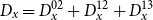 $D_x = D^{02}_x + D^{12}_x + D^{13}_x$
based on M0. Let us accept that deaths from BC at age
$D_x = D^{02}_x + D^{12}_x + D^{13}_x$
based on M0. Let us accept that deaths from BC at age
 $x$
,
$x$
,
 $D^{13}_x$
, are a percentage (
$D^{13}_x$
, are a percentage (
 $k_x$
%) of all deaths, such that
$k_x$
%) of all deaths, such that
 $D^{13}_x = k_x D_x$
. Thus,
$D^{13}_x = k_x D_x$
. Thus,
 \begin{equation*} D^{02}_x + D^{12}_x = D_x - k_x D_x. \end{equation*}
Provided our assumption under M0 in Section 4.1, we can write
 \begin{align*} \hat {\mu }^{12}_x &= \hat {\mu }^{02}_x \Rightarrow \frac {D^{12}_x }{E_x^1} = \frac {D^{02}_x }{E_x^0} \Rightarrow D^{12}_x = D^{02}_x \frac { E_x^1 }{E_x^0}, \end{align*}
and
 \begin{align*} D^{02}_x + D^{12}_x &= D_x - k_x D_x \Rightarrow D^{02}_x + D^{02}_x \frac { E_x^1 }{E_x^0} = ( 1 - k_x) D_x \\ \frac {D^{02}_x }{E_x^0 }& = (1 - k_x) \frac {D_x}{E_x^0 + E_x^1}, \end{align*}
that leads to
 \begin{align*} \hat {\mu }^{02}_x = (1 - k_x) \hat {\mu }_x, \end{align*}
where rates of transition to death from other causes,
 $ \hat {\mu }^{02}_x$
, are indirectly determined by using all-cause mortality,
$ \hat {\mu }^{02}_x$
, are indirectly determined by using all-cause mortality,
 $\hat {\mu }_x$
, and
$\hat {\mu }_x$
, and
 ${k}_x$
.
${k}_x$
.
G. Different diagnosis and treatment considerations when
$i=4\%$

Net single premium rates for a specialized life insurance contract, (9), for policyholders without breast cancer at the time of purchase, £1,000 benefit, payable at the time of death, based on the semi-Markov model M1 with
 $i=4\%$
.
$i=4\%$
.

Net single premium rates for a specialized CII contract, (7), for policyholders without breast cancer at the time of purchase, £1,000 benefit, payable at the time of event, based on the semi-Markov model M1 with
 $i=4\%$
.
$i=4\%$
.
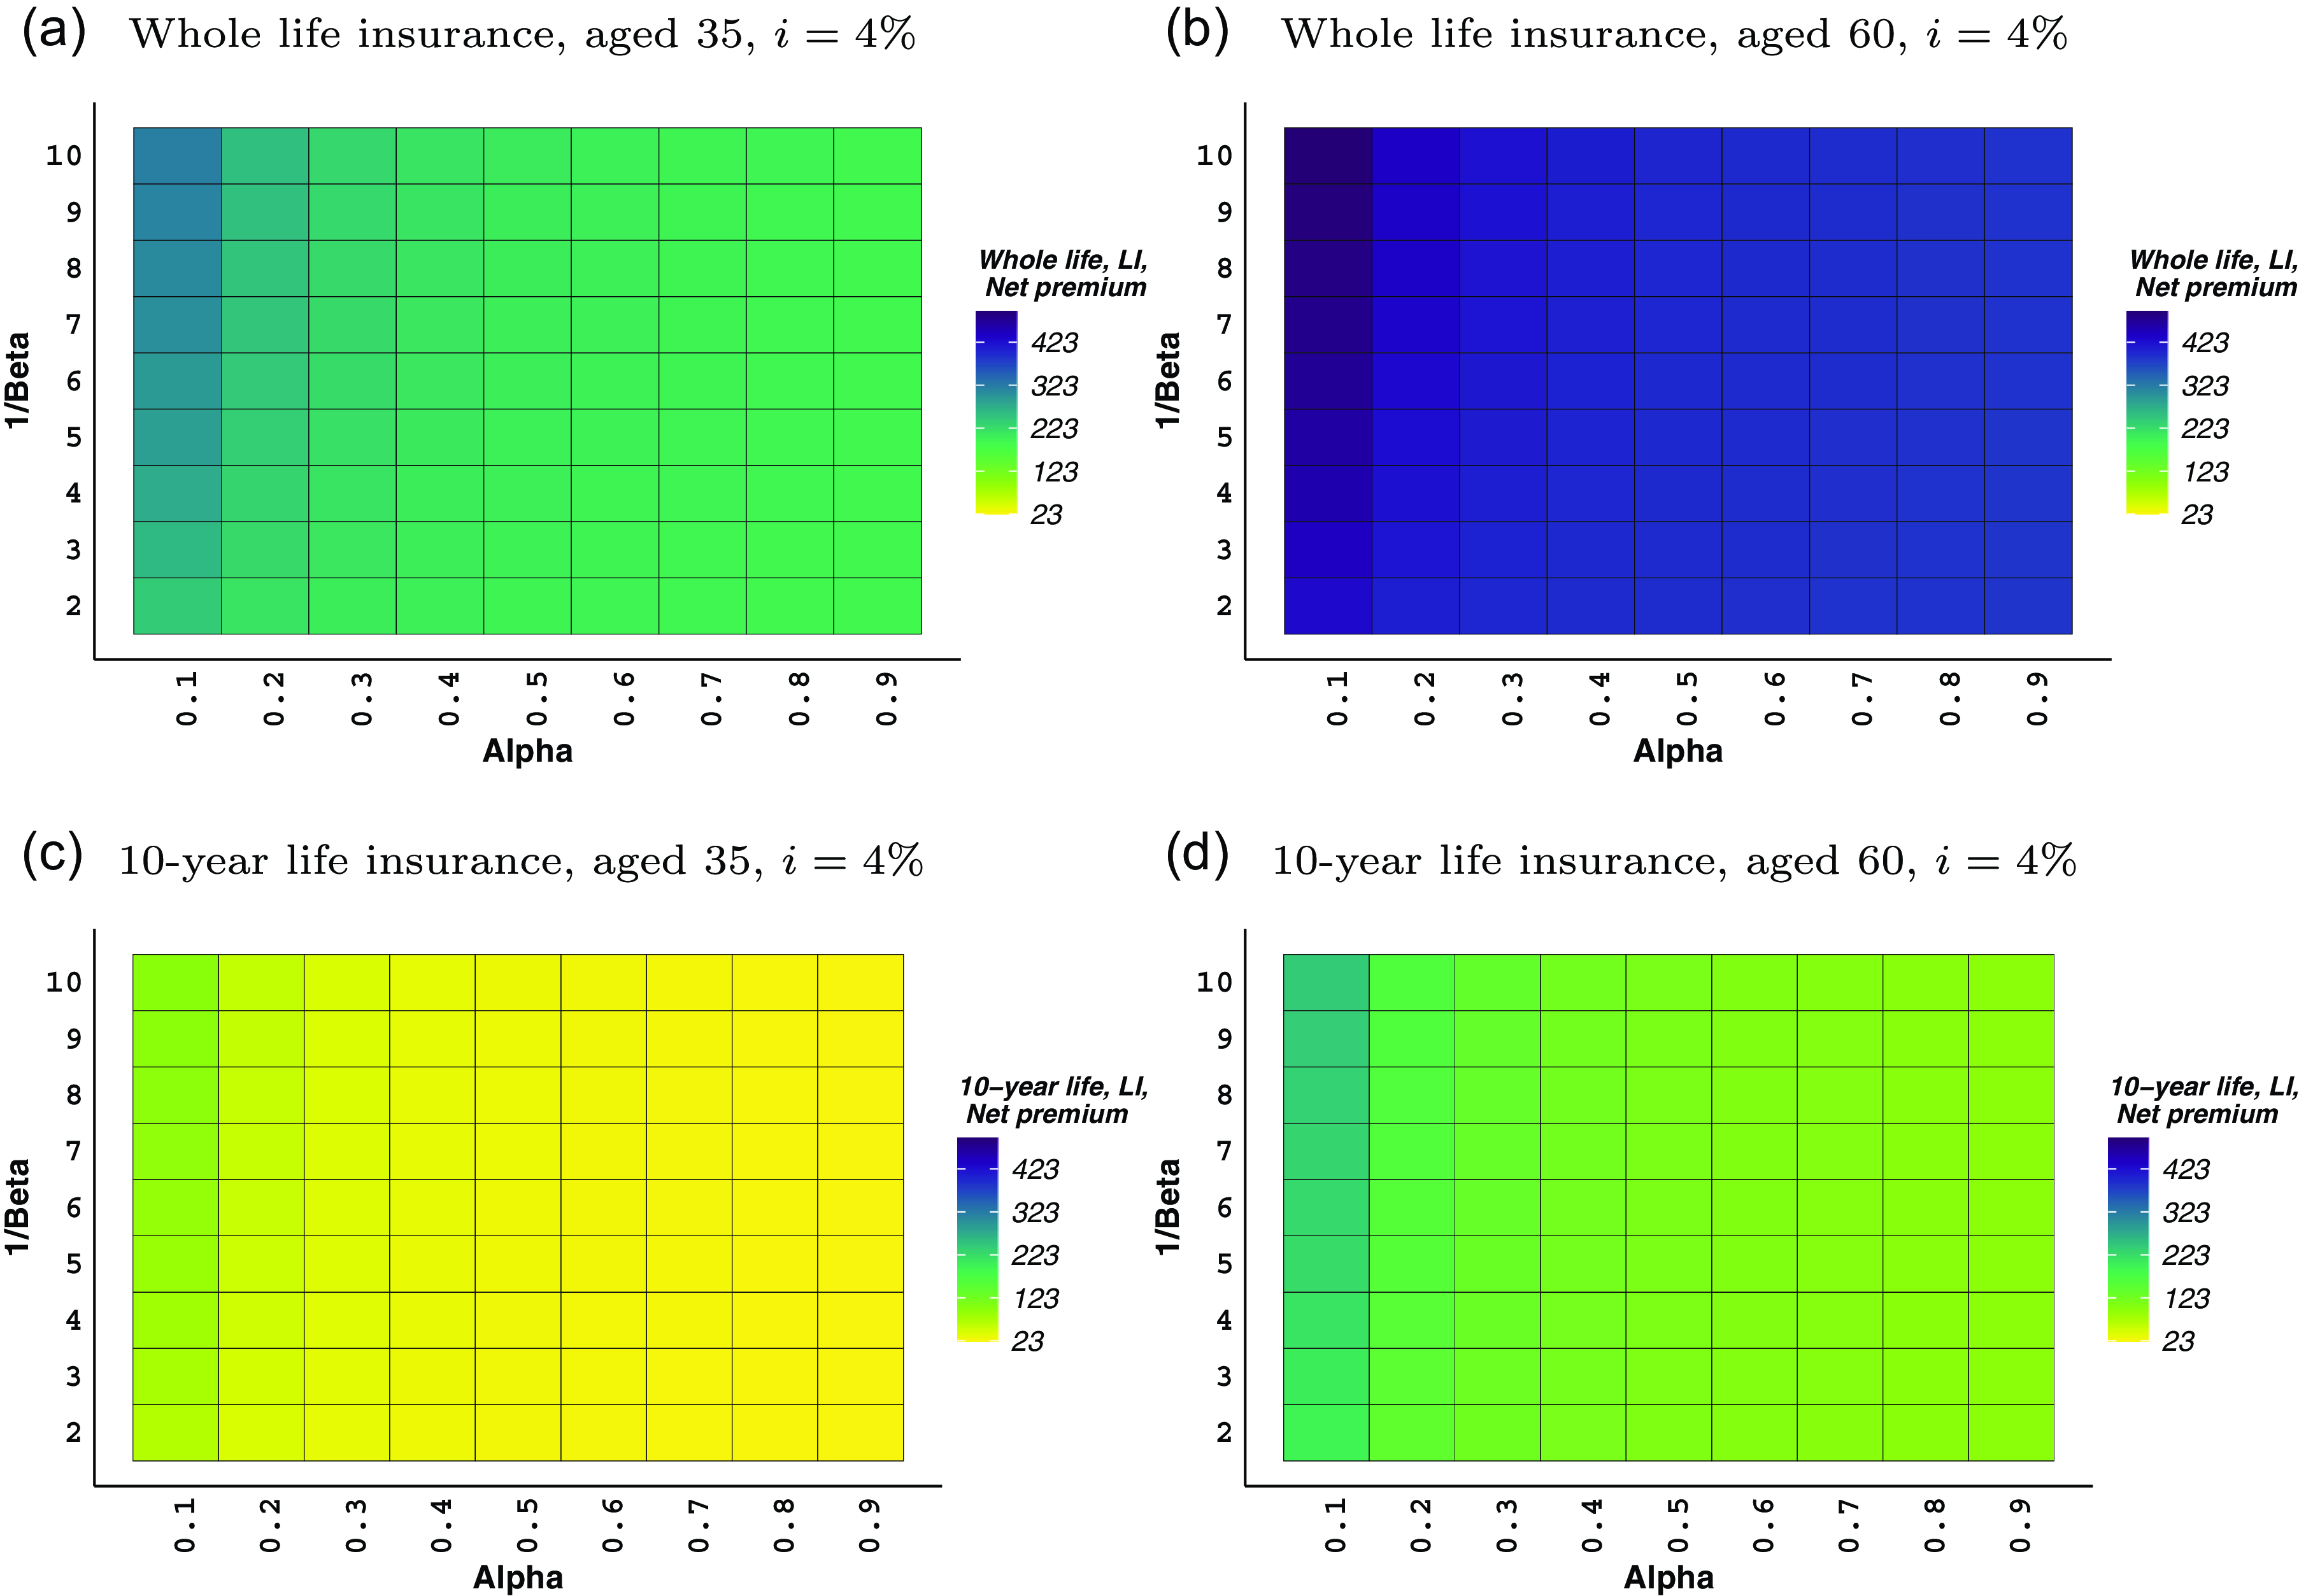
H. Further findings in Section 5.3
Net single premium rates for specialized critical illness, (6)–(7), and life insurance contracts, (8)–(11), and (12), for policyholders with or without breast cancer at the time of purchase, £1,000 benefit, payable at the time of event, based on M0–M2 in Table 1, when
 $\alpha = 0.4$
and
$\alpha = 0.4$
and
 $\beta = 1/7$
.
$\beta = 1/7$
.
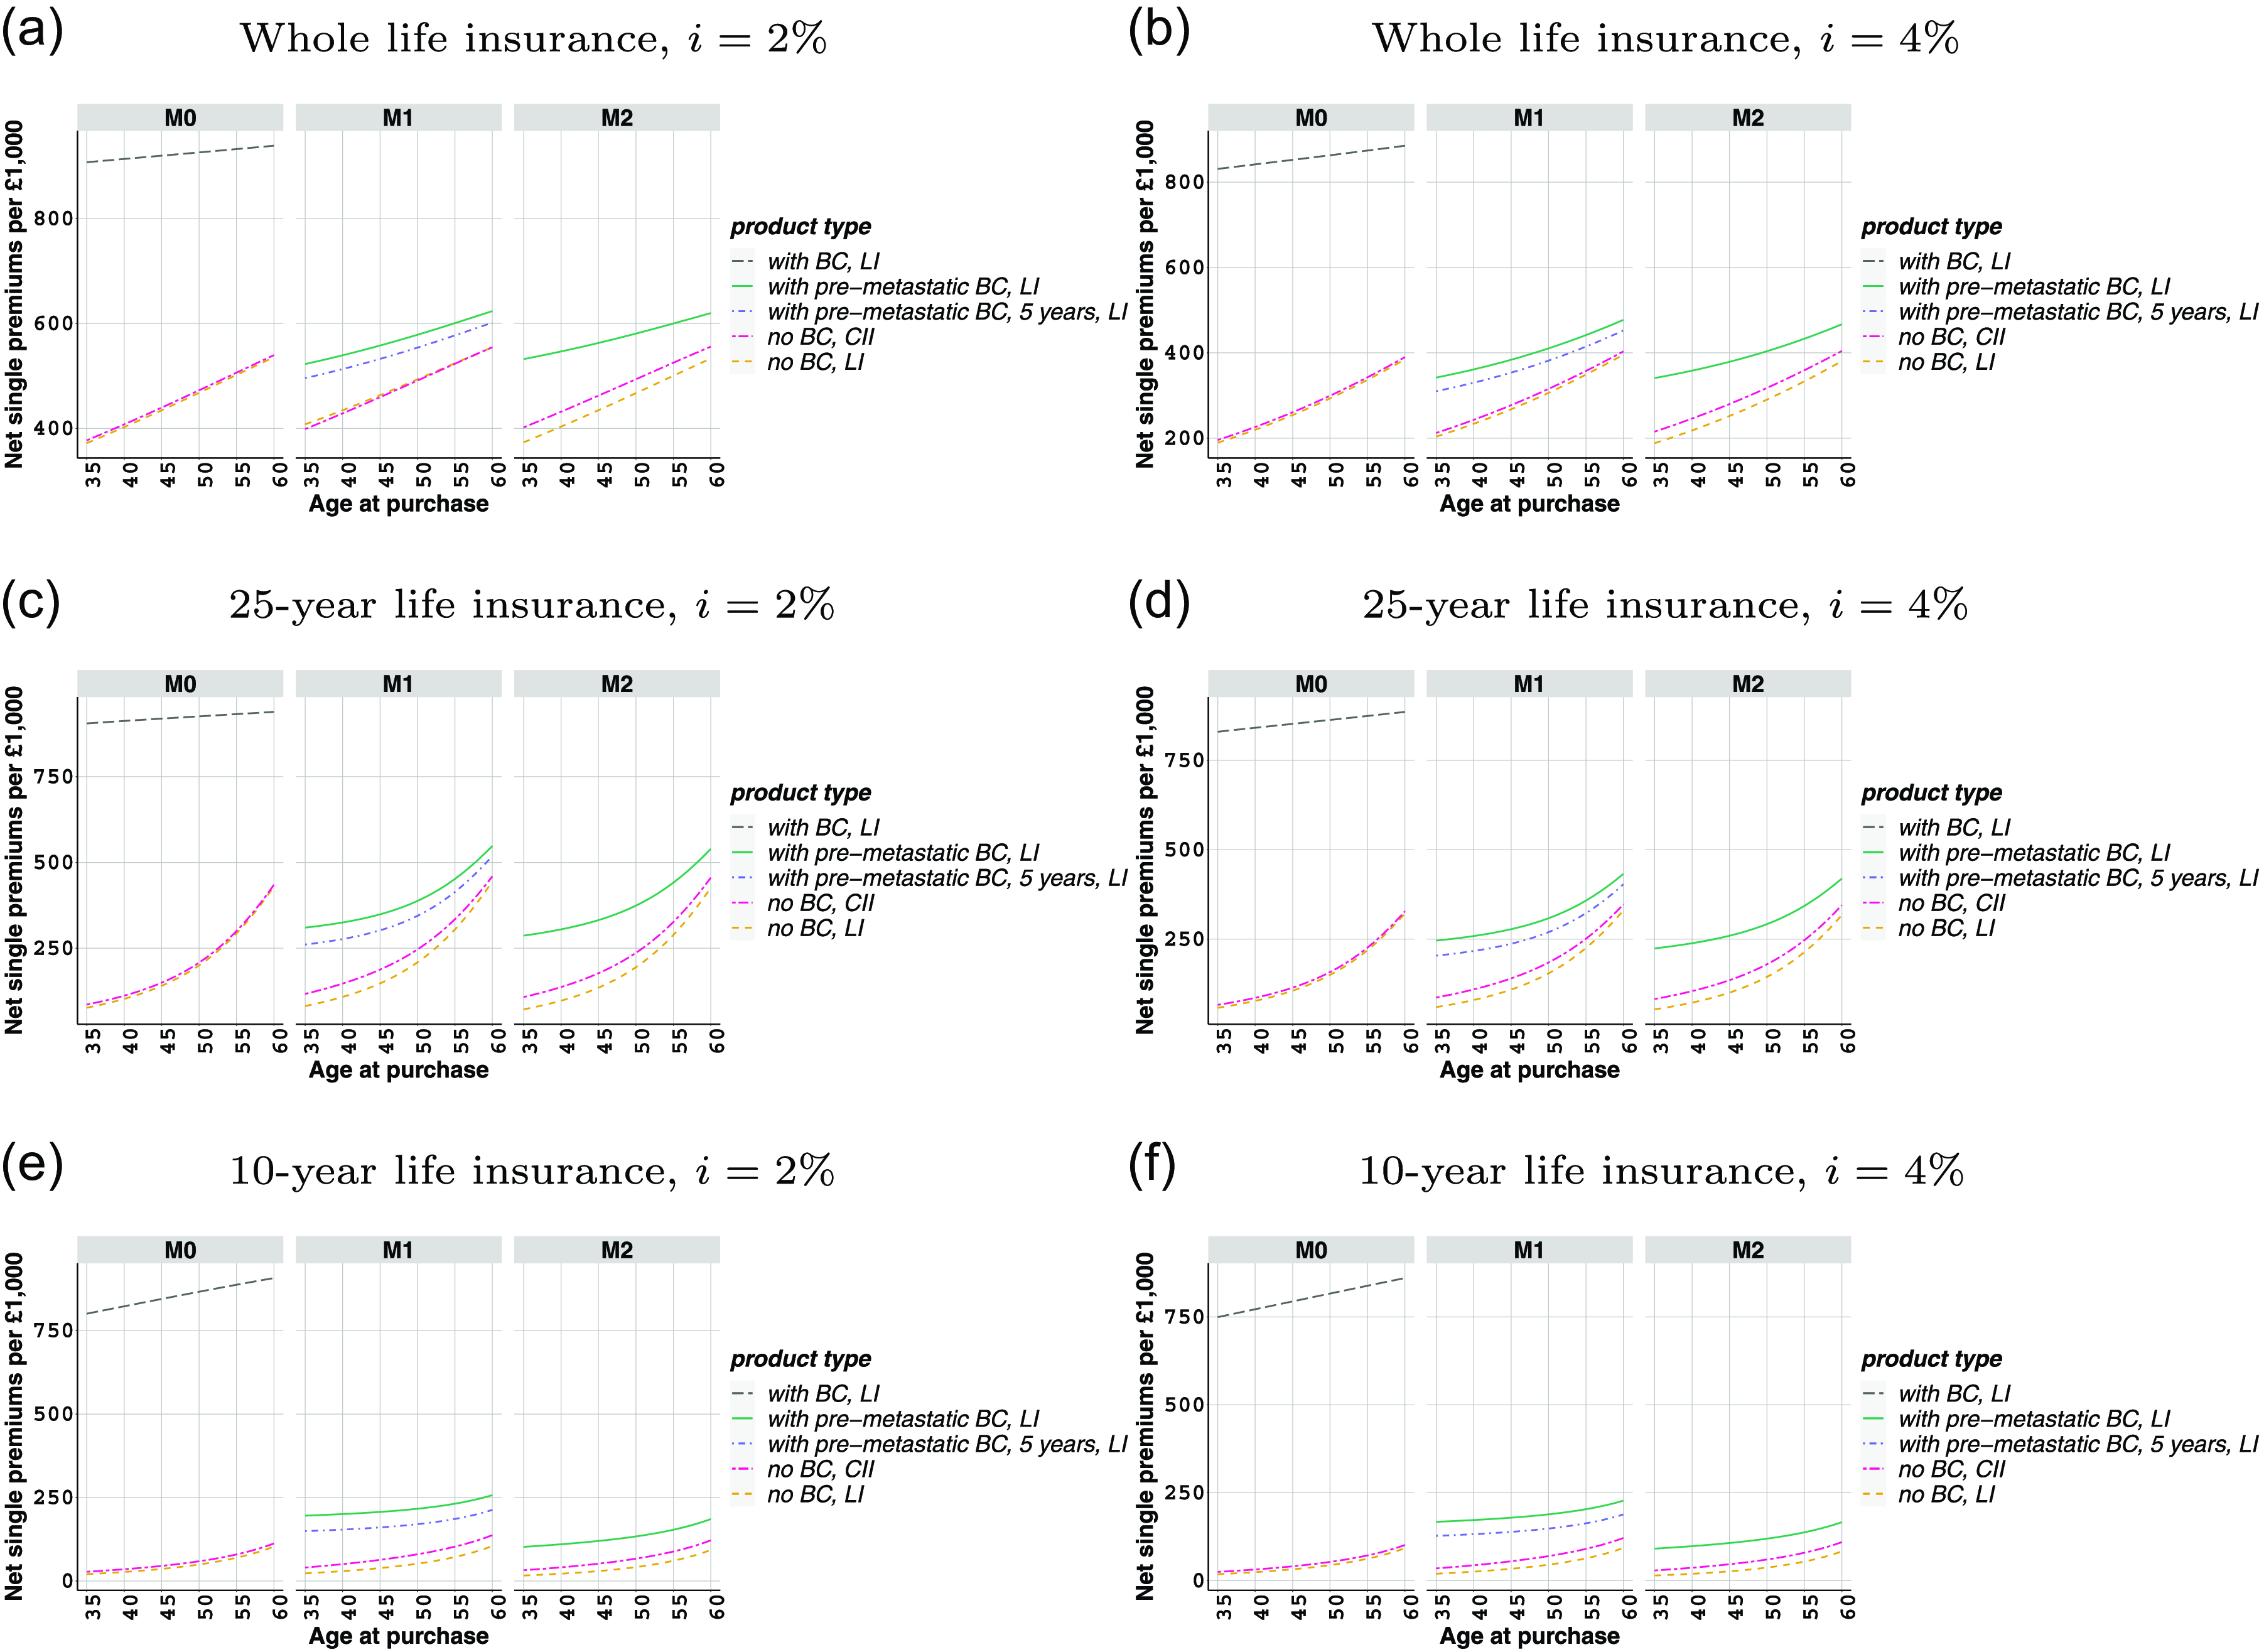
Net single premium rates of specialized critical illness, (6)–(7), and life insurance contracts, (8)–(11), and (12), for policyholders with or without breast cancer at the time of purchase, £1,000 benefit, payable at the time of event, based on M0–M2 in Table 1, when
 $\alpha = 0.8$
and
$\alpha = 0.8$
and
 $\beta = 1/7$
.
$\beta = 1/7$
.
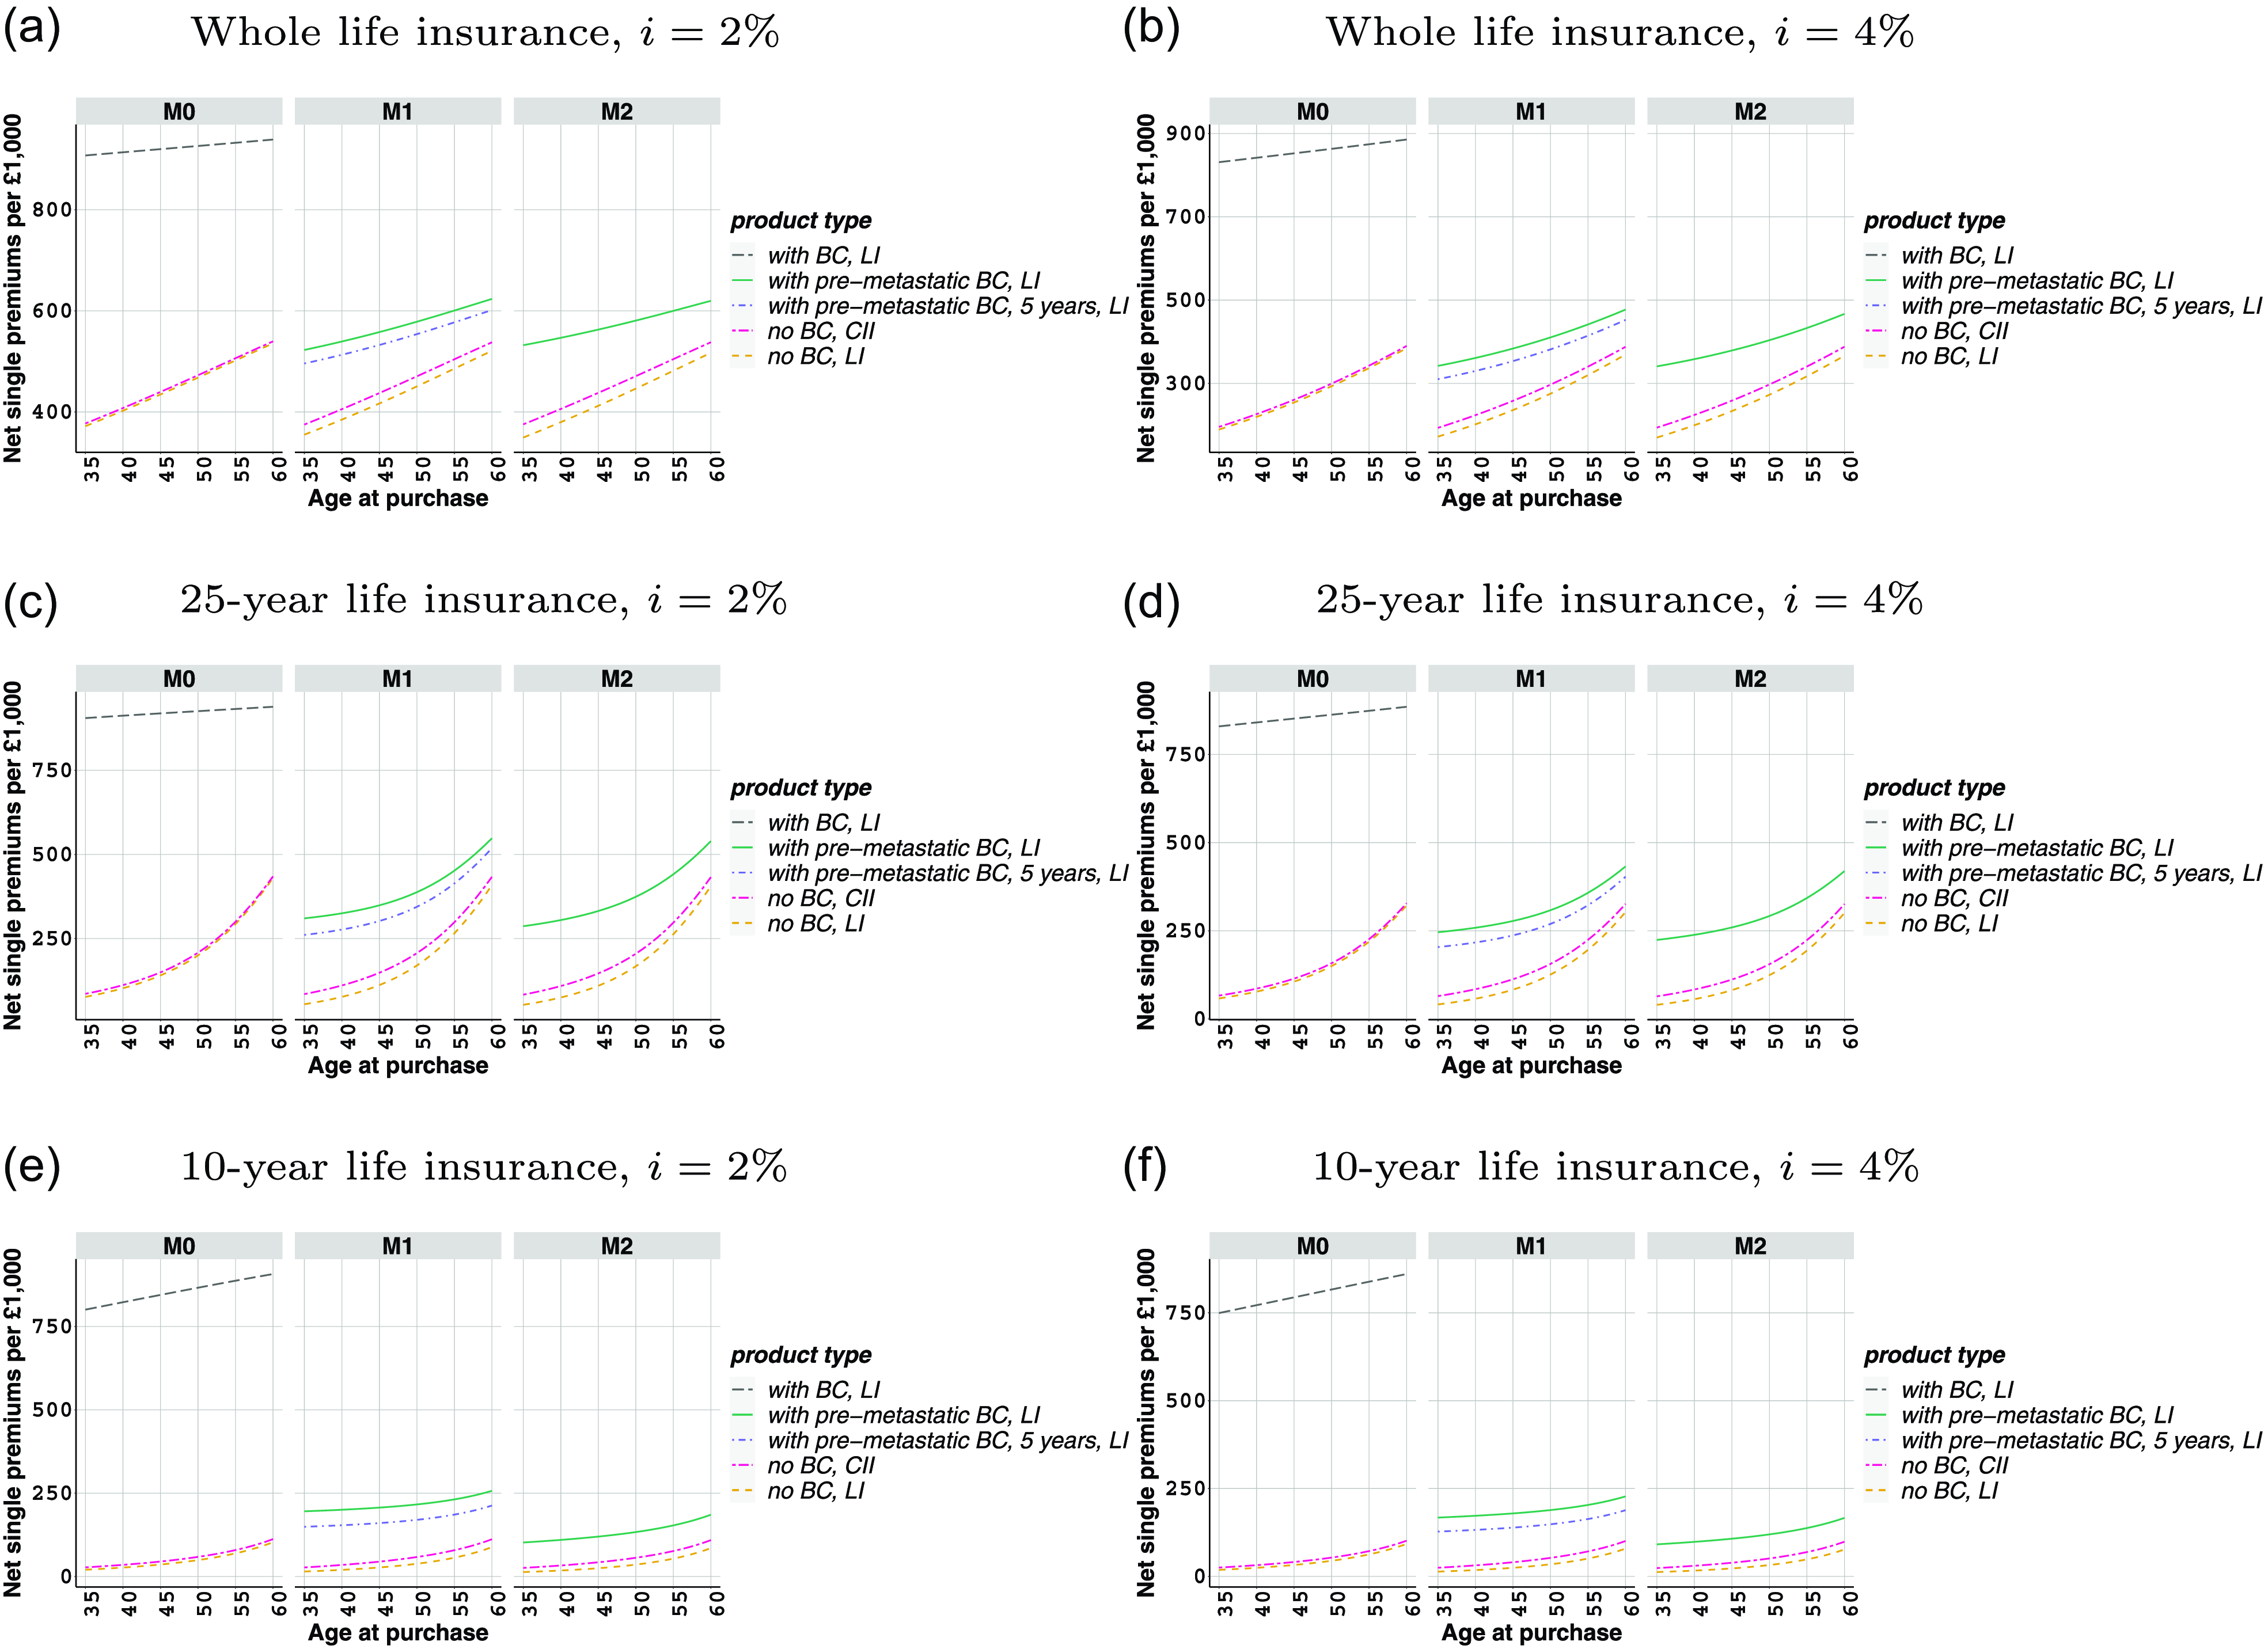
Estimated
 $\hat {k}_{x}$
values for a policyholder aged 30 years, with no breast cancer, at time zero, based on M1 and M2, when
$\hat {k}_{x}$
values for a policyholder aged 30 years, with no breast cancer, at time zero, based on M1 and M2, when
 $\alpha =0.4$
or
$\alpha =0.4$
or
 $\alpha =0.8$
and
$\alpha =0.8$
and
 $\beta =1/7$
.
$\beta =1/7$
.

Net single premium rates for specialized critical illness, (6)–(7), and life insurance contracts, (8)–(11), and (12), for policyholders with or without breast cancer at the time of purchase, £1,000 benefit, payable at the time of event, based on M0–M2 in Table 1, when
 $\alpha = 0.6$
and
$\alpha = 0.6$
and
 $\beta = 1/5$
.
$\beta = 1/5$
.
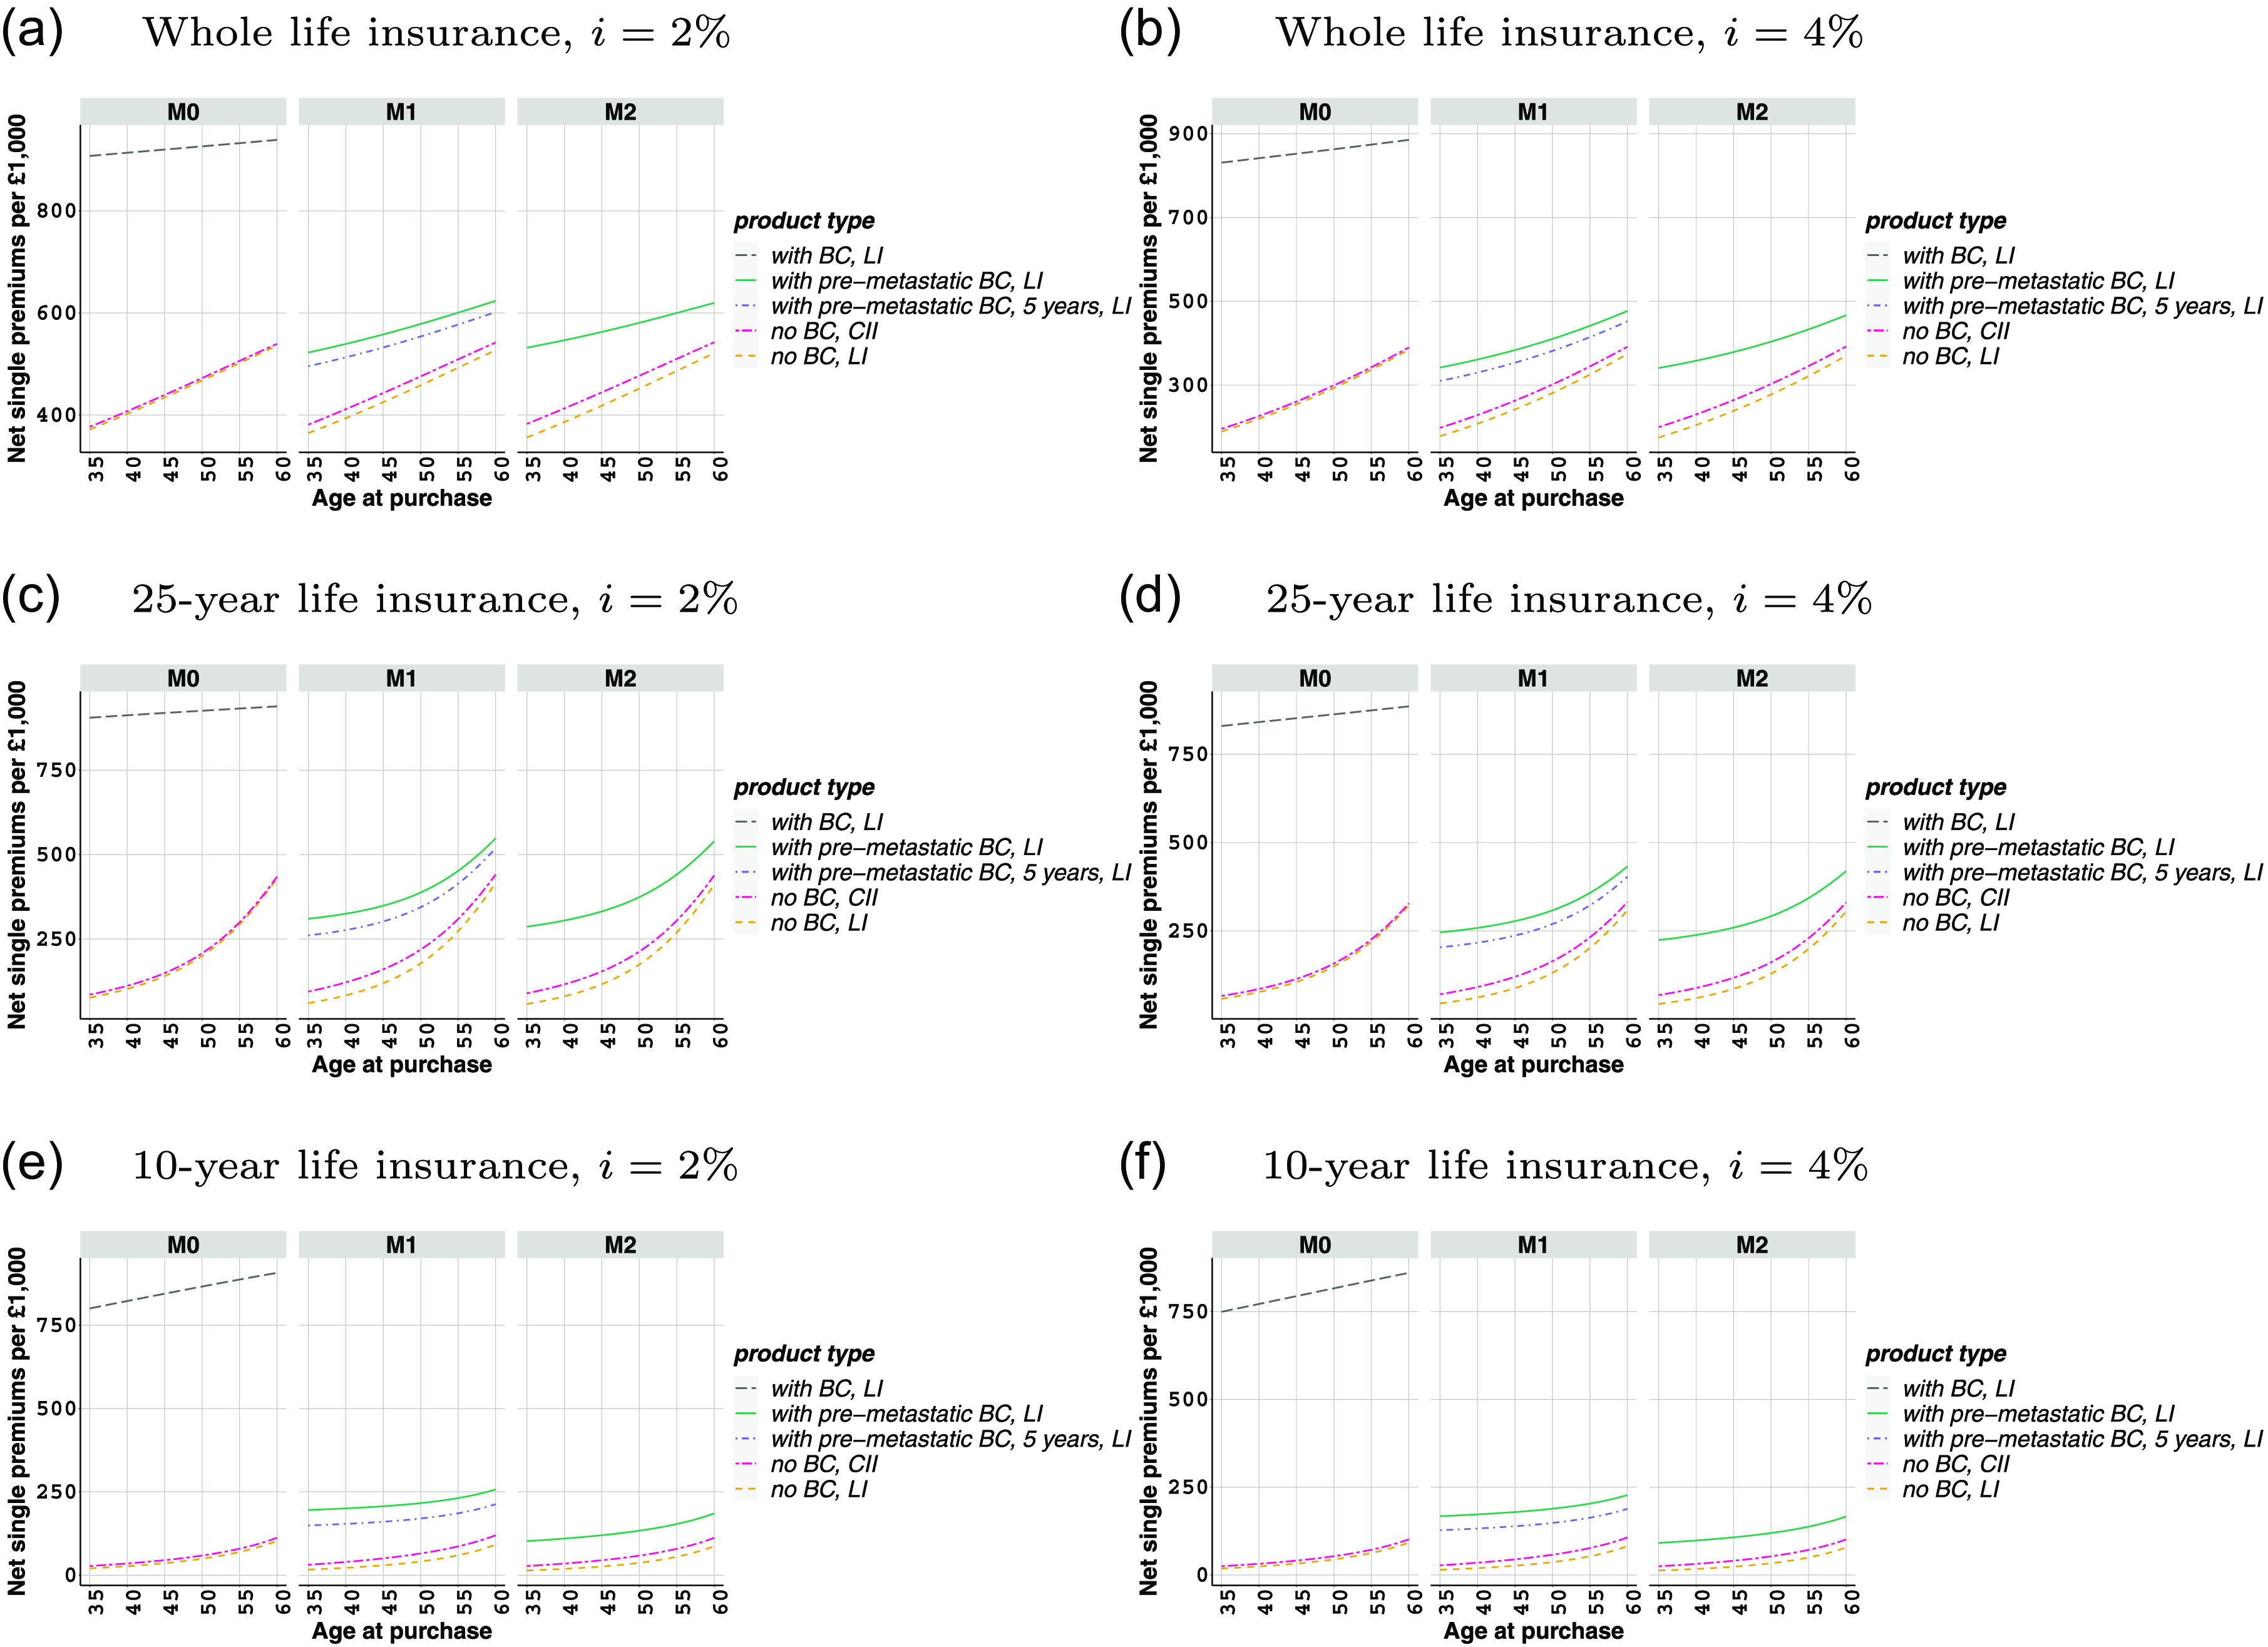
Net single premium rates for specialized critical illness, (6)–(7), and life insurance contracts, (8)–(11), and (12), for policyholders with or without breast cancer at the time of purchase, £1,000 benefit, payable at the time of event, based on M0–M2 in Table 1, when
 $\alpha = 0.6$
and
$\alpha = 0.6$
and
 $\beta = 1/10$
.
$\beta = 1/10$
.
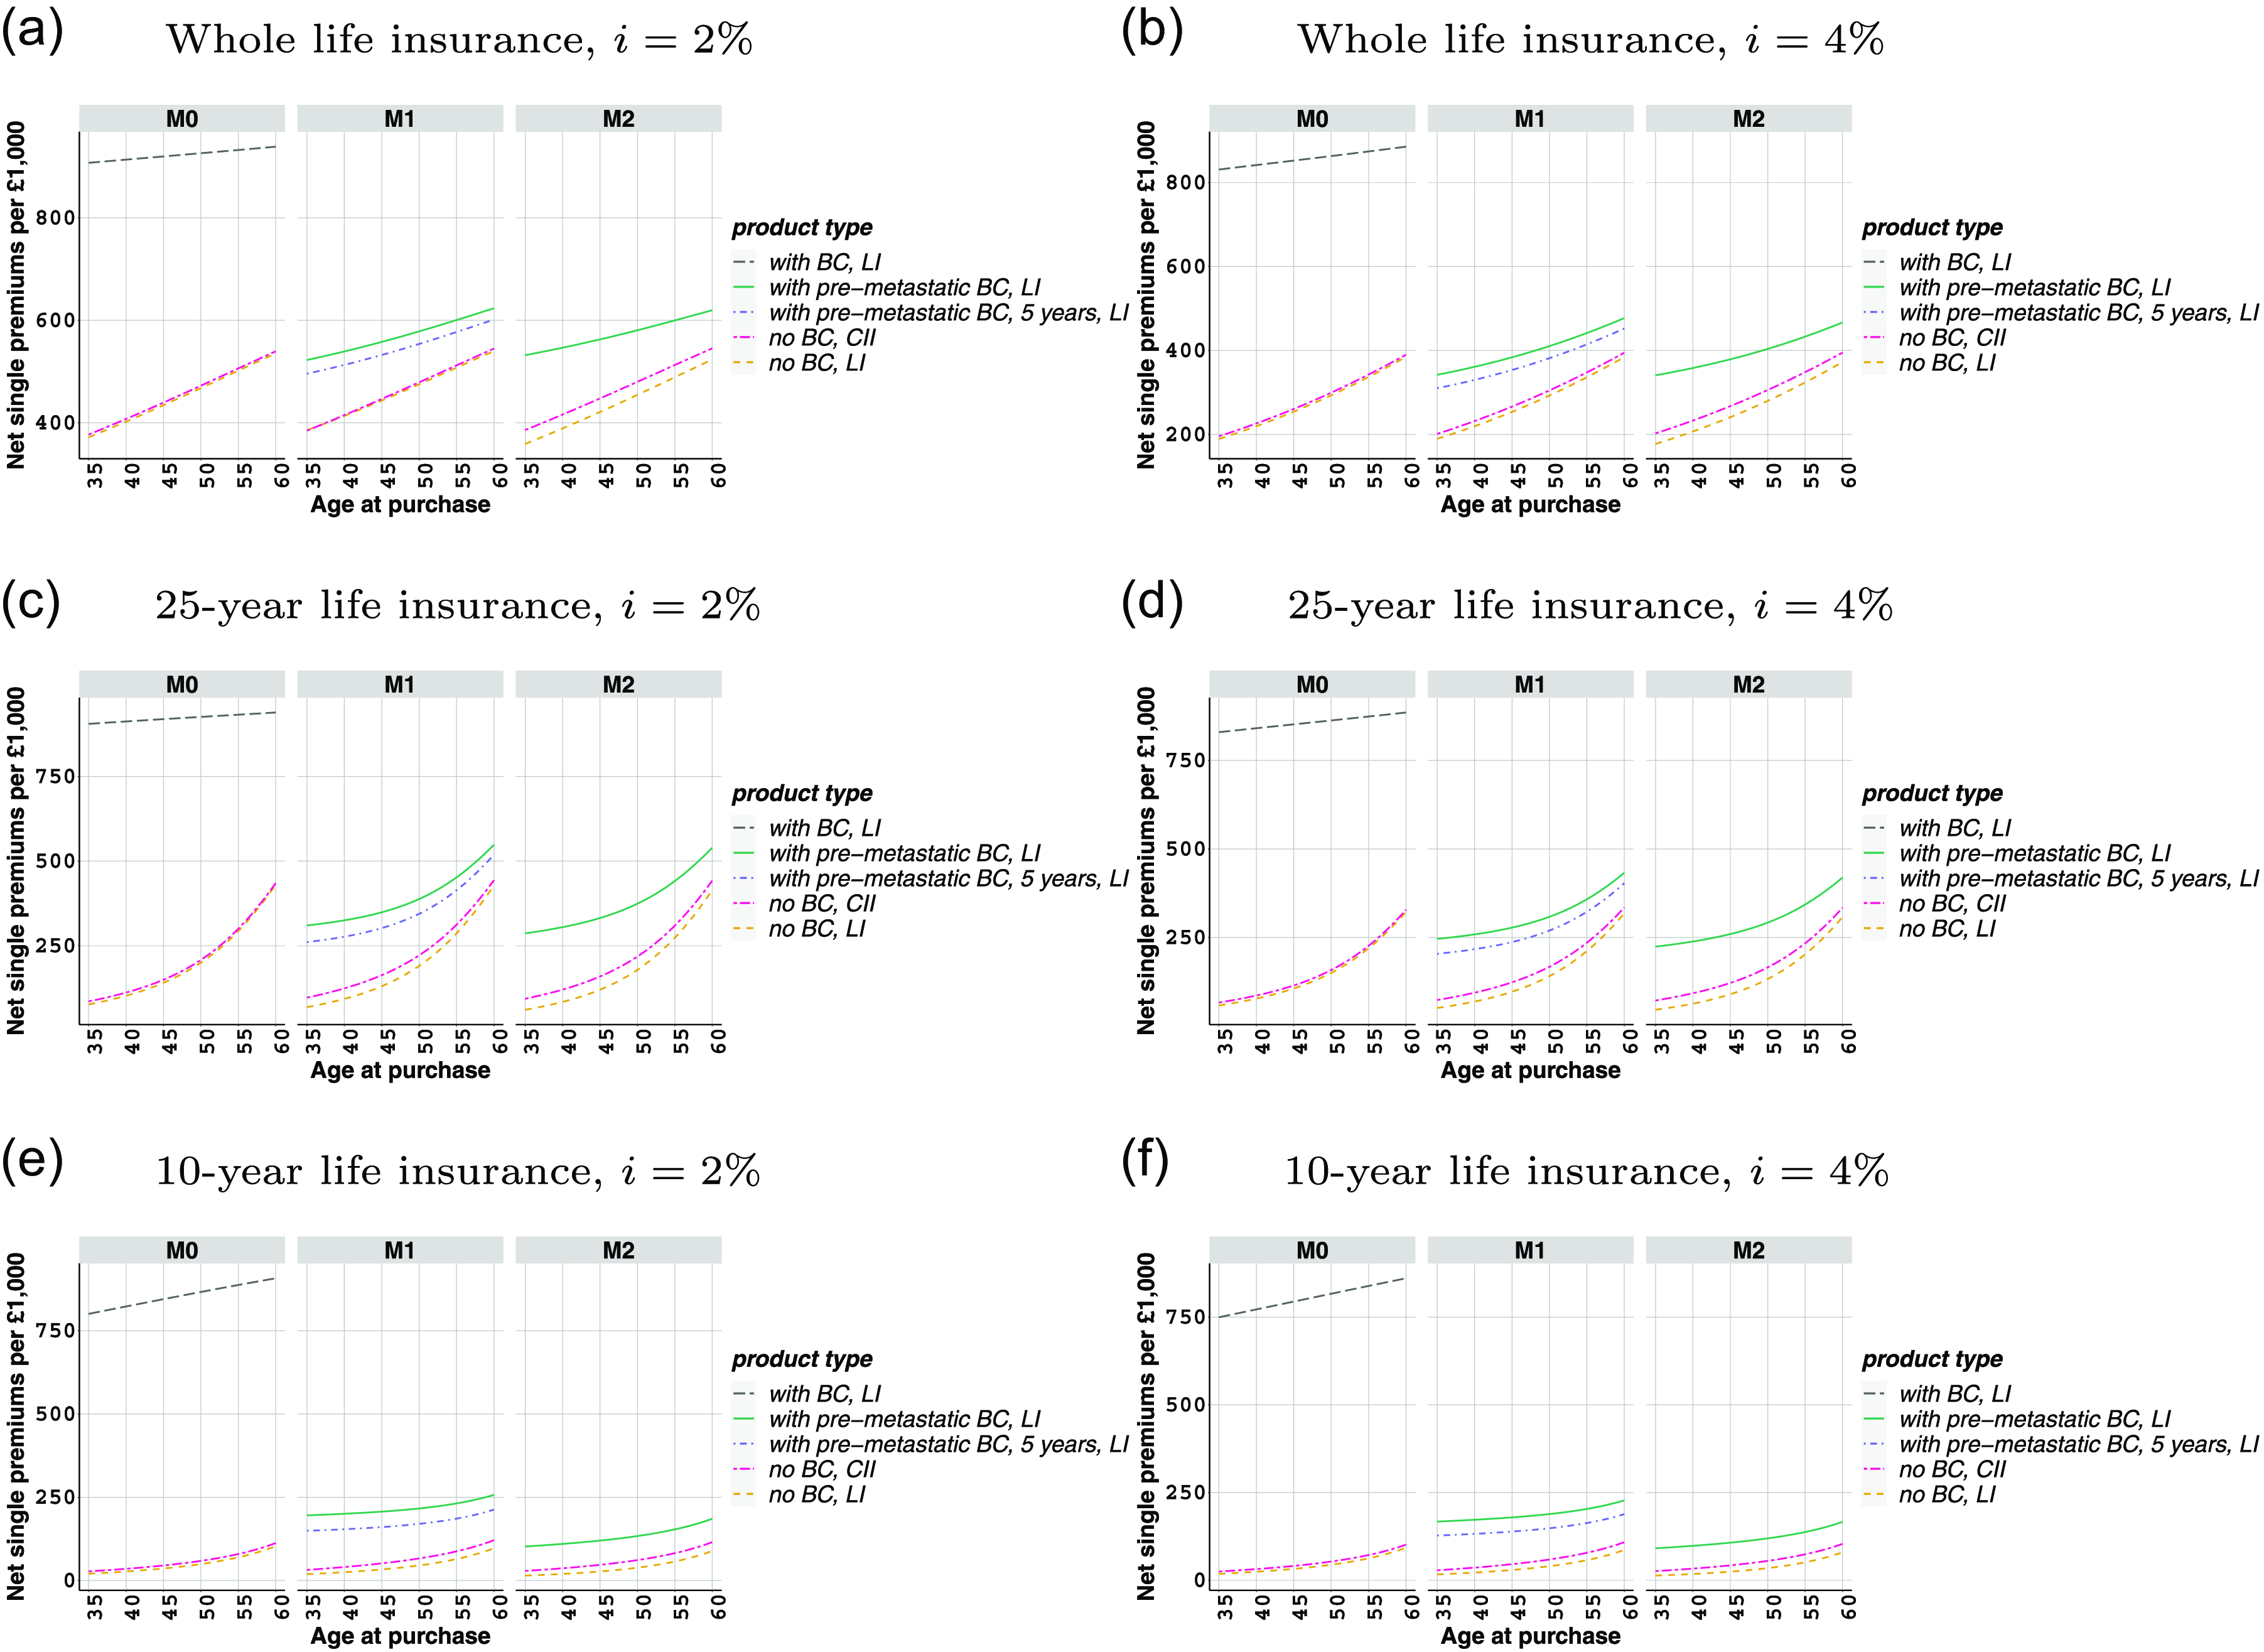
Estimated
 $\hat {k}_{x}$
values for a policyholder aged 30 years, with no breast cancer, at time zero, based on M1 and M2, when
$\hat {k}_{x}$
values for a policyholder aged 30 years, with no breast cancer, at time zero, based on M1 and M2, when
 $\beta =1/5$
or
$\beta =1/5$
or
 $\beta =1/10$
and
$\beta =1/10$
and
 $\alpha =0.6$
.
$\alpha =0.6$
.

I. Further findings in Section 6
Estimated net cancer survival for a woman diagnosed with breast cancer at different ages under M0.

Estimated
 $\hat {k}_{x}$
values based on M0 and M1, when
$\hat {k}_{x}$
values based on M0 and M1, when
 $\alpha =0.6$
and
$\alpha =0.6$
and
 $\beta =1/7$
.
$\beta =1/7$
.

Net single premium rates for specialized critical illness, (6)–(7), and life insurance contracts, (8)–(11), and (12), for policyholders with or without breast cancer at the time of purchase, £1,000 benefit, payable at the time of event, based on M0–M2 in Table 1, when
 $\alpha = 0.6$
and
$\alpha = 0.6$
and
 $\beta = 1/7$
, and
$\beta = 1/7$
, and
 $\mu ^{13}_x$
under M0 based on Table 3.
$\mu ^{13}_x$
under M0 based on Table 3.

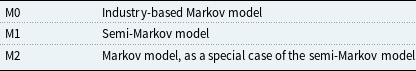


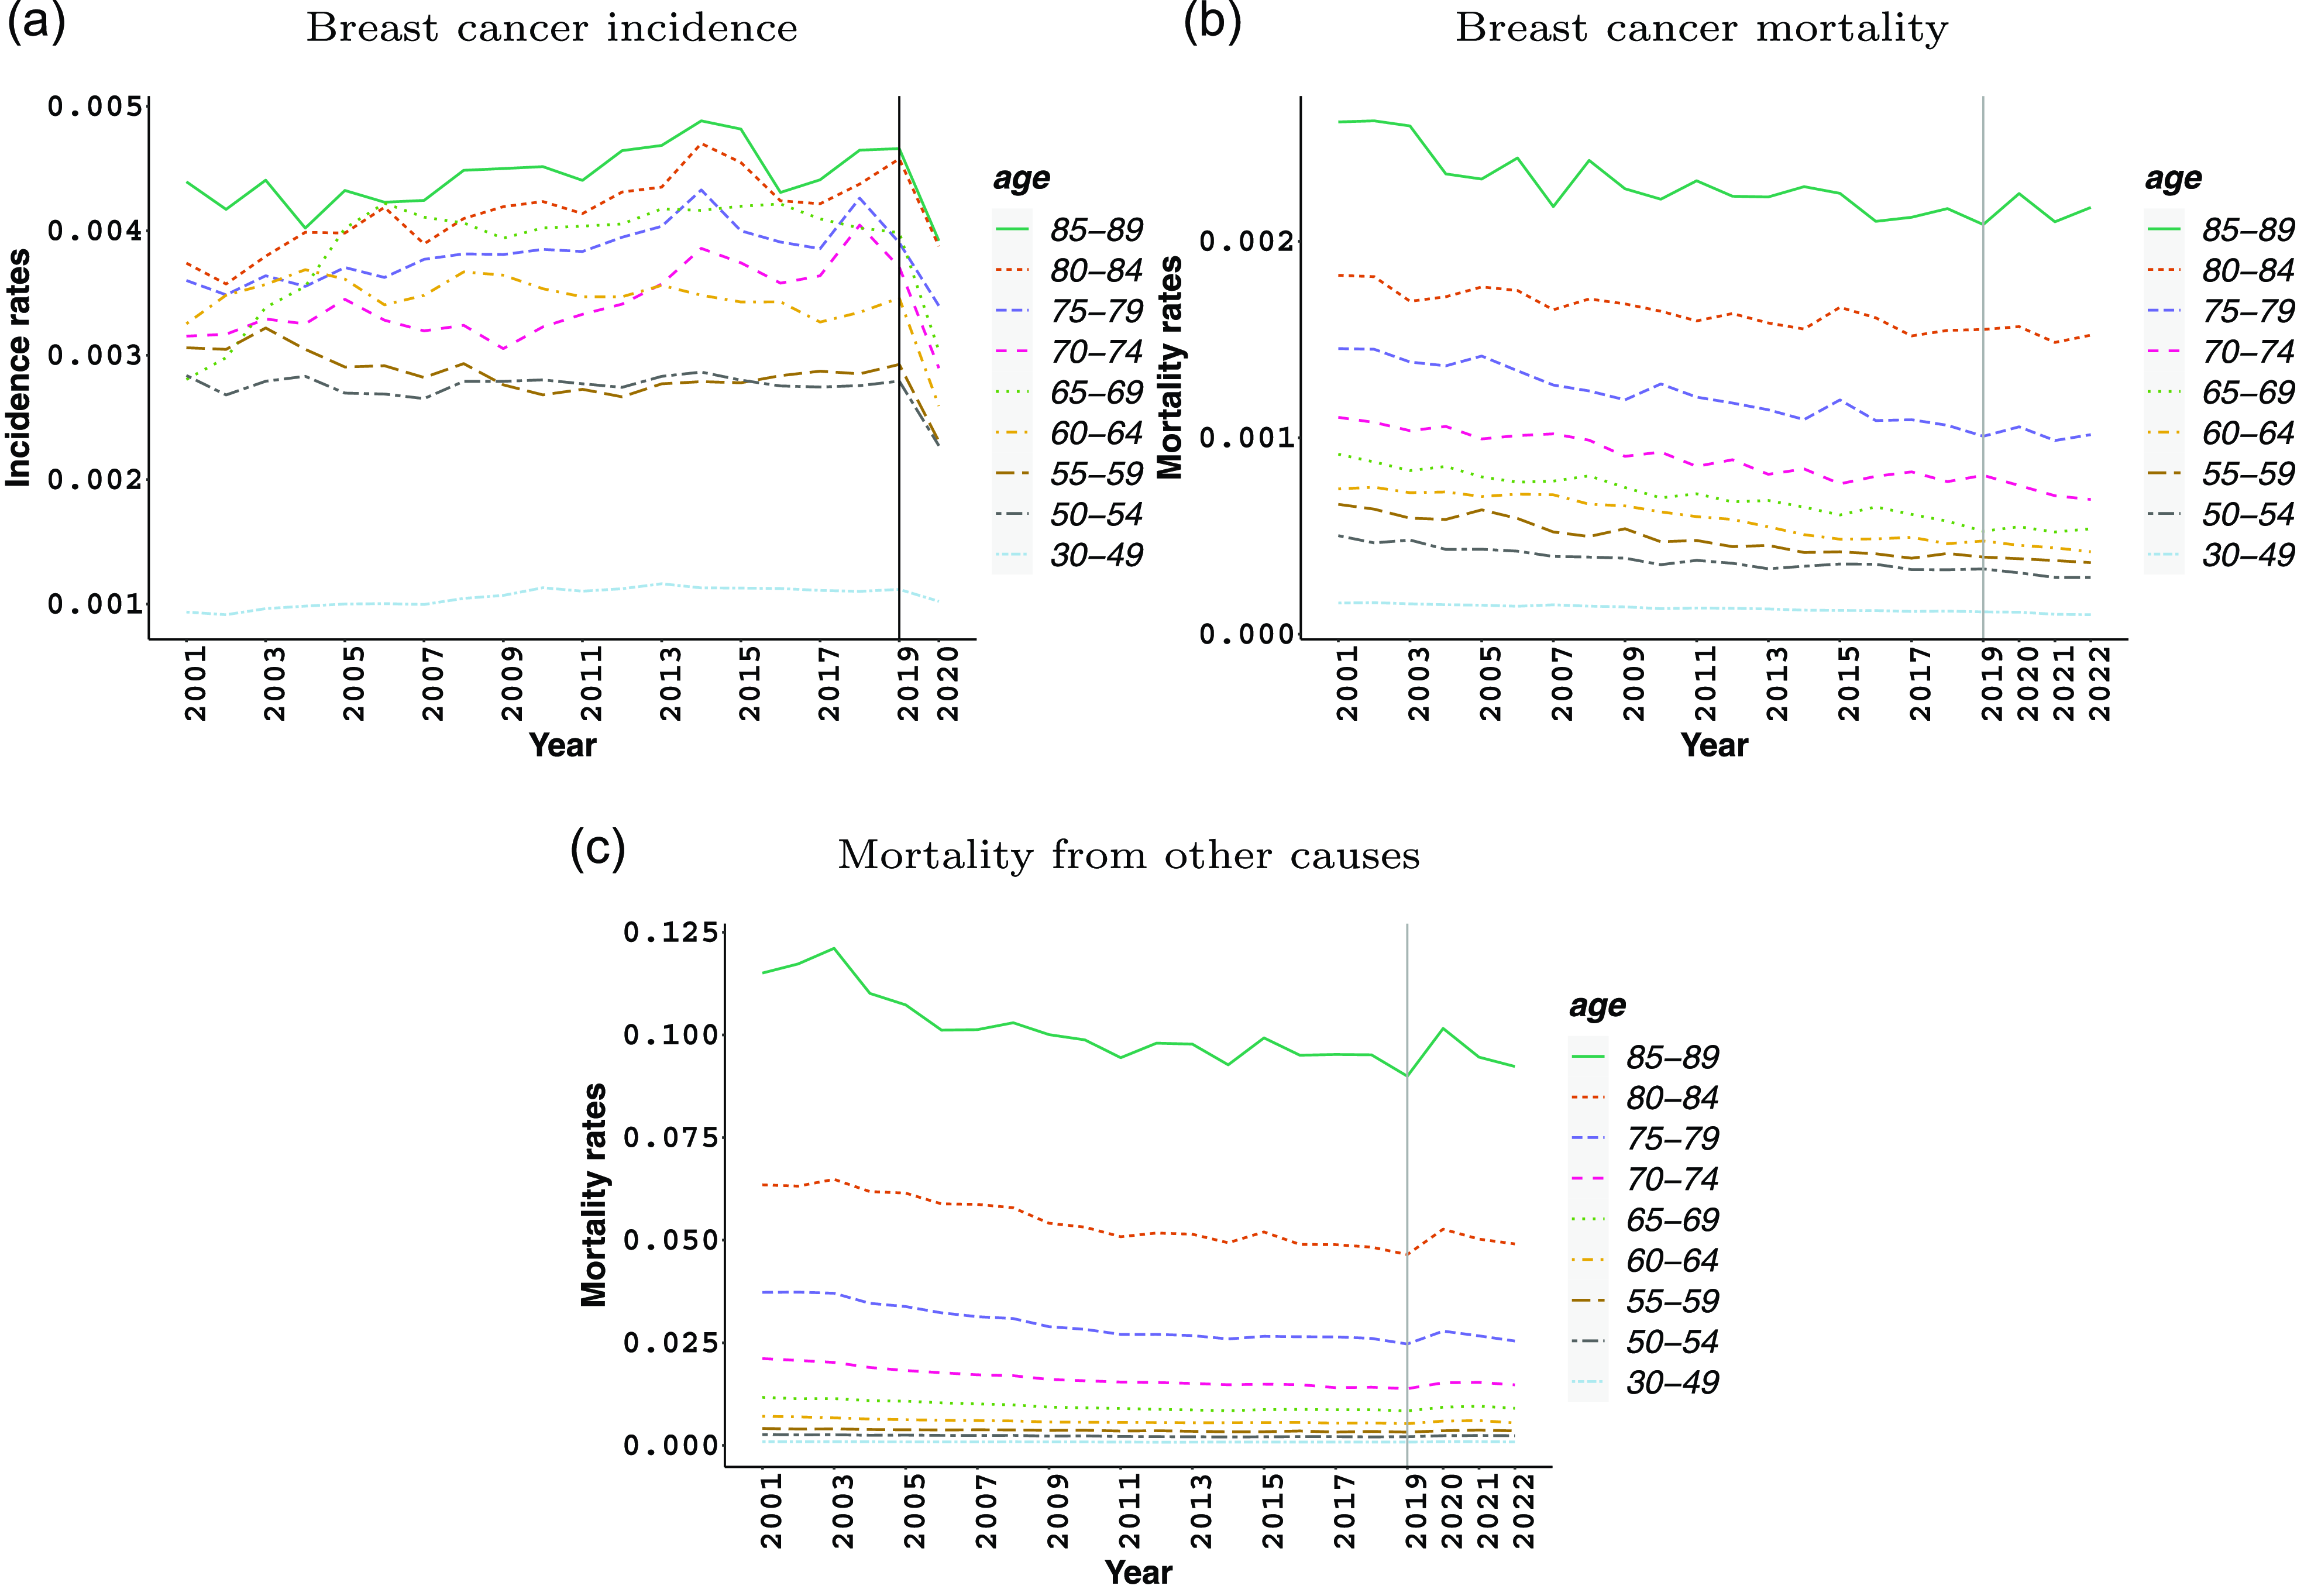
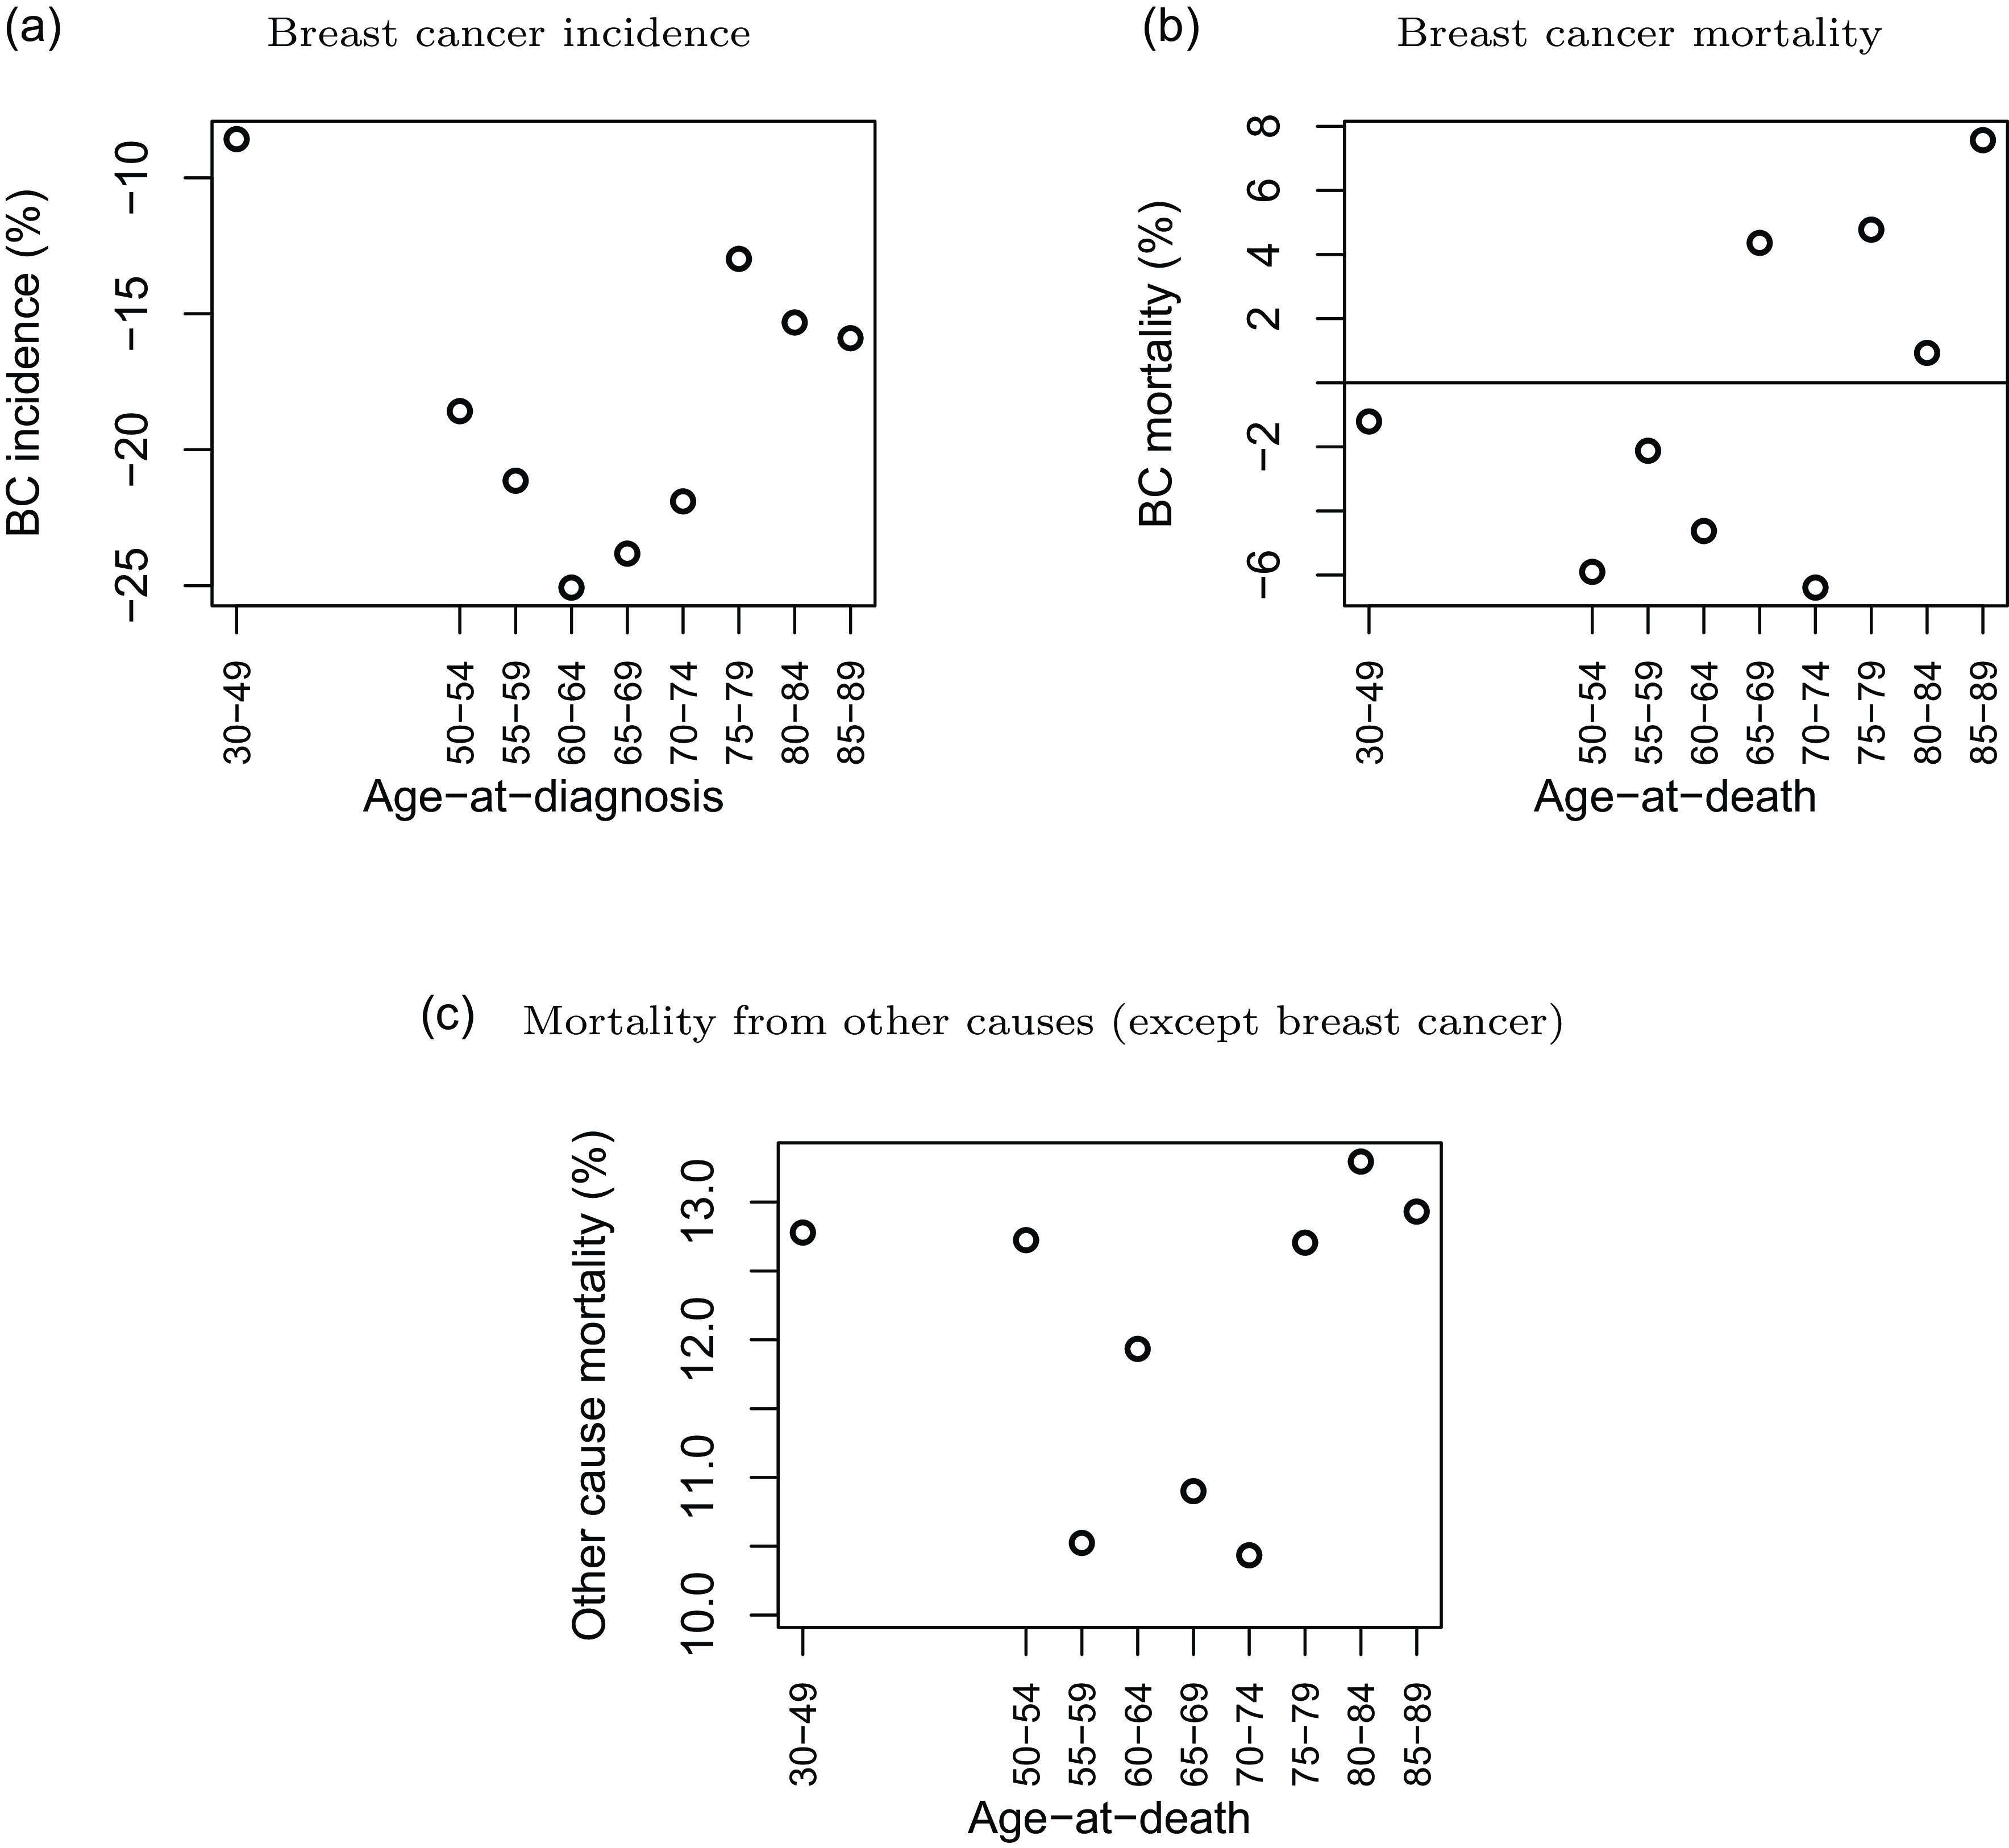
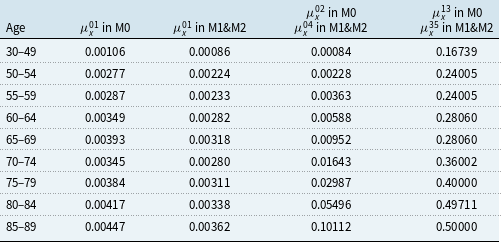
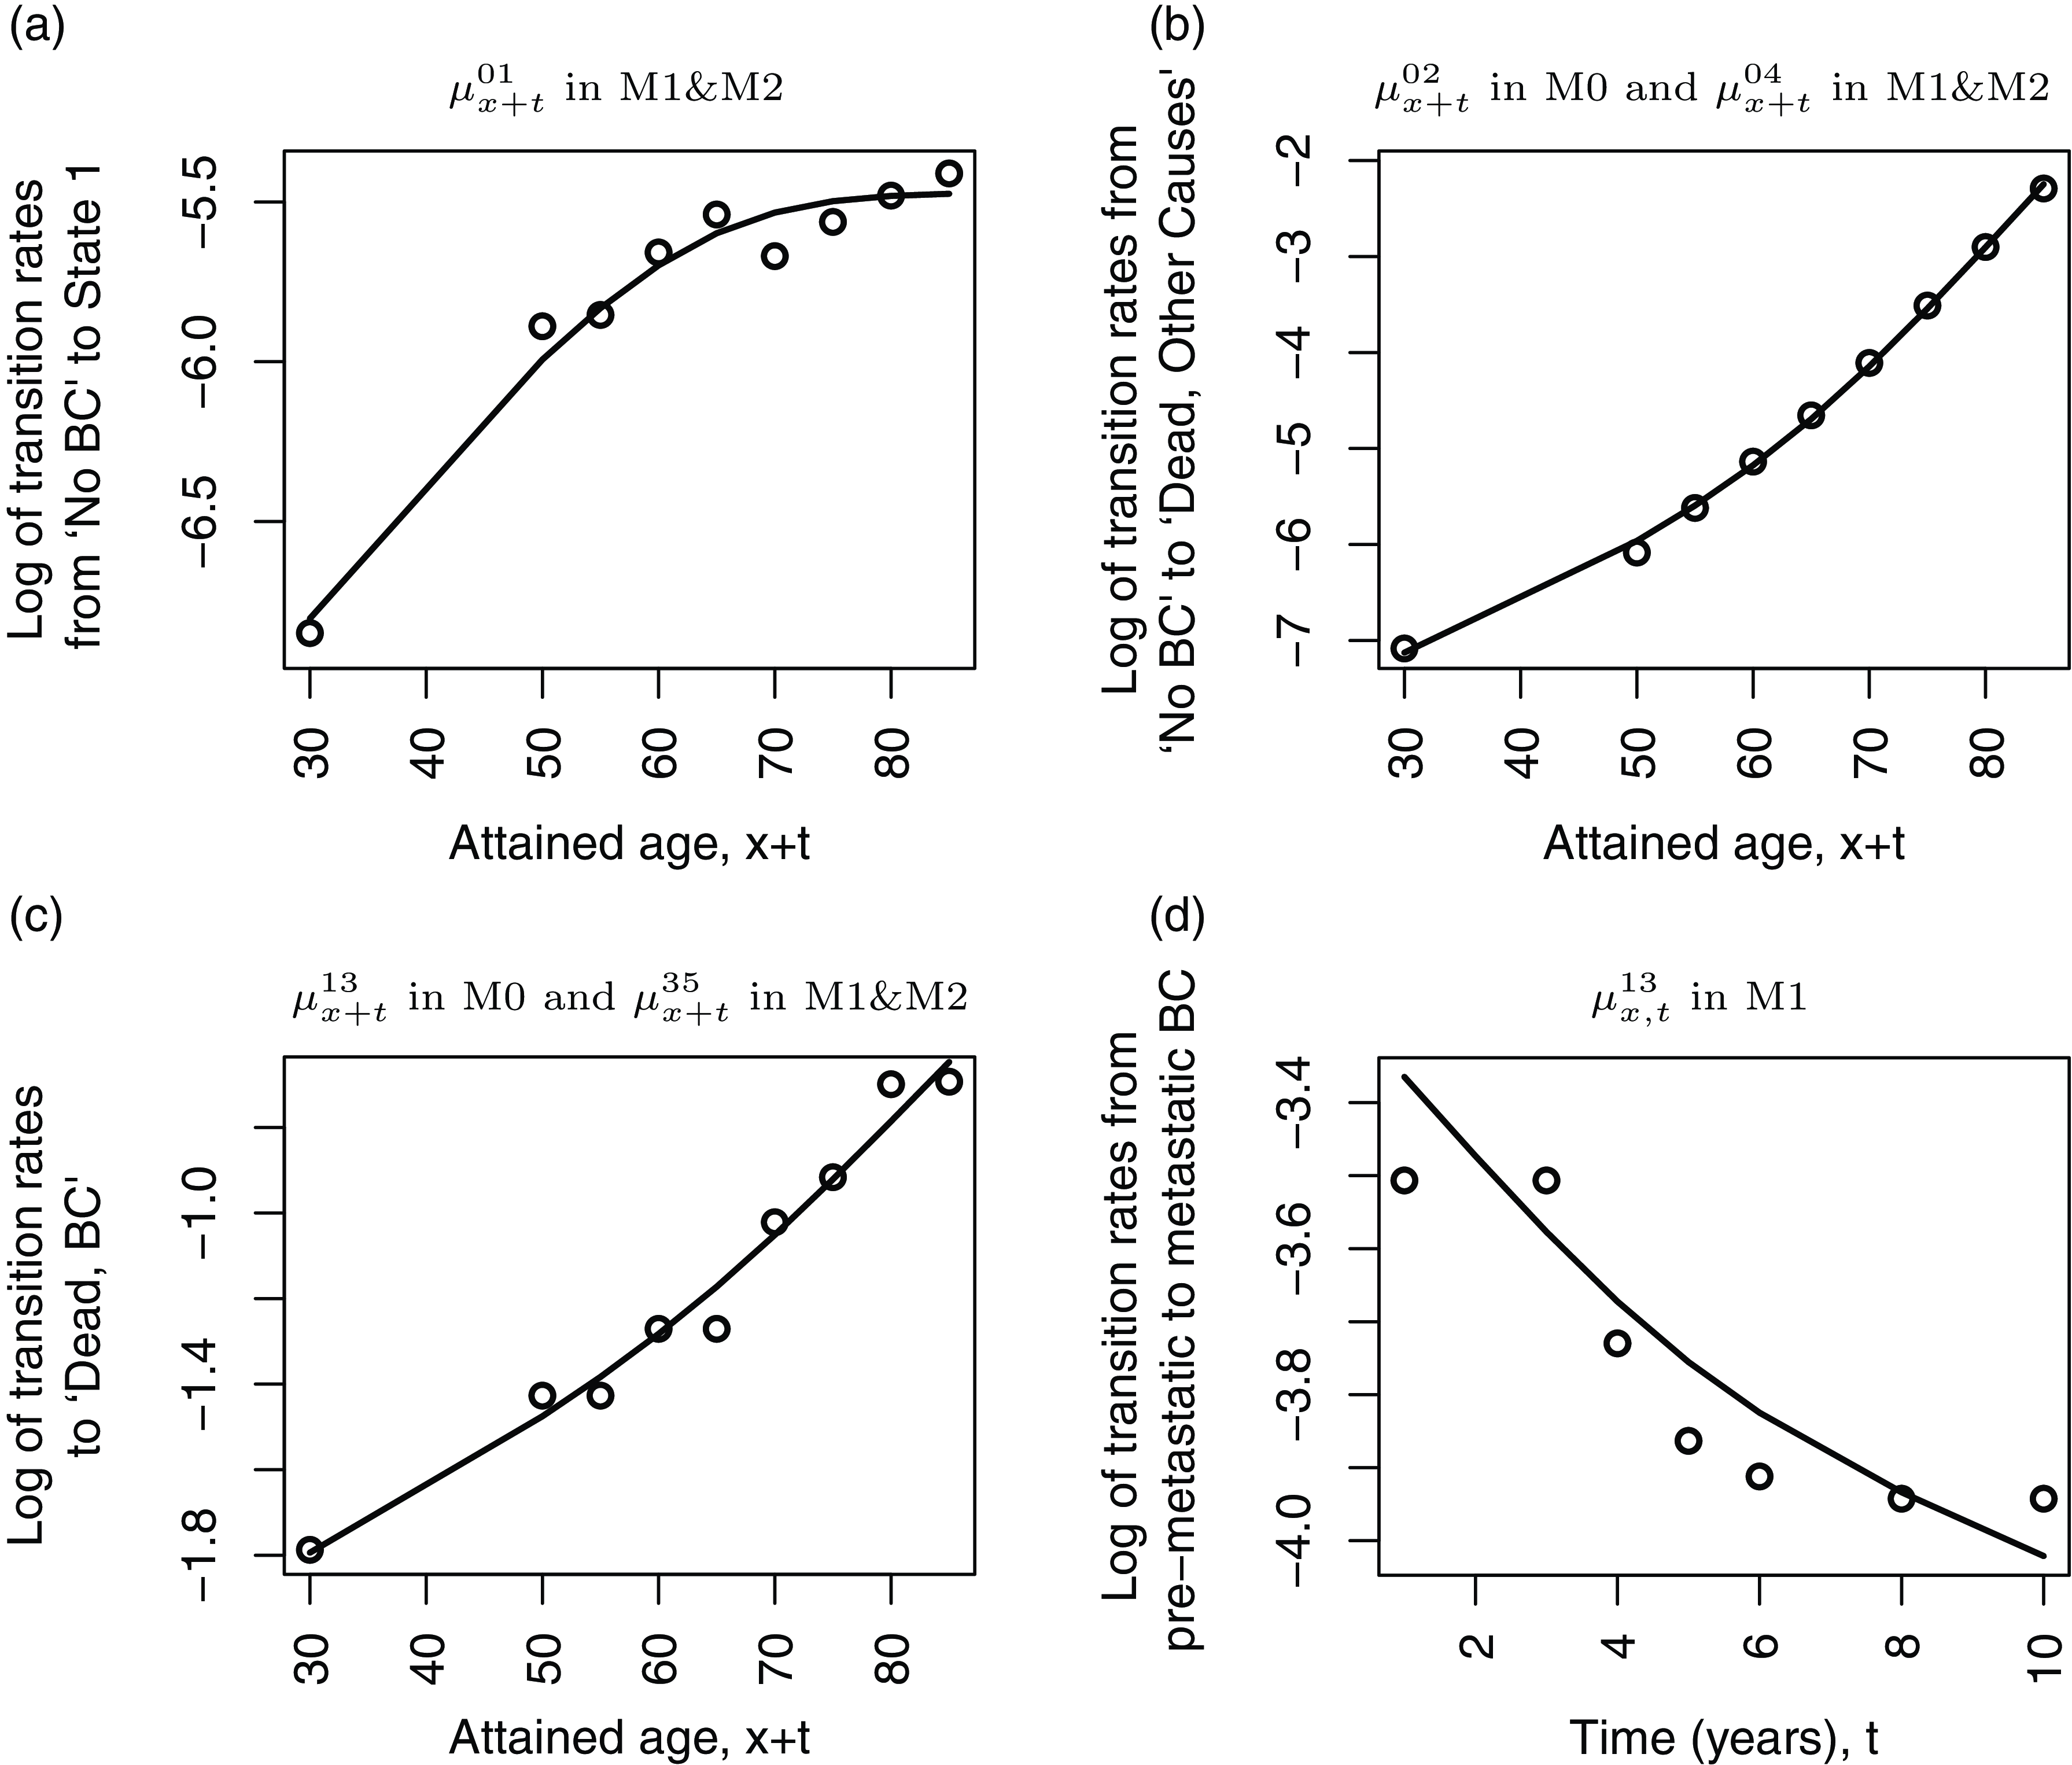

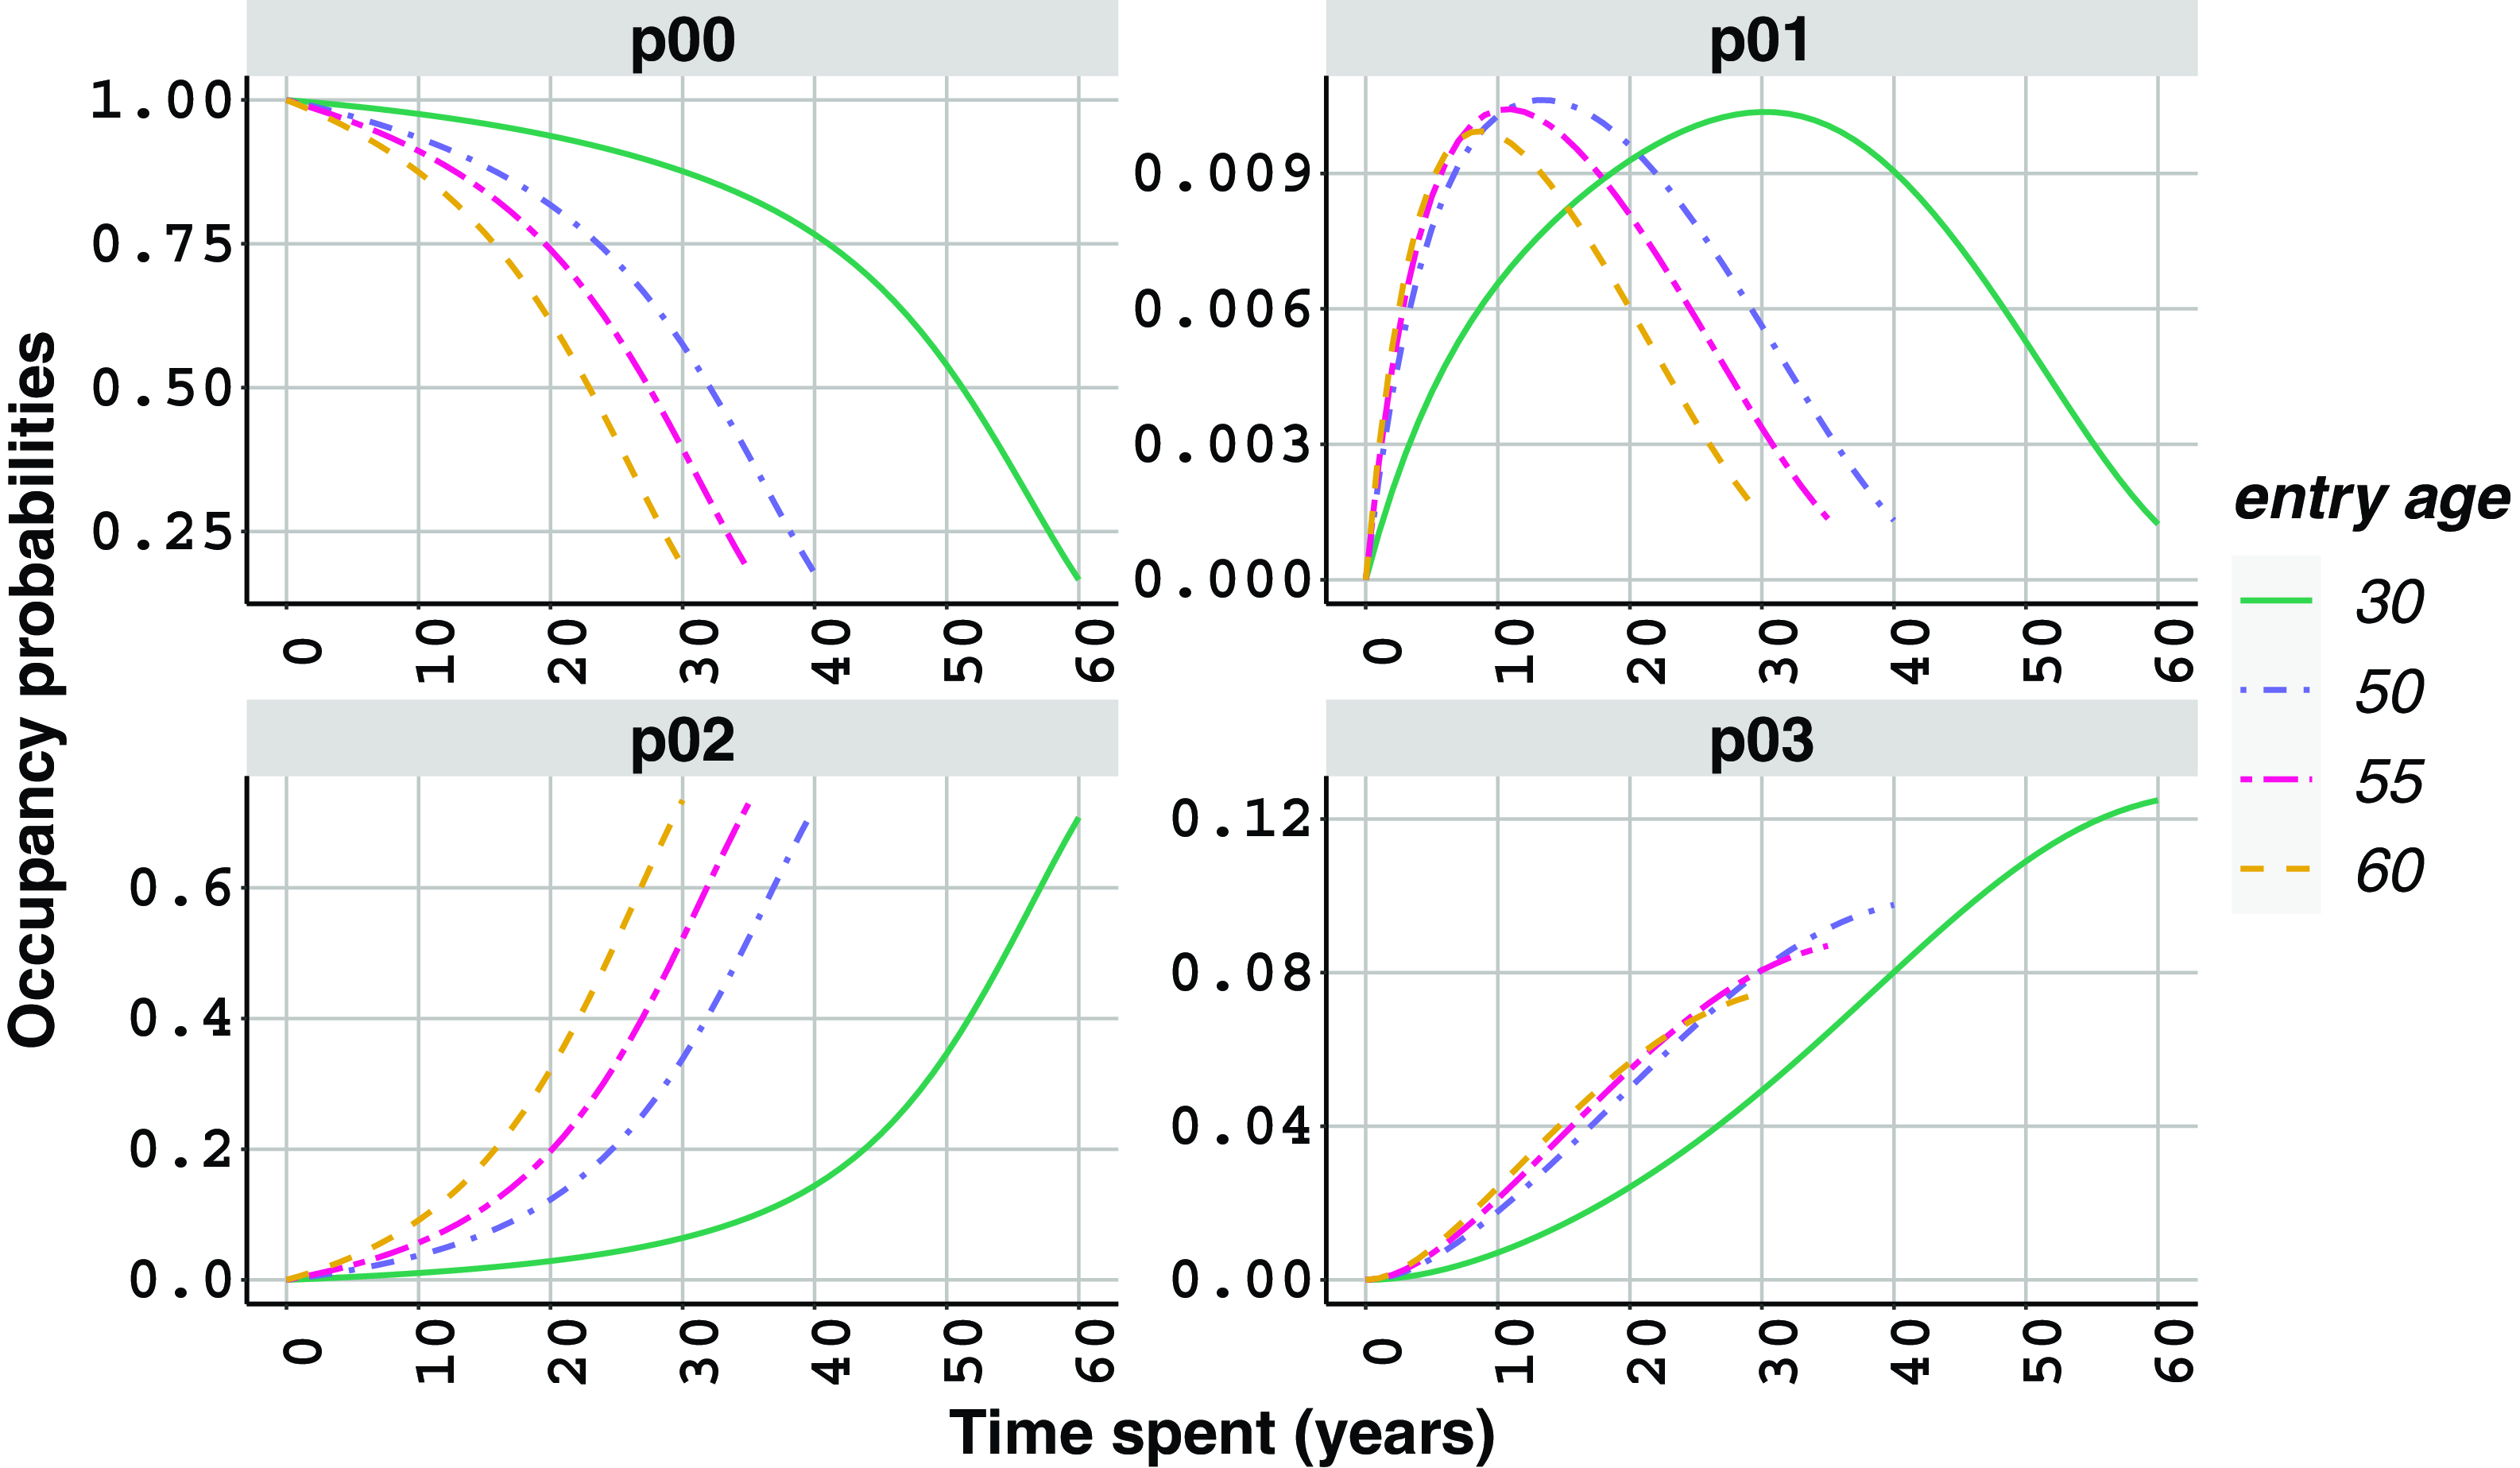

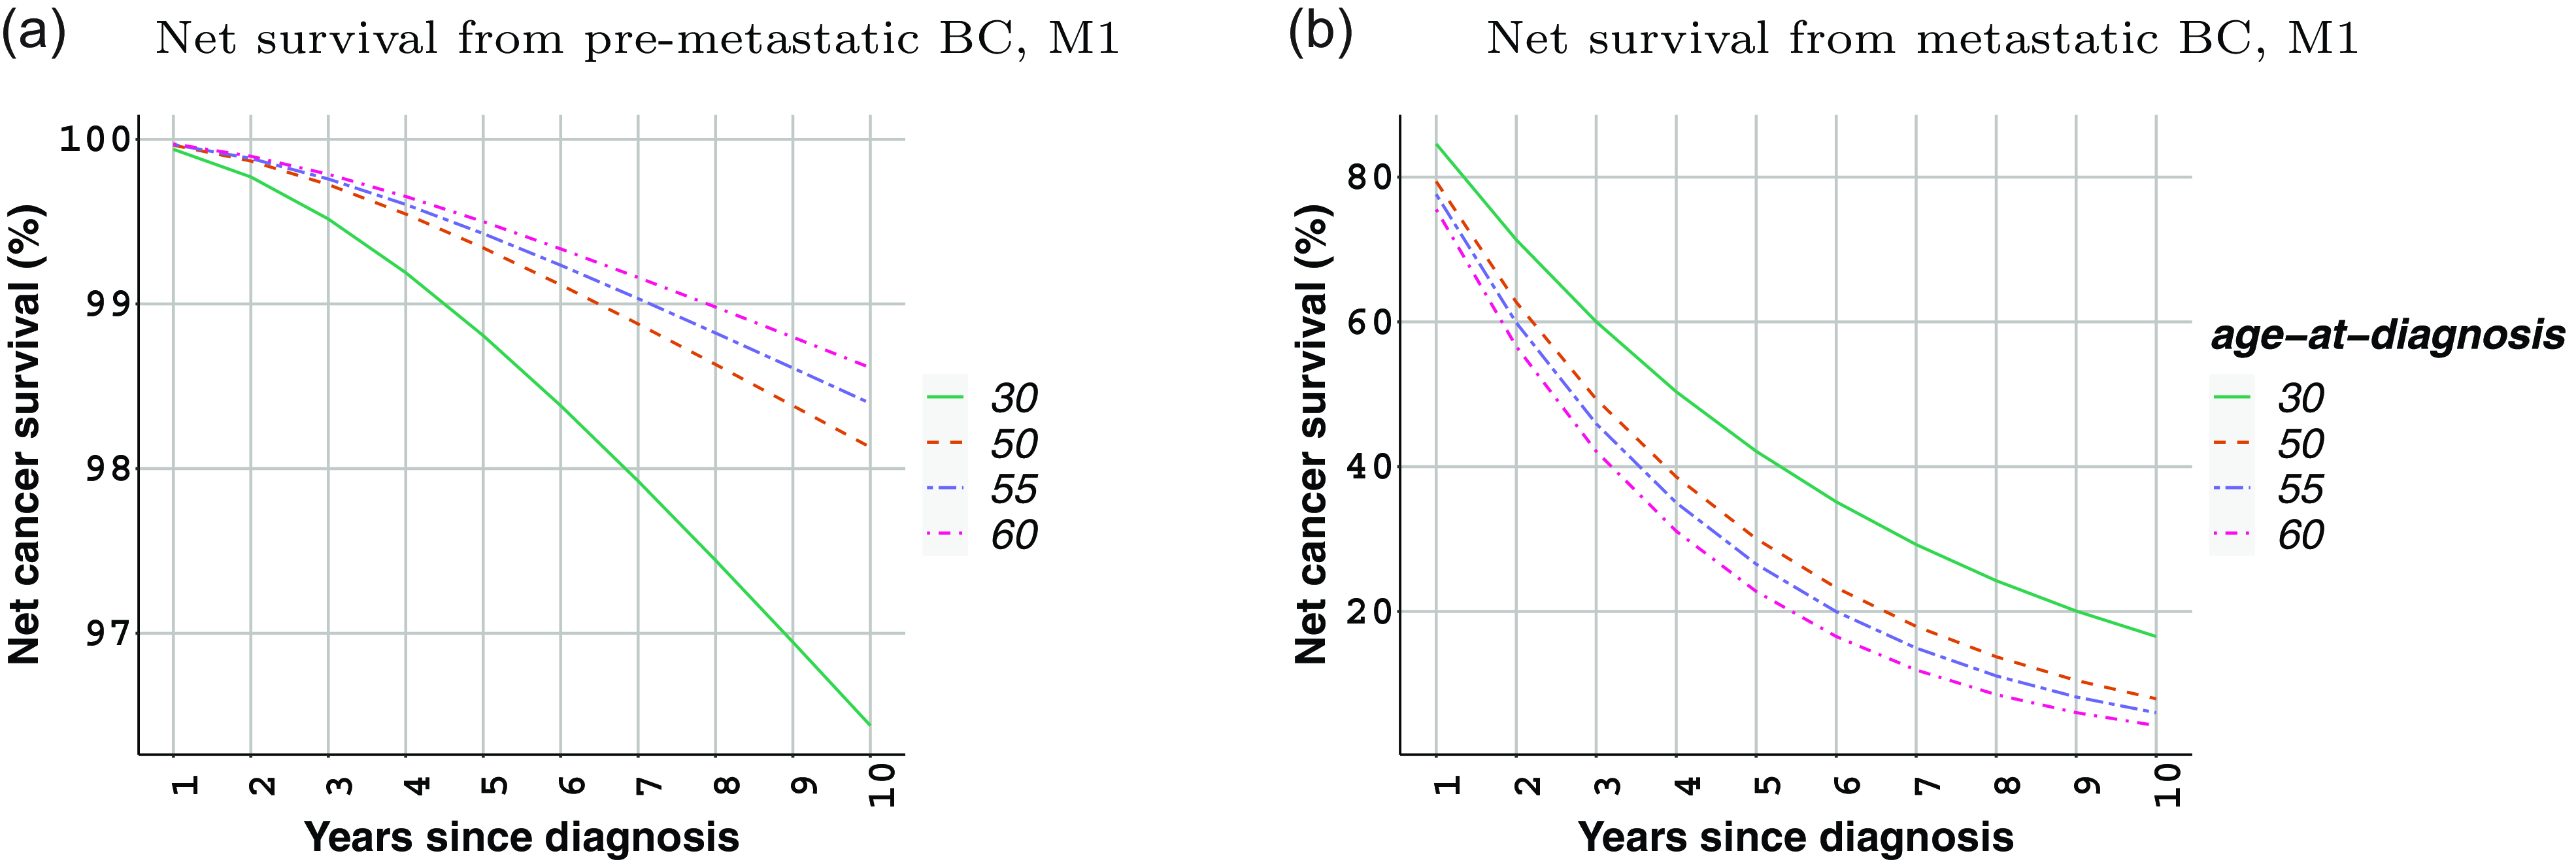


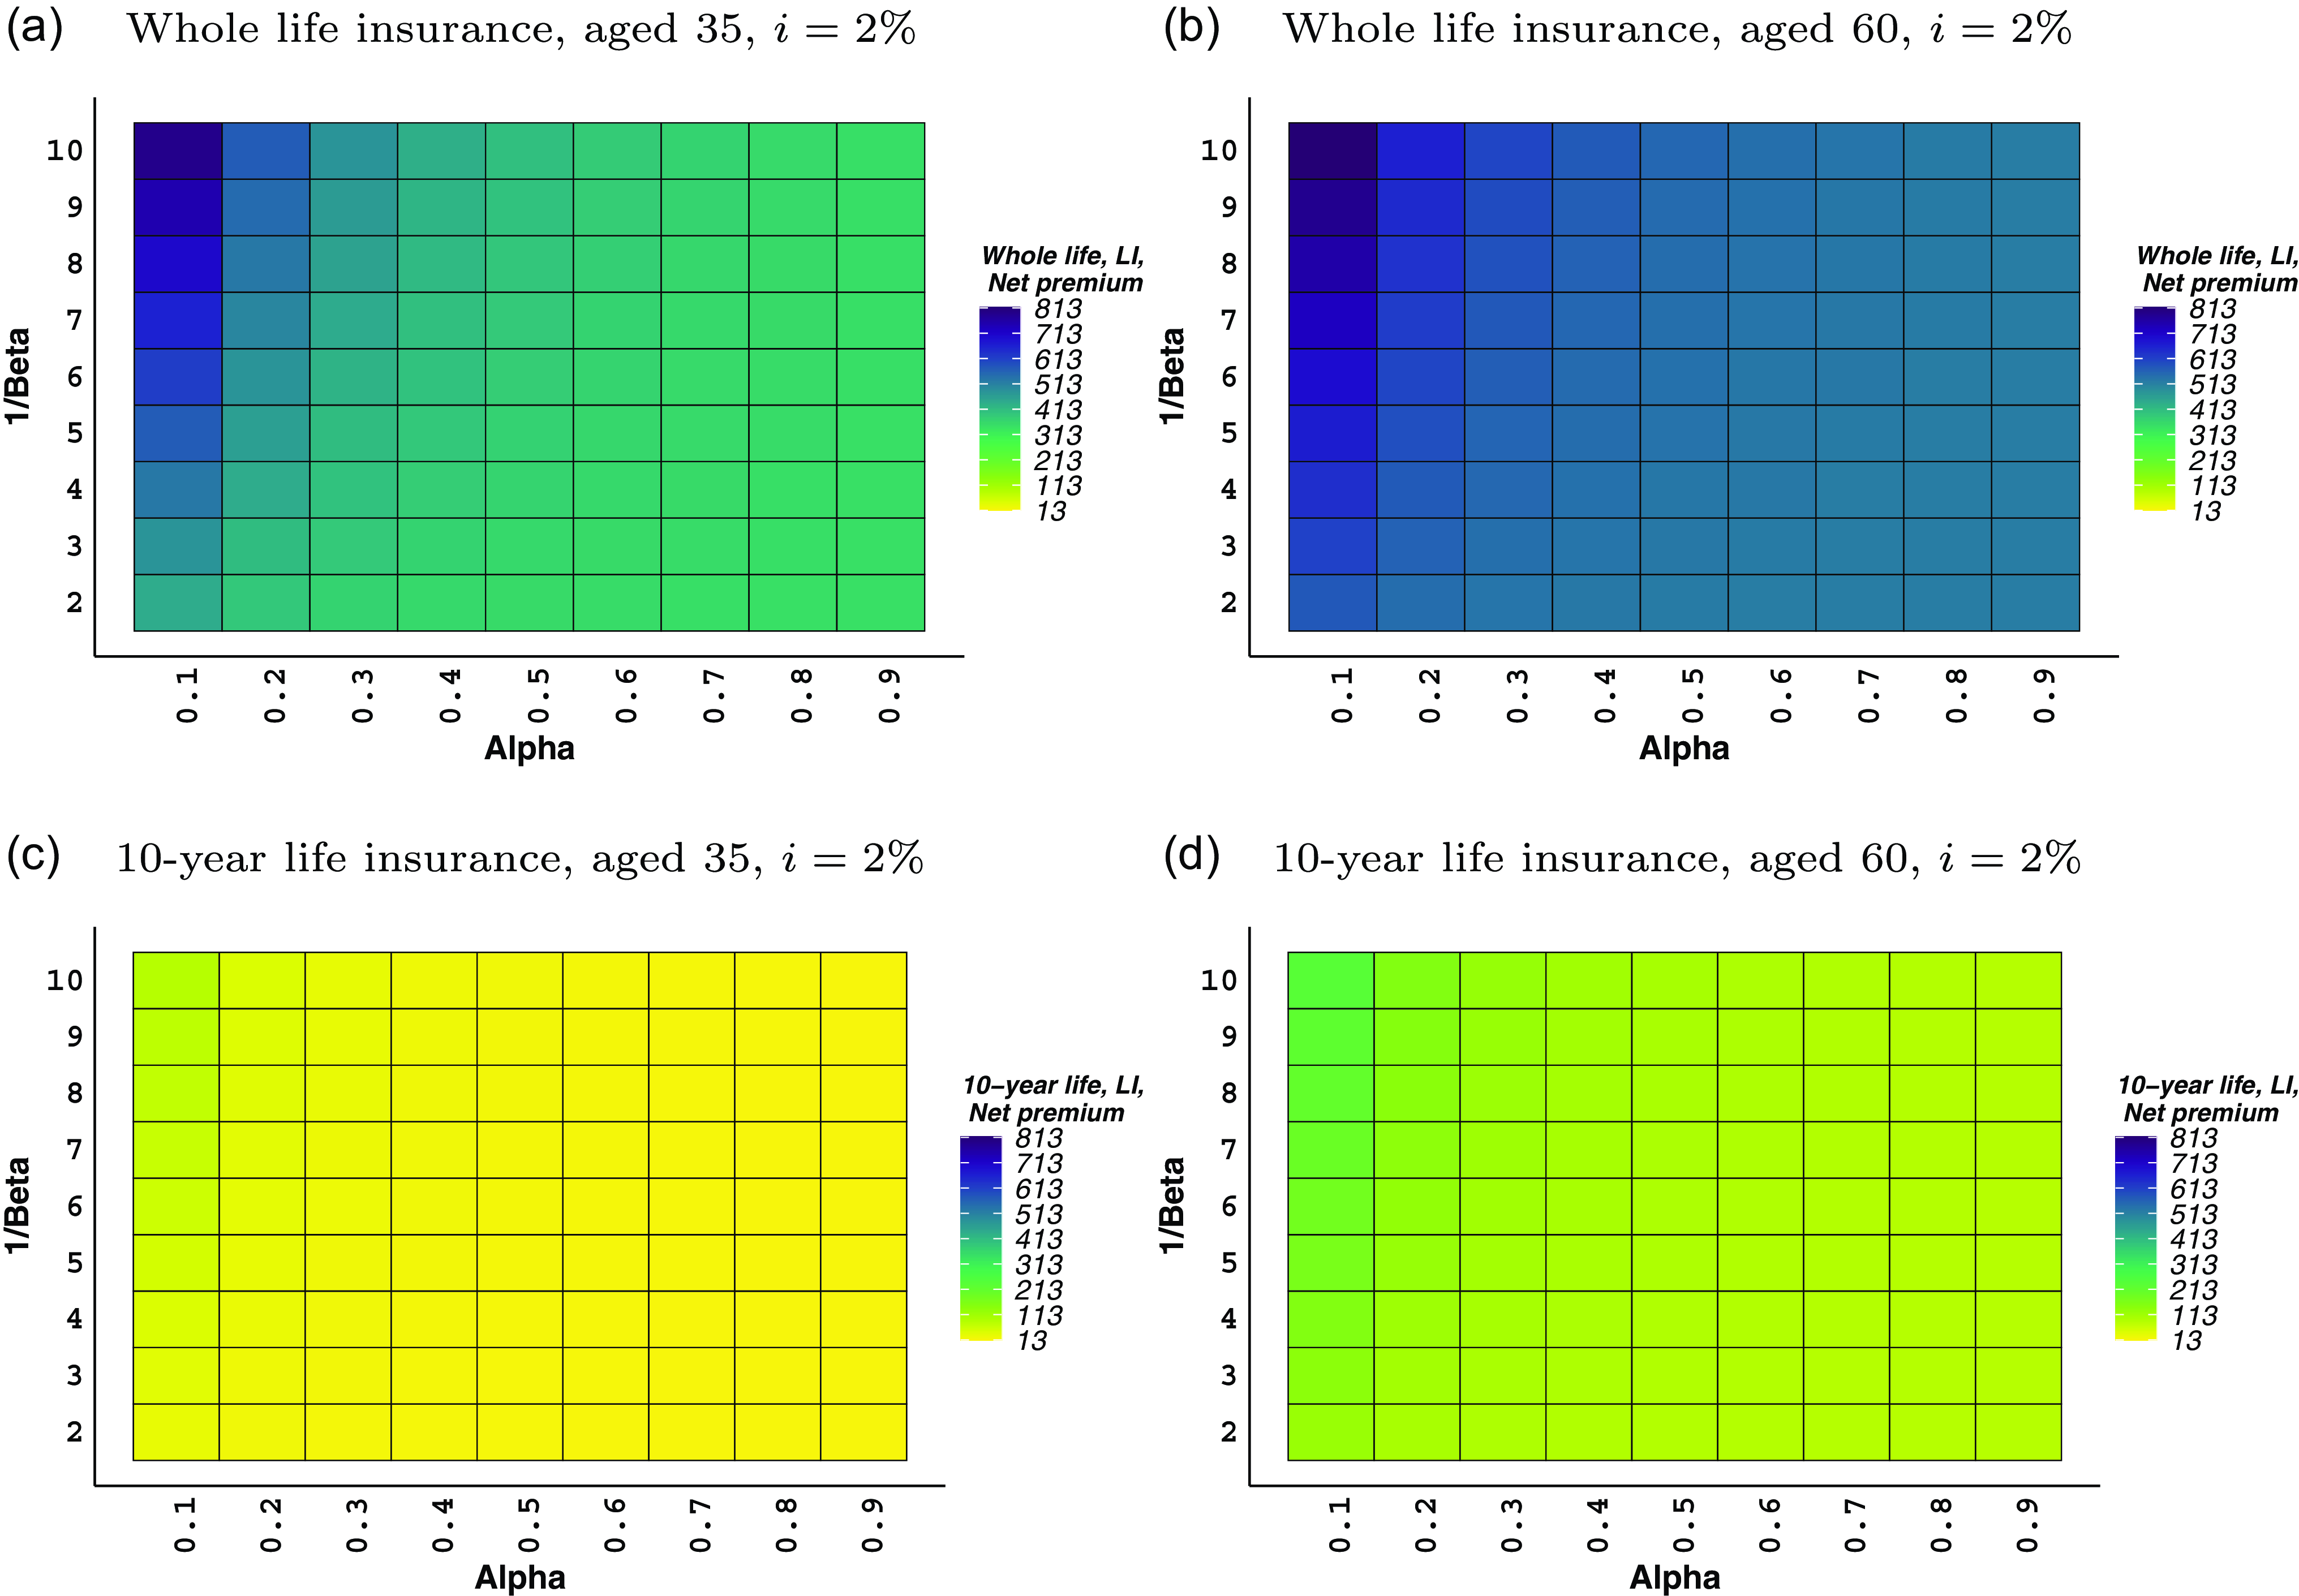
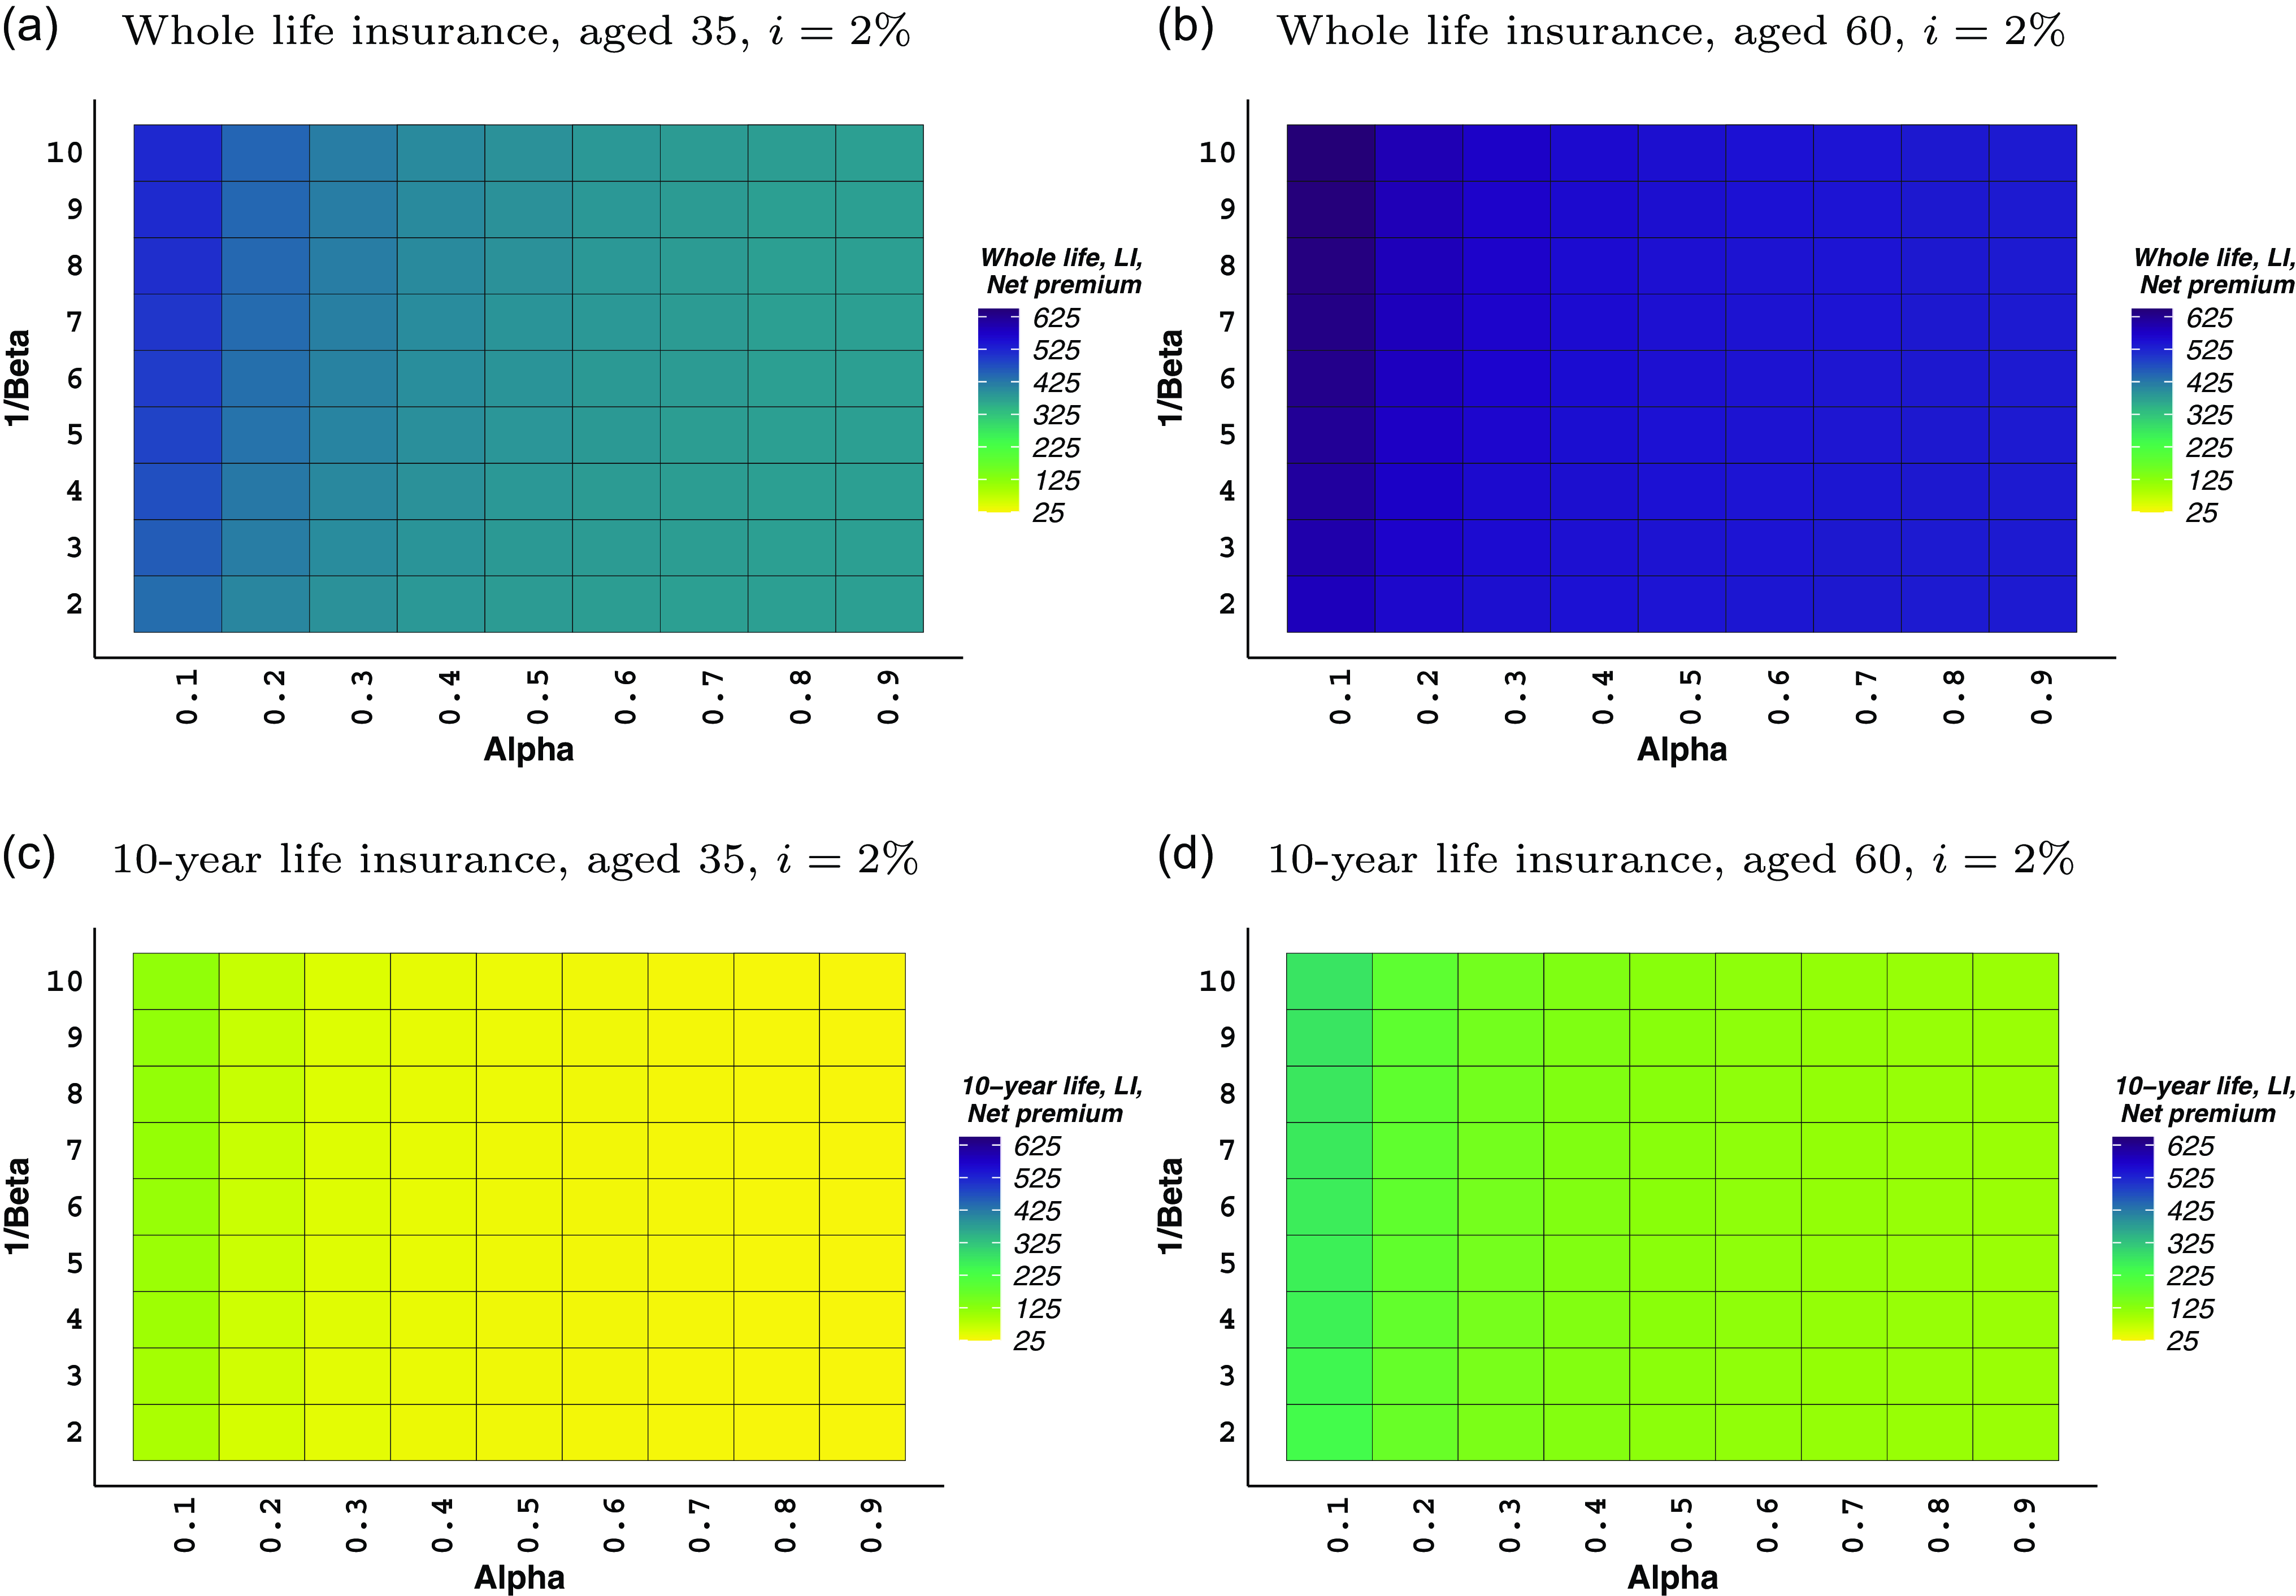


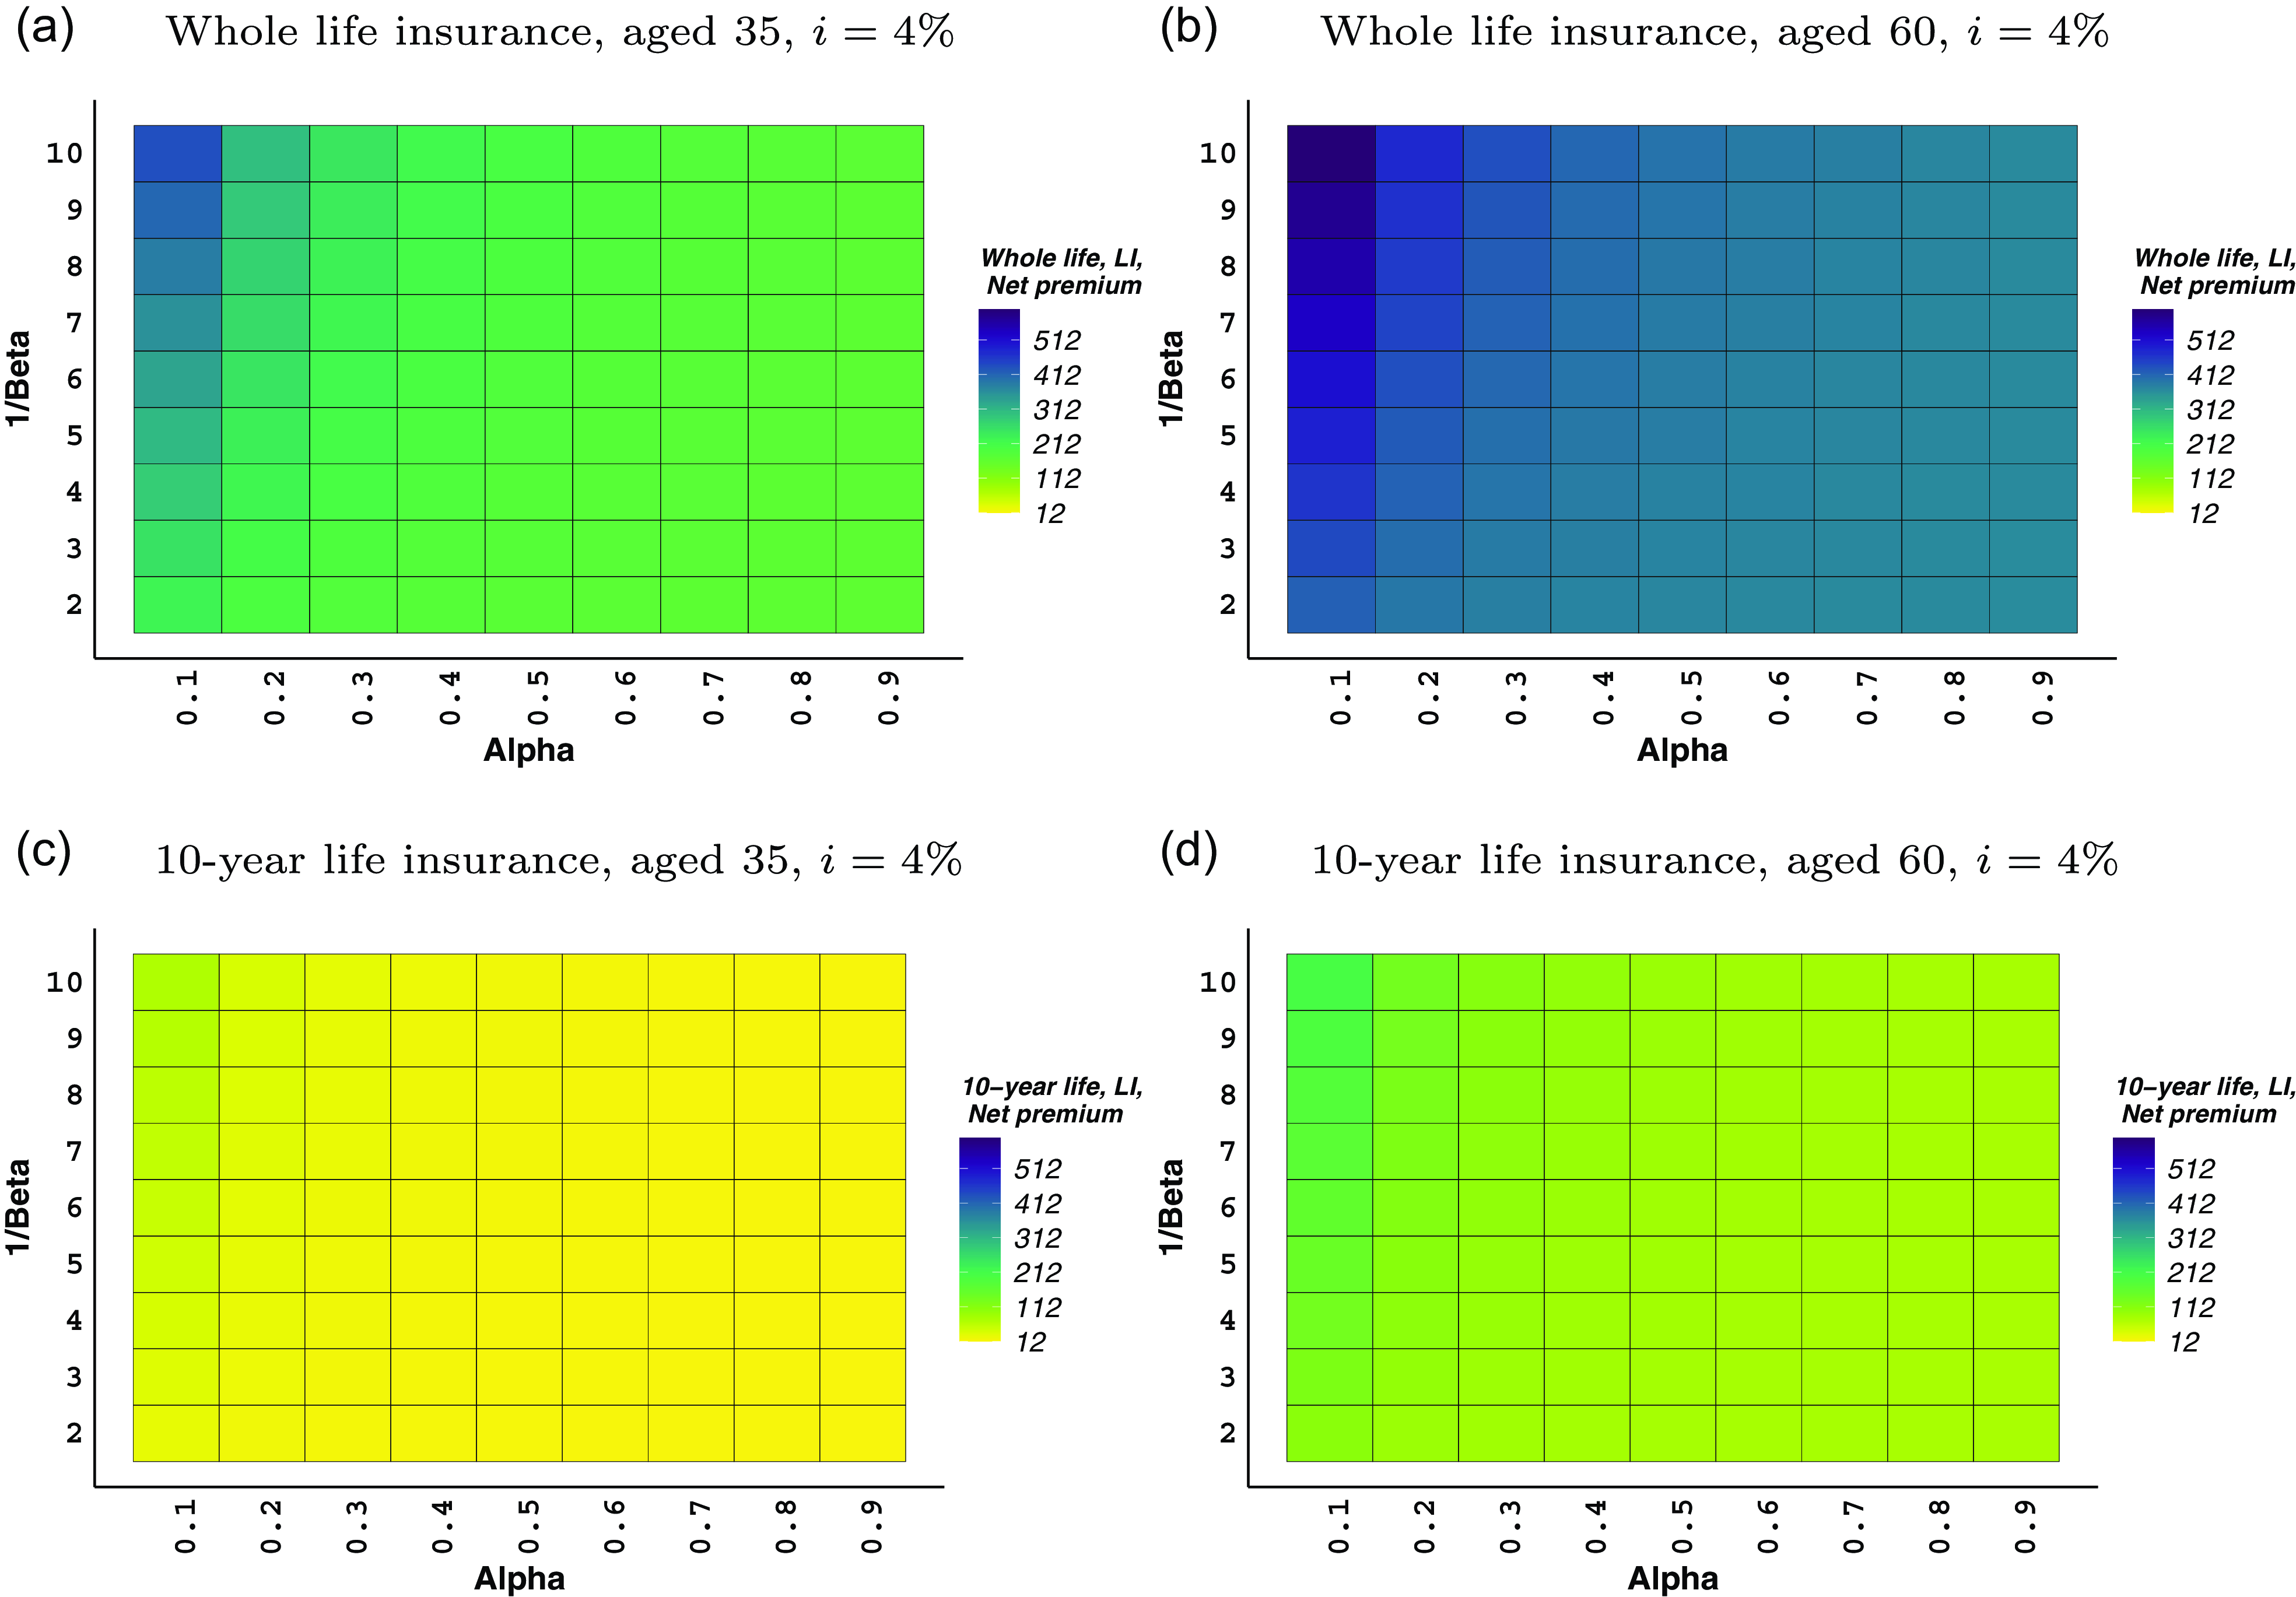


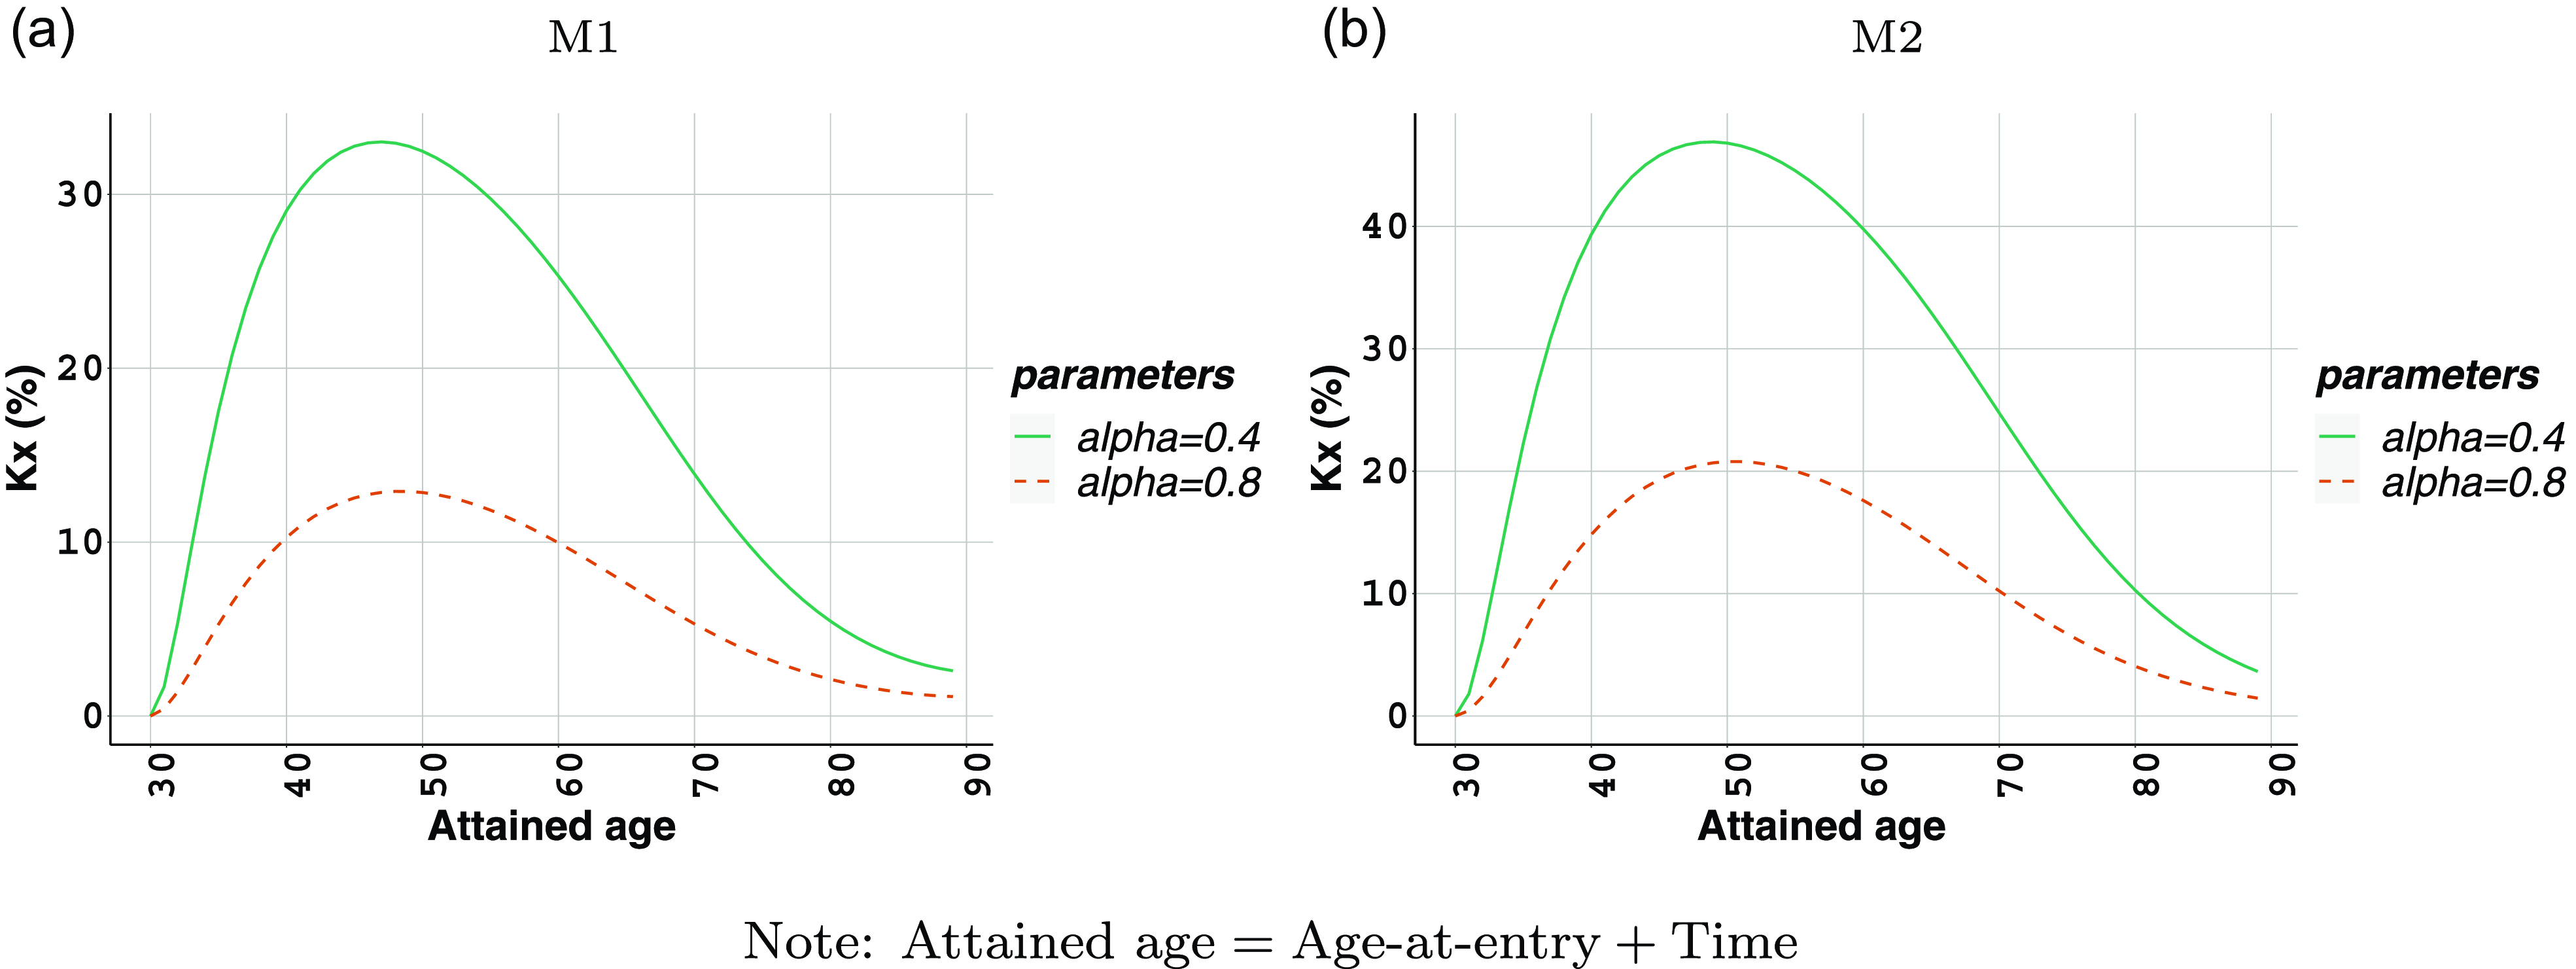


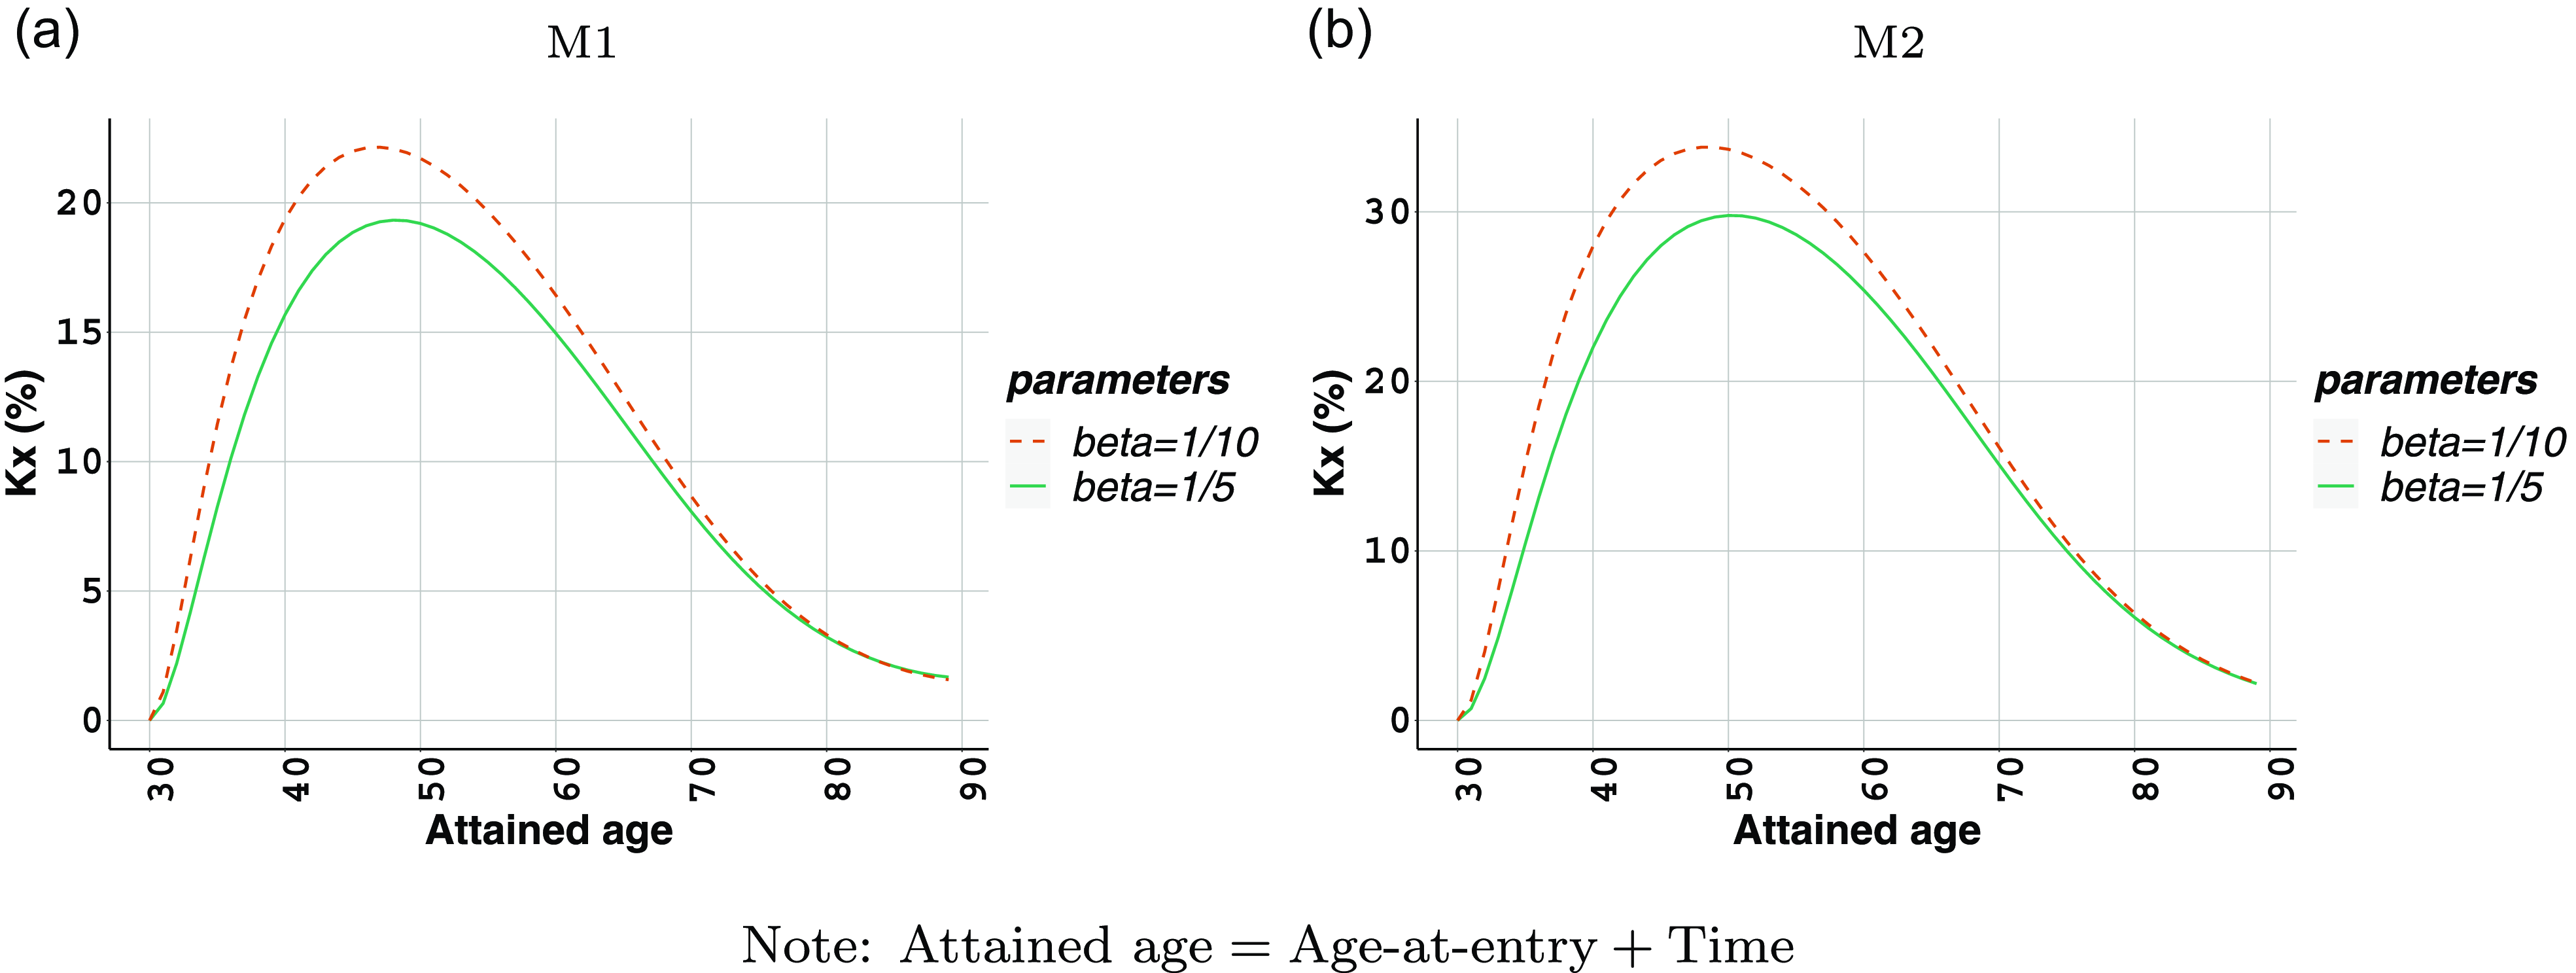


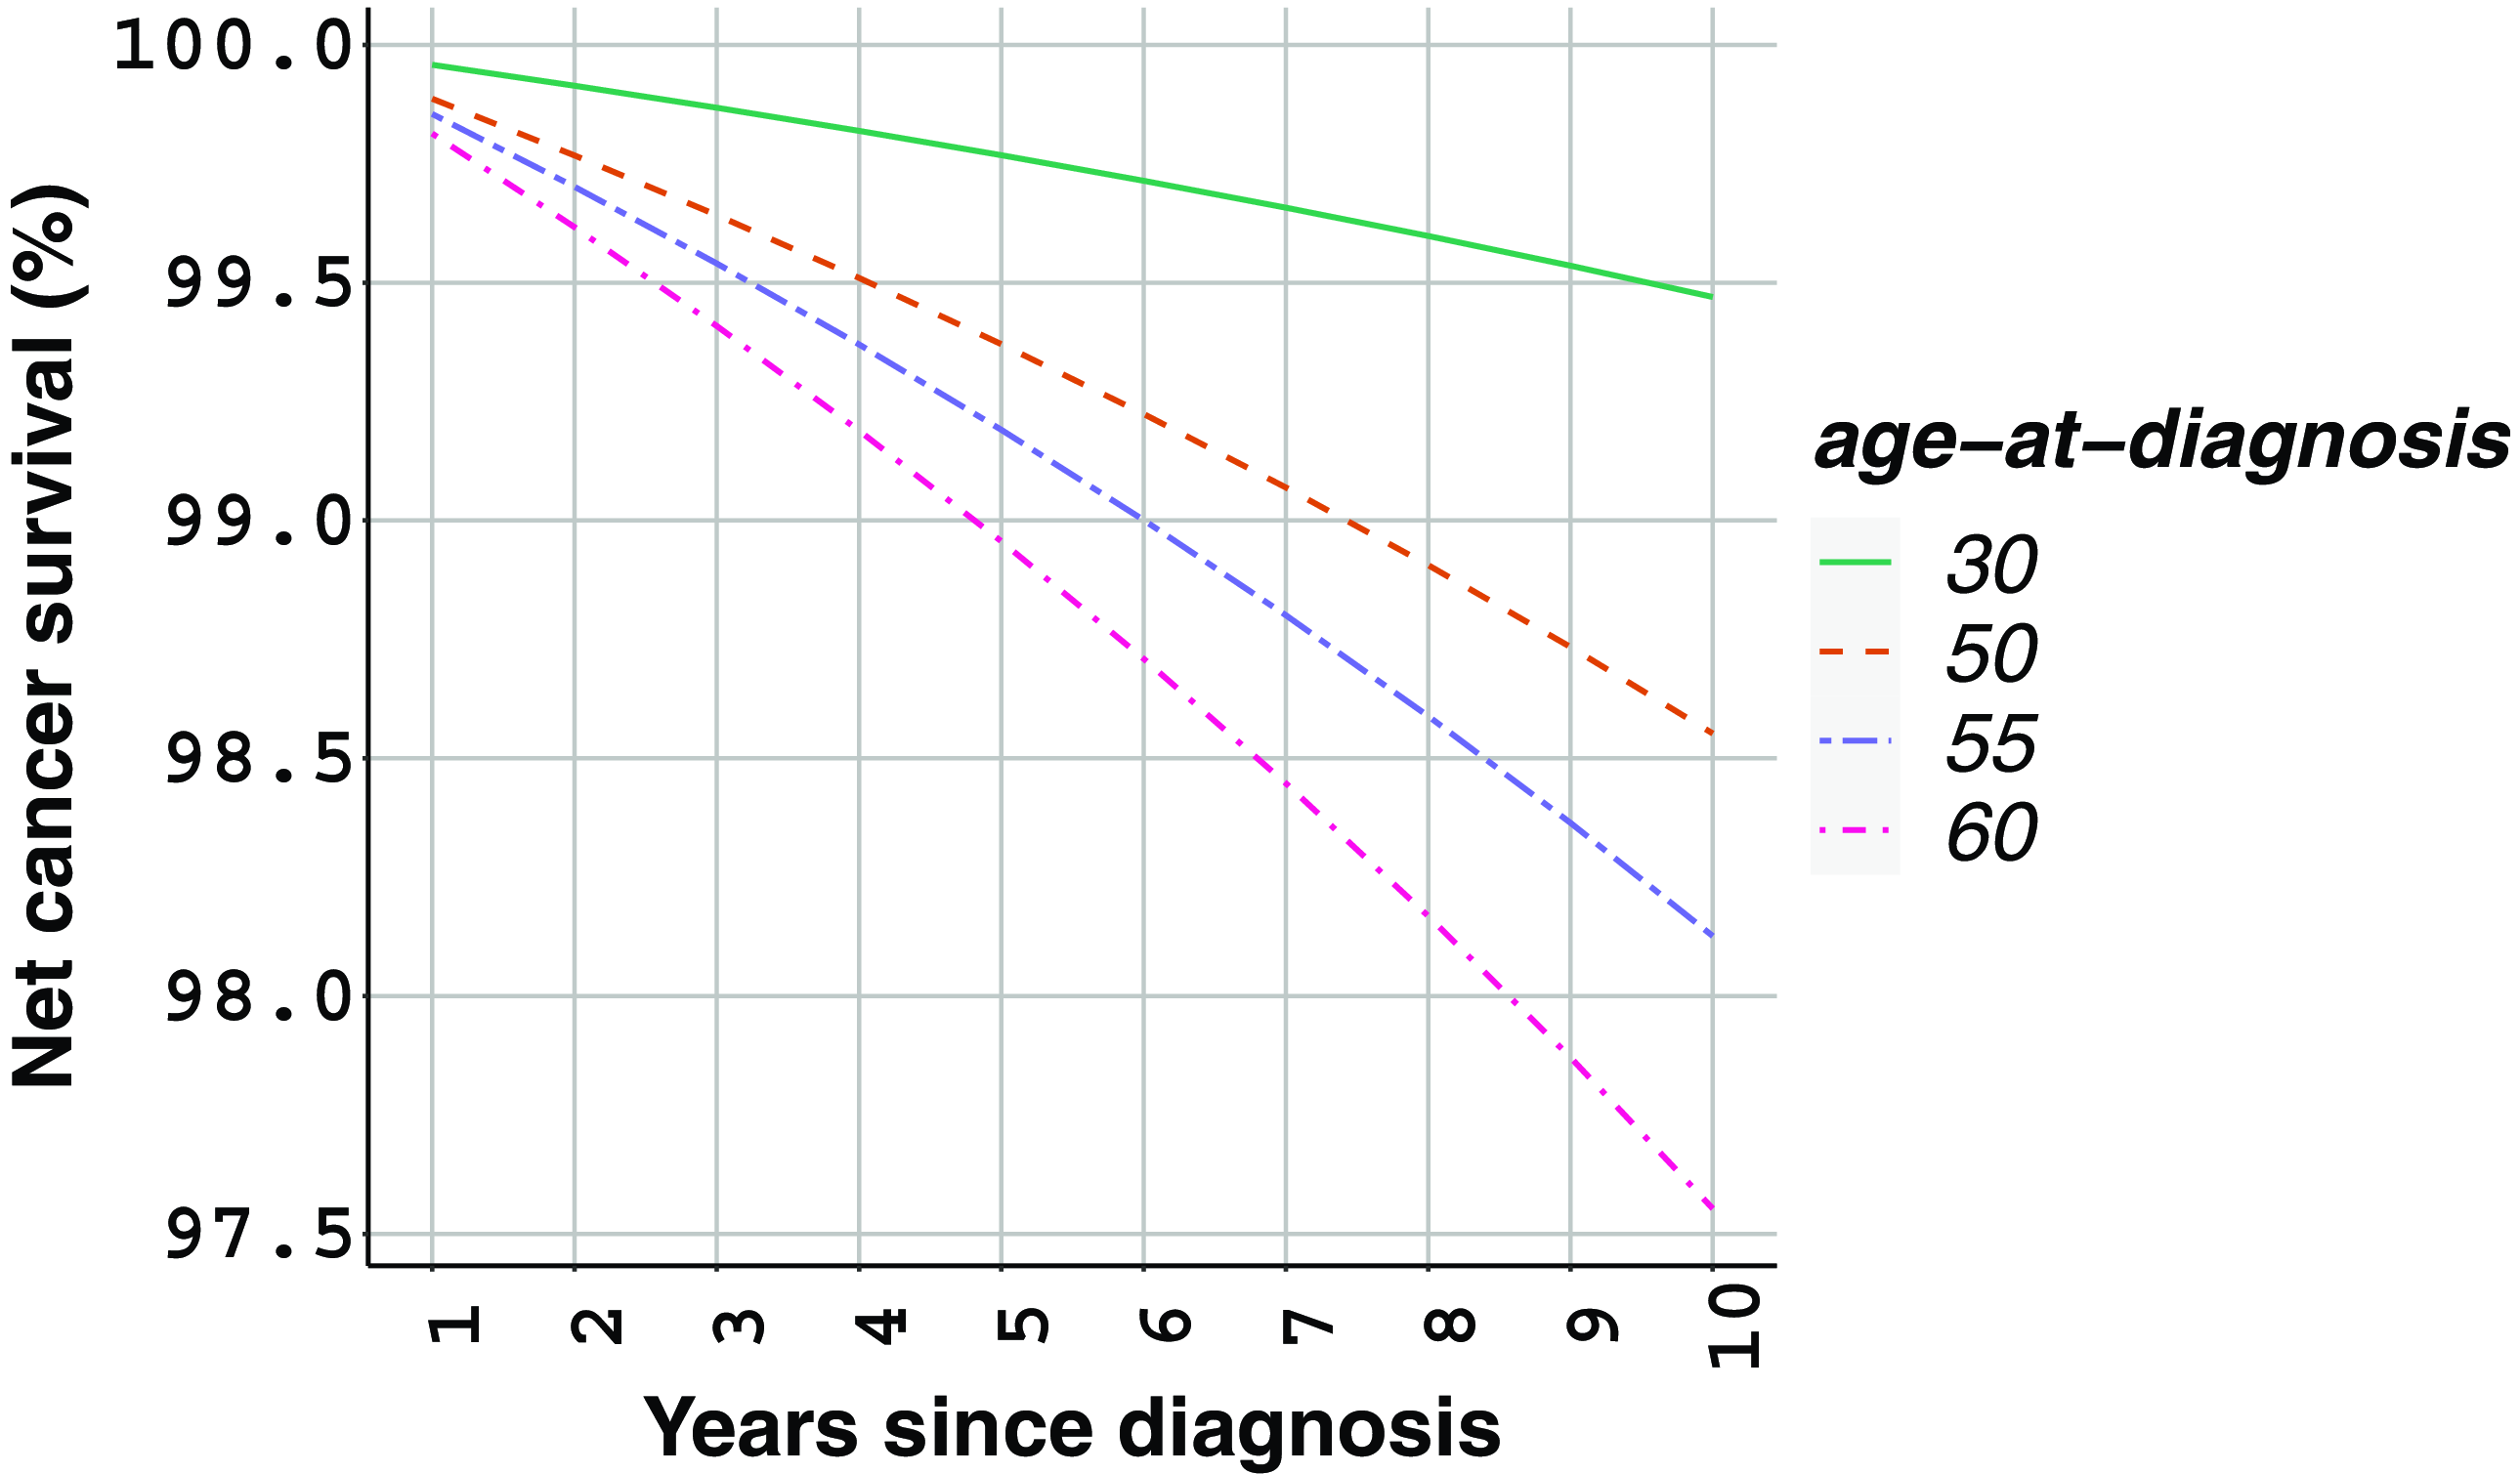
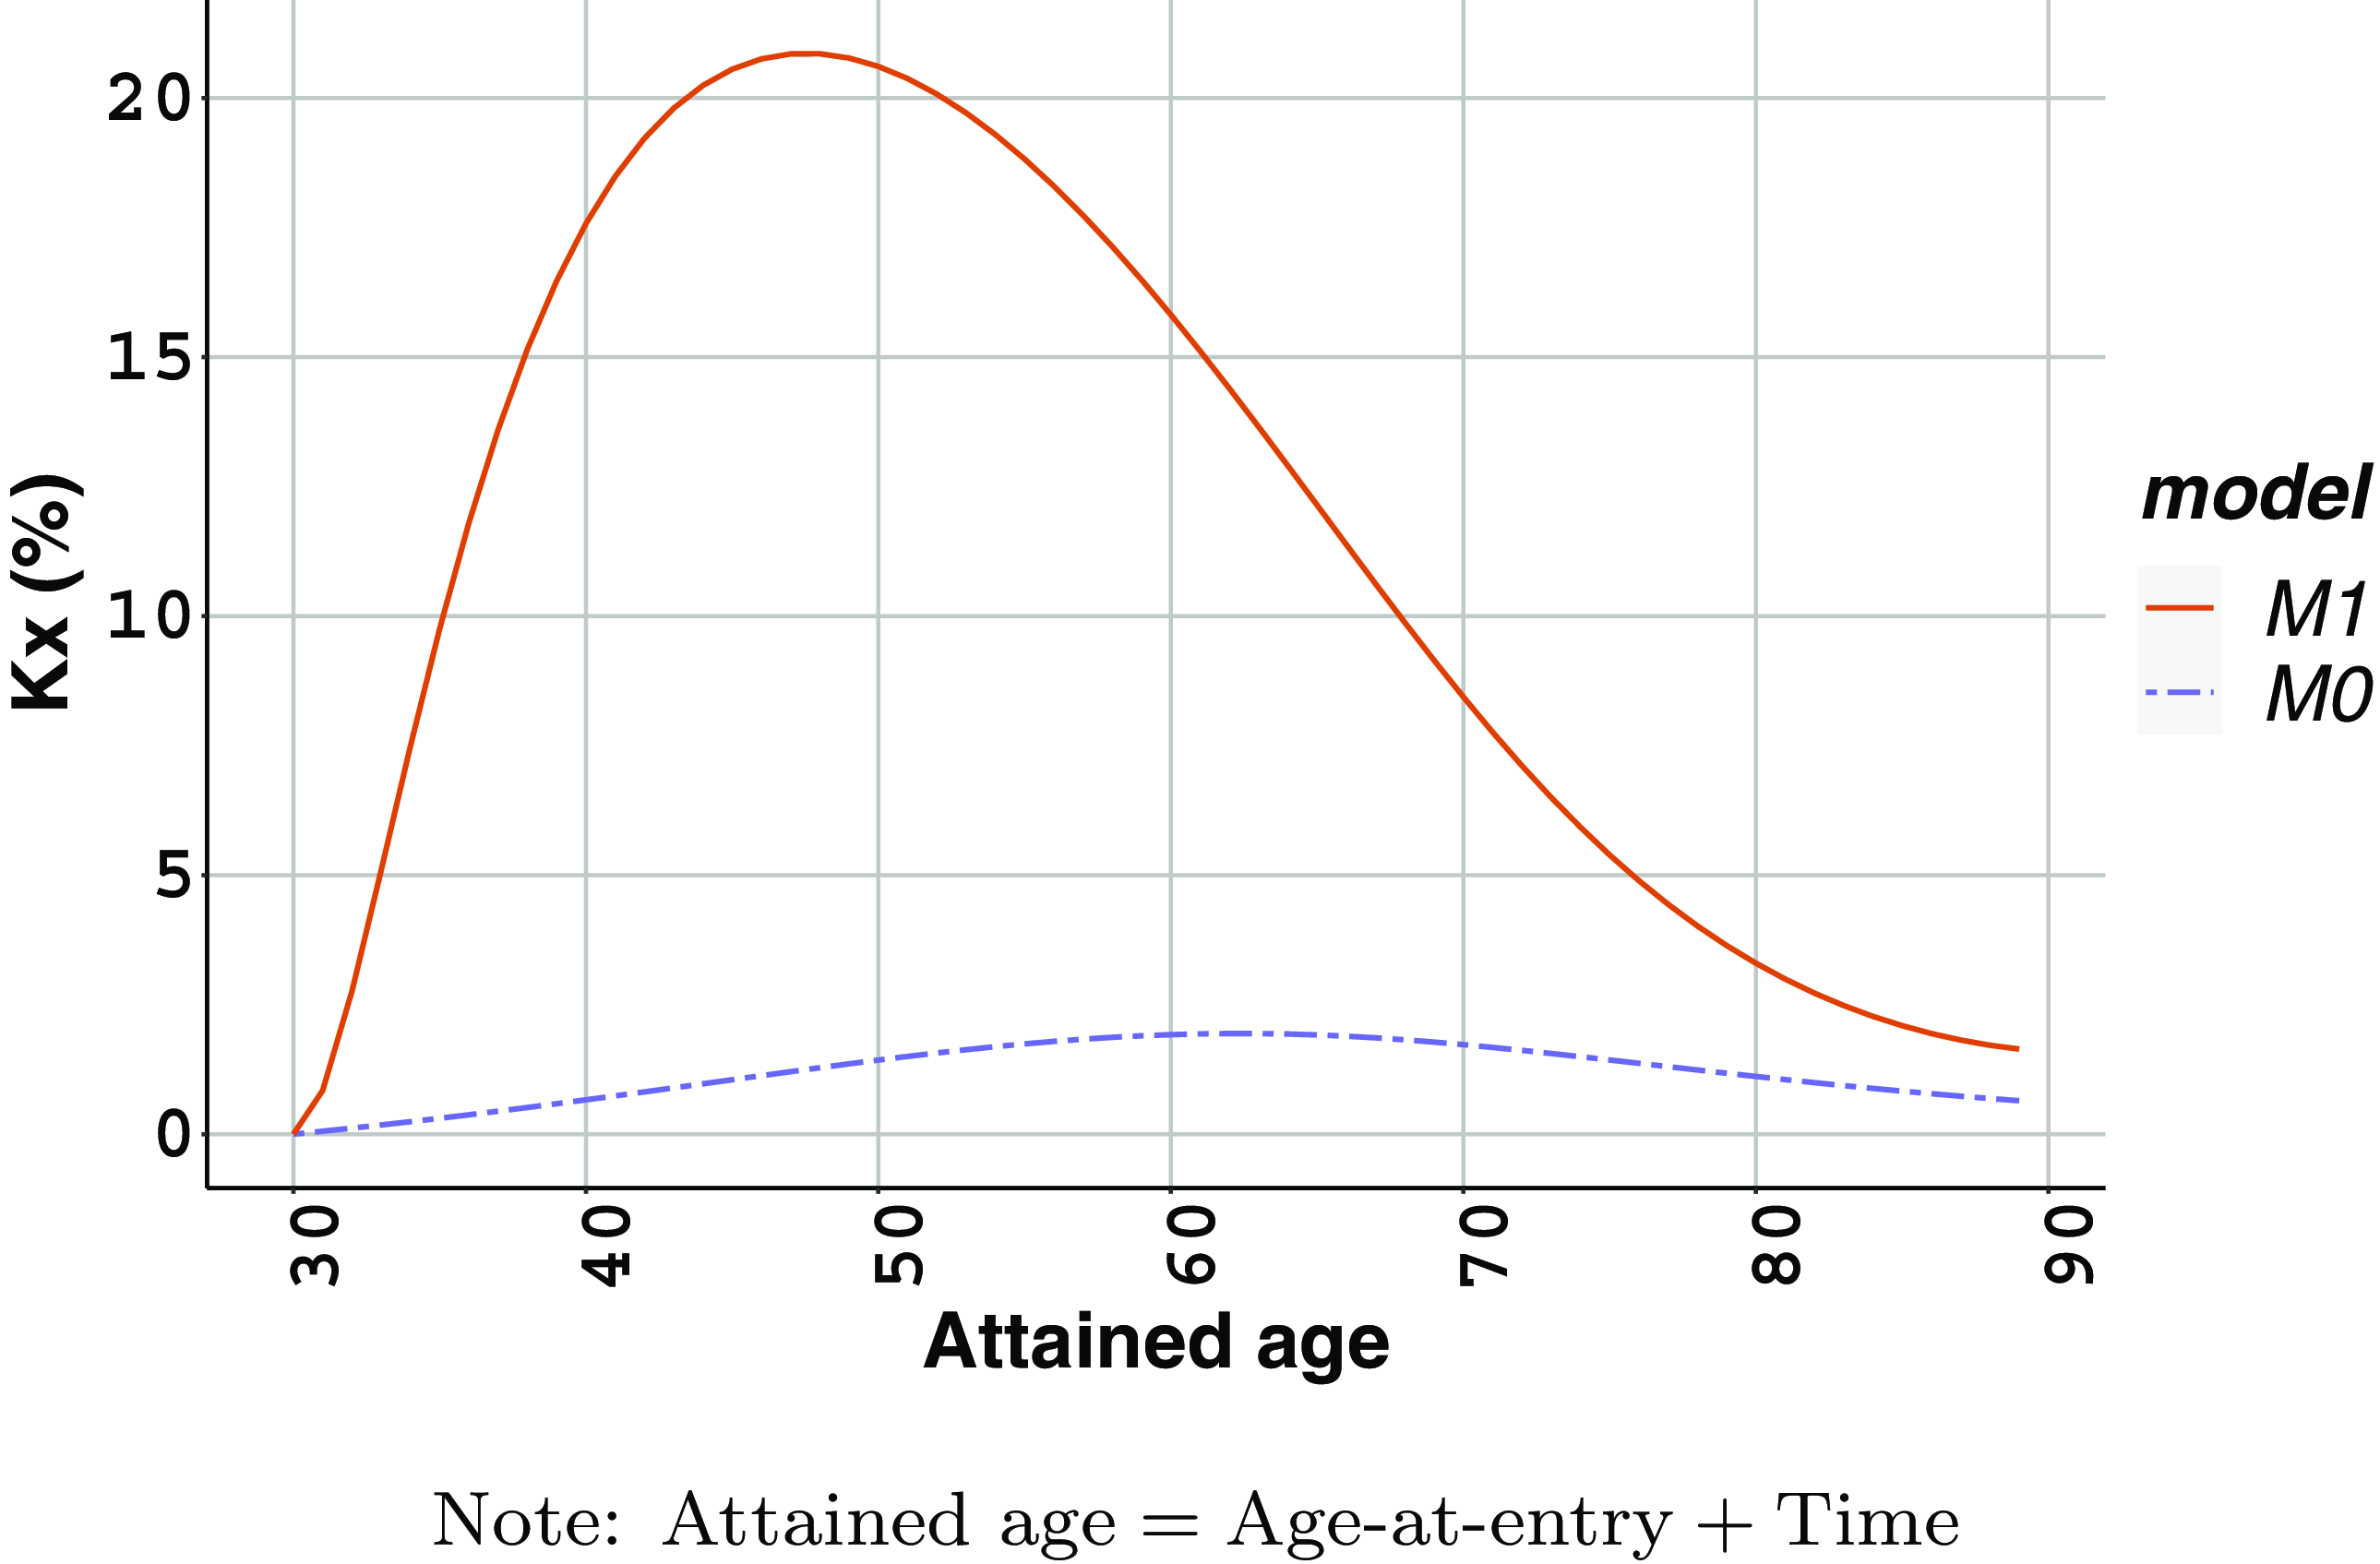


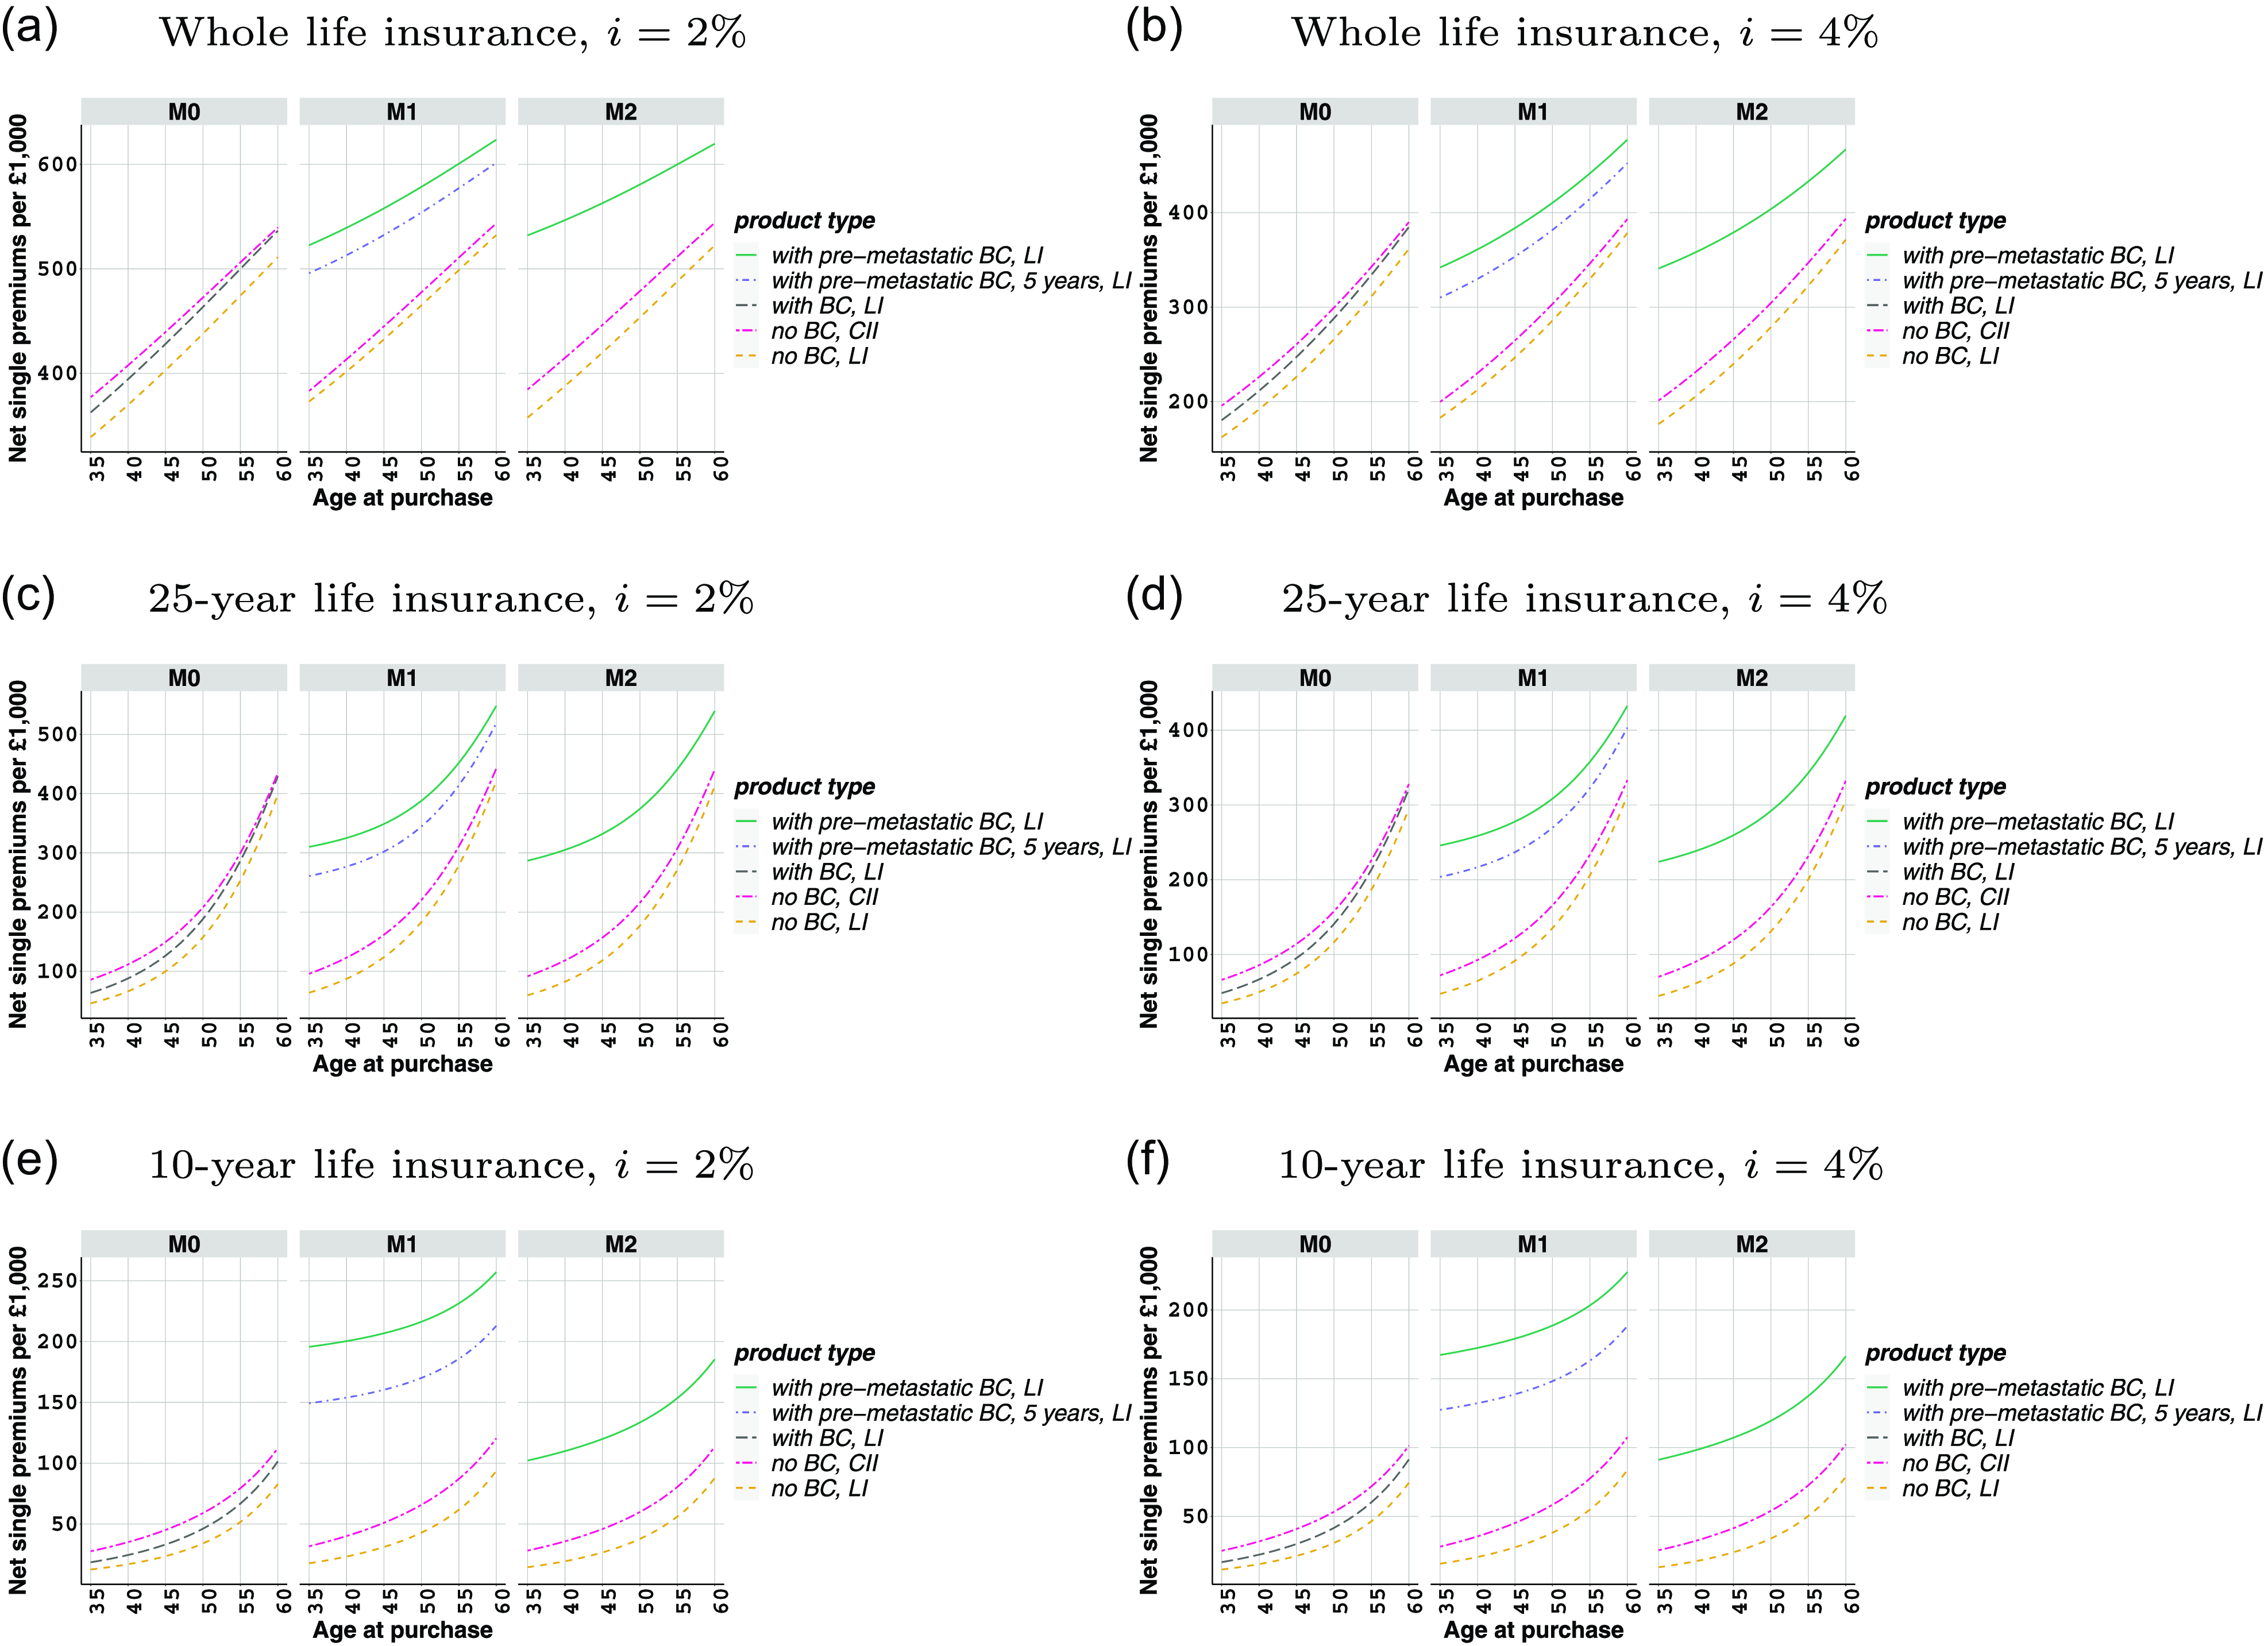


 Open access