


Introduction
Gestational diabetes mellitus (GDM) is an important cause of maternal morbidity and mortality, affecting 9.6% of pregnancies in Canada Reference Nelson, Dzakpasu and Moore1 and 14.0% worldwide. Reference Wang, Li and Chivese2 In addition, fetal exposure to GDM also has long-term consequences over the offspring’s lifetime, notably a higher risk of obesity and metabolic diseases Reference KC, Shakya and Zhang3,Reference Fetita, Sobngwi and Serradas4 , particularly type 2 diabetes. Reference Clausen, Mathiesen and Hansen5,Reference Wicklow, Sellers and Sharma6 Importantly, the HAPO study demonstrated a continuous relationship between offspring outcomes and maternal hyperglycemia during pregnancy, even if below the diagnostic thresholds for GDM. 7 Several mechanisms have been proposed to explain these associations, including altered fetal insulin secretion, placental nutrient transport, chronic low-grade inflammation, and epigenetic programming of metabolic tissues. Reference Mittal, Prasad and Lemos8 However, despite the clear associations between maternal hyperglycemia and diabetes-prone phenotypes in the offspring across the life course, the mechanisms remain unclear.
The hypothalamus is a small brain region that is a key player in maintaining energy balance through glucose metabolism and appetite regulation. Reference Lundqvist, Almby and Abrahamsson9 The arcuate nucleus (ARC), within the anterior hypothalamus, plays a critical role in the regulation of food intake and energy expenditure through its pro-opiomelanocortin (POMC) and neuropeptide Y (NPY) neurons. Reference Timper and Brüning10 Also in the anterior hypothalamus, the ventromedial nucleus (VMN) holds a pivotal role in these axes by integrating endocrine signals from leptin, insulin and glucose. Reference Hirschberg, Sarkar and Teegala11 Various hypothalamic subregions also contribute to central nervous system response to glucagon-like peptide-1 receptor agonists supporting the central role of the hypothalamus in the development and treatment of metabolic pathologies. Reference Kim, Park and Hwang12 Considering the critical role of the hypothalamus in energy regulation, we hypothesized that in utero exposure to maternal hyperglycemia might selectively affect the developing hypothalamus.
In animal models, fetal exposure to hyperglycemia has been associated with an alteration of fetal hypothalamic feeding circuits, notably within the ARC, and decreased hypothalamic leptin sensitivity. Reference Steculorum and Bouret13 However, the potential links between prenatal exposure to hyperglycemia and offspring hypothalamic anatomy or volume are still obscure in humans. To address this gap, we investigated associations between in utero exposure to maternal glycemia and offspring hypothalamic volume assessed via MRI at ages 10–12 years old in a well-characterized mother–child pairs prospective cohort.
Materials and methods
Participants
For this study, we used data from the Genetics of Glucose Regulation in Gestation and Growth prospective cohort (Gen3G), initiated in 2010 within the Université de Sherbrooke-CHUS network. Reference Guillemette, Allard and Lacroix14,Reference Taschereau, Doyon and Arguin15 The participant flow for this study was detailed in Supplementary Figure 1. From January 2010 to June 2013, pregnant women of the Eastern Townships regions of the Province of Quebec, Canada, voluntarily enrolled in this prospective cohort, for a total of 1024 singleton pregnancies. Women were excluded if they had pre-pregnancy diabetes or took drugs influencing glycemia (i.e., insulin, metformin, sulfonylureas, thiazolidinediones). During the pregnancy phase of the study, research staff collected maternal blood samples and questionnaires between 5 and 16 weeks of gestation (V1) and between 24 and 30 weeks of gestation (V2). Those visits were clinically indicated as a part of the standard pregnancy follow-up, thereby minimizing any burden on the participants. With consent, research staff also collected maternal characteristics at enrollment such as maternal age, parity, and self-reported pre-pregnancy weight, as well as delivery mode and complications from the electronic record of the hospital (after delivery). During V2, pregnant women underwent OGTT for gestational diabetes screening. After birth of the index pregnancy, we invited mother-child pairs to complete research visits at 3 (V3y), 5 (V5y) and 12 years (V12y). At V12y, the height and weight of children were measured while fat percentage was assessed by dual-energy x-ray absorptiometry (DEXA). Also, at V12y, research staff offered participants to complete a brain imaging by MRI and an OGTT as part of an optional substudy. The MRI was conducted after the ingestion of glucose and before the measurement of glucose blood level at 30 minutes. As the V12y visits are still ongoing, offspring which underwent MRI up to February 28th 2025 were included in the study. We excluded participants from the imaging substudy if there was any contraindication for MRI, such as having a metallic foreign body.
Measurement of maternal glycemic markers during pregnancy
To quantify in utero glucose exposure, we analyzed HbA1c (at V1 and V2) and the glucose values during the 75g-OGTT, a medical test each mother completed for the screening and diagnosis of GDM between the 24th and the 28th week of gestation (at V2 in our cohort). 16 Maternal blood glucose concentrations were systematically measured (hexokinase method, Roche Diagnostics) at 0 (fasting), 60 and 120 minutes after the ingestion of the 75g glucose load. Subsequently, we computed the area-under-the-curve of glucose of maternal glycemia (AUCgluc) using the trapezoid method, allowing us to combine 0, 60 and 120 minutes post-OGTT plasma glucose levels as one integrated global measure of exposure to maternal hyperglycemia and surrogate for in utero glycemic levels. Reference Floch, Escuyer and Baudin18, Reference Michelsen, Holme and Holm17
MRI procedures
During V12y, Gen3G participating offspring underwent an OGTT after a 12h fast. They were given 1.75g of glucose/kg of weight (for a maximum of 75g) before the MRI. MRI sequences started 5 minutes after glucose ingestion and lasted for the following 25 minutes; this period corresponds to the OGTT phase when blood glucose levels increase rapidly. A research nurse drew blood through the catheter at 0 (fasting), 30, 60 and 120 minutes to measure blood glucose levels (hexokinase method, Roche Diagnostics). Subsequently, we computed the area under the curve for offspring blood glucose using the trapezoid method.
MRI acquisition and measurement of brain structures
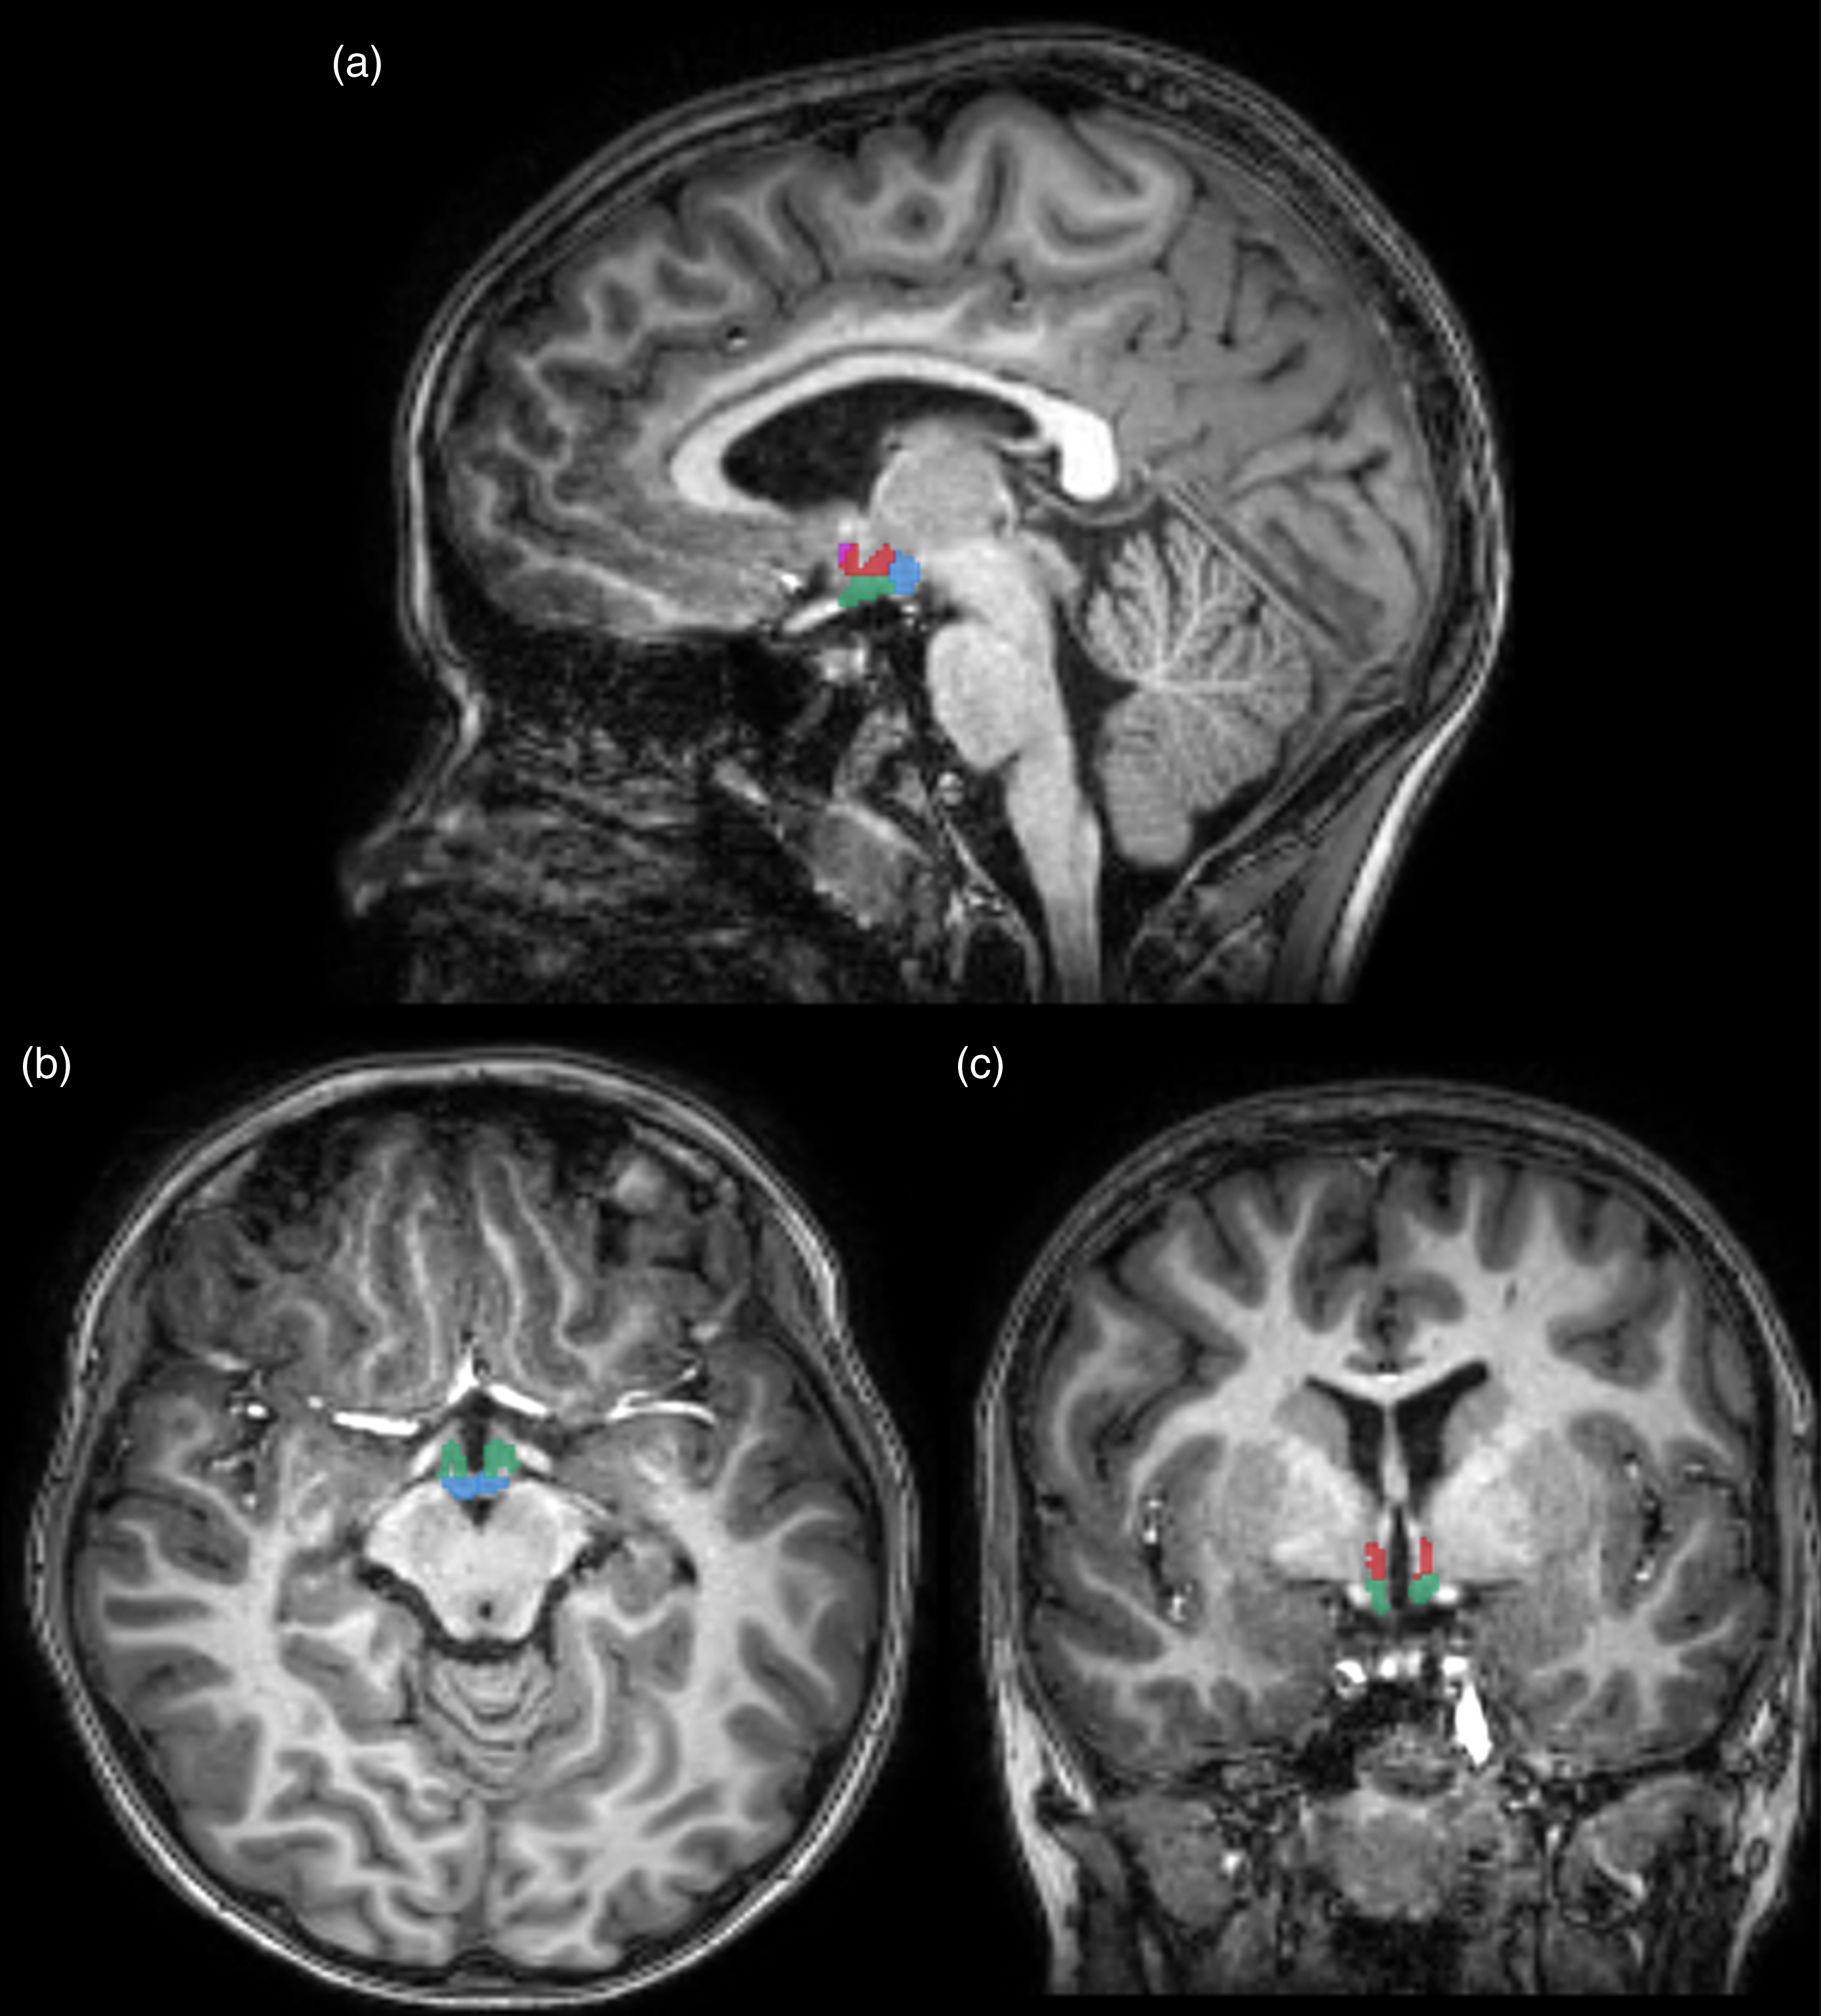
A subset of Gen3G offspring underwent T1-weighted brain MRI as part of the V12y. The Turbo Field Echo T1-weighted images were acquired on a 3 T Ingenia scanner equipped with a 32-channel head-coil (Philips Healthcare, Best, Netherlands). T1-weighted images had an isotropic resolution of 1 mm, an Echo Time of 3.5 ms, a Repetition Time of 7.9 ms, a matrix size of 240 × 240 × 161 mm, a flip angle of 8°, and a time of acquisition of 3:22 min. We processed images using Fastsurfer, an automated brain segmentation tool based on a deep convolutional neural network within FreeSurfer 7, for the whole brain segmentation and the measurement of total intracranial volume (ICV). Reference Henschel, Conjeti and Estrada19 For the segmentation of the hypothalamus, we used another deep convolutional neural network within FreeSurfer 7 and recently validated in children as young as newborn. Reference Billot, Bocchetta and Todd20,Reference Rasmussen, Wang and Graham21 In total, 41 brain regions were segmented on each hemisphere, based on the Desikan-Killiany cortical atlas with the addition of the hypothalamus and other subcortical structures available within Freesurfer. To calculate the volume of the hypothalamus, we combined the volumes obtained for each hemisphere. To preserve statistical power by limiting the number of correlations, brain cortical regions were aggregated by lobes according to the Desikan-Killiany atlas, grouping them by lobes rather than by individual subregions within each lobe. Reference Desikan, Ségonne and Fischl22 To ensure the accuracy of the segmentation results, we conducted a visual inspection that involved overlaying the obtained segmentation onto the original T1-weighted images, assuring a proper alignment between the segmentation and the brain anatomy. This process served as a critical quality assurance measure in assessing the reliability and precision of the segmented hypothalamus structures. In case of misalignment between the automatic segmentation and the original MRI, the mother–child dyad was excluded from the study. Two offspring participants (n = 2) were excluded due to the misalignment between the hypothalamic segmentation from the automated brain segmentation tool and the original MRI.
Ethics approval
CHUS Ethics Reviews Board for Studies with Humans
Consent
Informed consent was obtained from parents or legal guardians, and assent was obtained from children when appropriate.
Data and statistical analysis
We used mean and standard deviation for continuous variables, and proportion for categorical variables to present descriptive characteristics of mothers and offspring included in the current analyses. We assessed the normality of variables by visual inspection and Q-Q plot. We compared baseline characteristics between participants part of the current report (with valid MRI imaging) and other Gen3G participants (non-included in this report) through Chi-squared test for categorical variables and Student T test and Mann–Whitney U test for continuous variables (Supp Table 1). To assess the correlations between maternal glycemic excursion during pregnancy OGTT and offspring hypothalamus (primary hypothesis) and 18 other brain regions (comparative analyses) volumes at ages 10–12, we computed Pearson correlation coefficients between the maternal AUCgluc (primary exposure) and individual offspring MRI segmentation volumes. We also computed the Pearson correlations of hypothalamic volumes with fasting, 1h and 2h post-OGTT maternal plasma glucose (all at V2) and HbA1c levels at V1 and V2. We conducted partial correlation analyses with adjustment for maternal variables (pre-pregnancy BMI, age at V1 and educational attainment) or offsprings’ variables (intracranial volume, age at V12y and gestational age at birth). We selected variables based on a priori knowledge of potential confounders of tested associations, and precision variables related to brain volumes (Supp Fig 1). We conducted a sensitivity analysis excluding offspring who had neonatal hypoglycemia. For our primary analyses, we considered P < 0.05 as statistically significant. We conducted all statistical analyses in R.
Resource availability
The hypothalamus segmentation tool can be accessed at the following link: https://surfer.nmr.mgh.harvard.edu/fswiki/HypothalamicSubunits.
Data availability
Gen3G has a sample and data access policy. For further information, LB can be contacted.
Results
Characteristics of participants
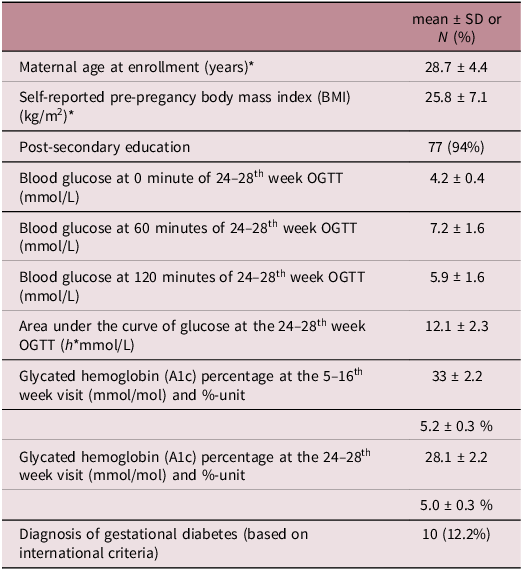
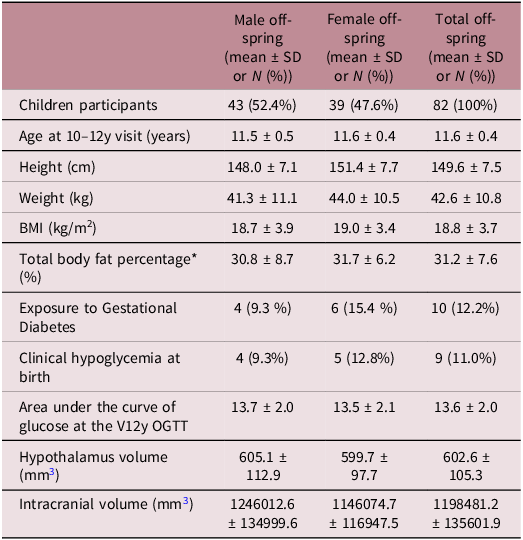
This study included data from 82 mother–child dyads. We presented demographic characteristics for the mothers and the offspring in Tables 1 and 2, respectively. Mothers were on average 28.7 (SD = 4.4; n = 82) years old at the time of pregnancy and offspring were 11.6 (SD = 0.4; n = 82) years old at the time of the MRI assessment. Among the ten women (8.2%) that were diagnosed with gestational diabetes, none of them required pharmacological treatment. Participants who underwent MRI imaging (n = 82) and Gen3G participants not included in current report (n = 942) did not differ substantially in baseline maternal demographic or clinical characteristics (Supplementary Table 1). We also show charactiristics of participants according the GDM status (Supplementary Table 3).
Demographic and clinical characteristics of mothers included in current analyses (n = 82)

* Data collected at V1
Demographic and clinical characteristics of offspring participants at MRI assessment

* Value calculated with DEXA
Children’s hypothalamus volumes in relation to maternal AUCgluc during OGTT at 24th to 28th week of gestation
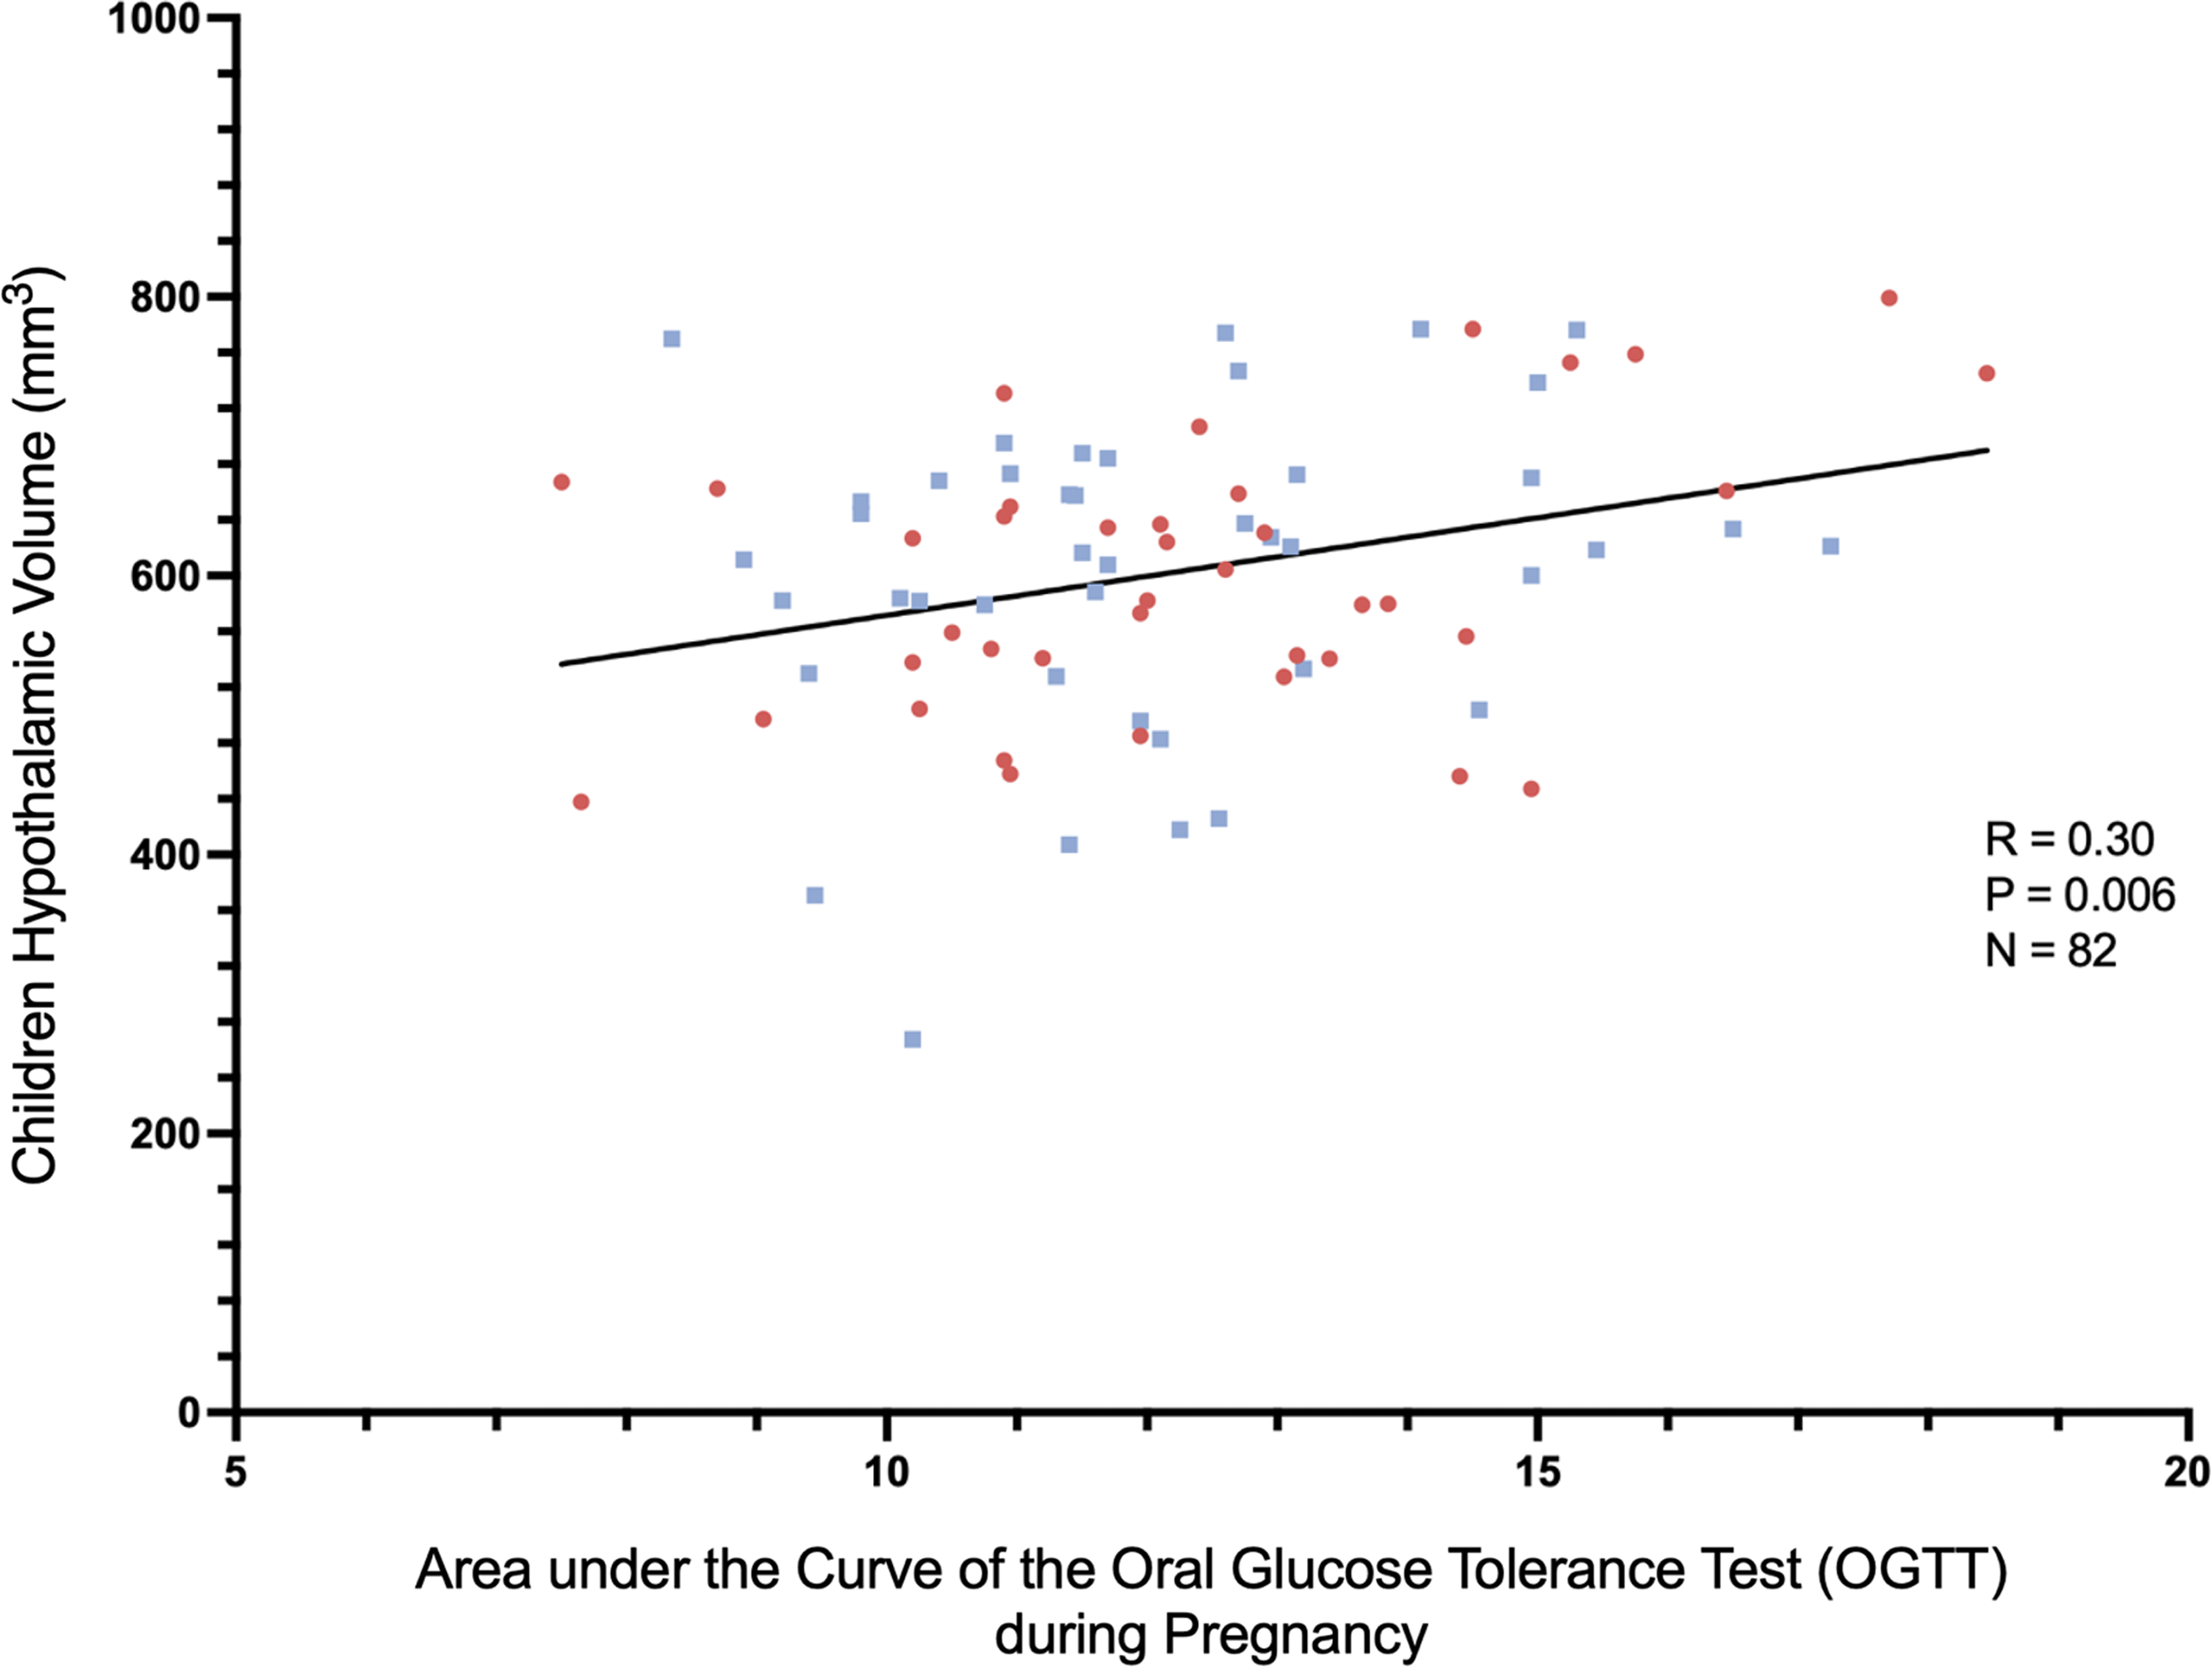
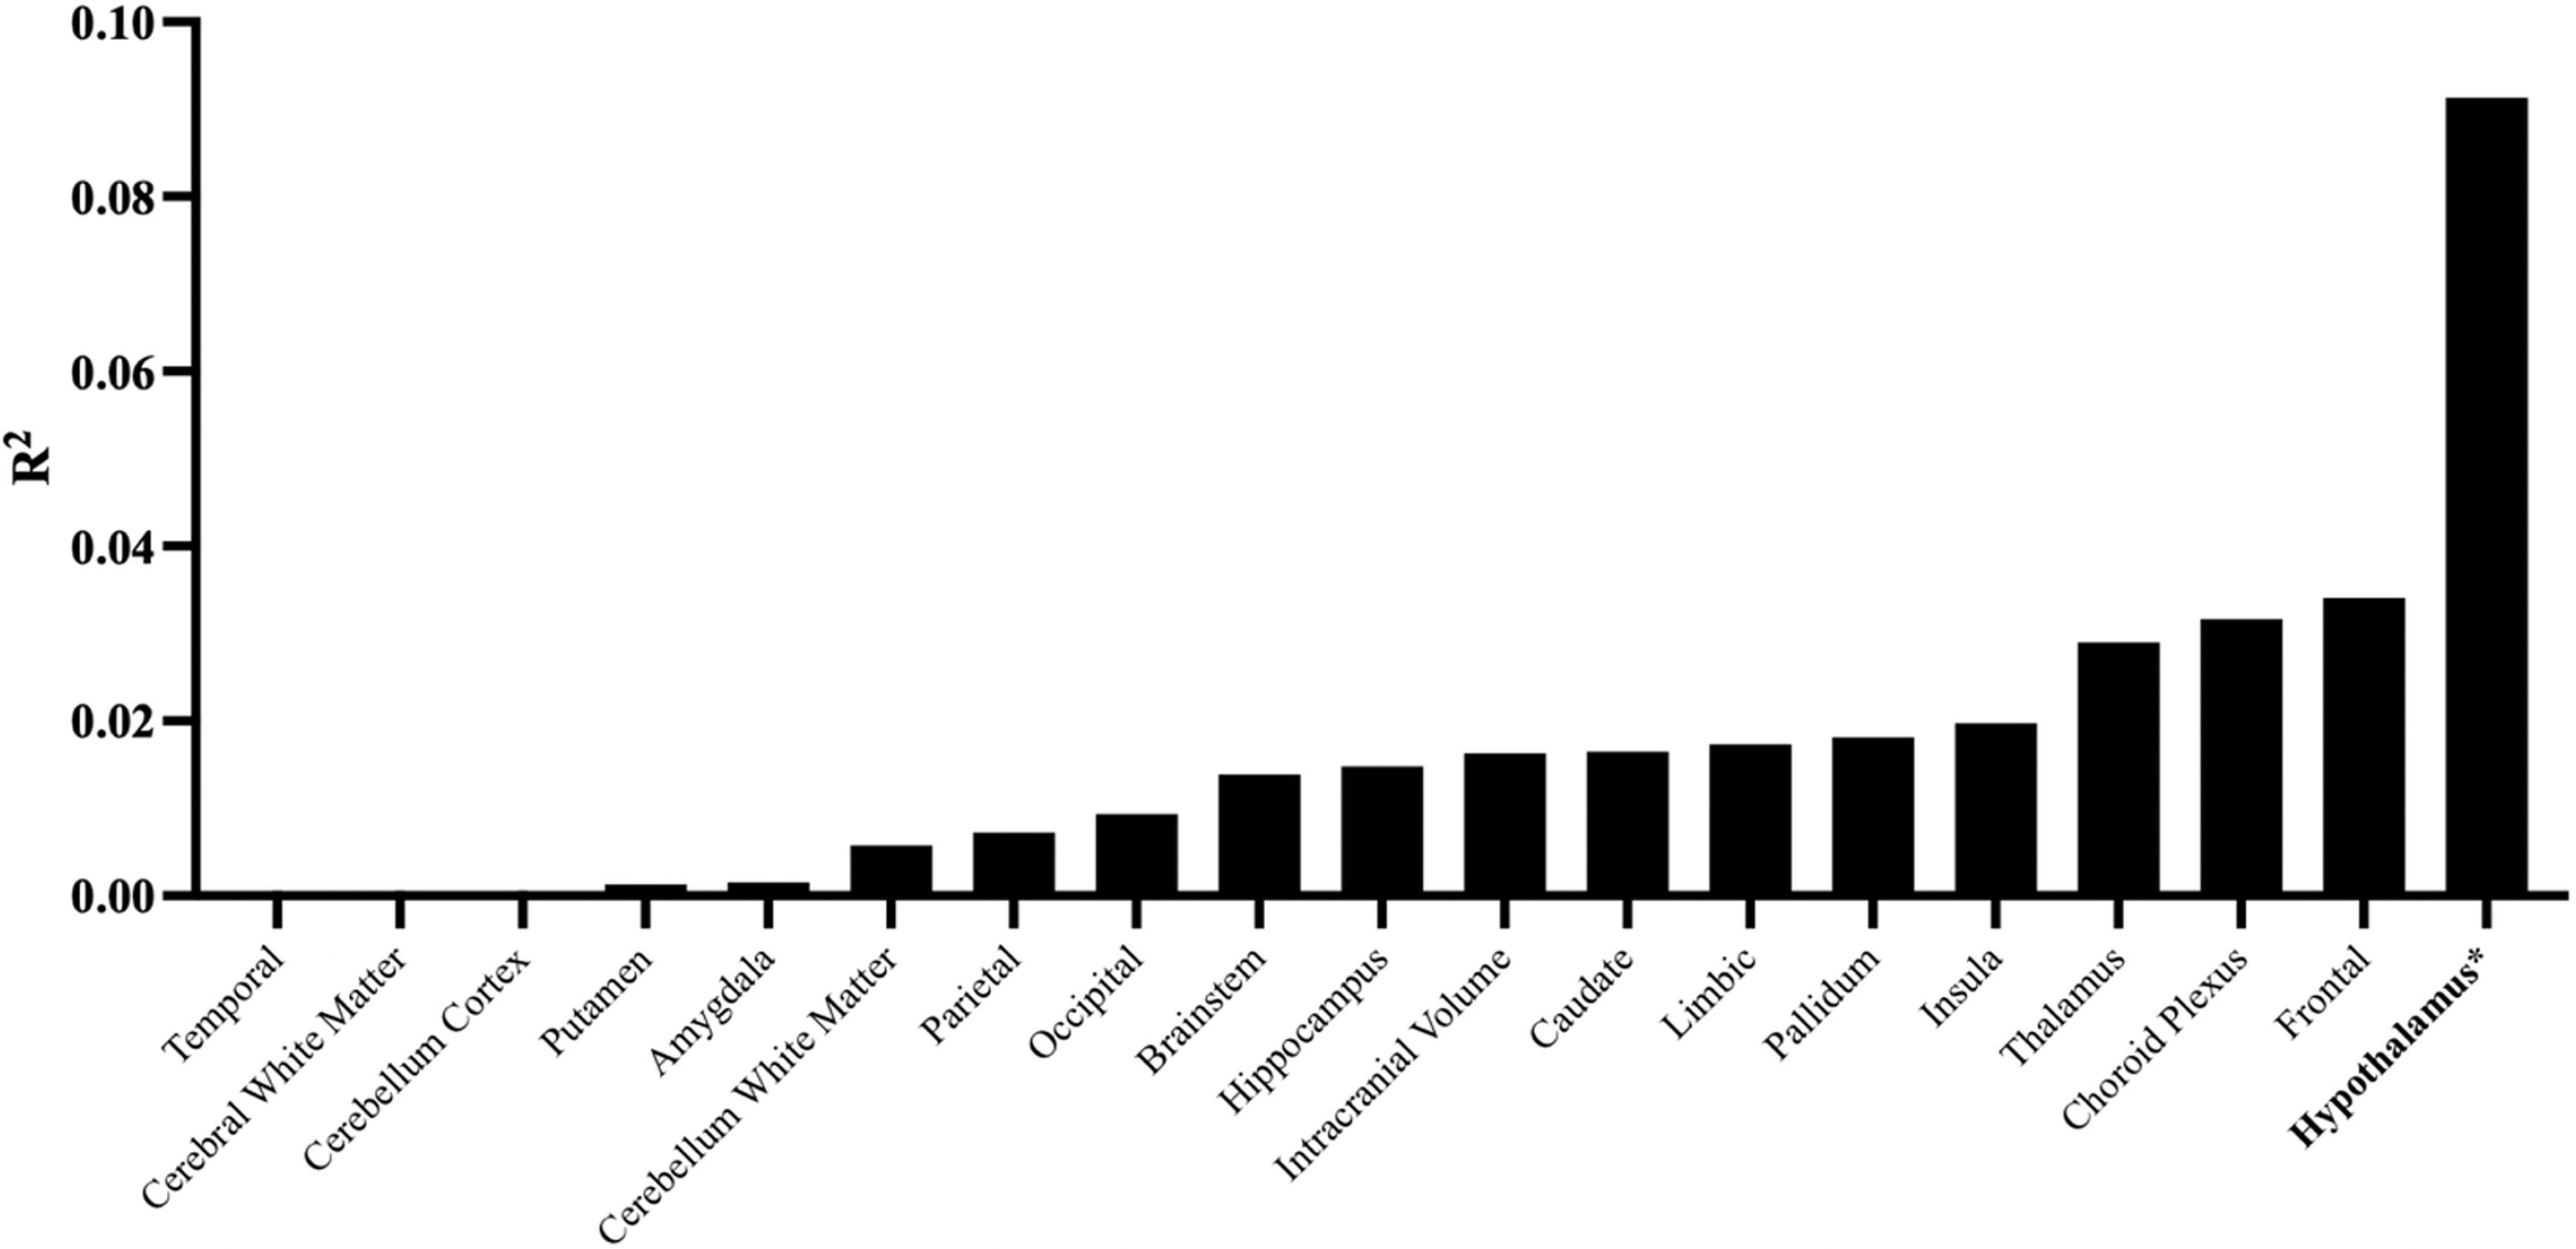
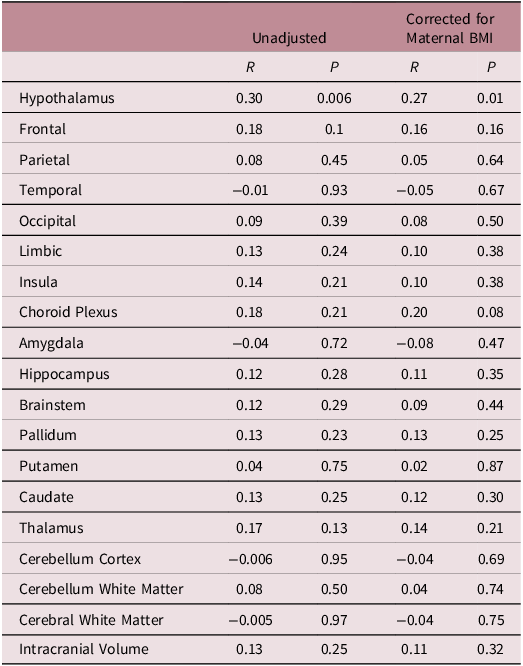
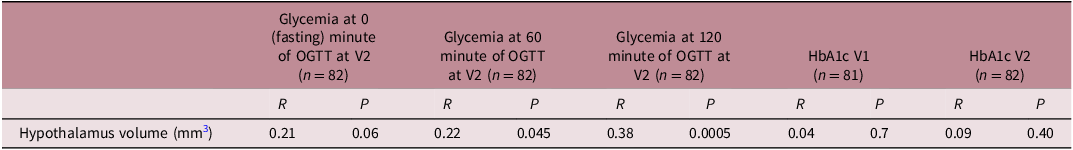
Pearson correlation coefficients between maternal glycemia AUCgluc during the second trimester 75g-OGTT and offspring regional brain volumes are shown in Fig. 2. Higher maternal AUCgluc was associated with larger offspring total hypothalamus volume at 10–12 years of age (r = 0.30; p = 0.006; n = 82). Corresponding correlations with other brain regions, adjusted or not for maternal pre-pregnancy BMI, were not statistically significant (Fig. 3 and Table 3, all p > 0.05). The correlations between AUCgluc and the offspring’s hypothalamic volume remain positive and significant when adjusted for both maternal (r = 0.29; p = 0.008) or offsprings covariables (r = 0.31; p = 0.004), similar to unadjusted correlation. The significant correlation was maintained even when excluding children who suffered hypoglycemia at birth (unadjusted r = 0.33; p = 0.004; n = 73). Both the right (r = 0.26; p = 0.02; n = 82) and the left (r = 0.30; p = 0.006; n = 82) hypothalamus showed significant correlations (unadjusted). Offspring hypothalamus volume was also positively correlated to maternal 60 minutes (r = 0.22, p = 0.046, n = 82) and 120 minutes (r = 0.38, p = 0.0005, n = 82) glucose concentrations during the OGTT in pregnancy, in line with the association with AUCgluc (Table 4). On the other hand, offspring own glycemia, quantified as the child AUCgluc during the OGTT at V12y was not correlated to hypothalamic volume (r = −0.01; p = 0.93; n = 67) in cross-sectional analyses. When stratifying offspring participants by sex at birth, we observed a correlation between the maternal AUCgluc and the total hypothalamic volume for the female offspring participants (r = 0.41, p = 0.01, n = 39), which appeared to be more pronounced than in male participants (r = 0.21, p = 0.17, n = 43) (Fig. 2). However, when we tested the interaction by sex, it did not reach statistical significance (p = 0.60)
Example of automatically segmented hypothalamus in (a) sagittal, (b) axial and (c) coronal views. Pink circle = Anterior superior. Orange circle = Anterior inferior. Red circle = Tubular Superior. Green circle = Tubular Inferior. Blue circle = Posterior.

Offspring Hypothalamic Volume as a Function of Maternal Glycemia Measured by OGTT During Pregnancy. Red dot = Female. Blue dot = Male. Black line = Simple Linear Regression.

Squared Pearson Correlation Coefficients Between Brain Volumes and Maternal Glucose Tolerance Measured by OGTT During Prgnancy. **P < 0.05.

Pearson correlations between brain volumes and AUC of maternal glycemia measured by OGTT during pregnancy

Pearson correlations between hypothalamic volume and individual maternal glycemia measured during pregnancy OGTT

Discussion
Our results demonstrated a significant association between in utero exposure to higher maternal glucose levels measured between 24th and 28th weeks of gestation and larger hypothalamic volume in offspring at 10–12 years of age. No significant correlations were observed in any other brain regions, suggesting a unique sensitivity of the developing hypothalamus to maternal blood glucose exposure in our cohort.
The hypothalamus: A key sensor of glucose levels
Across the encephalon, glucose-sensing neurons have mostly been identified in the hypothalamus. Reference Stanley, Moheet and Seaquist23 Many hypothalamic neurons directly detect glucose concentration and are divided as glucose-excited, prevalent in the arcuate nucleus (ARC) and paraventricular nucleus (PVN), and glucose-inhibited, present in the ARC and VMH. POMC neurons are a well-known example of glucose-excited neurons. Various hypothalamic regions, notably the ARC with its NPY and agouti-related peptide (AgRP) neurons, have been recently proposed to participate in the central mechanisms of action of glucagon-like peptide-1 (GLP-1) receptor agonists. Reference Kim, Park and Hwang12 During pregnancy, maternal glucose crosses the placenta through facilitated diffusion helped by specific glucose transporters, mainly GLUT1, following the maternal-fetal glucose concentration gradient, to support fetal growth and development. Reference Floch, Escuyer and Baudin18 As fetal glycemia is strongly correlated to that of mother, Reference Bozzetti, Ferrari and Marconi24 maternal hyperglycemia leads to hyperglycemic fetal environment. It is therefore biologically plausible that the in utero hyperglycemic environment could specifically influence the developing hypothalamus, as our findings suggest. Chronologically, hypothalamic nuclei experience differentiation right before the end of the second trimester of pregnancy, when maternal insulin resistance rises and GDM is often detected. Indeed, the PVN and the ARC reached their postnatal morphology and topography by weeks 18 and 26, respectively. Reference Koutcherov, Mai and Ashwell25 Those regions are known to host neuron population sensible to glucose variation, notably the NPY neurons. Reference Stanley, Moheet and Seaquist23 Therefore, the chronological aspect of the hypothalamic development support our hypothesis.
Our findings in context of prior studies
GDM appears to be linked to volume of certain regional volumes in offspring adolescents, but none to our knowledge have addressed directly association with the hypothalamus. Reference Nivins and Klingberg26 Recent studies have suggested that in utero exposure to GDM is associated with elevated T2 MRI signals in offspring hypothalamus, which might be explained by gliosis and inflammation in the glia. Reference Chandrasekaran, Melhorn and Olerich27,Reference Olerich, Sewaybricker and Kee28 It is therefore plausible that the variation of volume associated with in utero glucose exposure we observed is the consequence of microglial proliferation in the gray matter, causing the appearance of hypothalamic enlargement in T1-based MRI. Interestingly, hypothalamic gliosis has been proposed to contribute to insulin resistance and type 2 diabetes in adults and rodents. Reference Rosenbaum, Melhorn and Schoen29,Reference Gao, Bielohuby and Fleming30 Other studies indicate that hypothalamic gliosis could also increase the density of AgRP and alpha-melanocyte stimulating hormone (αMSH), expression of NPY neurons and axonal density in the hypothalamic white matter, all pathways that have been associated with food intake regulation and risk of obesity. Reference Steculorum and Bouret13,Reference Rasmussen, Tuulari and Nolvi31 Such observations led some to hypothesize that the higher risk of diabetes development in offspring attributable to GDM exposure could be transmitted through hypothalamic circuits via in utero fetal programming. Reference Steculorum and Bouret13,Reference Plagemann, Harder and Janert32
The hypothalamus and metabolic health
The complex role of the hypothalamus in energy regulation, contributing to metabolic conditions, remains an active area of research. Tools such as the HYPOMAP, addressing the underlying mechanisms on the cellular level, emerge as promising weapons to catalyze such progress. Reference Tadross, Steuernagel and Dowsett33 On the radiological side, human studies already showed that the hypothalamic vascular response to glucose, measured with pulsed arterial spin labeling, predicted the variation in preteens’ BMI in the subsequent year: the greater the hypothalamic response to glucose, the greater the increase in BMI over the subsequent year. Reference Page, Luo and Wang34 Greater vascular hypothalamic response is cross-sectionally associated with obesity in adolescents. Reference Jastreboff, Sinha and Arora35 Similarly, some cross-sectional results suggest a positive relationship between the hypothalamus volume and BMI in adults, and that relationship seemed to be mainly driven by volume from hypothalamic regions containing nuclei responsible for glucose homeostasis, such as the ARC and the PVN. Reference Brown, Westwater and Seidlitz36 These prior reports, together with our findings, suggest a biologically plausible role for the hypothalamus in the fetal programming hypothesis, whereby in utero hyperglycemic exposure may induce lasting neurodevelopmental changes. The observed variation in hypothalamic volume could, if hypothalamic structure is indeed related to later metabolic health, represent one of the potential pathways linking prenatal hyperglycemia to an increased risk of metabolic disorders later in life. Moreover, given our observation that hypothalamic volume variation is associated with maternal glycemia below the currently recognized pathological threshold of GDM, this raises important questions about how these thresholds are defined and highlights the need to consider long-term offspring metabolic and neurodevelopmental well-being. Further studies are warranted to determine whether hypothalamic volume reflect functional central regulation of food intake and associated with later risk of obesity and type 2 diabetes in offspring.
Strengths and limitations
The main strength of this study is the inclusion of women with large spectrum of blood glucose values during the OGTT, including some diagnosed with GDM. It thus demonstrates that maternal hyperglycemia along the whole spectrum of glycemia may have long-term implications on the offspring’s neuroendocrine development. Additionally, by comparing the associations of intrauterine glucose exposure on hypothalamic volumes versus other brain volumes, our results demonstrate the specificity of the developing hypothalamic sensitivity to in utero hyperglycemia exposure. However, this anatomical study does not directly address the underlying functional mechanisms. Free-water analysis from diffusion MRI could be performed to clarify the microstructural changes and address the inflammatory-based hypothesis. Reference Pasternak, Shenton and Westin37,Reference Kullmann, Abbas and Machann38 Although the OGTT is not recognized as a modulator of global brain vascular flow in MRI studies, the possibility of an alteration in the MRI anatomical sequences, particularly within the hypothalamic region, during an OGTT cannot be entirely dismissed. Reference Carter, Ward and Al-Subu39 Furthermore, although the number of participants was appreciable by imaging standards, it limited some of our analyses (adjustment for multiple confounders, exploratory sex-stratified analyses).
Conclusion
Our findings reveal that intrauterine hyperglycemic environment, quantified by the maternal AUC glucose over the course of a 75g-OGTT during pregnancy, was significantly and specifically associated with larger hypothalamic volume in offspring at 10–12 years of age. Remarkably, no other brain regions demonstrated such a correlation with intrauterine hyperglycemia. Our study adds insights on the unique role of maternal health during pregnancy in shaping the developing central nervous system and potentially influencing the metabolic health of offspring on the long term. Moreover, our results reiterate the importance of delving into the various impacts of glucose conditions during in utero development to continue the ongoing efforts to combat the burden of metabolic diseases in future generations.
Supplementary material
To view supplementary material for this article, please visit https://doi.org/10.1017/S204017442510041X.
Author contribution
C.M. performed the data collection and statistical analysis, contributed to the image analysis, and wrote the manuscript. M.A., M.D and S.C. contributed to data collection and the revision of the manuscript. J.H. contributed to the image analysis and the revision of the manuscript. A.M. and V.G. revised the manuscript. P.P., M.-F.H., L.B. and K.W. conceived the study design, supervised all steps of the study, and participated in manuscript writing and revision. All authors have read and agreed to the published version of the manuscript.
Funding statement
Gen3G was initially supported by a Fonds de recherche du Québec – Santé operating grant (to M-.F.H., grant no. d), Canadian Institute of Health Research (CIHR) operating grants (to M.-F.H., grant no. MOP 115071, and to L.B., grants no. PJT-152989 and PJT-190076) and a Diabète Québec grant (PP). V.G. and A.M. are junior research scholars from the Fonds de recherche du Québec – Santé. M-.F.H. was a recipient of an American Diabetes Association Pathways To Stop Diabetes Accelerator Award (grant no. 1-15-ACE-26). We also want to thank participants and radiology technicians for their participation in the project.
Competing interests
All authors report no relevant disclosures.
Ethics standard
The authors assert that all procedures contributing to this work comply with the ethical standards of the Tri-Council Policy Statement: Ethical Conduct for Research Involving Humans (TCPS 2) and with the Helsinki Declaration of 1975, as revised in 2008, and have been approved by the institutional committees (Comité d’éthique de la recherche du CIUSSS de l’Estrie – CHUS).


 Open access