

Background
As a practicing bioscience researcher (my lab studies metabolism in heart attack), my interest in scientific misconduct stems from a desire to compete on a level playing field. A more detailed narrative of my activities as a scientific sleuth is available elsewhere.Reference Brookes, Biagioli and Lippman 1 In brief summary: I discovered manipulated images in a grant application in 2011 and then found problem images in papers from the grant’s author. I reported these findings to the US Federal Office of Research Integrity (ORI) and the individual in question was found guilty of misconduct. At this time, several blogs had begun reporting on problematic papers 2 including papers from Bharat Aggarwal of MD Anderson Cancer Center. I dug into Aggarwal’s papers and identified over 140 problem images across 75 papers, reporting them to ORI.
In 2012 I launched the blog www.science-fraud.org, which sometimes used obnoxious language in reporting problem papers. Legal threats forced closure of the site in 2013, but this yielded an interesting data set — comparing the fate of 274 papers blogged about with a further 220 papers waiting in the blog pipeline. Subsequent analysis of the blogged vs. un-blogged papers revealed the former were subject to correction or retraction seven-fold more than the latter.Reference Brookes 3 As recently as 2021 the blogged papers were still four-fold more likely to have been acted on, suggesting public exposure of problems may be associated with enhanced corrective actions. Despite this finding, it is notable that today 31 of the papers from Bharat Aggarwal that I reported remain without any editorial action (retraction, erratum, expression of concern). This situation highlights ongoing issues in how institutions and publishers handle reported problems.
Following considerable personal expenditure to resolve legal threats arising from the blog (my university considered such activities outside of my faculty role), since 2013 I have continued to discover and report on problems in thousands of papers, resulting in hundreds of retractions and corrections, and some notable falls from grace. Here is how it’s done.
Discovery
Hardware & Software
A PC or Mac computer with a large monitor (>27”) is essential for image analysis. A useful secondary tool is an older LCD-type screen (not a modern OLED screen — see section 2.4). For software, Adobe Acrobat, Microsoft PowerPoint, Adobe Photoshop, and NIH ImageJ are all essential. Due to the sensitive nature of this type of work, computer security is also essential, starting with an encrypted hard drive and strong password protection on the device. Employer-provided or cloud-based software (e.g., Office 365 or Adobe Creative Cloud) should be avoided, when possible, with older standalone apps on the device itself providing better protection (e.g., against employer searches). Since many software tools require login IDs and passwords, a password manager (e.g., LastPass) is essential to avoid reuse of credentials between services.
An anonymous email account can be useful for communicating without compromising identity. While Gmail requires a real backup email account and has other privacy concerns, protonmail.com offers truly anonymous email for a small annual fee. Alternatively, 10minutemail.com provides disposable accounts for one-off messages.
For browsing, a secure browser with plugins is recommended. While Tor browser is the most secure, it is often banned on university computers. An acceptable alternative is Firefox in private browsing mode with no cookies, no saved passwords nor history, and the following plug-Ins: AdBlocker Ultimate, CanvasBlocker, ClearURLs, EFF Privacy Badger, PubPeer (see section 3.5). See 4 for a primer on online security. Use of a VPN can also be useful in masking one’s location or IP address. Finally, when sending files, it is recommended to remove metadata which could be used to identify the sender. On PC this is accomplished by right-click > Properties > Details Tab > Remove Properties and Personal Information.
Original Files & Image Extraction
While much of the literature is now open access, obtaining scientific papers often requires a subscription, which is often unattainable for those outside academia. Tools such as Sci-Hub 5 and Remove Paywall 6 are available to bypass content restrictions. However, these tools may be illegal in certain jurisdictions, so are used at the discretion of the reader with no endorsement implied by their mention here.
Having obtained a paper to analyze, a necessary step in analyzing scientific images is to obtain the highest quality image files available. PDFs often contain images downsized to decrease file size, but original high-resolution images may be available from the publisher’s webpage. As a prerequisite to documenting problems in images, another useful step is to extract the images from the paper into Microsoft PowerPoint. In Adobe Acrobat software, the Edit>Take a Snapshot menu command copies an image to the clipboard at whatever resolution it is displayed on the screen, so using a large monitor and enlarging the document view size is essential to extracting a high-resolution image.
When saving images in software such as Adobe Photoshop or MS PowerPoint, it is good to use a high-quality format such as TIF, even though this generates large files. If using JPG as the format, use the highest resolution allowed by the software — typically 300 or 600 dpi is preferred. For PowerPoint, a registry edit can be used to increase the saved image resolution above the default 72 dpi setting.
Magnification & Color Masking
To aid in determining whether two images share a similar origin, magnification is often used to compare a small area of the image at the pixel level. For comparing two images, a series of droplets (automated workflows) for Adobe Photoshop are available from the ORI website to facilitate this process. 7 In particular, the overlay droplet applies a color mask and transparency to each image, allowing them to be overlaid in the software to check alignment at the single pixel level. Similar effects can be achieved in many of the proprietary software packages that accompany fluorescent microscopes, by assigning each image to a red or cyan color channel and using overlay functions to visualize common pixels in yellow.
Brightness/Contrast adjustments
A surprisingly simple method to alter contrast/brightness is to adjust the tilt of the monitor being used for viewing. This works especially well on older LCD-style monitors and laptop screens but is less effective on newer-generation OLED screens. This method works particularly well for detecting splicing seams in grayscale western blot images.
After importing an image into Photoshop or PowerPoint, adjustments of contrast and brightness are used to highlight seams or other discontinuities between potentially separate elements within an image. In PowerPoint, the Picture Format > Corrections tab is used to adjust contrast or brightness using sliders (tip: make the resulting sidebar wider to gain more granular control over the slider). Typically, an increase in contrast of 50–75% and a decrease in brightness to 30–60% are applied to aid in highlighting discontinuities. Alternatively, for direct processing of single images (JPG, TIF, etc.), the files can be opened in Adobe Photoshop and the Image > Adjustments > Brightness/Contrast menu function is used to adjust brightness/contrast.
Within Photoshop, similar effects can be achieved using the curves function (Menu: Image > Adjustments > Curves). This function allows the user to define the output level (y-axis) for every input level (x-axis) of grayscale in an image — for example, to enhance dark pixels and dull bright pixels. The unity line (diagonal straight line) leaves an image unaltered (i.e., the output image is the same as the input). The image in Figure 1 shows an example. Curves may also be applied in a color-specific manner if the image has multiple color channels, to enhance pixels of a particular hue (e.g., increase blue, decrease red).
Example of the curves feature in Adobe Photoshop to adjust brightness of different components of an image (shadows, midtones, highlights).

Recoloring in PowerPoint or Photoshop
In PowerPoint, in addition to brightness and contrast adjustments, a grayscale image may be recolored (Picture Format > Corrections > Picture Color tab) to help in visualizing similarities/differences between images, as well as highlighting edge features.
In Photoshop, a related feature is the application of a gradient map (Menu: Image > Adjustments > Gradient Map). This feature takes each shade within an image and applies a new color to it, depending on the spectrum chosen from the menu. The ORI droplets page 8 includes a number of customized gradient spectra for download, which are useful for certain types of scientific images. An example is shown in Figure 2.
Application of a color gradient map in Adobe Photoshop. Original western blot image on the left, recolored version in the center. Menu for selecting gradient options on the right.

Histogram analysis, Photoshop
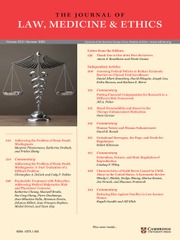
Within a western blot image, the range of shades within the image should be similar between similar features (e.g., bands). That is, black should be black, white should be white. Sometimes a blot image will appear to have one or more bands where the “blackest black” is not as black as the other black bands. This can sometimes indicate that a band has originated elsewhere and been pasted into an image with a different overall grayscale gradient. The histogram function (Menu: Image > Histogram) can be applied to different areas of an image such as bands or lanes, to show the range of shades used in that area. The x-axis of the histogram shows scales from black to white. In the example shown in Figure 3, some of the bands appear black to the eye, but are in fact very dark gray, suggesting a different origin.
Histogram function in Adobe Photoshop. Different bands in the western blot image (highlighted in red boxes) are selected and the histogram function is applied to the region of interest. Resulting histograms show the abundance of pixels at each shade (black on the left, white on the right). The 2nd and 3rd bands from the left have histograms that show a sharp cut-off before black is reached on the x-axis.
JPG Error Analysis
The website Foto Forensics 9 offers a number of image analysis tools, one of which is Error Level Analysis (ELA) for JPG files. The JPG image standard includes algorithms to compress image information to decrease file size. It is generally understood that within a single JPG image, the entire picture should be at the same compression level. If a section of the image is at a significantly different error level, this can indicate a part of the image originated elsewhere, in an image with a different compression level. The website Forensically 10 offers many of the same tools as Foto Forensics, including ELA.
Automated Screening
In recent years, several online automated image screening platforms have emerged, some claiming to use artificial intelligence (AI) in the process. FigCheck 11 is a platform based in China and compares uploaded images in JPG or similar formats. Usage beyond one free personal check per week requires a free API access account. Proofig 12 is a commercial site, requiring a paid account (starting at ~$1 per image). This tool is marketed both to journals for checking submitted manuscripts, and to authors for checking their own manuscripts prior to submission (to protect from the embarrassment of image manipulations being subsequently discovered). In at least one case, a journal has responded to allegations of image manipulation by stating that Proofig found no problems, even though widespread problems were documented for the paper on PubPeer. 13 It is also notable that the academic team behind Proofig has many of their own papers with documented problems on PubPeer. As such, reliance on such a digital crutch to make editorial decisions may be ill-advised.
Reviewer Zero 14 was another automated figure-screening app, aimed at comparing submitted images with the entirety of the open-source scientific literature. However, despite initial fanfare the tool has not yet been released commercially, and its state of development remains unclear. A similar analysis tool is SILA.Reference Moreira 15 However, its developers have chosen to make the tool available only to properly identified parties, to avoid “misuse of the system to indiscriminately accuse professionals of practicing scientific misconduct without the proper human expert supervision and the assurance of the right of defense”. As such, the product is unusable for those wishing to remain anonymous. ImaChek 16 is a Singapore-based company that appears to offer analysis of images within PDFs, but does not have a transparent approach to marketing, pricing, or access to their product.
ImageTwin 17 is a proprietary image recognition algorithm driven by an AI engine trained to spot duplications between parts of images. It is commercially available on a subscription basis, following successful β-testing by many individuals in this area, including this author. A significant advantage of this platform is its ability to extract images from uploaded PDFs. When presented with a paper that contains numerous images, ImageTwin can look within the paper to determine if any of the components appear duplicated and then flag them for further analysis. The site also holds a database of all publicly available bioscience images (i.e., PubMed Central), so can flag whether any of the images in the paper are duplicated from elsewhere. The user can check yes/no buttons to label flagged problems as real or false positives, enabling the AI engine to improve further.
All these tools have teething problems, not least of which is inadvertent tagging of duplicate images in cases when a figure contains a magnification of an area of the same image (e.g., a microscope image with a zoomed-in enlargement). The appearance of some papers in multiple online repositories under different names (e.g., preprint and final published versions) can also lead to false positive hits of duplicate images. Finally, some images that are legitimately used across several publications can yield false positives (e.g., many cancer papers pull protein expression images from the Human Protein Atlas (HPA) database 18).
An important caveat to the use of any online tool is security. While uploading a published paper may be acceptable, uploading unpublished materials for analysis (e.g., from a manuscript or grant application under review) is likely a breach of confidential reviewing rules. Since many of the tools listed above do not publish their underlying code and have opaque policies regarding what information is stored and how it is used for AI training, caution should be applied if submitting anything other than published work for analysis. Lastly, any online tool should be used only for screening purposes, and problems flagged by the tool should be manually verified by human eyes before making allegations of inappropriate manipulation.
Densitometry
Densitometry is the process used to quantify western blot images, i.e., to convert the darkness of the bands on a blot into numerical data. Some blot imaging systems have proprietary software, but the most used tool is NIH ImageJ. 19 Densitometry can be useful to see if the numbers obtained from a blot image match those presented alongside the blot, typically as a bar graph.
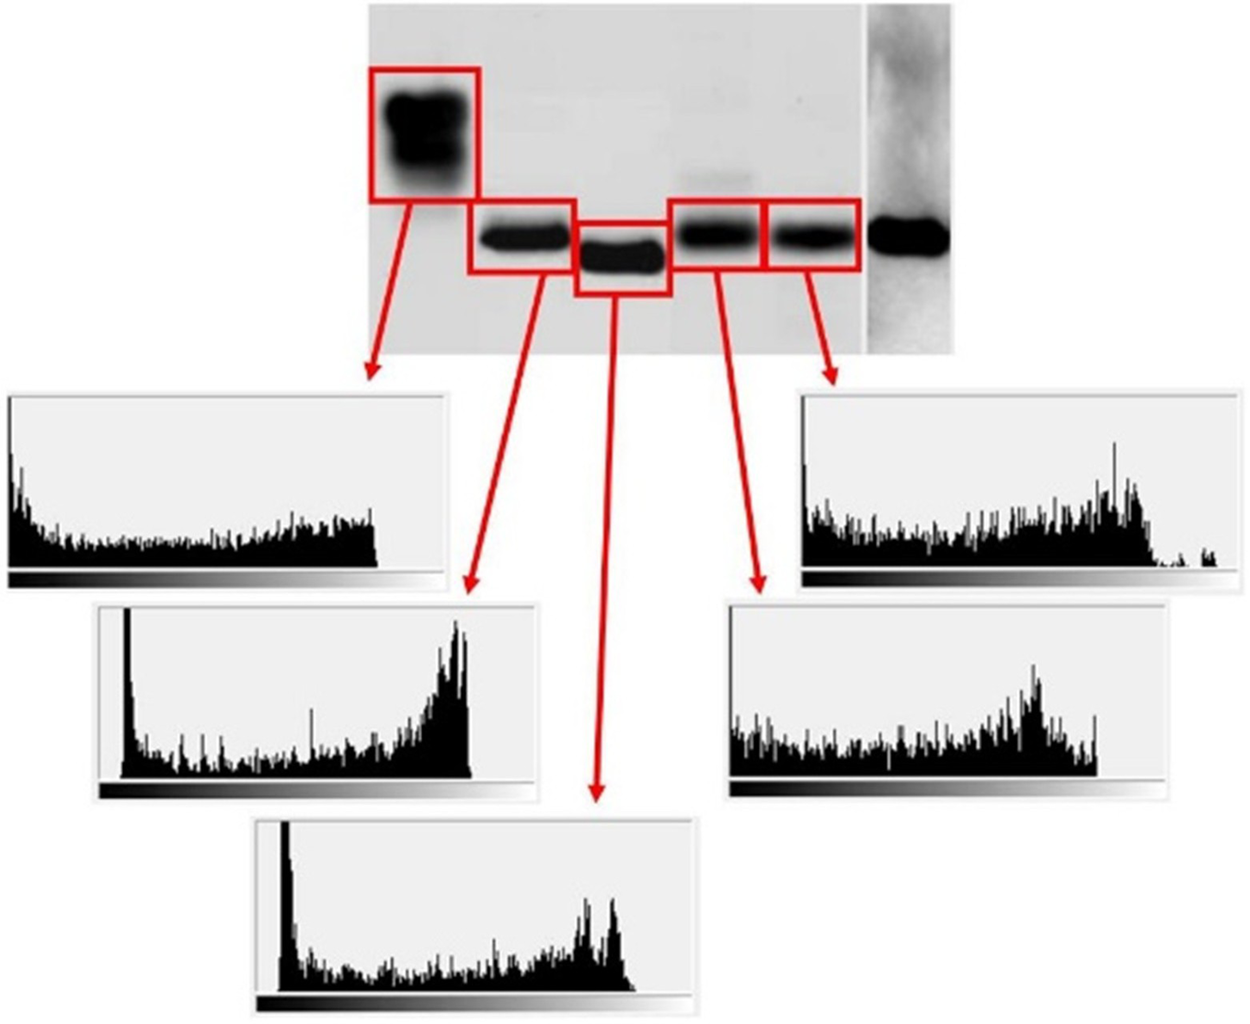
ImageJ first requests to outline the lanes on the blot image, then plots a graph of the signal density from top to bottom for each lane (see Figure 4). On the density plot, a pure white background appears as zero on the y-axis, intermediate shades (gray) are in between, and pure black is 100. This plot can then be used to determine the area under the curve (AUC) for the band of interest in each lane. In the example shown in Figure 4, the blot image is shown with lanes highlighted in yellow using ImageJ. The band of interest is indicated by a red arrow. The density plots for each lane are shown (left to right on a density plot equals top to bottom in a lane). The peak corresponding to the band of interest is shown by red arrows. Finally, the small box below the blot image shows the quantitative data from the 2 peaks (i.e., pixel density counts). In this case, the sample in lane 1 has 9594.5 units of protein, and lane 2 has 6990.3 units.
Densitometry analysis in ImageJ software. First, vertical lanes within the western blot image (left) are selected, as shown by yellow boxes. The red arrow here indicates a band of interest. Second, a densitometry plot is graphed for each lane (shown on the right), with the height of each peak corresponding to the darkness of the band (see scale lower right). The red arrow indicates the band of interest. Lastly, the area of the peaks is calculated (table at lower left).
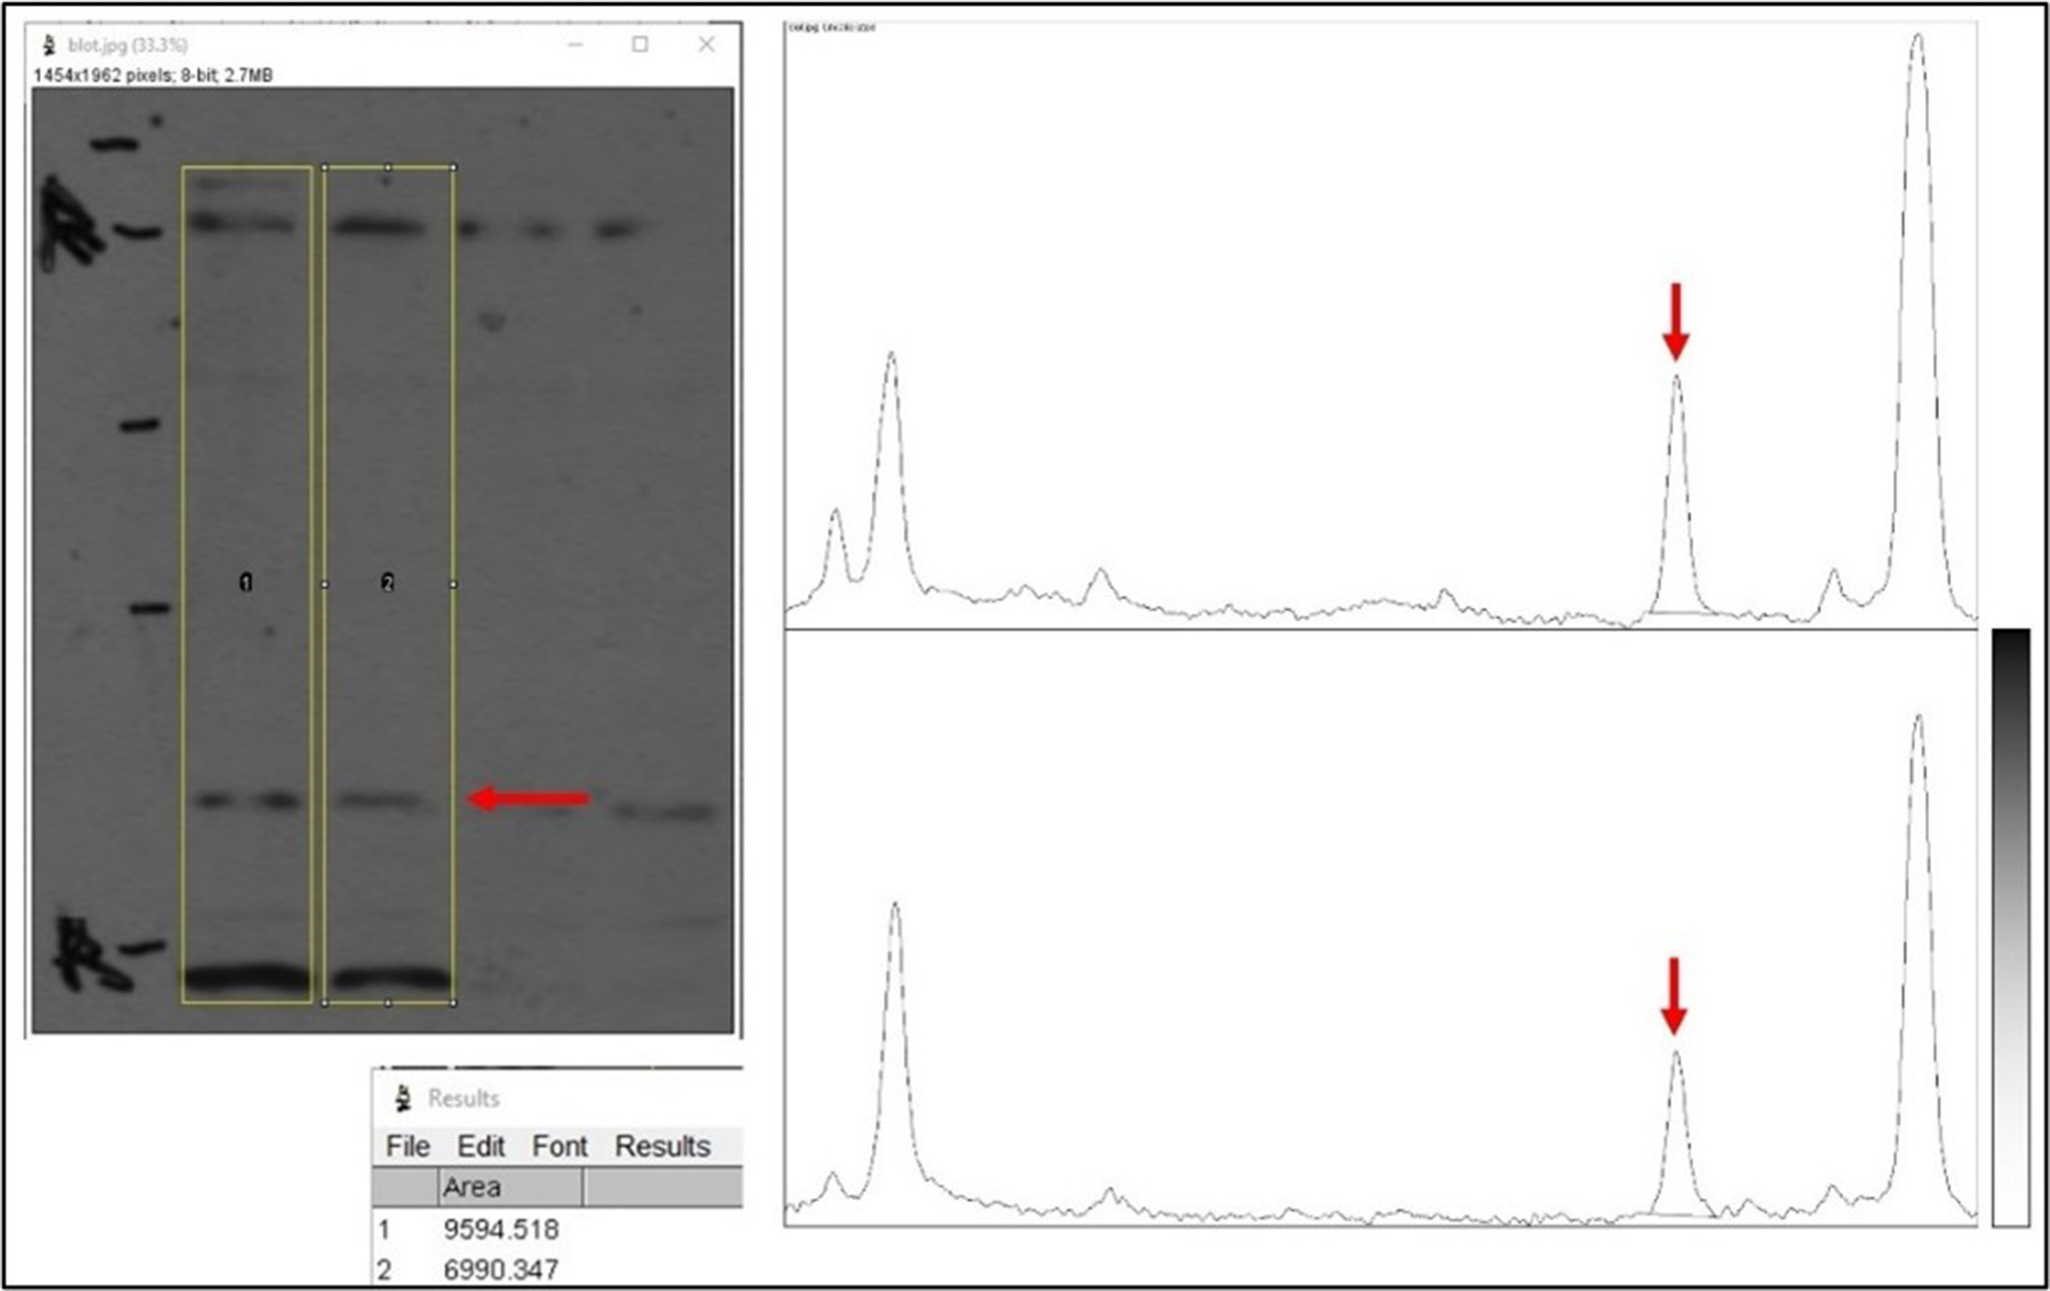
Densitometry reports the relative amount of a protein between samples (e.g., sample A has three-fold more of a protein vs. sample B). A key issue in such comparisons is the limited dynamic range of the western blot method (typically ten-fold). A critical determinant of this range is the saturation of the blot image, with many published blots being over-saturated and not suitable for analysis. A general rule is that protein bands must appear Gaussian to qualify as non-saturated. If a band appears solid black, it may yield a density plot that is clipped or rounded at the top, indicating the signal is over-saturated. The resulting AUC from the density plot will not accurately reflect the amount of protein present. In the example shown in Figure 5, the peaks are rounded at the top, so the bands are not suitable for quantitation (compare to the sharp peaks in the previous figure). The signal is oversaturated and beyond the dynamic range of the method.
Saturation of western blot bands in densitometry analysis. Ideally, densitometry peaks should be Gaussian without “clipped” tops. In the example shown here, the band on the left has a rounded peak on its density graph, indicating saturation of the signal.
It should be noted that the properties of an image are often altered to render it more attractive for publication, e.g., by adjustment of contrast/brightness to yield solid black bands on a solid white background. In such cases, one can only hope that the blot images used for densitometry and quantitation were the unmanipulated originals before such adjustments. Oversaturated blots can be a good opportunity to ask authors for original images for a more detailed analysis.
Non-Image Data — Terminal Digit Analysis
Occasionally, forensic data sleuthing affords access to original data files (e.g., PowerPoint files with graphs sometimes contain the Excel spreadsheet used to generate the graphs embedded within the file). In such cases, a terminal digit analysis (TDA) can indicate whether the data are truly random, as expected for a stochastic process of experimentation, or may have been fabricated. An early proponent of TDA for forensic data analysis was Helene Hill, a bioscientist at Rutgers University who investigated alleged misconduct in the 1990s, leading to a qui tam lawsuit in federal courts.Reference Hill 20
Performing a TDA within Excel is simple, involving the use of the =RIGHT(cell) function to pull the right-most digit of a numerical data point, followed by the =COUNTIF() function to tally the totals for each of the digits 0–9. A chi-squared test can then be performed using the =CHISQ() function in Excel to return a p-value: the probability that the observed distribution of terminal digits came about by chance. A further refinement to TDA is to examine the two most terminal digits. In a perfectly random set of numbers, those ending in the same two digits (i.e., N00, N11, N22, etc.) should occur 10% of the time (since 00, 11, 22, etc. make up 10 of the possible 100 combinations of 2 terminal digits). Again, a higher or lower than expected distribution can indicate potential manipulation of the numbers.
As with many analyses, assignment of cause can be difficult in TDA. Unusual distributions could arise from muscle memory in individuals attempting to make up random numbers by manually entering on a keyboard, or they could arise from inappropriate rounding at an intermediate stage between collection and documentation. As such, this author has anecdotally found that setting a very high p-threshold value (0.001) and only performing TDA on large data sets (>500 data points) can help to avoid potential false positives.
Non-Image Data — Feasible Numbers
Numerous tools are available online for reverse analysis of published statistics and tabular data. The GRIM testReference Brown and Heathers 21 developed by James Heathers and Nick Brown detects inconsistencies in the reported means of integer-type data, given a reported sample size. It relies on the fact that for a given sample size and a known integer scale (e.g. Likert scores 1-5) there are a finite number of possible means for the resulting data. The related GRIMMER test by Jordan AnayaReference Anaya 22 performs a similar analysis to determine if the mean, standard deviation and standard error are consistent with each other for a given sample size. Reported statistics that do not fall into the allowed values may have been manipulated or mistakenly transposed.
SPRITE 23 is a tool for recreating possible combinations of integer data (e.g., a distribution of survey responses) for published values of mean, standard deviation and sample size, to determine if the reported statistics are accurate or arise from credible combinations of the original data. These and other tools are collected at Anaya’s website under the umbrella of Data Thuggery Tools. Reference Anaya 24
Documentation & Reporting
General Workflow
When documenting and reporting problem scientific images it is important to maintain copies of each step of the analysis process — the original PDF of the paper, the extracted images, any manipulated images (e.g., gradient maps applied), a PowerPoint file or other annotated document, and a written report of communication with appropriate parties.
Typically, PowerPoint or Adobe Illustrator can be used to prepare annotated images, pointing out problem features with arrows, colored boxes, and appropriate text. It is a good idea to also list the DOI, PMID, or other document identifier alongside each image, so the recipient can find the original for themselves.
Be aware that PowerPoint files often are large and contain complex metadata that may lead to the identification of their author(s). Thus, if anonymity is required, conversion of the report files to a PDF followed by stripping out metadata (see section 2.1) can yield a file that is more secure for transmission to the relevant parties.
Taxonomy & Quantitation
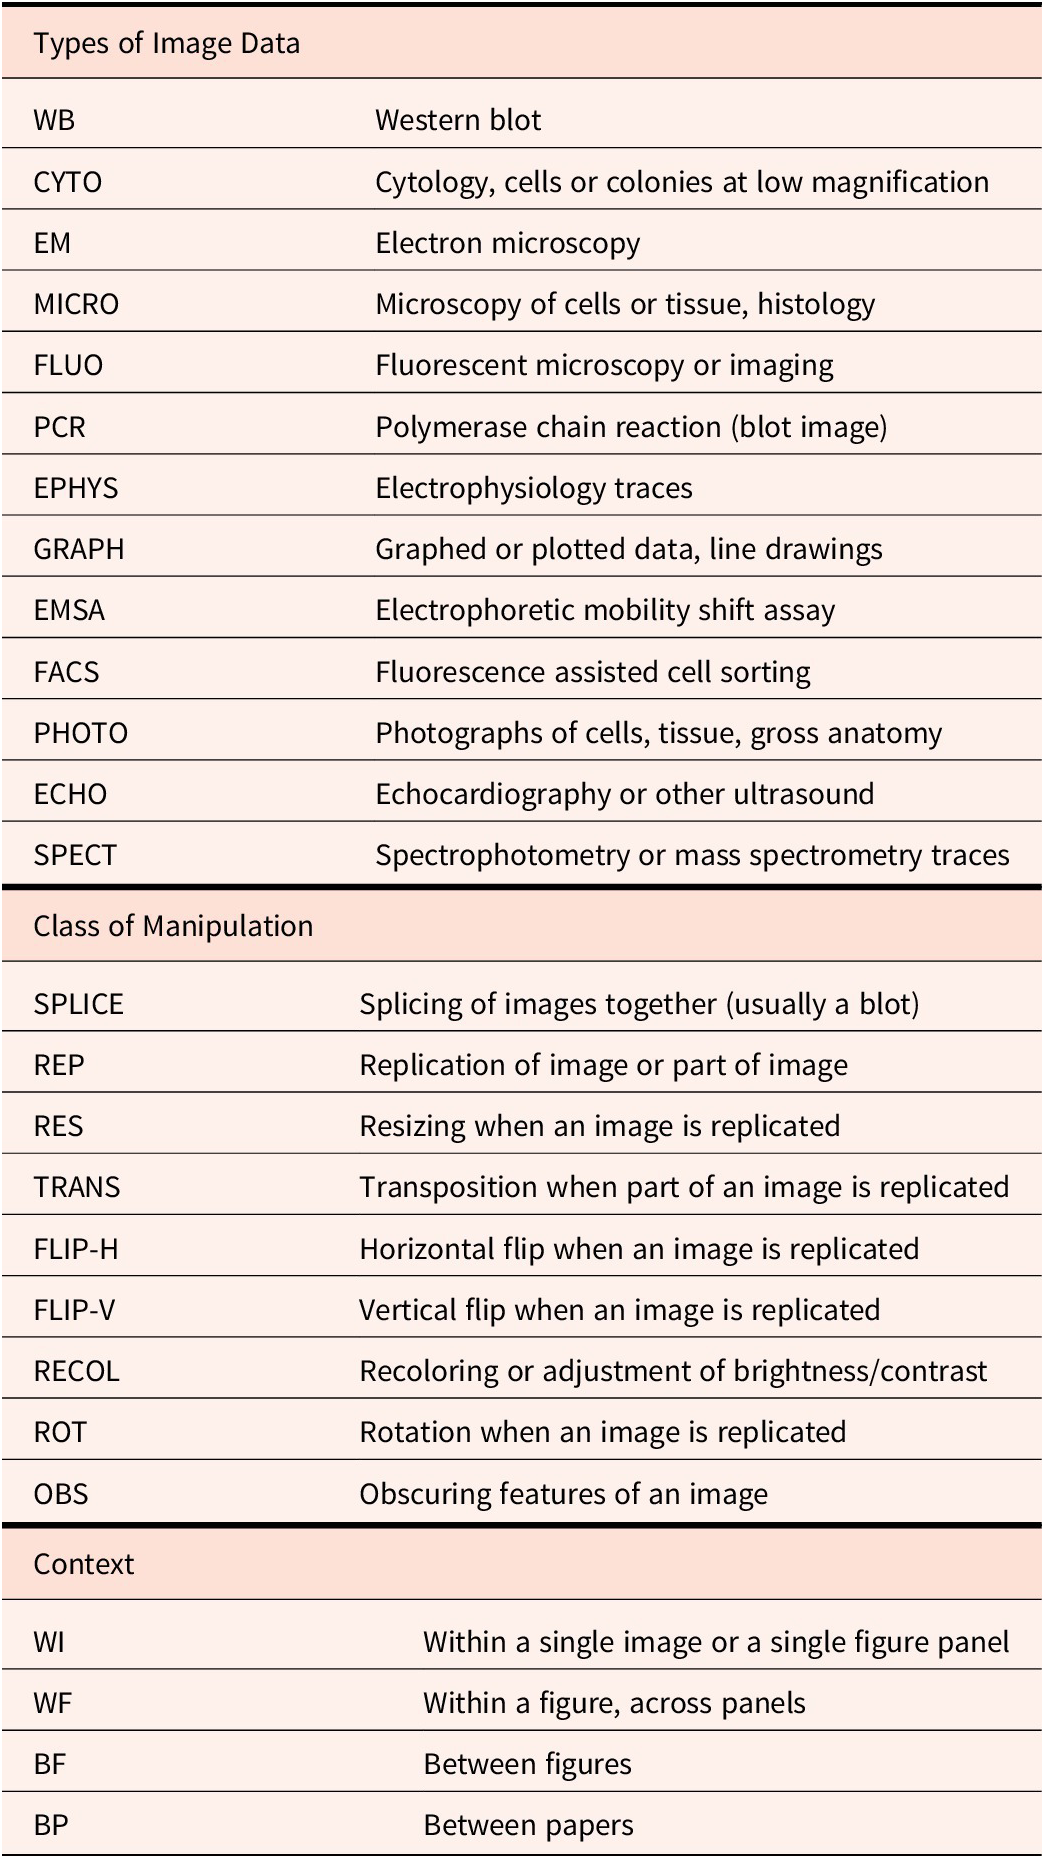
When dealing with multiple papers and images, it can be useful to have a taxonomic system for documenting image manipulations, for databasing purposes. Such information can be useful both for identifying patterns (e.g., do certain journals or authors appear to have a higher-than-expected incidence of a certain type of image problem), as well as for communicating with others (e.g., sharing findings with institutions or other image analysts). Table 1 shows an example taxonomy system used by this author for maintaining a database of problematic images, covering the type of image data, the type of suspected image manipulation, and the context for the findings. Taxonomy can also be useful in the difficult task of quantifying how bad a particular image manipulation is, by serving to catalog the number and extent of manipulations. The provided table is simply a starting point used by this author and obviously can be adapted for field-specific purposes and different types of data.
Taxonomy used by the author, covering typical examples of image manipulation in bioscience papers
Ascribing Causality
When reporting problems with published images, it is important to be careful when assigning causation and motive. It is important to not allege misconduct in situations that could have accidental or allowable origins, but also to be vigilant regarding repeating patterns of mistakes.
As an example, a microscopy image that appears to be identically duplicated in the same figure of a paper could easily be ascribed to an innocent copy/paste error during figure preparation or poor naming of files and recordkeeping in the original data set. However, an image that has been duplicated across two papers with a horizontal flip, some resizing, and alteration of colors is far less likely to have occurred by accident, and could constitute credible evidence of misconduct. In general, the more manipulations performed between two apparently duplicated images, the less likely those manipulations occurred accidentally. In this author’s experience, any non-index rotation of an image (i.e., rotation by an angle that is not a multiple of 90°) is highly suggestive of deliberate manipulation.
The number of image manipulations within a single paper or by a single author is negatively correlated with their being genuinely excused as accidental. One or two duplicated images for a given author may be written off, but a consistent pattern of the same types of image problem across multiple papers and years, and with many different co-authors, is indicative of a deeper problem.
A discussion regarding whether multiple instances of questionable research practices (QRPs) could ever rise to a level equivalent to misconduct is beyond the scope of this paper. However, if QRPs are viewed as a stepping stone to misconduct, then they should certainly be investigated, especially when repeating patterns emerge for individual researchers or labs.
When reporting such issues, take it from someone who has experienced firsthand the negative consequences of leaning too far into the this is fraud end of the spectrum. With the benefit of an additional decade in this field, I now appreciate that the metered approach is more beneficial. Words to live by come from Elisabeth Bik… “These images are more similar than would be expected by chance; can the authors explain?” When presented with such a question, authors have a shockingly reliable ability to dig an even deeper hole for themselves.
Who to Report to?
There are 5 main venues for reporting problematic images in published papers: (i) directly to the authors, (ii) to the authors’ institution, (iii) to the journal where the work was published, (iv) to the agency that funded the work, (v) to an online website, blog, or social media. Each is discussed briefly below, with the latter in its own section, next.
(i) While reporting suspected image manipulations directly to authors is the preferred route espoused by many journals, in particular those of the Nature family, it does carry several risks. Specifically, it can be difficult to confront authors with findings that may be seen as allegations of misconduct, especially for junior researchers. In addition, going directly to the author can trigger efforts to cover up any potential misconduct, such as by destroying original files or evidence, making it difficult for later forensic investigations to proceed. As such, I do not encourage direct reports to authors as a first method, if it can be avoided.
(ii) A report to the institution at which the author of the paper is employed is a safe route for reporting problems and can often be accomplished anonymously. The typical point person is a university’s Research Integrity Officer (RIO). Due to the sporadic nature of information available on university websites (made famous in this comicReference Munroe 25), the Association of RIOs 26 can also be a useful resource for identifying the RIO. RIOs are governed by federal and other guidelines on matters such as confidentiality and investigation timelines and are specifically trained in the handling of misconduct cases. However, RIOs sometimes wear two hats at their institution, and may have conflicts of interest if investigating one of their colleagues for misconduct (e.g., many RIOs are also Deans or academic officers of a university — titles that carry obligations to the institution that may include financial stability). This can be especially troublesome if the respondent to the allegations has large amounts of grant funding that brings a lot of money to an institution.
(iii) Reporting to the journal where the work was published is a recommended route, although the results are hugely variable across the publishing industry. A trade body — the Committee on Publication Ethics (COPE) 27 has established numerous guidelines and procedures for how misconduct allegations should be handled at the editorial level. However, such guidelines are essentially unenforceable, so they are frequently ignored.Reference Brookes 28 To the best of this author’s knowledge there has not been a single documented example of a publisher having their membership in COPE rescinded. It is notable that in a recent 4,300-word blog post,Reference Rossner 29 Mike Rossner, who drafted the de-facto standards on image manipulation in 2004 (now widely known as the Journal of Cell Biology or JCB guidelines Reference Rossner and Yamada 30), made no mention of COPE as playing any role in the fight against image manipulation over the past 20 years. As already noted above, many journals also make use of questionable tools such as Proofig, while others do nothing at all. A notable case here is the family of journals from the Australian publishers IvySpring — in addition to charging authors a standard article processing fee (APC), the publisher charges a further 50% fee for authors to subsequently publish an erratum. 31 In effect, this policy erodes any incentive for the journal editors to detect and correct problematic images and data prior to publication, because they make more money by correcting it later. Such perverse financial incentives are commonplace in the rapidly growing academic publishing sector.
Another notable policy is that of FASEB J, which insists that those alleging manipulations must have a traceable identity — the journal will not investigate any allegations arising from anonymous individuals. In a similar case, the JCI recently published an editorial deeply critical of a series of allegations of misconduct, because the reporting parties were short-selling the stock of a pharmaceutical company whose work was related to the paper.Reference McNally 32 Rather than addressing the actual content of the allegations, I believe that choosing to focus on the identity and credentials of the messenger is a failed strategy for dealing with misconduct.
(iv) Reporting suspected misconduct to the agency that funded the work is another sound route for addressing problems. Typically in the US, the Federal Office of Research Integrity (ORI) oversees research funded by the National Institutes of Health, while the National Science Foundation’s Office of the Inspector General (OIG) oversees that agency’s research portfolio. However, work funded by many research foundations and private agencies lies outside the remit of the ORI. The statute of limitations of six years after the funded project ends or the work is published also applies, such that many papers with problematic images published in the past decade are not eligible for investigation at the federal level. It should be noted that the ORI does not actually investigate the case, rather, they oversee an investigation by the authors’ institution, to ensure correct procedures are followed.
A notable quirk of reporting to the ORI is that anonymity must be requested by the reporter. In the absence of such a request, the allegations are often forwarded to the institution with details on the accuser. I found this out the hard way — the first case I reported to ORI resulted in an email from the supervisor of the individual who was the lead author on the paper, thanking me for my findings. This could have been a very difficult situation if I was more junior and the respondent to the allegations was a more powerful person in my field.
Online Reporting of Image Problems
Reporting problems in scientific image data online has evolved over the past decade, to now become the default. Although a number of independent blogs and websites exist for reporting on all matters of scientific misconduct, 33 by far the most popular venue is PubPeer. 34 Established in 2013, PubPeer allows users to post on any published paper with a digital identifier (typically a DOI or PMID). This can be accomplished via one of 3 options: (i) using one’s own name and a verifiable email address, (ii) using an anonymous account, wherein a random user name is assigned from Latin species taxonomy, (iii) completely anonymously, with this option requiring moderator approval of the comment before publication. PubPeer handles hundreds of papers and thousands of comments per week, and includes options to email the papers’ authors, so they can be aware their work is being discussed online.
Among the novel developments and offerings from PubPeer is a journal dashboard, in which journals and publishers can pay for API access to keep track and be notified when any papers in their publications are flagged on the site. Similarly, institutional dashboards facilitate RIOs and other research integrity personnel staying ahead of reports involving their researchers. Furthermore, a PubPeer browser plug-in is available for Firefox/Chrome/Safari, which automatically identifies papers on any other website and flags their status on PubPeer. This tool is essential for anyone interested in the integrity of the scientific literature and should be automatically installed on all university web browsers. Likewise, for those using the Zotero reference management platform, 35 a PubPeer extension for the app can automatically flag problem papers while compiling a reference list for one’s own writings.
Social media can be useful for publicizing any reports of image problems beyond the user groups of the websites mentioned above. Although a sizeable scientific integrity community exists on X (formerly Twitter), recent political and other upheavals associated with the takeover of the site by Elon Musk have driven many to seek alternative outlets. In this regard, many prominent players in the scientific integrity community have a presence on the platform Bluesky and will gladly repost reports of alleged misconduct and other salient news in this area. A Bluesky “starter pack” for accounts focused on research integrity is available. 36
Although nominally dedicated to reporting on retractions of scientific papers, the website Retraction Watch 37 deserves special mention for its extended coverage of many of the issues surrounding scientific misconduct. Frequent editorials from all aspects of the field (e.g., from whistleblowers, lawyers representing respondents to cases, and journal editors) provide an essential diversity to the narrative in this area.
Anonymous or Not?
The choice of whether to report allegations of misconduct anonymously can be a difficult one, especially for junior scientists or those in situations with power dynamics. An important driver of the choice to be anonymous is the often harsh backlash that can come from those accused of misconduct. In one particular case,Reference Brookes 38 my allegations against a scientist led to a tirade of ad hominem attacks, calling me “stupid,” “not very bright,” and claiming I must be “working for the dietary supplements industry.” A thick skin is necessary to avoid becoming discouraged at such onslaughts. Frequent contributors to the reporting of scientific misconduct have been subjected to death threats, personal violence, and other outrageous and inappropriate online behavior. 39
Such vicious responses to alleged misconduct are often made in an attempt to discredit the accuser(s). In such cases, it is always worth remembering that real scientific truth comes from the data, not from the identity of the person doing the experiment or looking at the result. As such, if a grade-school student identifies a problem in a data set from a Nobel prize winner, the resulting discussion should be about the data, not the relative qualifications of one party or the other. Phrases that equate to “Do you know who I am?” are frequently found in online discussions, and those using them would be wise to practice humility.
As mentioned above, several publishers maintain an outdated policy to not respond to anonymous allegations. This is a mistake — the identity of the messenger should always take second place to the content of the message. Attempts to pin conflict-of-interest charges on an accuser should always be secondary to the consideration that they might be correct. The editorial in JCI mentioned above 40 was critical of those who alleged misconduct because of their apparent financial conflicts of interest. However, the scientist behind the research was recently indicted on federal fraud charges,Reference Piller 41 appearing to vindicate those questioning the research. Those becoming rich via fraudulent science vastly outnumber those scratching together a living from reporting it. Questioning the motives of anyone reporting misconduct should only ever occur after the substance of the allegations has been proven or not.
Legal Ramifications
In light of the recent trend in which those accused of misconduct lawyer up to take on their accusers, a couple of truths should be made clear: first, the data never lie. Second, real scientists don’t need lawyers. Having been on the receiving end of threatened lawsuits originating from my reporting of scientific misconduct, a few key points can serve to protect those embarking in such activities:
Get a lawyer. It is an uncomfortable truth that if you are reporting misconduct, at some point somebody will attempt to sue you. Having a trusted local lawyer who you can lean on to rebut frivolous attempts at lawsuits is an invaluable tool, and well worth a minimal retaining fee.
The relevant laws in scientific misconduct reporting cases are mostly those surrounding defamation (slander, libel, etc.) As such, laws vary considerably by jurisdiction. It is a good idea to become familiar with your state or national laws in this area.
There is a critical difference between a threat to sue and actually bringing a case to court. The first costs about $100, the latter starts at $100,000. There are few academics who can actually afford to bring a lawsuit, but many who can rattle off a letter to scare a misconduct reporter into submission. Lawsuits in this area that make it to court are typically referred to as SLAPP cases (strategic lawsuits against public participation). Many jurisdictions have robust anti-SLAPP legislation, allowing someone served with a SLAPP case to simply ask to “prove what I said that was not true.” 42 Responding to an anti-SLAPP ruling may require a scientist to become open to the discovery process (lab notebooks, original data, emails, hard drives) — a point at which many SLAPP lawsuits appear to evaporate.
An important consequence of the recent incursion of the legal profession into the area of scientific misconduct is the so-called “Streisand effect”, 43 in which the attempt to suppress online attention garners more attention. A salient example is Falzul Sarkur, an investigator at Wayne State University, who attempted to sue those reporting on his problematic publications,Reference Oransky 44 resulting in a flood of attention that resulted in his emigration from the US following a failed recruitment process to the University of Mississippi. When the tech behemoth Google submits an amicus brief supporting the defendant, it is probably a good idea to drop your case.
Although difficult to uncover, there are documented cases of authors threatening to sue journals who wish to retract their work. 45 The lawyering-up of academia is a sad development, reserved only for those who cannot let their scientific findings stand on their own merits. The ultimate defense against a defamation lawsuit is the truth, and it is remarkable how many academics threatening to sue go silent when simply asked “Show me what I said that was untrue.”
How Should Journals and Universities Respond?
The tools available for the detection and reporting of misconduct continue to evolve. Thus, journals and RIOs need to evolve their approaches to reports of potential misconduct. The following are a few recommendations for how such entities should respond to this new reality.
-
• Get a PubPeer account, subscribe to the dashboard, and install the plug-in. Encourage all trainees to do the same.
-
• Understand that most misconduct these days will emerge via the internet (blogs, PubPeer and social media), rather than via traditional channels (confidential emails to a RIO). Institutions need a robust pipeline for monitoring the chatter surrounding their published research.
-
• Take anonymous reporters seriously. Every one of the individuals who threatened to sue me for reporting their misconduct has been fired. Every one of the journals I approached about these problems dismissed my initial allegations. This remains problematic.
-
• Don’t rely on COPE, Proofig, or other commercial turn-key ethics solutions. An organic ground-up approach that involves stakeholders from all levels of the scientific enterprise (undergrad to CEO or president) will produce better results. Newer crowdsourced solutions such as the STM recommendations for image integrity issuesReference Van Rossum 46 should be followed.
-
• Specifically, STM guidelines on how to handle image manipulation problemsReference Van Rossum 47 include principles for researchers to adhere to, in particular regarding transparency on experimental methods, image data itself, and any alterations made. The guidelines also cover scope and editorial responsibilities, interactions between journals, and how to handle third-party whistleblower allegations. A simple three-tier classification system for manipulations is also proposed (level III representing the end of the spectrum most likely indicating misconduct).
-
• Make it visible. Although not discussed here, the practice of not publishing findings of investigations creates an atmosphere of distrust. Being transparent is an essential evolutionary step to improve visibility for the hardworking individuals in this area.
-
• Make it fast. Although many organizations have strict timelines for the completion of investigations (typically 90 days), it is very rare that these deadlines are met. Many cases drag on for months or even years, and during the resulting delays, the individuals accused of misconduct often continue to practice science and to dominate the public narrative surrounding their work. Even publishing interim findings can be a big help in resetting expectations surrounding a case.
-
• Pay for it. The publishing industry is among the most profitable enterprises on the planet, both in raw numbers and percent profit margin. Likewise, higher education research is now a capitalist enterprise, with most non-profit universities relying on research dollars to support their programs. These institutions frequently claim to be gatekeepers of scientific knowledge and trade on their reputations. They need to spend money to address the crisis of scientific misconduct, to maintain their supposed leadership positions.
-
• Don’t shoot the messenger. The president of Stanford University resigned over allegations of misconduct, with the main reporting on the issue being from the undergraduate campus newspaper.Reference Bennett and Hastings 48 Careful analysis of the content of an allegation should always surpass any attempt to determine the credentials of the person making the allegation.
-
• Value whistleblowers. PubPeer is sometimes viewed (as recently related to this author) as “the bane of every RIO’s existence.” However, the work performed by scientific sleuths needs to be recognized as an important contribution to the field. Rather than RIOs reviewing anonymous emails alleging misconduct as a burden, consider the fallout if such investigative work had to be done in-house by paid staff? Think about how much work has already been done by the anonymous PubPeer commenter, making the RIO’s job easier in collating and presenting evidence. RIOs, journal editors, and other institutional officials should think about how to collaborate with and engage whistleblowers and scientific sleuths, to use their extensive knowledge and skills, and to compensate them for their essentially free work.
-
• Institutions should farm out investigations to validated teams or networks of science sleuths, as a paid-for service. There is more than enough work to go around, and offloading this work reduces administrative burden (e.g., on faculty appointed as investigators), and also limits conflicts of interest due to institutional politics.
Conclusions
The public era of scientific misconduct reporting is well underway. From a handful of anonymous bloggers in the early 2010s, we are now firmly in an era where the primary route via which misconduct comes to light is blogging and social media. Early attempts to stifle such discourse, including legal threats, have failed (real scientists don’t need lawyers). The emergence of AI has greatly facilitated the speed with which problematic images can be found, although a significant bottleneck still exists at the level of verification, reporting, and actually dealing with such issues editorially (retraction, correction, etc.) Significant investment in each stage of this process by institutions is a required next step, to ensure the ongoing reliability of the scientific literature.


 Open access