

1. INTRODUCTION
It is well-known that the southern ocean including the Antarctic (Fig. 1) is an active component in the global climate system, and there are various interactions between atmospheric, oceanic and sea-ice fields. Beyond the interannual timescale, sea-ice extent has shown a modest increasing trend (e.g. Cavalieri and Parkinson, Reference Cavalieri and Parkinson2008; Comiso and Nishio, Reference Comiso and Nishio2008; Matear and others, Reference Matear, O'Kane, Risbey and Chamberlain2015). The spatial pattern of the trend is similar in form to the Antarctic Dipole pattern with a quasi-stationary wave between western and eastern parts of West Antarctica (Yuan and Martinson, Reference Yuan and Martinson2001; Renwick, Reference Renwick2002).
Geographical location for polar regions in the Southern Hemisphere.

Several large-scale patterns of variability modulate Antarctic sea-ice extent. The Southern Annular Mode (SAM), or Antarctic Oscillation (AAO) (e.g., Mo, Reference Mo2000; Thompson and Wallace, Reference Thompson and Wallace2000) has a significant impact on sea-ice cover (e.g., Yuan and Li, Reference Yuan and Li2008). In the Pacific sector of the Antarctic, many papers point out the relationship between El Niño-Southern Oscillation (ENSO) and sea-ice cover (e.g., Yuan, Reference Yuan2004; Harangozo, Reference Harangozo2006; Zhang, Reference Zhang2014). ENSO is related to blocking events over the southeast Pacific, with significantly more blocking activity during El Niño conditions (Renwick and Revell, Reference Renwick and Revell1999). The Pacific-South American (PSA) teleconnection pattern is characterized by a stationary Rossby wave train from the tropical central Pacific to tip of South America via the Amundsen–Bellingshausen Seas and is often excited by ENSO variability (e.g., Mo, Reference Mo2000). The PSA pattern reflects the ENSO teleconnection across the Amundsen–Bellingshausen Seas area but its expression is affected by strong SAM events (Fogt and others, Reference Fogt, Bromwich and Hines2011). The PSA and blocking both have a strong influence on Antarctic sea ice extent across the south Pacific (e.g., Renwick, Reference Renwick2002). Such studies find stationary waves in the atmosphere to be related to sea-ice variability.
Intraseasonal variability of relationships between sea-ice and atmospheric fields were reported by Baba and Wakatsuchi (Reference Baba and Wakatsuchi2001) and Baba and others (Reference Baba, Minobe, Kimura and Wakatsuchi2006), using daily data. They showed that the intraseasonal sea-ice variability along the marginal sea-ice zone occurred as an eastward-propagating wave and period of 10–20 days in the west Antarctic (dominant across the Bellingshausen and the Amundsen seas), with the spatial phase of the meridional wind velocity preceding sea-ice concentration by 90°. It is not clear from the above studies whether or not the intraseasonal structures seen in the sea-ice field are related to atmospheric forcing. Generally, large-scale atmospheric patterns associated with the SAM, ENSO and PSA tend to be quasi-stationary. The aim of the present study is to further examine aspects of intraseasonal sea ice variability in relation to ENSO and SAM, and to consider the role of stationary wave patterns, whether such atmospheric patterns could generate propagating signals in the sea-ice field. The analysis focuses in particular on austral winter when sea-ice area is expanding and variability is large.
2. DATA
2.1. Sea-ice concentration
We use the AVHRR-only daily sea-ice concentration from National Oceanic and Atmospheric Administration (NOAA) 0.25° daily Optimum Interpolation Sea Surface Temperature (daily OISST) Climate Data Record produced by Reynolds and others (Reference Reynolds2007) from 1995 to 2014. The data were sampled at a horizontal resolution of 1.0° of longitude by 0.5° of latitude, between 79.5° S and 55.0° S, for ease of computation. We analyzed the sea-ice concentration data for July–September (JAS), when sea ice expands to lower latitudes.
2.2. Atmospheric data
Atmospheric reanalysis daily data were taken from the European Centre for Medium-Range Weather Forecasts (ECMWF) Interim gridded data product over 1995–2014 (Dee and others, Reference Dee2011). We used mean sea-level pressure (MSLP), geopotential height (1000, 975, 950, 925, 900, 850, 800, 750, 700, 650, 600, 550, 500 hPa), 2 m temperature (T2m), and meridional component of 10 m wind (V10m) at 2° × 2° latitude/longitude resolution, for ease of computation and acknowledging that features of interest are of large spatial scale, from meso-α to synoptic scale. The period used for the analysis is the same as for the sea-ice concentration.
2.3. ENSO and SAM index data
Monthly ENSO and SAM index values were taken from NOAA/National Weather Service Climate Prediction Center (NWSCPS, http://www.cpc.ncep.noaa.gov/). Indices were averaged for the 3 months of July, August and September, with the threshold ±0.5°C (ENSO)/standard deviations (SAM) take as the cutoff for positive and negative ‘events’ according to NOAA/NWSCPC (Table 1). Based on the above index values, four El Niño years (1997, 2002, 2004, 2009), seven La Niña years (1995, 1998, 1999, 2000, 2007, 2010, 2011), nine ENSO-neutral years (1996, 2001, 2003, 2005, 2006, 2008, 2012, 2013, 2014), six SAM positive years (1997, 1998, 2004, 2008, 2010, 2012), eight SAM negative years (1995, 1996, 2000, 2002, 2007, 2009, 2011, 2013) and six SAM-neutral years (1999, 2001, 2003, 2005, 2006, 2104) were selected for analyses in this study. Here, we used monthly data in austral winter to define each event.
Index of ENSO and SAM from 1995 through 2014 in austral winter (JAS)

Monthly ENSO and SAM index values were taken from NOAA/National Weather Service Climate Prediction Center (http://www.cpc.ncep.noaa.gov/). Indices were averaged for the 3 months of July, August and September.
3. METHOD
3.1. Filtering and EOF analysis
A 5–60 day band-pass filter was applied to the sea-ice concentration data using the Fourier transform. The bandpass-filtered data were analyzed using Empirical Orthogonal Function (EOF) analysis (Wilks, Reference Wilks2011) after weighting the covariance field by the cosine of latitude (i.e. the data were weighted by the square root of the cosine of latitude).
3.2. Power spectrum
Power spectrum analysis was carried out on the Principal Component (PC) time series of from the EOF analyses. After computing spectra for each year of the PC time series, we calculated the average over all year power of the amplitude spectrum in each frequency band. We follow the REDFIT methodology reported by Schulz and Mudelsee (Reference Schulz and Mudelsee2002), which calculates the red noise Fourier spectrum based on the Lomb–Scargle Fourier Transform.
3.3. Regression/correlation analysis
We also computed the regression/correlation patterns for atmospheric data using the PCs of sea-ice concentration. For significance testing, the effective sample size N e was estimated using the effective decorrelation time or Time between effectively independent samples (Trenberth, Reference Trenberth1984; Metz, Reference Metz1991).
 $$N_{\rm e} = \displaystyle{N \over {T_{\rm e}}}.$$
Here N denotes the sample number, and T e is the covariance as follows:
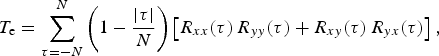 $$T_{\rm e} = \sum\limits_{\tau = - N}^N \left( {1 - \displaystyle{{ \vert \tau \vert} \over N}} \right)\left[ {R_{xx}(\tau )\,R_{yy}(\tau ) + R_{xy}(\tau )\,R_{yx}(\tau )} \right],$$
where τ is lag numbers, R is the correlation, and x and y represent the two variables analyzed.
3.4. Welch t-tests
Estimates of statistical significance of differences were conducted using Welch's t-test, which assumes two samples with possibly unequal variances.
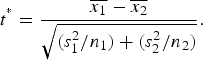 $$t^{^\ast} = \displaystyle{{\overline {x_1} - \overline {x_2}} \over {\sqrt {(s_1^2 /n_1) + (s_2^2 /n_2)}}}. $$
Here n
1 and n
2 are the number of observations in groups, respectively, $\overline {x_1} $
and
$\overline {x_1} $
and $\overline {x_2} $
are sample means,
$\overline {x_2} $
are sample means, $s_1^2 $
and
$s_1^2 $
and $s_2^2 $
are sample variances. The critical values of t* are derived from Student's t-distribution with an effective number d* of degrees of freedom. The degrees of freedom d* are calculated as:
$s_2^2 $
are sample variances. The critical values of t* are derived from Student's t-distribution with an effective number d* of degrees of freedom. The degrees of freedom d* are calculated as:
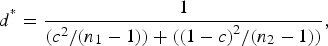 $$d^{^\ast} = \displaystyle{1 \over {(c^2/(n_1 - 1)) + ({(1 - c)}^2/(n_2 - 1))}},$$
where c is as follows.
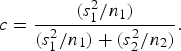 $$c = \displaystyle{{(s_1^2 /n_1)} \over {(s_1^2 /n_1) + (s_2^2 /n_2)}}.$$
4. RESULTS
4.1. EOF analysis for sea-ice concentration
The spatial distribution of amplitudes of first two EOFs of 5–60 day band-pass filtered sea-ice concentration in the Antarctic in JAS are shown in Figure 2a for all years in the dataset. The three leading patterns account for 7.4, 5.9 and 3.8%, respectively, of the total intraseasonal variance during JAS. Matching EOF patterns for various subsets of the data are shown in subsequent panels of Figure 2. According to the ‘rule of thumb’ established by North and others (Reference North, Bell, Cahalan and Moeng1982), the estimated first two modes are well distinguished from the rest of the EOFs in terms of the sampling error for all samples (not shown). Spatial wave number 3 dominates in the marginal sea-ice zone in both EOFs, and the amplitude is large across the west Antarctic especially, in comparison with the east Antarctic. The spatial sea-ice patterns of the two EOFs are half-length out of phase with each other.
Intraseasonal variability of sea-ice concentration anomaly and sea-level pressure. Spatial distributions of the amplitude of first two the intraseasonal (5–60 day) EOFs (left: EOF1, right: EOF2) modes of sea-ice concentration anomaly (color tones), and for the regression (contour) of daily mean sea-level pressure (hPa) onto the first two intraseasonal PCs from 1995 through 2014 in austral winter. The top row shows results for all data (a). Subsequent rows show results for (left) El Niño (b), La Niña (c) and ENSO neutral conditions (d) and (right) SAM positive (e), negative (f) and SAM neutral (g). The numerical values show the percentage of variance accounted for by each EOF.

In the analysis for El Niño years (1997, 2002, 2004, 2009), a wave number 3 spatial pattern is still evident in EOF1, but the region of large amplitude is expanded from the Ross Sea to the Amundsen Sea, off the Indian Ocean coast from Enderby Land to Princess Elizabeth Land (see Fig. 1), and off the coast of Victoria Land (Fig. 2b). The amount of variance accounted for by EOF1 is 10.6%, the largest fraction for any ENSO subset analyzed in this study. EOF2 amplitudes are large across the west Antarctic, but amplitudes are relatively small across the east Antarctic (Fig. 2b). In La Niña years (1995, 1998, 1999, 2000, 2007, 2010, 2011), EOF1 accounted for 8.7% of the total variance accounted for (Fig. 2c), noticeably larger than that for all data. The spatial pattern is almost the same as for all data, but with larger amplitudes distributed from the Ross Sea to the Amundsen Sea. The spatial pattern of EOF2 (7.4%) are in quadrature. In ENSO-neutral years (1996, 2001, 2003, 2005, 2006, 2008, 2012, 2013, 2014, Fig. 2d), amplitudes are slightly stronger over the eastern Antarctic and the Ross Sea, but the first two EOFs have almost the same spatial pattern with Figure 2a (Fig. 2d). Both EOFs account for similar amounts of variance as in the full dataset.
The first two EOF spatial pattern in SAM positive years (1997, 1998, 2004, 2008, 2010, 2012) are similar to the El Niño events pattern, and account for 11.0% and 7.3% of the subsample variance, respectively (Fig. 2e). However, amplitude is concentrated over the Bellingshausen Sea in EOF1. In SAM negative years (1995, 1996, 2000, 2002, 2007, 2009, 2011, 2013), EOF1 (8.5%) amplitudes are large notably in the outer sea-ice area across the west Antarctic and off the coast of Victoria Land (Fig. 2f). The pattern of amplitudes in EOF1 over the Bellingshausen Sea is similar to that seen in SAM positive years. The spatial pattern of EOF1 (8.9%) in SAM neutral years shows the largest variability in the outer marginal sea-ice zone area (Fig. 2g).
4.2. PC time series
The power spectrum of the first two PCs is shown in Figure 3. Here, we calculated a RMS for each frequency after calculating spectra for each austral winter. The PC spectra exhibit less power than red-noise spectra at periods up to 13 days, but have more power than red-noise at periods between 12 and 35 days.
Power spectra of intraseasonal variability of sea-ice concentration. Power spectra of the first two Principal Components of the intraseasonal (5–60 day) sea-ice concentration variability from 1995 through 2014 in austral winter (JAS). After calculating spectra for each year of the PC times series, we calculate the average power of the amplitude spectrum in every frequency band. Red thick line and blue line show PC1 and PC2, respectively. Error bars are ±one standard error. Dotted lines shown theoretical red-noise spectra, red is for PC1 (thick dotted lines for false-alarm level 95%, thin dotted lines for 90%) and blue is for PC2, respectively (same as PC1). (a)–(g) are same as Figure 2.

The power structures of first two PCs are almost identical during 13 to 15-day periods, in the full dataset (Fig. 3a). Where peak periods match, the first two EOFs are likely describing propagating waves, as found in a previous study (Baba and Wakatsuchi, Reference Baba and Wakatsuchi2001; Baba and others, Reference Baba, Minobe, Kimura and Wakatsuchi2006). The power of PC1 is larger than PC2 at longer periods (more than 15-days) with a statistically significant difference, suggesting more persistence in the wave pattern that peaks over the South Pacific, compared with EOF2, which exhibits large amplitude right around the hemisphere.
In El Niño years, the spectra of the first of two PCs are superimposed at short periods (<15-day) and at longer periods (~30-day) (Fig. 3b). At intermediate periods, PC1 power is large and the spectra of the first two PCs show a statistically significant difference. In La Niña years, there is notably more power in PC1 at short periods (<20-day), compared with El Niño years, and the difference in power at short periods is statistically significant. In ENSO-neutral years, the first two PCs have almost the same spectrum pattern as in Figure 3a (Fig. 3d), but the statistically significant is over 18–30 day periods.
In SAM positive years, at <17-day periods, PC2 power is larger than PC1, but at more than 17-day periods, PC1 power is larger than PC2 (Fig. 3e). The power in long-term periods is longer in all other subsets of the data (the full 20 years, both phases of ENSO and negative/neutral SAM). There are statistically significant differences between 18-day and 30-day periods (Fig. 3f). There is almost the same spectral pattern as in the full dataset, but power is shifted to shorter periods as seen in La Niña years, in SAM negative events. In SAM neutral years, there are significant differences statistically at short periods, <15-day (Fig. 3g).
The lagged correlation computed between first two PC time series for the full 20 years, ranging from minus 60 days to plus 60 days, showed that PC1 leads PC2 with a time lag of 7 days (inferred propagation speed of 5 m s−1), consistent with Rossby wave results of Renwick and Revell (Reference Renwick and Revell1999) and with intraseasonal propagating wave periods results of Baba and others (Reference Baba, Minobe, Kimura and Wakatsuchi2006) and Baba and Wakatsuchi (Reference Baba and Wakatsuchi2001). Almost the same results were obtained from each of the ‘event’ subsets.
4.3. Regression
Regression analyses were performed on daily MSLP data using the first two intraseasonal sea-ice concentration PCs (Fig. 2). Large amplitudes or dominant amplitude areas are significant at the 99% level using the so-called Effective decorrelation time or Time between effectively independent samples (Trenberth, Reference Trenberth1984), for all data subsets. Figure 2a shows that a wave number 3 spatial pattern dominates for both PCs, with largest amplitude over western longitudes from the Ross Sea to the Weddell Sea. The spatial patterns are approximately in quadrature. The signal of the PC2 is slightly stronger than PC1. Meridional flows associated with the MSLP patterns align closely with regions of sea ice increase and decrease seen in the two leading EOFs. Also, the spatial pattern associated with PC2 is more hemispherically uniform than that from PC1, which has little amplitude across the Indian Ocean.
In El Niño events, the spatial pattern of MSLP associated with PC1 is the same as for all years and the signal is stronger except in the area from the Amundsen Sea to the Weddell Sea (Fig. 2b). The PC2 spatial pattern is almost the same as in all years (Fig. 2a). Figure 2c shows that in La Niña events, both PCs spatial patterns dominate over the west Antarctic, while they are weak over the east Antarctic. In ENSO neutral years, almost the same spatial wave number 3 pattern appears (Fig. 2d). The PC2 pattern is slightly shifted to the east over the west Antarctic, and the center located south of New Zealand is moved to the east of New Zealand (Fig. 2d).
During SAM positive and negative periods, the spatial pattern of PC1 and PC2 are almost the same as with the full dataset, but the maximum amplitude centers are shifted to the east over the west Antarctic in SAM positive events (Fig. 2e). In SAM negative years, the spatial patterns of PC1 and PC2 are the same as for the full dataset (Fig. 2). The spatial PC1 pattern is similar to that for all years, but the maxima of PC2 are shifted to the west or north over the west Antarctic (Fig. 2g).
It appears from the regression analysis of MSLP that there is a seesaw pattern between the Amundsen-Bellingshausen Seas, the southeastern Pacific and the Weddell Sea, the southwestern Atlantic in PC1 and is a seesaw pattern around the Antarctic Peninsula and off the Amundsen Sea, the southern Pacific Ocean, or the southern Atlantic Ocean in PC2.
5. DISCUSSION
According to EOF analysis for sea-ice concentration, it is clear that intraseasonal variability of sea ice is dominated by activity over the west Antarctic regardless of the large-scale setting of SAM and ENSO. As in previous studies, it implies that this area is susceptible to the influence of the atmosphere no matter what the situation. Baba and others (Reference Baba, Minobe, Kimura and Wakatsuchi2006) reported a propagating wave number 3 (and 4) in the Antarctic for 10 years of daily data from 1992 to 2001, and showed that the intraseasonal variability of sea-ice concentration occurs in the marginal sea ice zone of the west Antarctic. Almost the same spatial pattern occurrs in this study.
From the results of power spectrum analysis of first two PCs time series, spectral power is shared equally between the PCs at some periods (usually 15-day or less), while there is often a significant difference between PCs power at longer (more than 18-day) periods (Fig. 3a). Since the spectral patterns associated with the first two PCs appear to be in quadrature and their eigenvalues are not statistically separated, it implies that some same peaks (Fig. 3a), i.e. ~15-day periods, probably represent traveling waves as in previous studies (Baba and Wakatsuchi, Reference Baba and Wakatsuchi2001; Baba and others, Reference Baba, Minobe, Kimura and Wakatsuchi2006; Renwick and others, Reference Renwick, Kohout and Dean2012) This is supported by the lagged correlation analysis between the first two PCs time series (Fig. 4). However, the existence of a stationary wave component in sea-ice variability at the monthly timescale is inferred from the independent spectral peaks at those periods. It follows that stationary and propagating waves coexistent and interact on the intraseasonal timescale across the west Antarctic. This result was not captured previously by analysis of monthly average data, and the spatial amplitude may be weakened by the propagation wave, depending on the period of the wave. The analysis techniques used here do not explicitly separate stationary and travelling wave components, but the inferences drawn here appear to be robust. Future work will explicitly investigate propagating signals in the sea-ice field.
Annual mean lagged correlation between PC1 and PC2 time series from 1995 through 2014 in austral winter (JAS). The red dotted lines show 1% significance of lagged correlation between PCs.

The spatial patterns of intraseasonal variation are different for each event that is classified by ENSO or SAM. To clarify the spatial difference between them, regression analysis onto PCs of sea-ice concentration of each event were examined for daily atmospheric fields. Coherent wave number 3 patterns were indicated by regression analysis, the positive (negative) variation area of sea-ice concentration in EOFs coincides with the positive (negative) variation area of MSLP (Fig. 2). The maxima in the EOFs of intraseasonal variability of sea-ice concentration are located to the east of the associated maximum amplitudes of the MSLP field. Hence it appears that cold (warm) air advection occurring to the east of high (low) pressure causes sea-ice variation through dynamical and thermodynamical processes, i.e., direct advection of sea ice due to wind drag and an appreciable amount of heat flux from (into) the ocean, resulting in active ice production (suppression or melting) (Baba and others, Reference Baba, Minobe, Kimura and Wakatsuchi2006; Renwick and others, Reference Renwick, Kohout and Dean2012). The patterns of 500Z, T2m and V10m (not shown) have a coherent relation with MSLP. According to Ikeda (Reference Ikeda1989), ~0.1 m thick ice is possibly produced in 3 days, when the water temperature is below the freezing point, a wind of 10 m s−1 or more blows with air temperature falls by 5° for 3 days. When a strong wind blows along the marginal sea-ice zone, an appreciable upwelling of warm water may occur there because the drag coefficient of sea ice is larger than seawater. The wind and temperature fields act more consistently on the sea-ice field if a propagating wave occurs (see Fig. 4), because the sea-ice response is a little delayed in relation to the atmospheric forcing.
Comparing ENSO and SAM events from regression analysis for atmospheric fields, the centers of MSLP variability in SAM events (Figs 2e, f) are located at higher latitudes than during ENSO events (Figs 2b, c). Therefore, the regions of largest variability of sea-ice concentration vary strongly in the meridional direction. It is known that strong jet/storm track activity occurs over the Amundsen-Bellingshausen Seas in positive SAM, while there is no strong jet there in negative SAM (e.g., Kidston and others, Reference Kidston, Renwick and McGregor2009). Our results are consistent with previous studies for the Amundsen-Bellingshausen Seas (Figs 2e, g). Kuwano-Yoshida and Minobe (Reference Kuwano-Yoshida and Minobe2017) showed that the storm-track response to sea surface temperature (SST) anomalies over the mid-latitudes using an atmospheric general circulation model. Therefore, it is probable that thermal exchange including latent and sensible heating occurs between the atmosphere and the ocean in this area, because open water is equivalent to variability of sea-ice concentration. These heat fluxes change due to changes in sea-ice concentration and may influence low pressure activity and the storm tracks (e.g, Turner and others, Reference Turner, Phillips, Hosking, Marshall and Orr2013). Since the main heat source in the polar region is the ocean, we infer that feedback from the ocean to the atmosphere is occurring in that area as a consequence of sea-ice variability associated with the SAM and ENSO. This mechanism could cause a seesaw or teleconnection in other areas. Moreover, since the ocean's thermal capacity imparts memory to the climate system, its variation may also affect the following winter's sea-ice production. As the thermal capacity of the ocean is much larger than that of the atmosphere, its influence must be considered in future studies.
Figure 5 shows JAS zonal mean cross sections from 90 to 110 W of composite average geopotential heights in the lower-troposphere. Height fields are averaged separately for ENSO and SAM ‘events’. For ENSO events, the largest positive anomalies lie near 62S in El Niño events, while anomalies are small there in La Niña events (Fig. 5a). Statistical analysis of these differences examined by means of Welch's t-test indicates that the null hypothesis can be discarded at the 0.1 error level which is t* observed (1.6~) > t critical (1.3) in this area. Although the standard deviations are almost same magnitudes in this area, since the positive anomalies are distributed at same area, Amundsen-Bellingshausen Seas Low is weak in El Nino events. Turner and others (Reference Turner, Phillips, Hosking, Marshall and Orr2013) reported that the Amundsen Sea low is stronger during the La Niña events compared with El Niño events, while our results indicate that the Amundsen-Bellingshausen low is weaker in El Niño events, compared with the overall climatology. Figure 5 shows at least that the height field response to ENSO is not purely lilnear.
Vertical cross section of geopotential height anomalies as zonal means from 90W to 110W in austral winter (JAS). Panel (a) shows ENSO composites, El Niño in red, La Niña in blue. Panel (b) shows SAM composites, SAM positive in red, negative in blue. In both panels, solid lines indicate positive anomalies and dashed lines negative.

From the PC spectra (Fig. 3b) in El Niño events, around the 15-day period, the power in both PCs is almost the same, and with similar standard deviations. This implies the EOF analysis cannot completely separate the stationary and propagating wave components. The propagating waves also contribute to this regional intraseasonal variability in the lower-latitude sea-ice zone (Baba and others, Reference Baba, Minobe, Kimura and Wakatsuchi2006). But, the group of peaks near the 15-day period is dominated by stationary waves in Figure 3c where the first two PCs are statistically significantly different in La Niña events. It was found that there was a difference at spatial structure of intraseasonal variability in the short periods between El Niño and La Niña.
In SAM events, the large negative (positive) anomalies lie ~72S in SAM positive (negative) events (Fig. 5b). Statistical analysis of these differences also examined by Welch's t-test indicates that the null hypothesis can be discarded at the 0.05 error level, which is t* observed (3.0~) > t critical (2.0) in this area. Although the timescales of variability are different, they show similar structure to those in previous studies (e.g., Thompson and Wallace, Reference Thompson and Wallace2000). For periods of 15–23 days (Fig. 3e) the similar power in both PCs suggests that stationary and propagating waves coexist in the marginal sea-ice zone during positive SAM periods.
This paper focused on ENSO- and SAM-related intraseasonal variability of sea ice in austral winter, the period of maximal sea-ice growth and extent. In the west Antarctic, intraseasonal variability of sea ice is strongly influenced by the atmosphere, but the magnitude and location of centers of action change between polarities of both ENSO and SAM. The overall spatial patterns of variability are similar to those found in earlier studies, but the form of intraseasonal variability is found to vary with the polarity of ENSO and SAM. To understand sea-ice variability in this area, it is necessary to consider more closely the influence of ENSO and SAM events on the spatial structure and timescale of sea-ice variations.
6. CONCLUSION
We performed an EOF analysis to assess the intraseasonal variability of 5–60 day band-pass filtered sea-ice concentration in the Antarctic in austral winter using a 20-year daily dataset spanning from 1995 through 2014. A wave number 3 spatial pattern is very prominent around the Antarctic, with largest amplitude across the west Antarctic, and is relatively insensitive to the phase of ENSO or the SAM. Power spectrum analysis of first two PCs time series showed that stationary and propagating waves coexist in the intraseasonal variability of sea ice. The dominant wave period varies between events. Regression analyses with atmospheric fields using first two PCs showed that the atmospheric fields and the sea-ice patterns were coherent, although the spatial distribution varies depending on the event. It is suggested that these phenomena are associated with feedbacks between the atmosphere and the ocean, and can affect regional atmospheric circulation variability.
ACKNOWLEDGEMENTS
We thank the NOAA National Centers for Environmental Information for 1/4° daily Optimum Interpolation Sea Surface Temperature and Environmental Prediction Climate Prediction Center for ENSO/SAM indices, and European Centre for Medium-Range Weather Forecasts for Interim gridded data. We wish to acknowledge Masaru Inatsu for variable comments. We alsothank reviewers and editor for their insightful comments on the paper, as these comments led us to an improvement of the work. The figures were produced by GFD DENNOU Library, the Generic Mapping Tools (GMT), and Grid Analysis and Display System (GrADS).


 Open access