


Introduction
Mental health and wellbeing are becoming increasingly prominent in national and international health policy (World Health Organization, 2002, 2004; Department of Health and Social Care, 2011; Mehta et al., Reference Mehta, Croudace and Davies2015). At a societal level, they represent important resources closely linked to social, human and economic capital (Friedli and Parsonage, Reference Friedli and Parsonage2007; Knapp et al., Reference Knapp, McDaid and Parsonage2011), and are associated with lower levels of inequality, less community violence and higher life expectancy (Friedli and World Health Organization, Reference Friedli2009). For individuals, mental health and wellbeing are closely connected to normal functioning and quality of life and are instrumental in creating and maintaining good relationships (World Health Organization, 2004; Jané-Llopis et al., Reference Jané-Llopis, Barry, Hosman and Patel2005). Clinically, the growing evidence for the existence of a ‘continuum’ of psychopathology (also referred to as ‘common mental distress’ or the ‘general psychopathology factor’) (Caspi et al., Reference Caspi, Houts, Belsky, Goldman-Mellor, Harrington, Israel, Meier, Ramrakha, Shalev, Poulton and Moffitt2014; Stochl et al., Reference Stochl, Khandaker, Lewis, Perez, Goodyer, Zammit, Sullivan, Croudace and Jones2015) suggests that improving mental health and wellbeing may also help to prevent the development of mental disorders.
Several approaches have been suggested for improving mental health and wellbeing, including psychological therapies (Fava et al., Reference Fava, Rafanelli, Cazzaro, Conti and Grandi1998; Slade, Reference Slade2010; Galante et al., Reference Galante, Dufour, Vainre, Wagner, Stochl, Benton, Lathia, Howarth and Jones2017), school and workplace interventions (Jané-Llopis and Barry, Reference Jané-Llopis and Barry2005; Jané-Llopis et al., Reference Jané-Llopis, Barry, Hosman and Patel2005; Knapp et al., Reference Knapp, McDaid and Parsonage2011; Weare and Nind, Reference Weare and Nind2011), improvement of housing and nutrition, reduction of substance misuse and prevention of violence (World Health Organization, 2004; Jané-Llopis et al., Reference Jané-Llopis, Barry, Hosman and Patel2005). Despite their promise, however, many of these approaches have been criticised for their lack of supporting empirical evidence (Mehta et al., Reference Mehta, Croudace and Davies2015). Indeed, current methods used to inform intervention targets are mainly limited to theoretical models (e.g. Ryff's model of wellbeing; general stress theory), literature reviews and qualitative methods (e.g. interviews with experts and service users), and do not consider any type of quantitative method.
Psychological network analysis is an innovative statistical approach that can complement theoretical knowledge and clinical expertise by providing quantitative evidence for the identification of intervention targets. Essentially, it examines relationships between different items on clinical questionnaires, and determines which items are most ‘central’ to the condition of interest due to having strong relationships with other items. Central items may then serve as indicators for clinical intervention targets (Fried et al., Reference Fried, van Borkulo, Cramer, Boschloo, Schoevers and Borsboom2017), as their improvement is most likely to destabilise harmful network structures and prevent exacerbation of other items (Smith et al., Reference Smith, Crosby, Wonderlich, Forbush, Mason and Moessner2018). Network analysis has been used to suggest potential intervention targets for depression (van Borkulo et al., Reference van Borkulo, Boschloo, Borsboom, Penninx, Waldorp and Schoevers2015), post-traumatic stress disorder (Fried et al. Reference Fried, Eidhof, Palic, Costantini, Huisman-van Dijk, Bockting, Engelhard, Armour, Nielsen and Karstoft2018) and eating disorders (Smith et al., Reference Smith, Crosby, Wonderlich, Forbush, Mason and Moessner2018). Furthermore, it aligns with the clinical characterisation of psychopathology as a system of causal relationships between symptoms, where some symptoms are more influential than others (van Borkulo et al., Reference van Borkulo, Boschloo, Borsboom, Penninx, Waldorp and Schoevers2015).
To make valid inferences in network analysis, comprehensive tools to measure mental health and wellbeing, such as the well-established Warwick-Edinburgh Mental Well-being Scale (WEMWBS), are crucial. In this study, we have used psychological network analysis to identify items central to the WEMWBS, which we present as potentially optimal targets for interventions aiming to improve mental health and wellbeing.
Methods
Participants
This study sample comprises 47 578 participants from four different UK cohorts.
National Child Development Study
The National Child Development Study (NCDS) (University of London, 2012) is a major longitudinal British cohort study initiated in 1958. As such, this sample is homogeneous for age. At age 53, 8643 NCDS participants (51.8% women) completed the WEMWBS as part of a set of self-report questionnaires. Full details on sampling design and data collection can be found at https://tinyurl.com/y7q2m66z.
Northern Ireland Health Survey
The Northern Ireland Health Survey (NIHS) (Department of Health Northern Ireland, 2016) covers a range of health topics important to the lives of people in Northern Ireland. The survey has been annually conducted since 2010. Respondents are sampled from those aged 16+ living in private households. The 2010–2011 survey collected wellbeing data from 4161 individuals of which 3873 (58.8% women) had complete WEMWBS data. Details about the data collection methodology can be found at https://tinyurl.com/ybfakdsm.
Neuroscience in Psychiatry Network
The Neuroscience in Psychiatry Network (NSPN) (Kiddle et al., Reference Kiddle, Inkster, Prabhu, Moutoussis, Whitaker, Bullmore, Dolan, Fonagy, Goodyer and Jones2018) cohort consists of 2403 participants, aged 14–25, recruited from Cambridgeshire, London and surrounding areas. The sample analysed here was recruited between November 2012 and July 2017. Study invites were sent through general practice surgeries and schools with the aim of recruiting 200 women and 200 men for each of five age strata (ages: 14–15; 16–17; 18–19; 20–21; 22–24). Complete WEMWBS data were available from 2337 individuals (53.8% women).
Scottish Schools Adolescent Lifestyle and Substance Use Survey
The Scottish Schools Adolescent Lifestyle and Substance Use Survey (SALSUS) (NHS National Services Scotland, 2013) survey was set up by the Scottish Government to monitor progress on reducing smoking and substance misuse. Information from the survey helps national planning and facilitates the monitoring of policy implementation. The WEMWBS data used in this study were collected in 2010 from 32 725 individuals (49.4%, women) from the second (age 12–14) and fourth (age 14–16) years of secondary school. Full details can be found at https://tinyurl.com/ya66mdq4.
The Warwick–Edinburgh Mental Well-being Scale
The WEMWBS (Tennant et al., Reference Tennant, Hiller, Fishwick, Platt, Joseph, Weich, Parkinson, Secker and Stewart-Brown2007) is a 14-item, self-report measure designed to assess a range of wellbeing concepts including affective-emotional aspects, cognitive-evaluative dimensions and psychological functioning in the general population. All items are worded positively and have five response categories (1 – none of the time; 2 – rarely; 3 – some of the time; 4 – often; 5 – all of the time). The wellbeing score is computed as sum of all items (range: 14–70), with higher scores representing better wellbeing. The WEMWBS was found to be a unidimensional measure and to have desirable psychometric properties (Tennant et al., Reference Tennant, Hiller, Fishwick, Platt, Joseph, Weich, Parkinson, Secker and Stewart-Brown2007). The scale is well-regarded by service users and their carers, who tend to prefer it to other mental health and wellbeing measures (Crawford et al., Reference Crawford, Robotham, Thana, Patterson, Weaver, Barber, Wykes and Rose2011) for the way that it asks about positive aspects of mental health.
Analysis
Psychological network analysis (Borsboom and Cramer, Reference Borsboom and Cramer2013) conceptualises behaviour as a complex interplay of psychological and other components. Recently, this methodology has become popular in psychometrics partly due to its ability to identify worthwhile items for intervention development in questionnaires and surveys. In typical network analysis applied to questionnaire data (Gaussian graphical models), nodes (representing questionnaire items) are interconnected via edges (representing partial correlations) (Costantini et al., Reference Costantini, Epskamp, Borsboom, Perugini, Mõttus, Waldorp and Cramer2015). The use of partial correlations ensures that bivariate relationships between nodes are not confounded by relationships to other variables in the network and provides unbiased computation of centrality indices. Networks in this paper utilise the ‘spring’ layout (Fruchterman and Reingold, Reference Fruchterman and Reingold1991), where nodes are positioned on a plane so that distances between them relate to the size of their partial correlations.
Typically, the network in each cohort is estimated separately and sparsity (and thus improved interpretability) of such networks is achieved by the application of an adaptive graphical LASSO penalty (Friedman et al., Reference Friedman, Hastie and Tibshirani2008). However, recent developments allow for joint estimation of multiple networks using fused graphical LASSO (FGL) (Danaher et al., Reference Danaher, Wang and Witten2014). FGL extends traditional graphical LASSO by extending the penalty function to incorporate differences among corresponding edge-weights estimated across networks. This strategy neither masks nor inflates similarities across networks (Fried et al., Reference Fried, Eidhof, Palic, Costantini, Huisman-van Dijk, Bockting, Engelhard, Armour, Nielsen and Karstoft2018). In this study, the optimal value of this penalty was achieved by k-fold cross-validation. A detailed explanation of FGL and its use in psychological networks is given elsewhere (Danaher et al., Reference Danaher, Wang and Witten2014; Fried et al., Reference Fried, Eidhof, Palic, Costantini, Huisman-van Dijk, Bockting, Engelhard, Armour, Nielsen and Karstoft2018; Costantini et al., Reference Costantini, Richetin, Preti, Casini, Epskamp and Perugini2019). The similarity of networks was assessed by calculating the Spearman correlation of edge-weights between each pair of networks (Borsboom, Reference Borsboom2017).
The relative importance of questionnaire items is subsequently evaluated using measures from graph theory, using typical centrality indices such as strength, closeness and betweenness (Newman, Reference Newman2010). A strong central node (item) (Barrat et al., Reference Barrat, Barthelemy, Pastor-Satorras and Vespignani2004) is one that can influence many other nodes (or be influenced by them) directly, without considering the mediating role of other nodes (Costantini et al., Reference Costantini, Epskamp, Borsboom, Perugini, Mõttus, Waldorp and Cramer2015). As such, strength is the crucial index for identification of items for developing the most effective interventions. Nodes with high closeness (defined as the inverse of the sum of distances of the focal node to all other nodes in the network) are those whose responses are likely to be quickly affected by changes in other nodes, either directly or indirectly. If nodes with high betweenness are removed from a network, then the distance among other nodes will generally increase (Costantini et al., Reference Costantini, Epskamp, Borsboom, Perugini, Mõttus, Waldorp and Cramer2015). As such, nodes with high betweenness speed up the flow of information in networks.
Lack of accuracy and network stability have been recognised as an important issue in psychological networks (Forbes et al., Reference Forbes, Wright, Markon and Krueger2017; Epskamp et al., Reference Epskamp, Borsboom and Fried2018). Thus, bootstrapping procedures have been developed for psychological networks to address this issue and prevent biased inferences about the importance of individual nodes (Epskamp et al., Reference Epskamp, Borsboom and Fried2018). To evaluate accuracy and stability, we have followed recommendations made by Epskamp et al. (Reference Epskamp, Borsboom and Fried2018). They proposed the correlation stability (CS) coefficient to investigate the stability of the order of centrality indices after observing only portions of the data. Its computation is based on case dropping bootstrap methods. The CS coefficient can be interpreted as the maximum proportion of cases that can be dropped, such that with 95% probability, the correlation between the original centrality indices and the centrality of networks based on subsets is 0.7 or higher [this figure can be changed but is taken as a default based on a simulation study by Epskamp et al. (Reference Epskamp, Borsboom and Fried2018)]. This coefficient should not drop below 0.25 and should ideally be above 0.5 to justify robust interpretation of centrality indices.
Functions from the R (R Core Team, 2017) packages ‘qgraph’ (Epskamp et al., Reference Epskamp, Cramer, Waldorp, Schmittmann and Borsboom2012), ‘EstimateGroupNetwork’ (Costantini and Epskamp, Reference Costantini and Epskamp2017) and ‘mgm’ (Haslbeck and Waldorp, Reference Haslbeck and Waldorp2016) were used to estimate the network graphs. Given that the WEMWBS items are ordinal, polychoric correlations are used in the input weight matrix. The resulting networks were plotted using the spring layout (Fruchterman and Reingold, Reference Fruchterman and Reingold1991) where more related edges are plotted closer together. Bootstrapping of networks was accomplished using the R package ‘bootnet’ (Epskamp et al., Reference Epskamp, Borsboom and Fried2018). To assess network differences (global network strength, edges) with respect to gender, permutation tests implemented in the package ‘NetworkComparisonTest’ (van Borkulo et al., Reference van Borkulo, Sacha and Millner2016) were used with 5000 iterations. All p values were corrected for multiple testing (using Holm–Bonferroni correction), where applicable.
Ethical approvals
Ethical approval was not required for the present secondary data analysis.
Results
Table 1 shows the basic item descriptive statistics for each cohort.
WEMWBS item labels, wording and item means (standard deviations) across samples

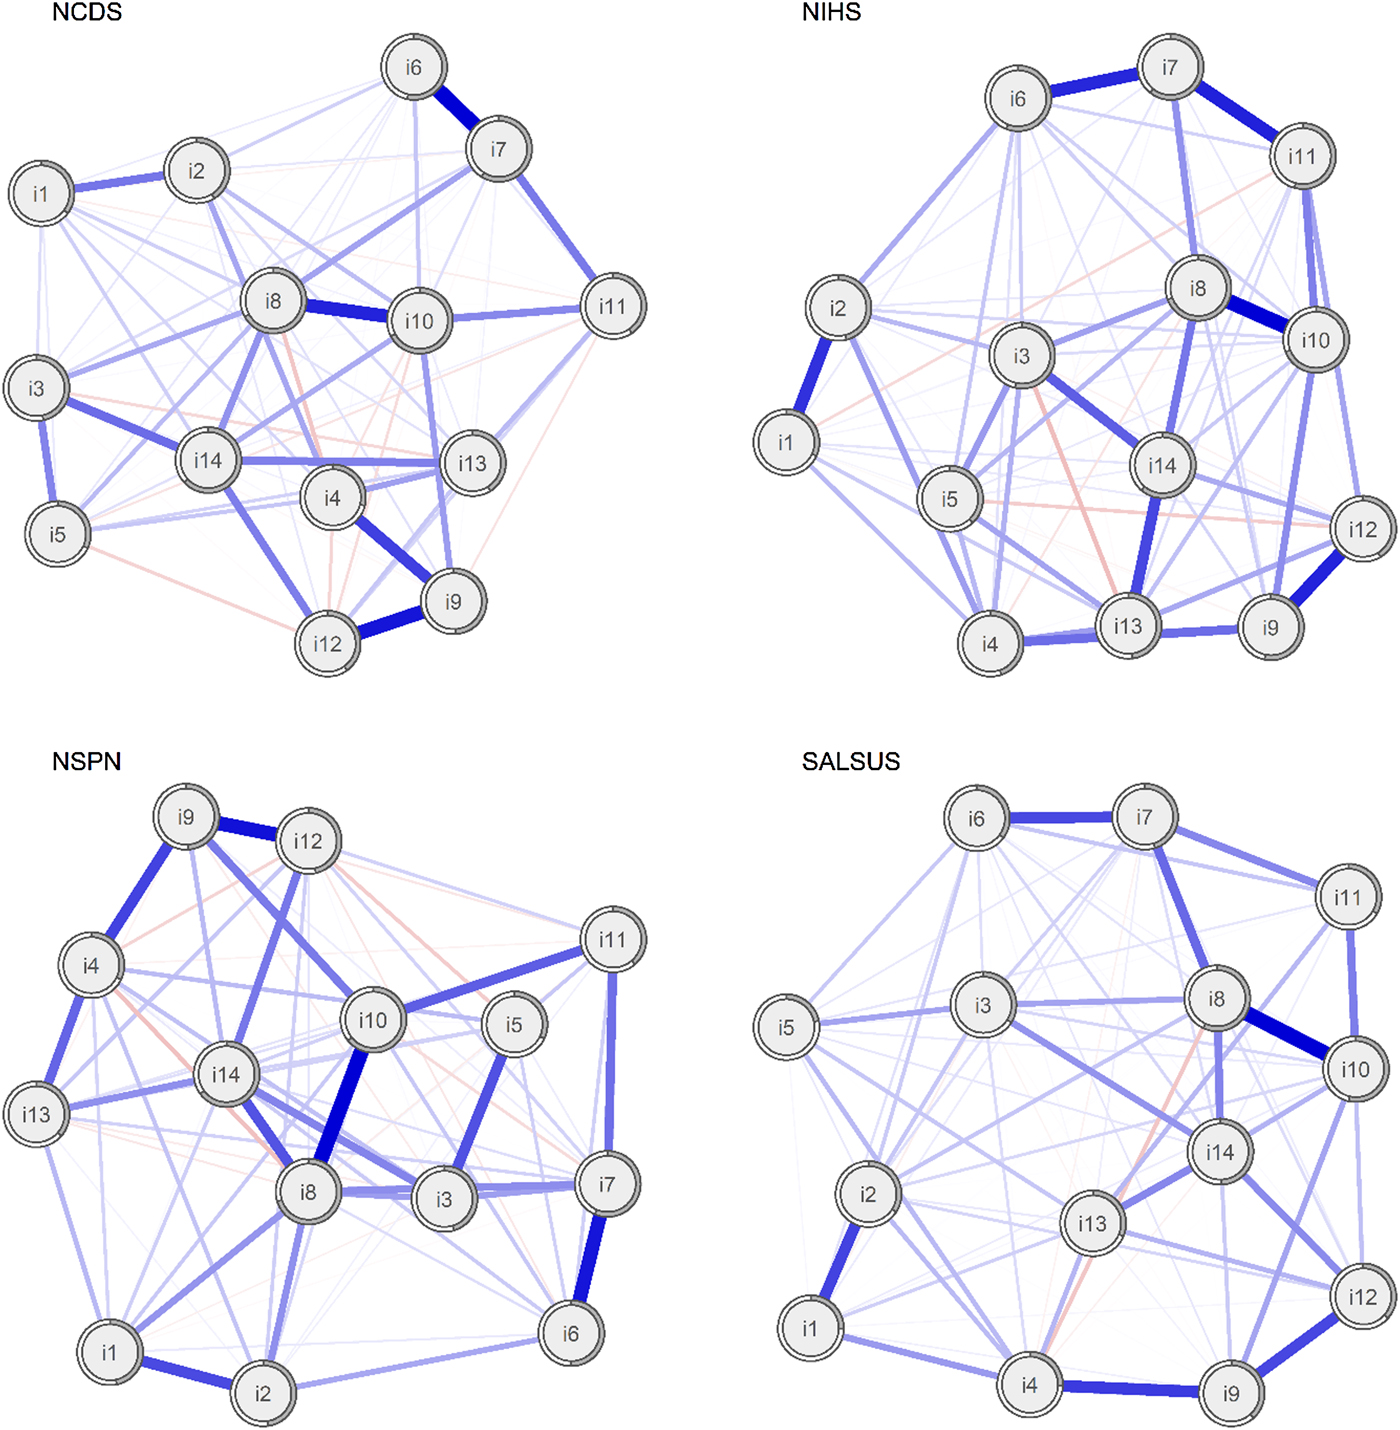
Estimated networks are shown in Fig. 1. Visual comparison reveals similarities across them: for example, items 8 (I have been feeling good about myself) and 14 (I have been feeling cheerful) are always central. Item 10 (I have been feeling confident) seems to have a more prominent role in both the older (NCDS) and younger adult (NSPN) cohorts. Conversely, items such as 1 (I have been feeling optimistic about the future), 2 (I have been feeling useful) and 5 (I have had energy to spare) are generally on the periphery of the networks and less connected with other items. The formal comparison of networks (using a permutation test) revealed statistically significant differences in global network strength between NCDS and SALSUS (network strength NCDS = 6.75, network strength SALSUS = 6.23, p < 0.001) and also between NIHS and SALSUS (network strength NIHS = 6.54, network strength SALSUS = 6.23, p = 0.002). On average, around six edges between each pair of networks are statistically different. Information about significant differences in edge-weights is available from the authors upon request. We formally compare centrality indices later in this paper.
Networks of WEMWBS items in four general population samples. Nodes represent WEMWBS items and edges partial correlations with LASSO penalty. Distances between nodes and the thickness of edges relate to the size of their partial correlations. Grey doughnut charts surrounding each node show its explained variance.
Comparison of edge-weights and their accuracy
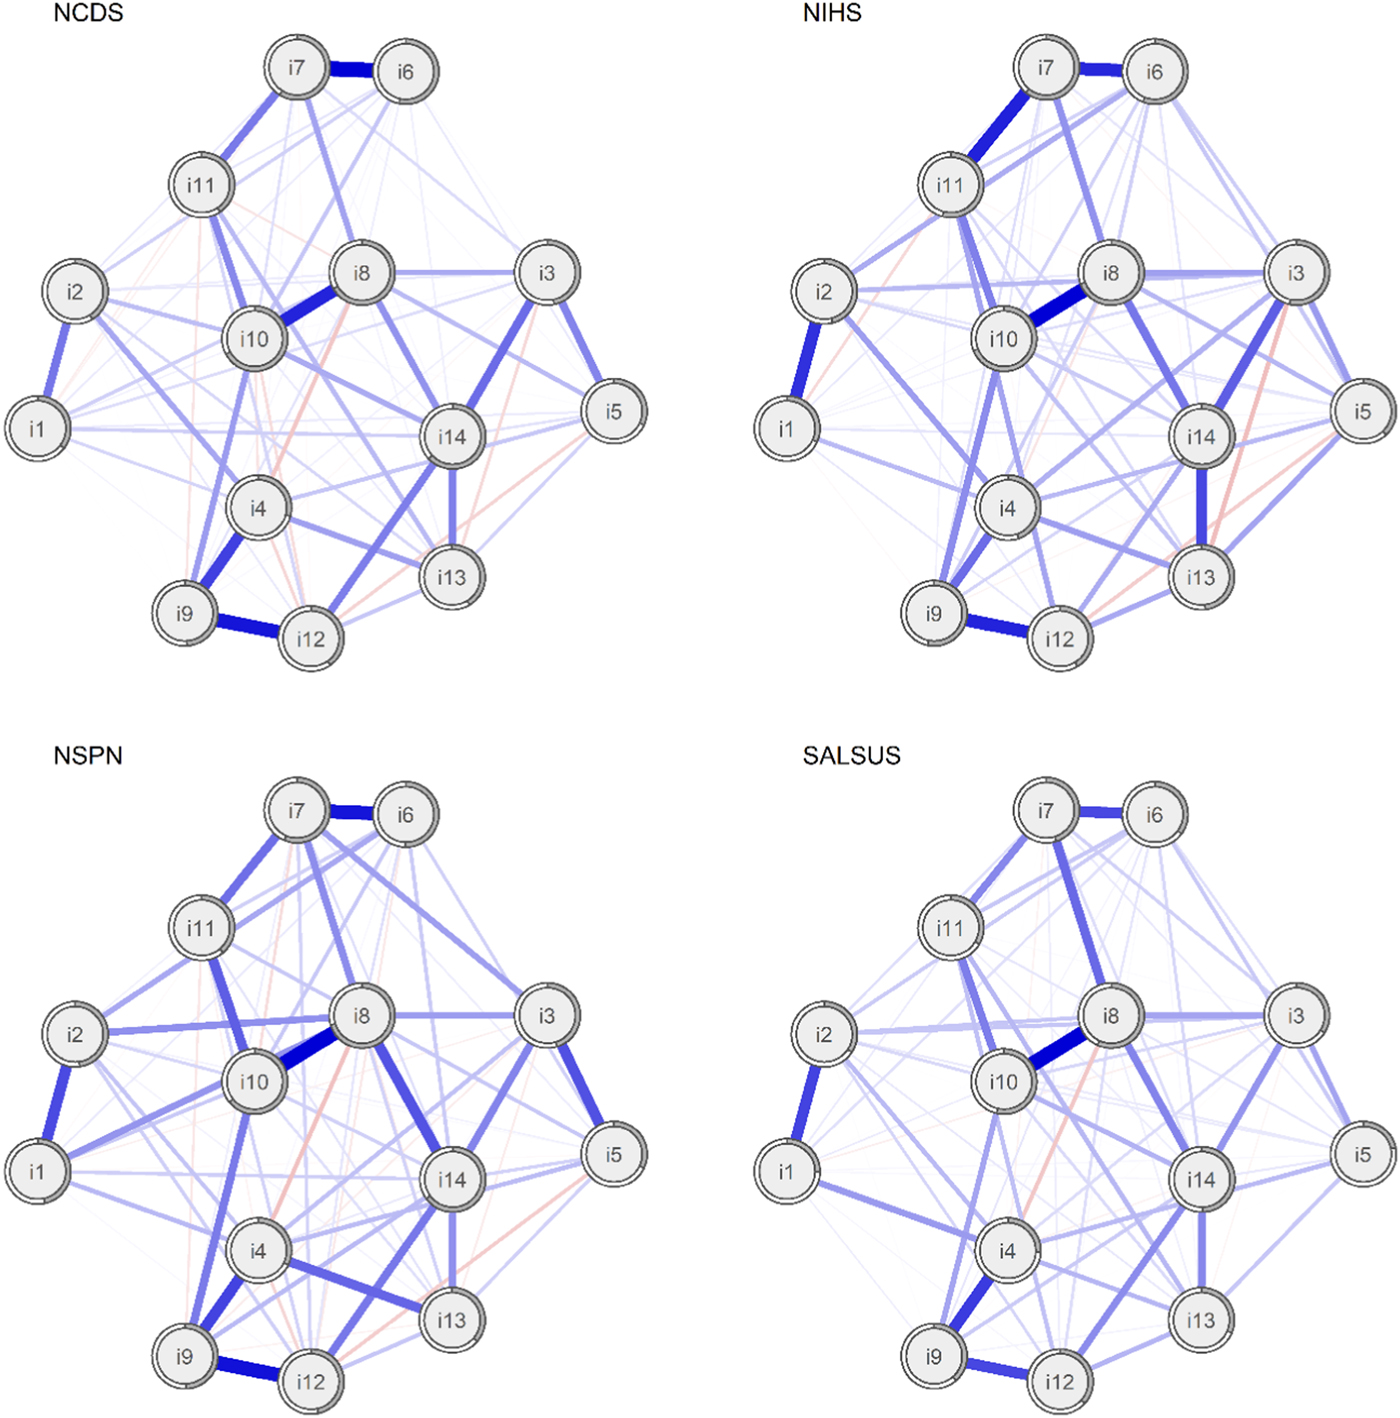
To improve visual comparability of edges, we also estimated the average layout of these four networks and plotted all networks using this layout (see Fig. 2). The patterns of relationships among items are similar across samples. Items 8 and 10, which evaluate self-perception, are highly related. The same holds for items 4, 9 and 12, which assess relationships with other people, and items 6, 7 and 11, which deal with processing ideas and problems. It is less clear why items 1 (I have been feeling optimistic about the future) and 2 (I have been feeling useful) are related.
Networks of WEMWBS items in four general population samples using average spring layout. Nodes represent WEMWBS items and edges partial correlations with LASSO penalty. Distances among nodes and thickness of edges relate to size of their partial correlations. Grey doughnut charts surrounding each node show its explained variance.
The visual similarity of networks was confirmed by investigating Spearman correlations of edge-weights for all pairs of networks, presented in online Supplementary Table S1. They ranged from 0.75 to 0.87, suggesting high similarity across networks.
Online Supplementary Fig. S1 depicts point estimates and bootstrap confidence intervals of the edge values for each network. In general, confidence intervals suggest that the accuracy of edges is satisfactory. As expected, the confidence intervals are smaller in larger samples.
Centrality indices and their stability
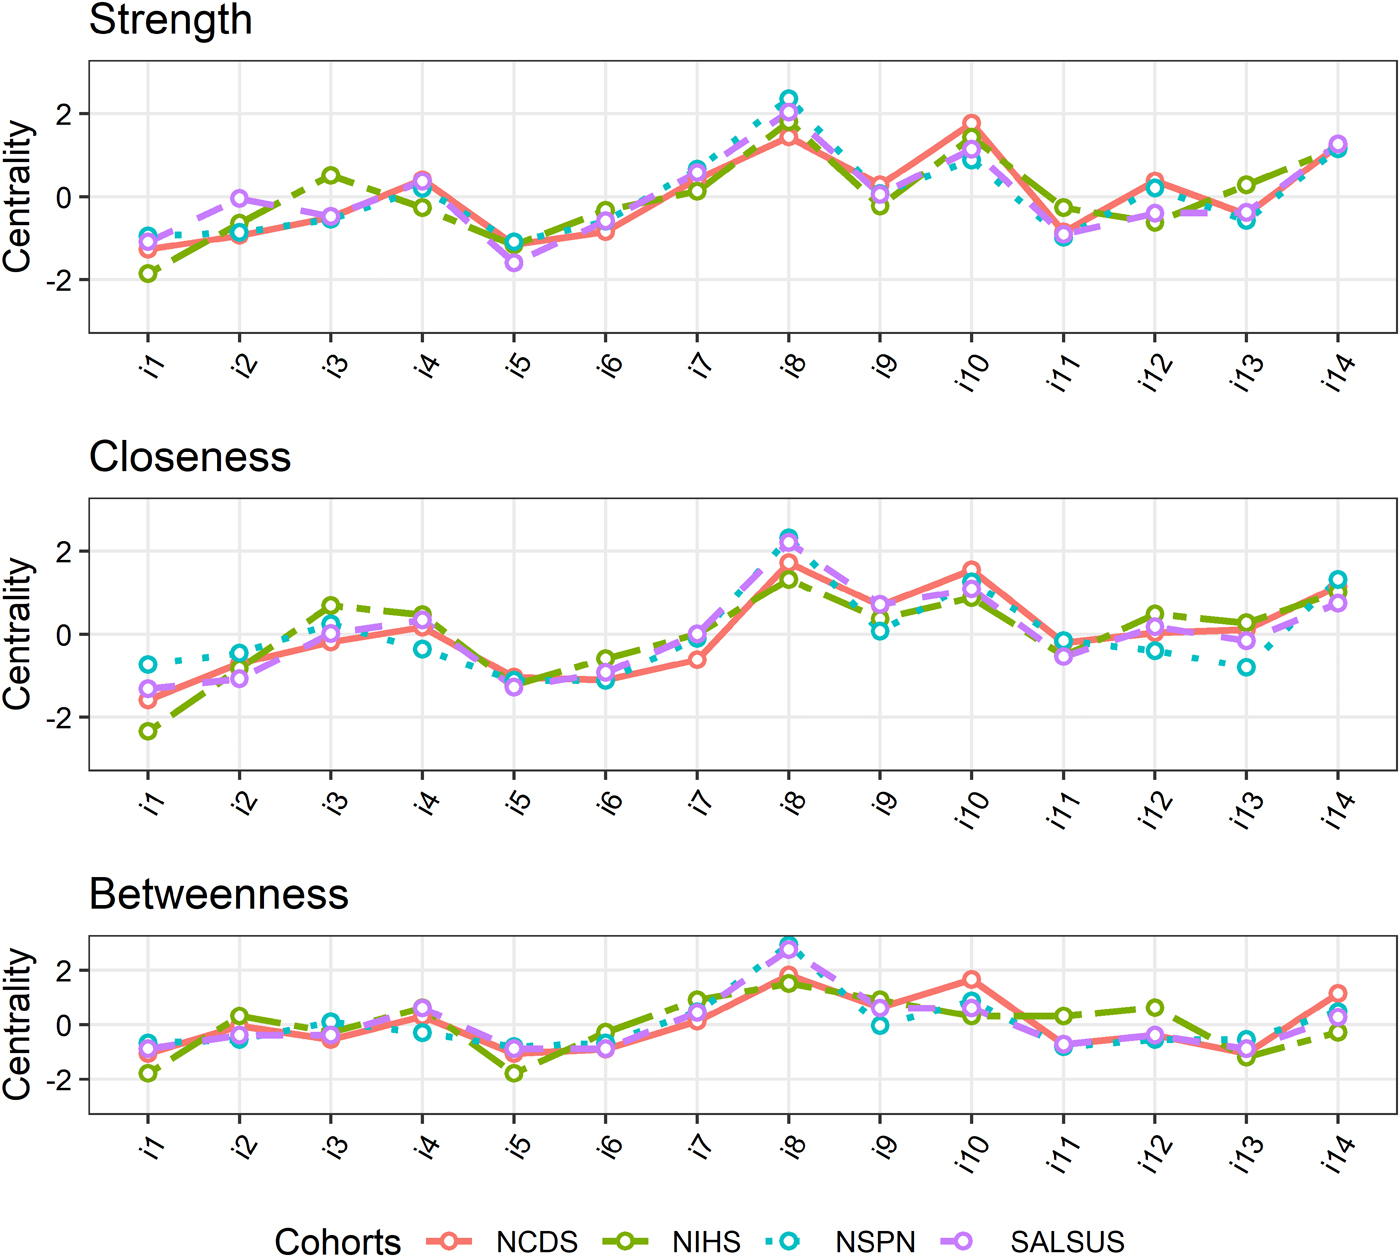
Standardised centrality indices for each item, computed for each network, are shown in Fig. 3. The indices are remarkably similar across all networks. With respect to strength and closeness, the three most central items across all networks are items 8, 10 and 14. Betweenness of these three items is also highest in NCDS and NSPN. The top three betweenness items in NIHS are items 8, 7 and 9. In SALSUS, the top betweenness item is item 8 but next highest betweenness is indistinguishable for items 4, 9 and 10. These results suggest that the wellbeing intervention targets (as measured by strength) replicate well across cohorts. The same holds for closeness. Mediating items which speed up influence of changes in the network (betweenness) vary only slightly across cohorts.
Centrality indices across cohorts.
Stability of the centrality indices was assessed using the case dropping bootstrap (Epskamp et al., Reference Epskamp, Borsboom and Fried2018). The results from are plotted in online Supplementary Fig. S2, and corresponding CS coefficients are given in Table 2.
Correlation stability coefficients
These results show that closeness and strength are very stable (even with only 25% of cases, the order of centrality indices has not considerably changed). Betweenness is slightly less stable, but apart from NIHS sample, its confidence intervals are still above the recommended cut-off of 0.5. Therefore, betweenness in NIHS should be interpreted with caution.
Gender differences
Network structures, and thus wellbeing intervention targets, might be different for men and women. We have therefore tested for statistically significant gender differences in global network strength and edge-weights. Regardless of cohort, there were no statistically significant differences by gender in global network strength (p values: NCDS = 0.163; NIHS = 0.422; NSPN = 0.696; SALSUS = 0.474). No differences in edge-weights were found in the NIHS or NSPN cohorts. In NCDS, a significant difference between men and women was found for the edge between items 8 and 10 (0.33 for men, 0.45 for women, p = 0.035). This suggests the link between item 8 (feeling good about oneself) and item 10 (feeling confident) is stronger for middle-aged women than for middle-aged men. Even in the very large SALSUS cohort (n = 32 725), only six edges (out of 91) were significantly different between men and women [p(item 8, item 9) < 0.001; p(item 8, item 10)<0.001; p(item 2, item 10) < 0.001; p(item 7, item 10) < 0.001; p(item 8, item 14) < 0.001; p(item 9, item 14) = 0.017]. In this cohort, links between (1) item 8 (feeling good about oneself) and item 10 (feeling confident) and (2) item 9 (feeling close to others) and item 14 (feeling cheerful) were stronger for women than for men. Conversely, links between (1) item 2 (feeling useful) and item 10 (feeling confident), (2) item 7 (thinking clearly) and item 10 (feeling confident), (3) item 8 (feeling good about oneself) and item 9 (feeling close to others), and (4) item 8 (feeling good about oneself) and item 14 (feeling cheerful) were all stronger for men than for women. On the whole, the relatively small number of significantly different edges suggests that gender differences in these wellbeing networks are minimal.
Discussion
This study aimed to identify the central aspects of psychological wellbeing, which may thus be considered as important intervention targets. Score improvements on these items should have the largest positive impact on other aspects of psychological wellbeing. To find these keystones, we used psychological network analysis to identify the most central items within graph networks created from a well-established psychological wellbeing measure (WEMWBS). The WEMWBS data were obtained from four major UK cohorts varying with respect to age [young people (SALSUS), adolescents and young adults (NSPN), general adult population (NIHS) and middle-aged adults (NCDS)] and location (England, Northern Ireland and Scotland).
Generally, results were consistent across cohorts. Edge-weights showed very similar patterns across cohorts and were accurate enough to make valid inferences about network architecture. This suggests high replicability of the network structure and high generalisability of findings across ages and geographical locations within the UK.
To highlight optimal targets that maximise intervention effectiveness, the most important items are those central to a network. The top three items, as measured by strength are items 8 (I have been feeling good about myself), 10 (I have been feeling confident) and 14 (I have been feeling cheerful). This suggests that positive self-perception and cheerfulness may play the most important role in influencing other aspects of psychological wellbeing. Due to the undirected character of the network, it is not surprising that these items demonstrate the highest levels of closeness, indicating that they are easily influenced by other network nodes. The least influential items vary slightly across samples, but often include items 1 (I have been feeling optimistic about the future), 5 (I have had energy to spare), 6 (I have been dealing with problems well) and 11 (I have been able to make up my own mind about things). This suggests that improving upon processing problems, energy and future expectations may have the smallest effect on other aspects of wellbeing.
These inferences seem to be robust given the high stability of centrality indices. Apart from betweenness in the NIHS cohort (which has questionable interpretability due to poor stability), all other CS coefficients were above the recommended criteria of 0.50 (Epskamp et al., Reference Epskamp, Borsboom and Fried2018).
Gender differences in network architecture (global strength, size of edges) were also assessed to determine if intervention targets might differ for men and women. Omnibus tests of global network strength suggested no gender differences in any sample. Given there was only a total of seven edge differences by gender across all four cohorts, our results suggest that intervention targets are unlikely to differ by gender.
Strengths and limitations
A key strength of this study is that it utilises a number of cohorts, addressing the considerable concern about the replicability crisis in network literature (Forbes et al., Reference Forbes, Wright, Markon and Krueger2017). In addition, the considered cohorts are large and cover a wide range of age and geographical locations, supporting the generalisability of findings.
A substantial limitation is the use of cross-sectional data, which constrains network analysis to undirected networks. Using undirected networks in turn limits inferences about the direction of influence. Although presented network edges can be interpreted as putative causal paths, it is equally likely that influence flows from A to B as from B to A (other scenarios are also possible including mediation by another node C). Indeed, it seems plausible that feeling good about yourself (item 8), being confident (item 10) and feeling cheerful (item 14) might be the consequence rather than cause of other aspects of wellbeing considered here (e.g. feeling relaxed, loved by others or thinking positively about the future). An intervention affecting only the end-points of a causality chain, as in this scenario, is likely to have only limited, if any, the impact on mental wellbeing (Fried et al., Reference Fried, Eidhof, Palic, Costantini, Huisman-van Dijk, Bockting, Engelhard, Armour, Nielsen and Karstoft2018). Experimental studies that intervene directly on the central symptoms are therefore needed to test whether this would indeed affect other symptoms in an expected way (Fried and Cramer, Reference Fried and Cramer2017).
Additionally, as clearly described in Fried et al. (Reference Fried, Eidhof, Palic, Costantini, Huisman-van Dijk, Bockting, Engelhard, Armour, Nielsen and Karstoft2018), there are at least two other reasons why using central items as intervention targets should be considered with caution. First, feedback loops, which are difficult to detect in undirected networks, can make central items the most resilient to change. Second, peripheral items should not automatically be regarded as clinically unimportant; their importance should be also considered based on substantive clinical arguments. However, despite all these limitations, Fried et al. (Reference Fried, Eidhof, Palic, Costantini, Huisman-van Dijk, Bockting, Engelhard, Armour, Nielsen and Karstoft2018, p. 11) conclude, ‘If we had to put our money on selecting a clinical feature as an intervention target in the absence of all other clinical information, […] choosing the most central node might be a viable heuristic.’
Implications for practice
Our findings have implications for the design of national mental health and wellbeing strategies for all ages. Positive self-perception and confidence in children and young people could be improved effectively at schools (e.g. bullying prevention programmes) or at home (e.g. positive parenting programmes), and in adults at the workplace (e.g. through regular training and supervision; fostering positive and supporting working environments). Indeed, the UK government expects schools and employers to play active roles in promoting population mental health and wellbeing (Department of Health and Social Care, 2011). Furthermore, although our findings are based on general population samples, they may be useful for providing care for people seeking treatment for mental disorders. Since evidence suggests that psychological wellbeing and mental ill health exist on a continuum (Caspi et al., Reference Caspi, Houts, Belsky, Goldman-Mellor, Harrington, Israel, Meier, Ramrakha, Shalev, Poulton and Moffitt2014; Stochl et al., Reference Stochl, Khandaker, Lewis, Perez, Goodyer, Zammit, Sullivan, Croudace and Jones2015; Böhnke and Croudace, Reference Böhnke and Croudace2016; St Clair et al., Reference St Clair, Neufeld, Jones, Fonagy, Bullmore, Dolan, Moutoussis, Toseeb and Goodyer2017), it is likely that improving wellbeing in mentally unwell individuals may also lead to improvements in their clinical symptoms. Finally, our analysis may also have implications for the development and trialling of psychological therapies as they indicate that interventions that focus on improving self-esteem and confidence may be more effective in increasing overall wellbeing than those that do not focus on these qualities.
Conclusions
In conclusion, our study shows that the most worthwhile intervention targets for improvement of psychological wellbeing are aspects related to positive self-perception and positive mood. Regardless of gender, their improvement is likely to have a positive impact on the remaining aspects of psychological wellbeing, either directly or indirectly.
Supplementary material
The supplementary material for this article can be found at https://doi.org/10.1017/S0033291718003288
Author ORCIDs
J. Stochl https://orcid.org/0000-0002-9693-9930
Acknowledgements
The authors would like to thank Michele Atiemo for her comments on early versions of this paper.
Financial support
The NSPN study was supported by the Wellcome Trust Strategic Award (095844/Z/11/Z). JS, APW and PBJ received support from the NIHR Collaboration for Leadership in Applied Health Research and Care (CLAHRC) East of England (EoE). The views expressed are those of the authors and not necessarily those of the NHS, the NIHR or the Department of Health. GMK is supported by an Intermediate Clinical Fellowship from the Wellcome Trust (201486/Z/16/Z). JS is partly supported by research program Progres from Charles University.
Conflict of interest
None.


 Open access