


I. INTRODUCTION
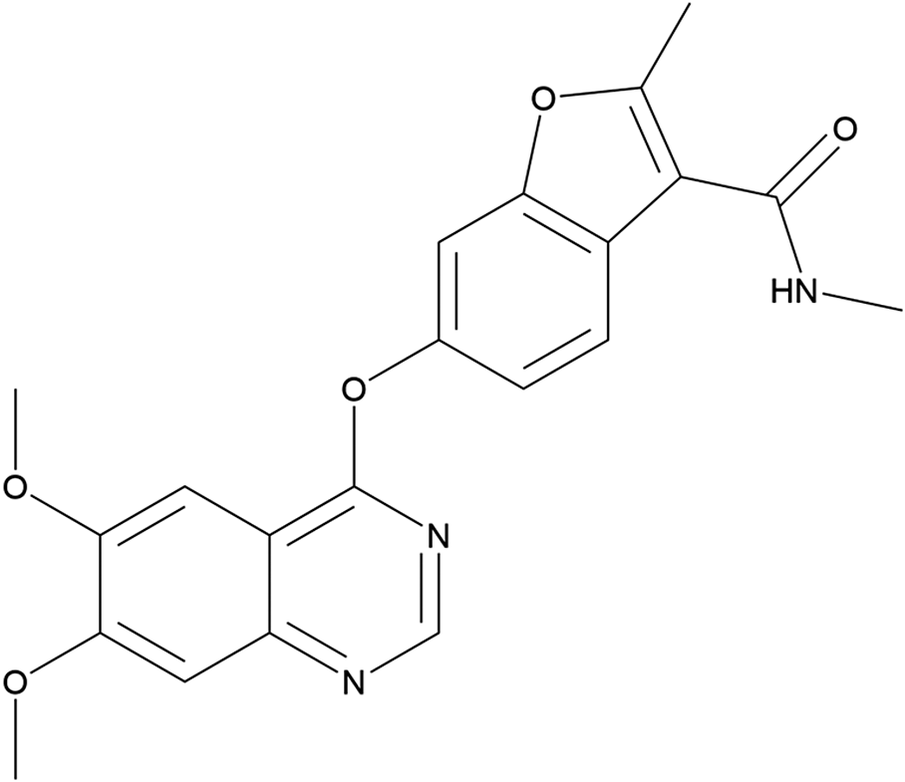
Fruquintinib (sold under the brand name Fruzaqla) is a kinase inhibitor taken as an oral medication used for the treatment of colorectal cancer (Zhou et al., Reference Zhou, Yang, Grinshpun, Taylor, Strong, Dasari and Wang-Gillam2025). It functions by blocking blood vessels from forming in the cancerous tumor, thus preventing nutrients and oxygen from reaching the tumor. The systematic name (CAS Registry Number 1194506-26-7) is 6-(6,7-dimethoxyquinazolin-4-yl)oxy-N,2-dimethyl-1-benzofuran-3-carboxamide (PubChem; Kim et al., Reference Kim, Chen, Cheng, Gindulyte, He, He and Li2023). A two-dimensional molecular diagram of fruquintinib is shown in Figure 1.
The two-dimensional molecular structure of fruquintinib.

U.S. Patent Application US 2021/10155613 (Sheng and Sheng, Reference Sheng and Sheng2018; Hangzhou SoliPharma Co. Ltd.) teaches that Chinese Patent CN105461702A (Wu et al., Reference Wu, Li and Chu2016; Hutchmed Ltd.) disclosed six crystalline forms of fruquintinib. Forms I, III, and VII were anhydrous. Form II was a hemi-ethanol solvate, Form IV was a monoacetic acid solvate, and Form VIII was a mono dioxane solvate. This patent application cites three other Chinese applications (CN105777721A, Yu et al., Reference Yu, Chen and Yi2016a; CN105777722A, Yu et al., Reference Yu, Chen and Yi2016b; and CN105777723A, Yu et al., Reference Yu, Chen and Yi2016c; Shanghai Xuanchuang Biological Science & Technology Co Ltd.) which claim anhydrous crystalline Forms A, C, and B of fruquintinib. These are “substantially consistent” with Forms I, III, and I. The US application claims and reports atom coordinates for a co-crystal of fruquintinib and saccharin and is equivalent to International Patent Application WO 2019/183916 (Sheng and Sheng, Reference Sheng and Sheng2019). The international application reports an X-ray powder diffraction pattern of the known fruquintinib prepared according to the method of Chinese Patent CN105461702A.
This work was carried out as part of a project (Kaduk et al., Reference Kaduk, Crowder, Zhong, Fawcett and Suchomel2014) to determine the crystal structures of large-volume commercial pharmaceuticals and include high-quality powder diffraction data for them in the Powder Diffraction File (Kabekkodu et al., Reference Kabekkodu, Dosen and Blanton2024).
II. EXPERIMENTAL
Fruquintinib was a commercial reagent, purchased from TargetMol (Batch #T2656) and was used as received. The white powder was packed into a 0.5-mm diameter Kapton capillary and rotated during the measurement at ~2 Hz. The powder pattern was measured at 298(1) K at the Wiggler low-energy beamline (Leontowich et al., Reference Leontowich, Gomez, Moreno, Muir, Spasyuk, King, Reid, Kim and Kycia2021) of the Brockhouse X-ray diffraction and scattering sector of the Canadian Light Source using a wavelength of 0.819563(2) Å (15.1 keV) from 1.6 to 75.0° 2θ with a step size of 0.0025° and a collection time of 3 minutes. The high-resolution powder diffraction data were collected using eight Dectris Mythen2 X series 1 K linear strip detectors. NIST SRM 660b LaB6 was used to calibrate the instrument and refine the monochromatic wavelength used in the experiment.
The pattern exhibits significant specimen broadening and limited angular range of Bragg peaks and was difficult to index. Using 21 peaks, DICVOL14 (Louër and Boultif, Reference Louër and Boultif2014) suggested a primitive monoclinic unit cell with a = 13.462, b = 3.936, c = 17.696 Å, β = 107.999°, V = 891.76 Å3, and Z = 2. FOX (Favre-Nicolin and Černý, Reference Favre-Nicolin and Černý2002) suggested space group P21. A fruquintinib molecule was downloaded from PubChem (Kim et al., Reference Kim, Chen, Cheng, Gindulyte, He, He and Li2023) as Conformer3D_COMPOUND_CID_44480399.sdf. It was converted to a *.mol2 file using Mercury (Macrae et al., Reference Macrae, Sovago, Cottrell, Galek, McCabe, Pidcock and Platings2020) and into a Fenske–Hall Z-matrix using OpenBabel (O’Boyle et al., Reference O’Boyle, Banck, James, Morley, Vandermeersch and Hutchison2011). The crystal structure could be solved using FOX, but refinement yielded R wp ∼ 9.9% and several large U iso (>0.25 Å2).
Using 31 peaks to index the pattern with DICVOL14 yielded a monoclinic cell with approximately 2a, b, 2c, and β of the original cell. (Other cells with larger b-axes were also obtained, but these yielded structures containing voids. This is an example of a short-axis indexing problem (Louër and Boultif, Reference Louër and Boultif2014). FOX suggested the space group C2, so this cell was used to solve the structure, using 2 molecules as fragments and (010) preferred orientation. This model yielded a better fit to the pattern and is chemically reasonable, even though it is slightly higher in lattice energy than the P21 structure.
Rietveld refinement was carried out with GSAS-II (Toby and Von Dreele, Reference Toby and Von Dreele2013). Only the 2.0–50.0° portion of the pattern was included in the refinements (d min = 0.969 Å). The y-coordinate of O1 was fixed to define the origin. All non-H bond distances and angles were subjected to restraints, based on a Mercury/Mogul Geometry Check (Bruno et al., Reference Bruno, Cole, Kessler, Luo, Motherwell, Purkis and Smith2004; Sykes et al., Reference Sykes, McCabe, Allen, Battle, Bruno and Wood2011). The Mogul average and standard deviation for each quantity were used as the restraint parameters. The quinazoline and benzofuran ring systems were restrained to be planar. The restraints contributed 13.5% to the overall χ2. The hydrogen atoms were included in calculated positions, which were recalculated during the refinement using Materials Studio (Dassault Systèmes, 2023). Most of the U iso of the heavy atoms refined to slightly negative values, so they were fixed at reasonable values. The U iso for the H atoms were fixed at 1.3× the U iso of the heavy atoms to which they are attached. The peak profiles were described using the generalized (Stephens, Reference Stephens1999) microstrain model. A fourth-order spherical harmonic model was included for the preferred orientation. The background was modeled using a 6-term shifted Chebyshev polynomial, with peaks at 2.98 and 10.16° to model the narrow and broad scattering from the Kapton capillary and any amorphous component.
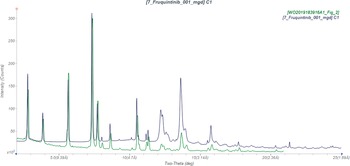
The final refinement of 207 variables using 29,201 observations and 160 restraints yielded the residual R wp = 0.05561. The largest peak (1.42 Å from C66) and hole (2.04 Å from C61) in the difference Fourier map were 0.42(9) and − 0.36(9) eÅ−3, respectively. The final Rietveld plot is shown in Figure 2. The largest features in the normalized error plot are in the shapes of some of the strong low-angle peaks. A Le Bail fit of the pattern yielded R wp = 0.04271, showing that the Rietveld fit is acceptable by this measure.
The Rietveld plot for fruquintinib Form I. The blue crosses represent the observed data points, and the green line is the calculated pattern. The cyan curve is the normalized error plot, and the red line is the background curve. The blue tick marks indicate the fruquintinib peak positions. The vertical scale has been multiplied by a factor of 10× for 2θ > 18.0̊.

The crystal structure of fruquintinib was optimized (fixed experimental unit cell) with density functional theory techniques using Vienna ab initio simulation package (VASP) (Kresse and Furthmüller, Reference Kresse and Furthmüller1996) through the MedeA graphical interface (Materials Design, 2024). The calculation was carried out on 32 cores of a 144-core (768 Gb memory) HPE Superdome Flex 280 Linux server at North Central College. The calculation used the generalized gradient approximation of Perdew–Burke–Ernzerhof (GGA-PBE) functional, a plane wave cutoff energy of 400.0 eV, and a k-point spacing of 0.5 Å−1 leading to a 7 × 7 × 1 mesh (for the reduced cell) and took ~113 hours. Single-point density functional calculations (fixed experimental cell) and population analysis were carried out using CRYSTAL23 (Erba et al., Reference Erba, Desmarais, Casassa, Civalleri, Donà, Bush and Searle2023). (fixed experimental cell) and population analysis was carried out using CRYSTAL17 (Dovesi et al., Reference Dovesi, Erba, Orlando, Zicovich-Wilson, Civalleri, Maschio, Rerat, Casassa, Baima, Salustro and Kirtman2018). The basis sets for the H, C, N, and O atoms in the calculation were those of Gatti et al. (Reference Gatti, Saunders and Roetti1994). The calculations were run on a 3.5-GHz PC using 10 k-points (SHRINK 3 3) and the Becke, 3-parameter, Lee–Yang–Parr (B3LYP) functional and took ∼6.6 hr.
III. RESULTS AND DISCUSSION
This synchrotron powder pattern of fruquintinib matches the laboratory powder diffraction pattern reported by Sheng and Sheng (Reference Sheng and Sheng2019) (Figure 3) well enough to conclude that they represent the same material and that our material is Form I.
Comparison of the synchrotron pattern of fruquintinib (black) to that reported for Form I by Sheng and Sheng (Reference Sheng and Sheng2019) (green). The literature pattern (measured using Cu Kα radiation) was digitized using UN-SCAN-IT (Silk Scientific, 2013) and converted to the synchrotron wavelength of 0.819563(2) Å using JADE Pro (MDI, 2024). Image generated using JADE Pro (MDI, 2024).

The root-mean-square (rms) difference of the non-H atoms in the Rietveld-refined and VASP-optimized structures, calculated using the Mercury CSD-Materials/Search/Crystal Packing Similarity tool, is 0.448 Å. The rms Cartesian displacement of the non-H atoms in the Rietveld-refined and VASP-optimized structures of molecule 1 and molecule 2, calculated using the Mercury Calculate/Molecule Overlay tool, are 0.557 and 0.342 Å, respectively (Figures 4 and 5). The agreements are slightly outside the normal range for correct structures (van de Streek and Neumann, Reference van de Streek and Neumann2014), and the largest differences are on the peripheries of the molecules. Given the broad peaks, the limited angular range of the peaks, and the significant texture, we might expect the disparity in agreements to be larger than normal. The structure fits the data and is sufficient for phase identification and quantitative phase analysis; we present this structure here as our best attempt after many poorer models. The asymmetric unit is illustrated in Figure 6. The remaining discussion will emphasize the VASP-optimized structure.
Comparison of the Rietveld-refined (red) and VASP-optimized (blue) structures of fruquintinib molecule 1. The root-mean-square Cartesian displacement is 0.557 Å. Image generated using Mercury (Macrae et al., Reference Macrae, Sovago, Cottrell, Galek, McCabe, Pidcock and Platings2020).

Comparison of the Rietveld-refined (red) and VASP-optimized (blue) structures of fruquintinib molecule 2. The root-mean-square Cartesian displacement is 0.342 Å. Image generated using Mercury (Macrae et al., Reference Macrae, Sovago, Cottrell, Galek, McCabe, Pidcock and Platings2020).

The asymmetric unit of fruquintinib Form I, with the atom numbering. The atoms are represented by 50% probability spheroids. Image generated using Mercury (Macrae et al., Reference Macrae, Sovago, Cottrell, Galek, McCabe, Pidcock and Platings2020).

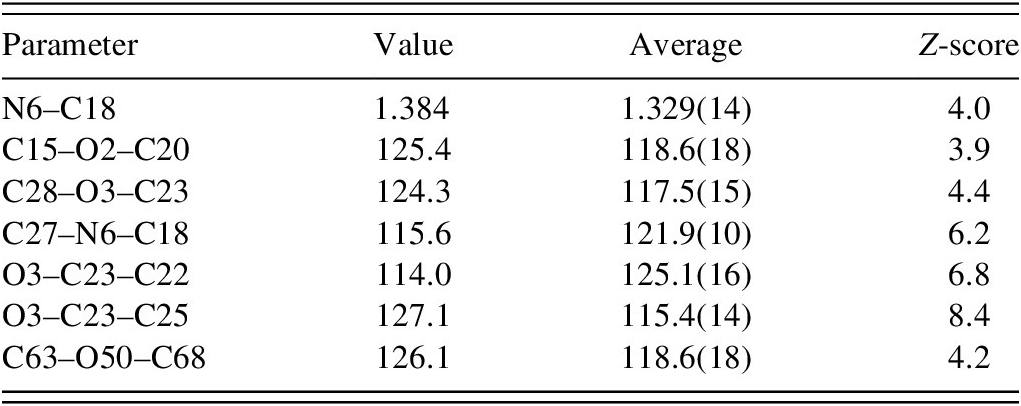
The two crystallographically independent molecules have different conformations (Figure 7). The rms Cartesian displacement is 1.282 Å and can be decreased to 0.853 Å by inverting one of the molecules. The major differences are in the conformations of one of the methoxy groups and the amide side chains. Most of the bond distances, bond angles, and torsion angles fall within the normal ranges indicated by a Mercury/Mogul Geometry check (Macrae et al., Reference Macrae, Sovago, Cottrell, Galek, McCabe, Pidcock and Platings2020). The unusual bond distances and angles are summarized in Table I. The standard uncertainties on several of the averages are low, inflating the Z-scores. Torsion angles involving rotation about the O2-C15 and O50-C63 bonds lie on the tails of broad distributions. Torsion angles involving rotation about the O2-C20 bond lie on the tails of narrow distributions. Torsion angles about the O3-C23 bond of a methoxy group in molecule 1 are truly unusual. With this methoxy group in a more-normal orientation, there would be intermolecular collisions. Both molecules are slightly unusual, but molecule 1 is more unusual than molecule 2.
Comparison of molecule 1 (green) and molecule 2 (orange) of fruquintinib Form I. Image generated using Mercury (Macrae et al., Reference Macrae, Sovago, Cottrell, Galek, McCabe, Pidcock and Platings2020).

Unusual (Mogul) bond distances and angles in the VASP-optimized structure of fruquintinib

Quantum chemical geometry optimization of isolated fruquintinib molecules (DFT/B3LYP/6-31G*/water) using Spartan’24 (Wavefunction, 2023) indicated that the observed conformations of molecules 1 and 2 are 10 and 6 kcal/mol higher in energy than the local minima. As expected from the geometry, molecule 2 is 3.6 kcal/mol lower in energy than molecule 1 and is closer to the minimum-energy conformation. Intermolecular interactions are important to determining the solid-state conformation.
The crystal structure (Figure 8) consists of double layers of molecules 1 and 2 parallel to the ab-plane. These layers stack along the short b-axis. N–H···N hydrogen bonds link the layers. The mean planes of the quinazoline ring systems in molecules 1 and 2 are approximately (3, 1, 3) and (1, −1, 4), and the mean planes of the benzofuran ring systems are approximately (5, −3, 0) and (−1, −1, 4). The Mercury Aromatics Analyser indicates strong interactions along the short b-axis.
Crystal structure of fruquintinib Form I, viewed down the b-axis. Molecule 1 is colored green, and molecule 2 is orange. Image generated using Mercury (Macrae et al., Reference Macrae, Sovago, Cottrell, Galek, McCabe, Pidcock and Platings2020). The cyan lines indicate hydrogen bonds within an asymmetric unit, and the red lines indicate hydrogen bonds between asymmetric units.

Analysis of the contributions to the total crystal energy of the structure using the Forcite module of Materials Studio (Dassault Systèmes, 2023) indicates that the intramolecular energy is dominated by angle distortion terms, as might be expected for a molecule containing fused ring systems. The intermolecular energy is dominated by electrostatic attractions, which in this force-field-based analysis also includes hydrogen bonds. The hydrogen bonds are better discussed using the results of the DFT calculation.
There is only one classical hydrogen bond in the structure (Table II), a discrete N54-H86···N8, which links the double layers. Most of the C–H···N and C–H···O hydrogen bonds are intramolecular.
Hydrogen bonds (CRYSTAL23) in fruquintinib

a Intramolecular.
The volume enclosed by the Hirshfeld surface of fruquintinib (Figure 9; Hirshfeld, Reference Hirshfeld1977, Spackman et al., Reference Spackman, Turner, McKinnon, Wolff, Grimwood, Jayatilaka and Spackman2021) is 875.01 Å3, 98.80% of 1/4 of the unit cell volume. The packing density is thus typical. The only significant close contacts (red in Figure 9) involve the hydrogen bonds. Fingerprint plots indicate that H···H contacts make up 47.8% of the surface area, H···O contacts 10.5%, and C···C contacts 11.3%. The volume/non-hydrogen atom is smaller than usual at 15.2 Å3.
The Hirshfeld surface of fruquintinib Form I. Intermolecular contacts longer than the sums of the van der Waals radii are colored blue, and contacts shorter than the sums of the radii are colored red. Contacts equal to the sums of radii are white. Image generated using CrystalExplorer (Spackman et al., Reference Spackman, Turner, McKinnon, Wolff, Grimwood, Jayatilaka and Spackman2021).

As expected from the anisotropy of the lattice parameters, the Bravais–Friedel–Donnay–Harker (Bravais, Reference Bravais1866; Friedel, Reference Friedel1907; Donnay and Harker, Reference Donnay and Harker1937) algorithm suggests that we should expect needle morphology for fruquintinib, with [010] as the long axis (Figure 10). A fourth-order spherical harmonic model was included in the refinement. The texture index was 1.318(9), indicating that the preferred orientation was significant even in this rotated capillary specimen.
The Bravais–Friedel–Donnay–Harker morphology for fruquintinib Form I. Image generated using Mercury (Macrae et al., Reference Macrae, Sovago, Cottrell, Galek, McCabe, Pidcock and Platings2020).

DEPOSITED DATA
The powder pattern of fruquintinib from a Le Bail fit of this synchrotron dataset has been submitted to the International Centre for Diffraction Data (ICDD) for inclusion in the Powder Diffraction File. The Crystallographic Information Framework (CIF) files containing the results of the Rietveld refinement (including the raw data) and the DFT geometry optimization were deposited with the ICDD. The data can be requested at pdj@icdd.com.
ACKNOWLEDGMENTS
We thank Adam Leontowich for his assistance in the data collection. We also thank the ICDD team – Megan Rost, Steve Trimble, and Dave Bohnenberger – for their contribution to research, sample preparation, and in-house XRD data collection and verification.
FUNDING STATEMENT
Part or all of the research described in this paper was performed at the Canadian Light Source, a national research facility of the University of Saskatchewan, which is supported by the Canada Foundation for Innovation (CFI), the Natural Sciences and Engineering Research Council (NSERC), the Canadian Institute of Health Research (CIHR), the Government of Saskatchewan, and the University of Saskatchewan. This work was partially supported by the International Centre for Diffraction Data.
CONFLICTS OF INTEREST
The authors have no conflicts of interest to declare.


 Open access