
Introduction
The defence of north-western Gaul and the Germanic provinces is a key element in the transformation of the Roman West during Late Antiquity. Between the third and fifth centuries, the number of fortifications between the Seine and Rhine rapidly increased. The frontier zones along the Rhine and North Sea coasts entered a period of flux and a new system of fortifications developed in the hinterland of the limes.Footnote 1 Strongpoints, hilltop defences and new fortified towns appeared along the road and river networks, restricting and monitoring access along important transportation corridors.Footnote 2 This went hand-in-hand with a widespread settlement reorganisation of the region. Depopulation, villa transformation and urban change were all a part of this complex new defended landscape in Late Antiquity.Footnote 3
These new fortified installations are a common feature across the landscape and appear in a wide variety of morphological types in both the lowland and highland zones of north-western Europe.Footnote 4 These sites have been the subject of considerable debate since their initial identification in the mid-nineteenth century, with the role and continuity of older military bases on the Rhine limes and the relationship between new defended sites and foederati being particularly problematic.Footnote 5 New data and regional studies have created a fragmented picture of the spatial and temporal distribution of defended sites. In some regions, such as Gaule Septentrionale or the Moselle Valley, we have a good general understanding of the defensive pattern, while other areas, for example, Picardy, are much less well known.Footnote 6 Limited chronological resolutions, incomplete distribution patterns and collection biases have left us at something of an impasse — we lack an overarching examination of the evidence across different countries and regions as it currently stands. This article provides an overview of our current understanding of defended sites in Gallia Belgica, northern Lugdunensis and the Germanic provinces, covering the territory between the Seine and Rhine rivers (Fig. 1). Late antique fortifications were extremely diverse and a range of types have been recorded. This ranges from hilltop Höhensiedlungen and refuges and lowland defended enclosures to urban enceintes and large military installations, either reused or continued from earlier periods, as well as various coastal defences. The paper aims to move beyond historicising preconceptions of a response to third-century invasions or specific imperial building programmes. To achieve this, the paper examines the data on a macro-scale. It adopts a more empirical and data-driven approach, looking at known sites by period and geographical distribution and investigates both the regional and national biases in the record. The occupation trajectories of sites and the morphological nature of the defences are also considered. This builds upon recent work in the field, which has focused on developing typologies for different defensive structures.Footnote 7 This will provide a starting point for future work on fortified landscapes, allowing individual sites to be placed easily into their regional and transnational contexts.Footnote 8
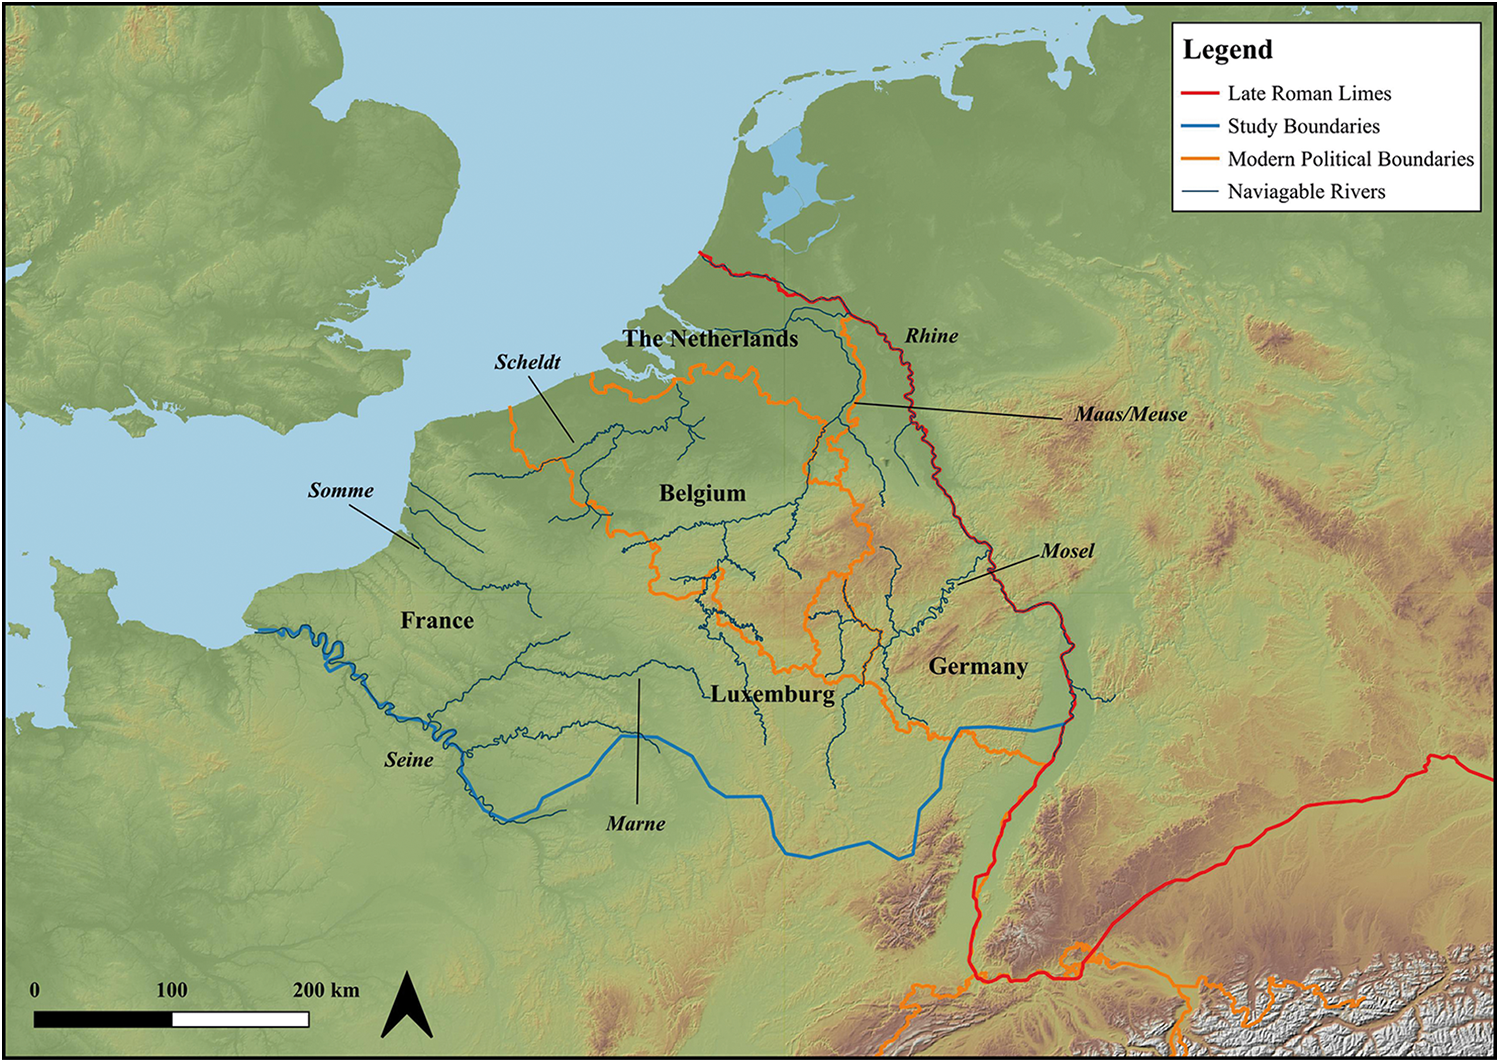
Map of modern political boundaries and key river corridors. The study area is bound on the south and west by the blue line, and on the eastern side by the red line of the late Roman limes. Underlying map from the EAA Copernicus DEM (author).

The study area and its historical context
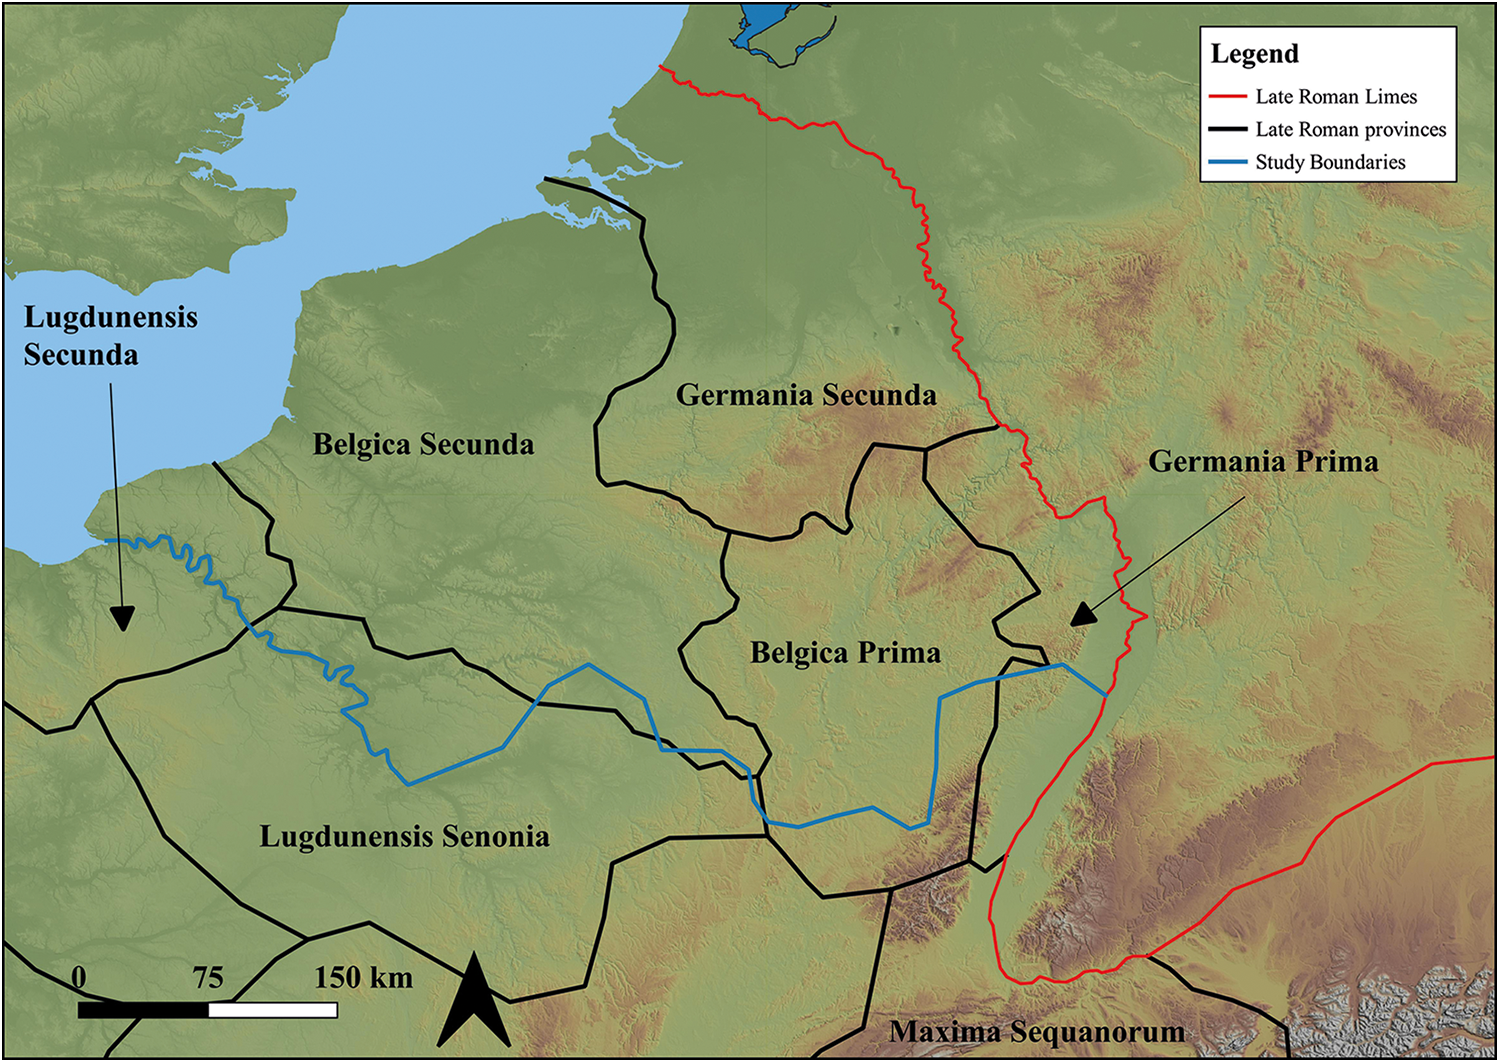
The northern reaches of the late Roman Dioecesis Galliarum encompass a very large zone, covering the geographic area between the Rhine and Seine rivers. This diverse region includes a range of different landscape types from coastal wetland to highland zones, and settlement during the Roman period was accordingly varied. This paper works within the geographical boundaries of north-western Gaul as a historic entity. The study region is defined by the Seine river network on its southern side, the Lorraine plateau in the south and the Rhine and North Sea coast along its eastern and northern side (Fig. 1). This area has been adopted as it has served as the starting point for a variety of regional studiesFootnote 9. It comprises parts of five modern countries. The region was separated into six provinces from the early fourth century onwards (Fig. 2).Footnote 10 This includes the small zones of the provinces of Lugdunensis Senonia and Lugdunensis Secunda north of the Seine.
North-western continental Europe in the fourth century, showing the Roman administrative boundaries. Underlying map from the EAA Copernicus DEM (author).

Historically, the article covers the period from the second half of the third century to the middle of the fifth century. The beginning of this coincides with the ‘crisis’ in the Roman West.Footnote 11 The most unstable period in north-western Europe came between 250 and 280, under the so-called ‘Soldier-Emperors’ and the Gallic Empire.Footnote 12 Germania Inferior and its late Roman successor, Germania Secunda, were affected by depopulation, especially in the north and east, although the impact of this lessened towards the south and west and a Limesfall may have affected parts of the frontier.Footnote 13 Perhaps in response to this, rural settlement began to undergo a period of transformation, and there is widespread evidence for the demolition of earlier Roman grave monuments for spolia reuse, often in fortifications.Footnote 14
Under the Tetrarchy, a new provincial structure developed, based around a vicarius at Trier.Footnote 15 New defensive networks appeared at urban centres, fortifying reduced cores of settlement, for example, Jülich and Heerlen, while several were abandoned completely, including Voorburg (Forum Hadriani).Footnote 16 A number of mid-fourth-century usurpations and disturbances have been noted in the literature; however, it is difficult to understand their impact.Footnote 17 From the late fourth century onwards, the region slowly drifted out of direct Roman control. Military activity on the Lower Rhine appears to have faded away throughout the fifth century, with security outsourced to foederati groups. The Middle Rhine limes, despite experiencing a limited early fifth-century breakdown, continued in use until at least 450 with long-term continuity at military installations, including Mainz.Footnote 18 Over the course of the fifth century, the region effectively left the Roman orbit. Surviving settlement patterns broke down across the north and new Germanic groups began to repopulate the region.Footnote 19 Further south, settlement survival was more common, and there is plentiful evidence of continuity at a range of hilltop sites, urban centres and some rural sites.Footnote 20
Research history and investigation biases
Before examining the data, it is important to consider our current understanding of the fortified landscape through the lens of excavation, national and research biases. Fortifications have been recovered from every modern country in the study region in varying quantities. This reflects both a reality of Late Antiquity — the obsession with defence — as well as the biases of the current dataset.
Early investigations
Late antique defences were identified early in the development of archaeology in the region. These antiquarian investigations were overwhelmingly rooted in the Roman historical sources and took inspiration from Gibbon’s Decline and Fall of the Roman Empire. Footnote 21 These painted a picture of a ‘crisis’ in the late third century and imperial collapse in the late fourth/early fifth century.Footnote 22 Phases of fortification were quickly assigned to central policy based on the historical references.Footnote 23 These early excavations established our basic model for different types of site and their temporal spread. Despite a clear focus on sites associated with the ‘military’, typologies and patterns taking in civilian structures were also developed: a belt of hilltop sites, the refuges or Höhensiedlungen, burgus-like features, urban defences and large fortresses were identified.Footnote 24 Naturally, these excavations influenced the wider narrative, feeding into a story of decline, unrest and instability across the north-western provinces. National research traditions developed during this formative period; for example, German archaeology focused on military installations. This investigation drove further analysis of fortified settlements, uncovering more defences as the research tradition developed.
Post-war approaches
By the end of the Second World War, this phase had given way to more standardised investigation. New excavations exposed the long-term development of some sites and led to works of synthesis in the 1970s and 1980s.Footnote 25 This momentum continued, with work examining shifting patterns of defence as well as architectural changes and a re-evaluation of key problems in our understanding of the period.Footnote 26 Concurrent with this, new work established an earlier phase of activity associated with the Gallic Empire and the late-third century.Footnote 27 Work on the Höhensiedlungen developed a basis for future work on hilltop sites and excavations at the Belgian refuges have given us an important dataset for the study of these sites.Footnote 28
The publication of the controversial Grand Strategy of the Roman Empire in 1976 influenced the developing narrative.Footnote 29 Although decline and unrest remained a key part of the story, broad concepts of ‘defence-in-depth’ began to be applied to the region.Footnote 30 The emerging pattern appeared to be one of defended highways and elastic defence through a partially depopulated landscape.Footnote 31
Modern analysis
By the end of the twentieth century, the defence of north-western Gaul was increasingly considered ‘solved’, with new data envisaged as filling the gaps in a pattern of defended hilltops and fortified river and road networks. In recent years, however, this model has become increasingly fragile. Examinations have moved beyond an isolated approach to north Gallic defence, viewing the region as part of a wider defended whole rather than a unique example of a heavily militarised zone.Footnote 32 This analytical expansion has impacted on the study of all types of defences. Urban fortifications have undergone a revolution in theory, with important contextual work identifying trends, policies and development, both on the level of individual sites as well as groups of defences.Footnote 33 The re-evaluation of the Höhensiedlungen has driven re-engagement with their function — either for defence or display as well as their form and distribution across the north-western provinces.Footnote 34 Systematic excavation and aerial photography from the 1970s onwards in the German loess belt has seen the number of defended sites increase significantly.Footnote 35 This has been mirrored by developments elsewhere with unexpected new sites appearing in Picardy.Footnote 36
The last 20 years have seen an improved understanding of fortified settlements. Despite the recent flurry of studies, however, there have been few statistical or intra-regional examinations of the area. Work has primarily focused on individual sites or thematically linked groups of installations.Footnote 37 Recently, synthetic investigations have begun to move towards comparable and replicable typologies for defence with further work underway to apply this on a wide scale.Footnote 38 By examining different facets of the study of fortified settlements, we can attempt to establish biases and investigation distributions inherent in the dataset.
Dataset and methodology
The dataset of fortified settlements in the study area comprises 357 sites spread across north-western continental Europe. These installations must be considered as part of a much larger fortified zone, a highly defended landscape across modern western Europe, and cannot be simply viewed as a phenomenon that lies between the Rhine and the Seine. This includes the Saxon Shore forts, Hadrian’s Wall and a range of defended small towns, urban centres and other fortifications in Britannia as well as the important fortified centres along the Lyon–Metz road, irregular fortifications and the riverine defences south of Mainz.Footnote 39
Naturally these sites also come with data of varying quality. This paper examines the data holistically, laying out the underlying biases before examining the geographical and temporal spread of different sites. In collecting the data, no distinction was made between military and civilian sites. Given the problematic nature of defining civil and military groups in late antique Gaul and Germany, a decision was made to assess the data morphologically, without preconceived biases.Footnote 40
Defining fortification
A first step in the process of assessment is establishing definitions of the interrelated terms ‘defence’ and ‘fortification’. In the nineteenth and early twentieth centuries, fortifications were identified as defensive based on thematic morphology, with installations divided into regular (military), irregular (rural) and urban.Footnote 41 By the twenty-first century, further development had identified that this division is problematic, in part due to the blurring of civilian and military in later Roman Gaul and the wide morphological variation of sites.Footnote 42 A vast range of Latin terms have been identified, both in inscriptions and the historical sources, that appear to apply to late Roman defended sites.Footnote 43 These terms, perhaps unsurprisingly, do not provide a firm basis for clear definitions of different types of late Roman defences. This confusion has spilled over into modern languages and there is a vast web of different and often inter-related and contradictory terms and phrases used to describe defended installations in the late antique world.Footnote 44
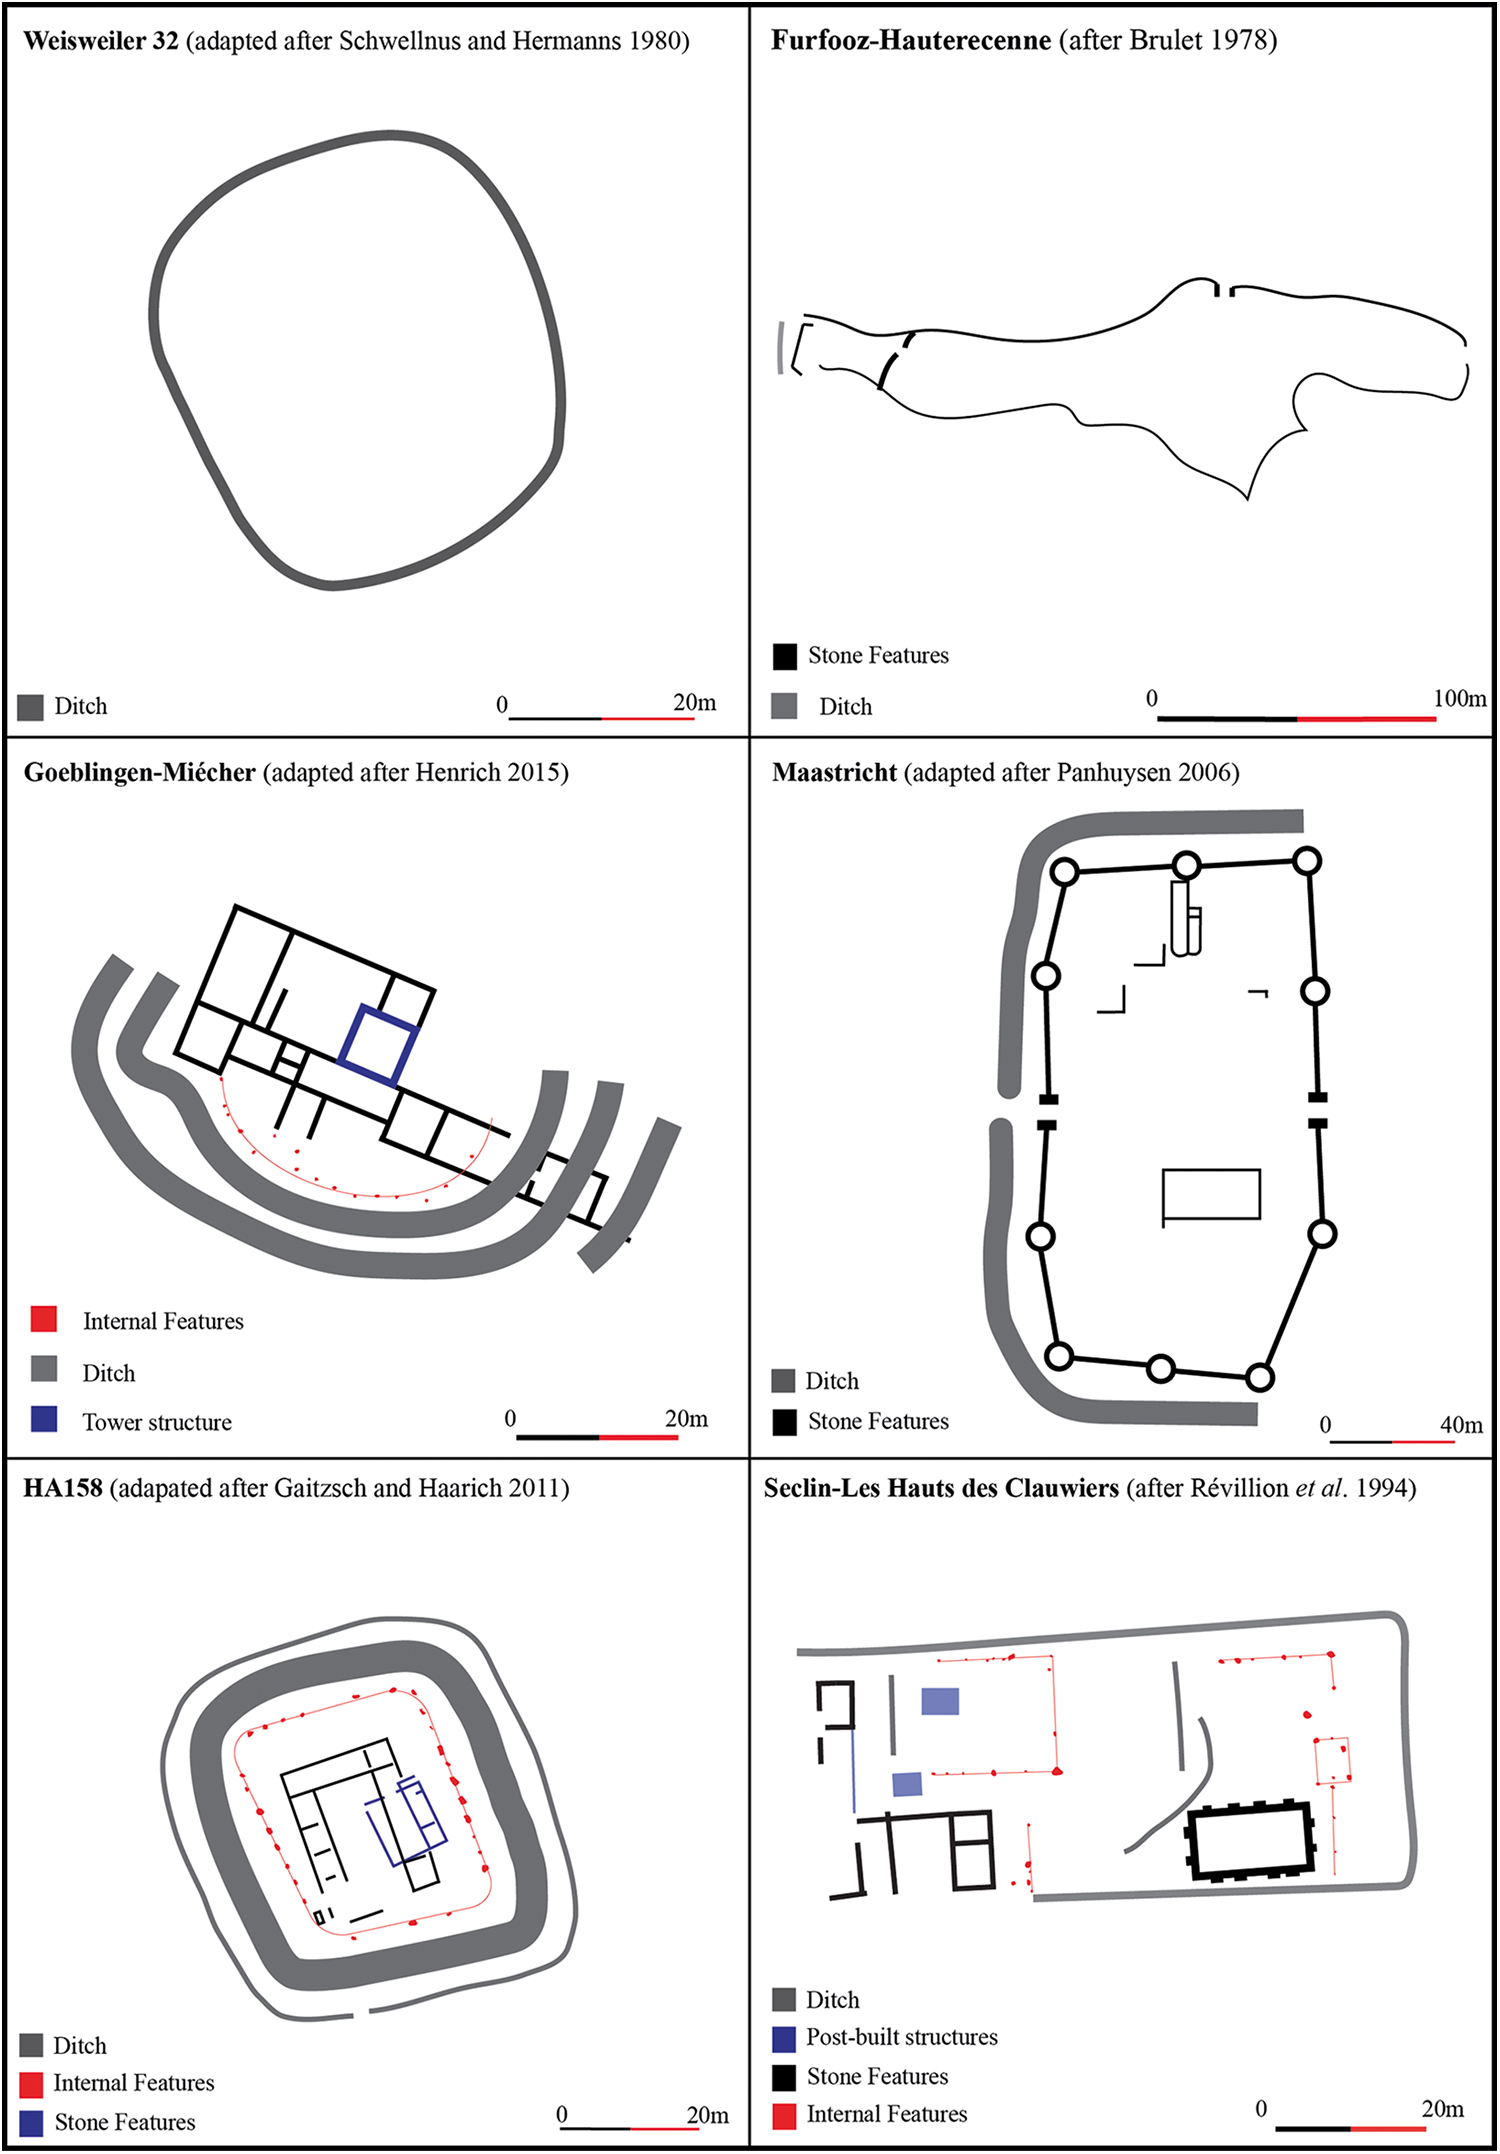
Rather than deferring to the Latin terms and their modern counterparts, this analysis follows recent empirical classification systems based on the morphology of settlements, although these have, until now, been primarily limited to ‘private’ or small-scale installations.Footnote 45 In this article, all fortified settlements are examined, regardless of their presumed function. Sites were defined as fortified if there was a demonstrable presence of architectural elements that could be used for a defensive purpose. Naturally, a vast range of different features and site types, some of which may have been multi-purpose, fall into this category (Fig. 3). This includes everything from the small earthwork defences identified in the Rheinische Lößbörden and the hilltop sites identified across the region to large urban wall circuits and military fortresses on the Rhine.Footnote 46 A significant proportion of these sites could be considered multi-purpose, or include structures that, when combined with other features, appear to be defensive in nature. A good example of this is Seclin-Les Haut des Clauwiers (Fig. 3), a villa located in northern France.Footnote 47 The site underwent an early fourth-century transformation with the villa largely converted to artisan production and grain storage. From the early/mid-fourth century onwards, a new grain storage structure with reinforced buttresses and thick walls, interpreted as a tour-silo, was constructed.Footnote 48 On its own, this would not necessarily be enough to ascribe a defended function; however, the site appeared to be contemporary with a series of palisades and ditches regulating access to the building. This points towards a multi-purpose defensive element at the site. In light of instances such as this and the probable multi-function or unclear function of many of these fortifications, the sites in this paper have been graded at three levels according to their certainty based on the availability of evidence from published reports (Table 1). These methods allowed the establishment of a reasonably coherent model for examining the temporal and spatial density of fortified settlements over the later Roman period and reflects the degree of uncertainty inherent in the dataset.
A variety of defences: selected fortified installations showing the diversity of types in the region (author).

A breakdown of fortifications by data grade (n=357) (author).

Moving beyond the morphological dataset, several different groups of finds are associated with defensive or state activity in late Roman north-western Gaul. Some artefact groups, long associated with the late Roman army or state, have been recorded at potential fortified installations and include crossbow brooches and chip-carved belt sets.Footnote 49 Reinforcing this is the presence of weaponry, or at the very least, multi-functional tools that could have acted as weapons.Footnote 50 Dating these objects has, in the past, been problematic; however, we are now aware of clear typologies from the late third to fifth century for belt sets and crossbow brooches and this allows a level of chronological resolution for material culture findspots.Footnote 51 This has seen the identification of a wider military community in northern Gaul based on the material culture and includes finds from rural settlements, cemeteries and isolated findspots and allows us to infer the presence of defences close by.Footnote 52 In some cases, this is relatively straightforward: there is limited evidence of a defensive morphology beyond terracing at Ben-Ahin-Lovegnée, a hilltop site on the Meuse; however, the presence of an associated cemetery at Sarte-à-Ben, complete with weapons and belt buckles and late Roman ceramics and coins on the hill itself, is suggestive of a fortification on the spur above the river.Footnote 53 Data on these sites were collected in a separate database and has been integrated here to highlight the temporal spread and distribution of activity associated with defence.
Investigation type
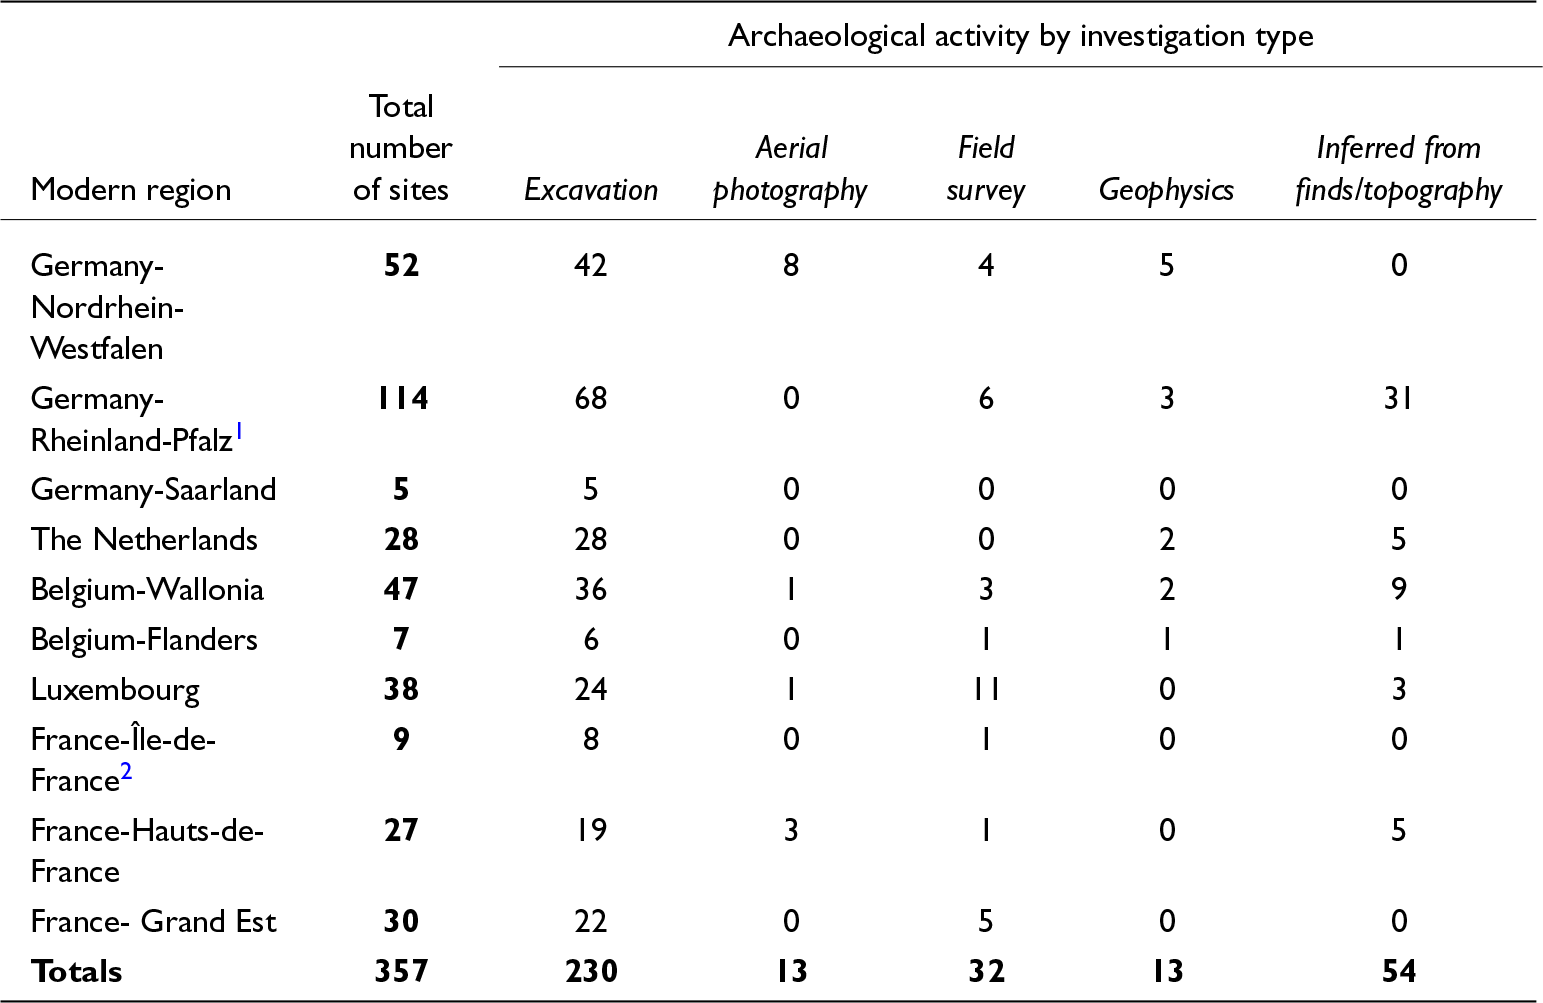
Historically, fortifications have been identified through a variety of means. Excavation, both limited and extensive, has been the primary vehicle for study; however other methods have been used to identify and categorise late antique defensive architecture. Aerial photography has a long tradition in parts of the study area, notably northern France and the Rhineland and has proved useful in spotting potential late Roman installations.Footnote 54 Field survey and geophysics have also taken important roles in confirming late antique activity, especially in combination with aerial photos.Footnote 55 Although the chronological and morphological classification of these sites is often less clear, in many cases they can be easily identified as late Roman defences.Footnote 56 This extends to sites identified through finds. The majority of findspots however are less secure and there is significant variation in their location, relationship to a fortification and chronology.
The data presented here are overwhelmingly the result of excavation (Table 2). This reflects both the complex nature of some of these fortifications and in some places, notably the Eifel-Ardennes zone, the difficulties surrounding aerial photographical analysis. There is, however, some regional variation. Aerial photography has been repeatedly used in Nordrhein-Westfalen, and to a lesser extent Hauts-de-France, to identify defended sites, while field survey has commonly been employed as a strategy in Luxembourg and Rheinland-Pfalz. This is the result of the difficult nature of invasive fieldwork at hilltop installations, which are often forested or hard to define. This is also reflected in the large number of Höhensiedlungen in Rheinland-Pfalz that have been identified based on their finds alone.Footnote 57 This group of sites, paralleled in Wallonia, has generally been linked with finds of military equipment on sites with defensive topography.Footnote 58 Linking finds and topography has a long history and accounts for a significant number of sites defined as fortifications in the dataset. The differences in archaeological investigations demonstrate that our analysis of the fortified landscape rests on a very varied base and this is an important element to bear in mind as research into the topic advances.
Breakdown of activity types at fortifications in the countries under study, where evidence is currently available (n=357) (author)

1 This includes the limited number of sites in Hessen (3) and Baden-Württemberg (2).
2 This includes the département of Seine-Maritime.
Investigations by period
Assessments of the data by excavation period highlight the biases and assumptions inherent in the data landscape. This breakdown, including sites that were repeatedly examined in different periods, demonstrates the variability of activity across the previous two centuries. Excavation at these sites has a very long history, with some of the first notable antiquarian studies of the Roman period in north-western Europe focusing on fortifications, especially along the Rhine limes.Footnote 59 The temporal spread of excavation reflects this (Fig. 4) — there is significant nineteenth-century or earlier activity across all countries. These early activities, dominated by France and Germany, both reflect the high numbers of sites within their borders but also hints at the early focus on the military fortresses on the Rhine and the urban wall networks of French towns, sometimes to the detriment of other site types.Footnote 60 In other countries, especially the Netherlands, villas held more attention with relatively limited interest in fortifications.Footnote 61 The situation in Belgium is slightly different. The investigation of defended installations began in the early nineteenth century; however, this antiquarian work generally focused on early medieval cemeteries and the study of the defended hilltop sites associated with them was somewhat secondary.Footnote 62
The temporal distribution of archaeological investigation at fortified sites, based on the totals set out in Table 2, where evidence is currently available, broken down by country and administrative region (n=548) (author).

Although there are minor variations between each country, driven in part by different national research traditions and priorities, there is a broad increase in archaeological activity at defended sites in the twentieth century. This activity peaks between 1950 and 1980, coinciding with the wider post-war construction and the subsequent economic boom.Footnote 63
Geographical distributions
Our current understanding of the geographical spread of late antique fortifications is highly regionalised. Research has, by and large, examined thematic groups of similar sites, such as the Höhensiedlungen, or focused on specific zones, for example the Rhine frontier and the Via Belgica.Footnote 64 This scholarship focus has been supplemented by excavation biases. The large-scale excavations in Nordrhein-Westfalen prior to lignite mining have exposed large numbers of defended sites in the Rheinische Lößbörden, whilst the expansion of the rail network and Zones d’Activité Économique (ZAE) in France have generated similar data.Footnote 65 Other regions such as Belgium have similar excavation biases. The focus has been on specific sites, such as Braives and Liberchies, and some areas, such as Flanders, are poorly understood.Footnote 66 This is equally true in regions where other site types have been the focus of study. In France-Le Grand Est and Luxembourg, scholarship has been concerned more with rural settlements and the first major surveys of defended installations date to the late 1960s and 1970s.Footnote 67
With these biases in mind, it is clear that while in some areas we have a detailed understanding, our clarity on the distribution of sites in other regions is poor. Overall, the distribution is fragmented, reflecting a series of modern and natural geographical factors. Overwhelmingly, fortifications are located in the east of the study region and broadly, the closer an area is to the Rhine, the greater the density of fortifications (Fig. 5). Dense belts exist along the key transportation arteries; the main roads, notably the Via Belgica, as well at key junctions, some of which, such as Saarbrücken, were located on earlier agglomerations.Footnote 68 Supplementing this is the concentration of hilltop defences in the Eifel-Ardennes-Meuse zone and we would expect further sites in modern day Luxembourg to complete this concentration.Footnote 69 Instead of continuing southwards through the Vosges and Lorraine Plateau, the dense belt peters out, giving way to a range of limited Höhensiedlungen, burgi and other forms of defensive sites, including ex novo military installations such as Saint-Laurent-sur-Othain-Le Châtelet or urban defences like Metz.
Spatial distribution of fortified sites (250–450) across the study region and beyond. Underlying map from the EAA Copernicus DEM (n=357) (author).

This distribution confirms the lack of fortifications in the depopulated zones of the Dutch and Belgian Kempenland and highlights our limited evidence for late Roman defensive installations along the North Sea coast.Footnote 70 We see a slow increase of sites towards the south along the coast, beginning with the third-century forts at Aardenburg and Oudenburg, eventually forming a complex cluster of morphologically identified installations in the Pas-de-Calais, reinforced by a range of sites with artefacts traditionally associated with militarising communities.Footnote 71 This is complemented by an expected and partially identified drop-off in defended sites further south and west, where the majority of defended settlements are walled towns such as Paris, Melun and Reims and there is a less diverse range of other fortifications.
To some extent these patterns are mirrored across the channel in Britannia. Key defended installations are located on the main arteries, some of which have late antique circuits.Footnote 72 Where this differs, however, is that the majority of major urban centres in Britannia were defended by the mid-third century and received fourth-century augmentation, primarily in the form of towers, for example at London.Footnote 73 Important differences are present between Britannia and the continental provinces: rural fortifications are significantly rarer, with few examples of burgi or hilltop sites.Footnote 74 The military footprint is also more static in comparison to northern Gaul: there are limited examples of new fortifications, with the Saxon Shore and Yorkshire towers being exceptional examples.Footnote 75
The geographical pattern reinforces the fragmented distribution identified in previous thematic studies.Footnote 76 Bringing the data from these sources together allows us to move our geographical understanding forward (Fig. 5). Firstly, we can move towards analysis of location, orientation and interconnectivity and secondly, we can identify lacunae in the wider pattern. These lacunae present interesting problems, especially in the highland zone between the Mosel and Maas rivers and further research may indicate that these zones were simply too far from movement corridors in the landscape to require fortification (see Fig. 1 for locations of rivers).
Temporal distribution
The chronological distribution of fortification presents a more complex picture. Applying a basic classification method to the data allows for the analysis of the temporal intensity of fortified settlements over the period and reflects the degree of uncertainty caused by chronological problems in the data.
To achieve a realistic assessment of certainty of the temporal distribution, three different levels of a graduated scale of occupation certainty were applied to each site (certain, probable, possible). Assessing this employed a variety of different chronological indicators, including ceramic, artefactual and numismatic records and where available, radiocarbon dates or other scientific methods.Footnote 77 It is important to note that the data primarily derive from published sources and given the historicising biases present, this can lead to errors in interpretation. Chronologies based on the ceramics and coin sequences are subject to problems. Ceramic studies have highlighted the problems with fifth-century coarse wares and the longevity of Argonne sigillata in the third centuryFootnote 78. Coin data hold similar problems; the huge number of third-century radiates, the issue of production of the mint at Trier and the longevity of coin use beyond the early to mid-fifth century have made it difficult to accurately pin down abandonment dates for sites.Footnote 79 To offset some of the chronological issues, 50-year blocks were chosen to represent broad resolution changes. Intensity of use was not necessarily identifiable in this broad approach to our current data and further work will be needed to assess this archaeologically.
With these issues in mind, the chronological spread illustrates an unexpected spread of data (Fig. 6). Peaks of activity in the late third to early fourth century and the late fourth to early fifth century were anticipated. These periods have generally been characterised as times of rapid change. The late third century saw the depopulation or étiage of rural settlements and urban centres while broader Roman political control broke down in the fifth century. The instability inherent in these periods has traditionally been seen as a driver for fortification construction and use.Footnote 80 Instead, we see a steady increase in fortified activity over the course of the late third and early fourth century, beginning with limited examples, mostly in the form of military installations, in the first period (200–250).Footnote 81 This peaks in the second half of the fourth century (the period 350–400) and is followed by a sharp drop-off in sites into the fifth century, perhaps associated with the slow withdrawal of Roman control.
The chronological range of activity at fortified settlements across the region under study, highlighting the certainty of temporal identification (n=248) (author).

The single peak of activity indicates that several other factors are at play and worth exploring — clearly it demonstrates we are not dealing with the cyclical use of instability-linked fortifications, nor are they short-term knee-jerk examples of ‘crisis architecture’ associated with limited periods of occupation. Instead, the evidence suggests many of these installations were developed, expanded and used over the course of half a century or more.Footnote 82 Vireux-Molhain-Le Mont Vireaux for example, was occupied from the late third to mid-fifth centuries and included several phases of reconstruction, expansion and rebuilding.Footnote 83 Although a small number of sites did have the rapid lifespans associated with ‘crisis architecture’, for example the refuge at Nismes-Roche de Sainte-Anne, turnover was relatively low with most sites occupied continuously from the late third/early fourth century onwards.Footnote 84 Given that this peak is visible across both the macro-region and in all sub-regions, it suggests that the same priorities — a desire for defendable sites — was of key importance to groups across the north-west, both on a regional and local level. This priority of construction and use was maintained until at least the mid- to late fourth century, when the number of sites in use begins to decline, although it is worth stating that our chronological resolution for the early fifth century is still unclear and relying on the ceramic and coinage data remains problematic.Footnote 85
This increase in activity, rising from about 40 early third-century military sites focused on the limes and coastlines to nearly 140 active installations in the mid-fourth century, indicates that various interest groups felt a requirement for defence. Equally, it hints that the local population, the state and other agents were motivated and, more importantly, able to marshal the labour and materials needed to construct and defend installationsFootnote 86. This motivation is not limited to one region, but occurs as a single wave of activity across the fourth century.
The temporal overlay of probable and possible sites presents a different story. Both these groups are less chronologically anchored phases and show the expected peaks in the late third and early fifth centuries, broadly coinciding with pre-conceived periods of ‘crisis’ in northern Gaul. This is likely to represent the biases within the dataset inherent from an older, historicising approach. Traditional scholarship, especially on French town walls, has sometimes assumed that fortifications should have been built during the late third-century crisis, as a reaction to barbarian raiding.Footnote 87 Although this may be true, and there is some evidence that some of these defences did have a third-century phase, for example at Amiens, where coins recovered from the wall foundations dated to the reign of Probus, the evidence is ambiguous at many sites.Footnote 88 Future work may indeed identify such phases beyond doubt; however, as it currently stands, the evidence does not point towards significant peaks of third- or fifth-century fortified activity.Footnote 89
The chronological sequence paints a picture of a region with similar defensive priorities, transcending local or regional activity. Although what we see on the ground cannot in any way be called integrated at a supra-provincial level, it is clear that fortified activity is driven by factors at a level above local concern. This suggests that the mid-fourth century was the point at which the state, local populations and other actors were most concerned with defence, and perhaps, by extension, the perception of instability across the entire region was most important.
Future approaches
The ‘state of play’ in the analysis of defence in the continental north-west has been presented and several areas for future investigation highlighted.
The most important recommendation should be to address the problems with our chronological resolution. Increasing the reliability of dating will help to reduce biases in the dataset. The temporal analysis (Fig. 6) has illustrated that sites with less clear dating often revert to older notions of crisis architecture, especially in the late third and fifth centuries. Some progress can be made, notably by using absolute dating where available, and re-evaluations of dating evidence have been proposed for fortifications in the Rheinland-Pfalz.Footnote 90 These activities should be expanded to other key fortifications, including the walls of north Gallic towns, hilltop refuges and burgi: it is imperative that scientific dating methods are conducted wherever possible at defended sites.Footnote 91 Developing a methodology for this is an obvious next step, and it must integrate modern field methods currently in use in other archaeological sectors. Exploring these chronological issues would pay dividends in understanding the genesis of the defended landscape in the third century as well as further developing a model for the processes by which these sites go out of use in the fifth century or beyond. In essence, it can help to assess to what extent these sites can be referred to as a reaction to ‘crisis’ and question whether these sites really can be viewed within the framework of ‘crisis architecture’.Footnote 92
The second recommendation is the increased integration of national research strategies. Comparative databases are required that cover the various countries under study and integrate disparate research approaches on fortifications. Information exchange will speed this process and allow researchers in the field to take required data from a central database. The underpinnings of this are already under way, with the dataset for this article available as open access; however, recent examples have demonstrated just how far this can be taken.Footnote 93
A final recommendation would be to adapt and expand this study to other regions.Footnote 94 The traditional range of continental north-west European studies, between the Seine and the Rhine and Metz and the Channel should be widened significantly. Other Gallic wall networks, road forts and the frontier zones in Austria, southern Germany and Switzerland should be included. This should also incorporate Britain, which seems to buck the trend of widespread fortification as well as areas such as the Agri Decumates, in order to assess the effect regional withdrawal has on fortified trajectories.Footnote 95 There is evidence for Höhensiedlungen-like hilltop sites as far afield as Tarraconensis and Lusitania that appear to be part of a wider phenomenon and examining this on the scale of the Roman West should help to identify larger patterns.Footnote 96
Concluding remarks
This paper has introduced the characteristics of the current dataset of fortified settlements in north-western Gaul. By presenting an initial study of the current data, this work is intended to provide a starting point for future research into defended sites, building on the rich but disparate tradition of scholarship in the field, as well as identifying the biases and issues in the dataset for further work.
Despite the provisional nature of this analysis, the data do highlight important elements of the make-up of the wider defended landscape. The most important of these is the chronological spread of activity. The expectation was that two peaks would appear, corresponding with the late third/early fourth and late fourth/early fifth century, traditionally identified as periods of ‘crisis’. The lack of these peaks was surprising and the expectation of their existence demonstrates just how embedded the historical narrative of late antique Gaul is. Although it is currently impossible to be sure, based on the quality of the dating of the data, it does not seem that further resolution would prove the existence of such peaks of activity. Instead we are faced with a different picture, with a mid-fourth-century peak. Although there is some evidence of occupied sites in the early third century, mostly in the form of military bases along the Rhine or some earlier walled cities, the peak of activity rises quickly from the late third century onwards.
This paper has provided a limited but important examination of the defensive landscape and highlighted the issues and problems inherent in the data. The difficulties in assessing the data have been demonstrated and a series of recommendations proposed to help rectify this. Future work is required to develop this further, both in the field and in the integration of national traditions and data analysis, with this paper providing a ‘jump-off’ point for the re-evaluation of fortified trajectories in north-western Europe during Late Antiquity.
Supplementary material
The supplementary material for this article can be found at https://doi.org/10.1017/S0068113X25100329


 Open access