





Introduction
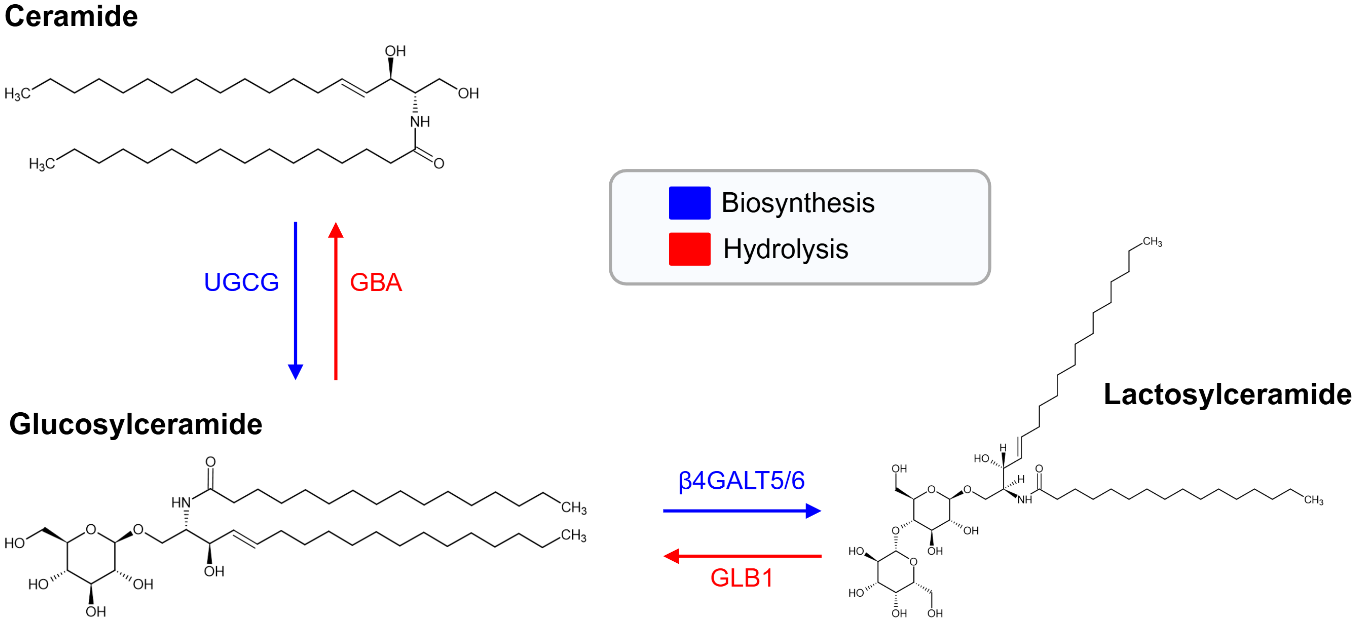
Lactosylceramides (LacCers) are a glycosphingolipid (GSL) composed of a ceramide backbone linked to a lactose moiety (Figure 1) (Ref. Reference Chatterjee, Balram and Li1). They occupy a key branching point in sphingolipid metabolism and serve both structural and signalling roles (Ref. Reference Chatterjee and Pandey2). The ceramide backbone exhibits acyl-chain length heterogeneity across C16-C24 species, which influences lipid microdomain structure (Ref. Reference Iwabuchi, Prinetti, Sonnino, Mauri, Kobayashi, Ishii, Kaga, Murayama, Kurihara, Nakayama, Yoshizaki, Takamori, Ogawa and Nagaoka3). As central intermediates in GSL metabolism, LacCers contribute to membrane organisation, cellular communication and the regulation of inflammatory pathways (Ref. Reference Chatterjee and Pandey2). Emerging evidence suggests that host–microbiota interactions may influence sphingolipid metabolism, including ceramide pools (Ref. Reference Johnson, Heaver, Waters, Kim, Bretin, Goodman, Gewirtz, Worgall and Ley4). LacCers are synthesised by the addition of galactose to glucosylceramide, a reaction catalysed by the lactosylceramide synthases β-1,4-galactosyltransferase 5 and 6 (β4GALT5 and β4GALT6) (Refs Reference Chatterjee, Balram and Li1, Reference Furukawa, Clausen, Sato, Taniguchi, Honke and Fukuda5) (Figure 1). These enzymes exist in both soluble and type II membrane-bound forms and are predominantly localised to the Golgi apparatus (Ref. Reference Chatterjee and Pandey2). Beyond de novo synthesis LacCer homeostasis is maintained through lysosomal hydrolysis pathways that regenerate glucosylceramide and ceramide (Figure 1) (Ref. Reference Paciotti, Albi, Parnetti and Beccari6). Its expression is widespread, with high levels observed in the heart, brain, placenta, muscle and pancreas; lower levels in the lung and liver; and additional expression during fetal development in the brain, lung, liver and kidney (Ref. Reference Lo7).
Lactosylceramide (LacCer) biosynthesis and lysosomal hydrolysis. Biosynthesis: Ceramide (Cer) is glycosylated by UDP-glucose:ceramide glucosyltransferase (UGCG), producing glucosylceramide (GlcCer). Beta-1,4-galactosyltransferase 5 (β4GALT5) or beta-1,4-galactosyltransferase 6 (β4GALT6) transfers a galactose moiety from UDP-galactose to GlcCer, forming lactosylceramide (LacCer). Hydrolysis: β-Galactosidase (GLB1) hydrolyses LacCer to GlcCer by removing the terminal galactose. β-Glucosidase (GBA) then cleaves GlcCer, yielding Cer.

Figure 1. Long description
At the top left is ceramide with its chemical structure. A blue downward arrow labeled U G C G points from ceramide to glucosylceramide at the bottom left, indicating biosynthesis. A red upward arrow labeled G B A points from glucosylceramide back to ceramide, indicating hydrolysis. From glucosylceramide, a blue rightward arrow labeled beta 4 G A L T 5 slash 6 points to lactosylceramide on the right, showing biosynthesis. A red leftward arrow labeled G L B 1 points from lactosylceramide to glucosylceramide, indicating hydrolysis. Each molecule is shown with its chemical structure. At the top right, a legend box contains blue for biosynthesis and red for hydrolysis.
Within the total sphingolipid pool, LacCers account for about 5.8%, with LacCer(d18:1/16:0) being the most abundant species (Ref. Reference Hammad, Pierce, Soodavar, Smith, Al Gadban, Rembiesa, Klein, Hannun, Bielawski and Bielawska8). They are predominantly synthesised in the liver and delivered to extra-hepatic tissues, including the kidney on the surface monolayer of lipoproteins (Refs Reference Chatterjee, Balram and Li1, Reference Scherer, Böttcher, Schmitz and Liebisch9, Reference Kumpula, Kumpula, Taskinen, Jauhiainen, Kaski and Ala-Korpela10). It is distributed across very-low-density (VLDL), low-density (LDL) and high-density lipoprotein (HDL) fractions, making up approximately 3–13%, 36–57% and 34–54% of their respective total sphingolipid content (Refs Reference Scherer, Böttcher, Schmitz and Liebisch9, Reference Kumpula, Kumpula, Taskinen, Jauhiainen, Kaski and Ala-Korpela10).
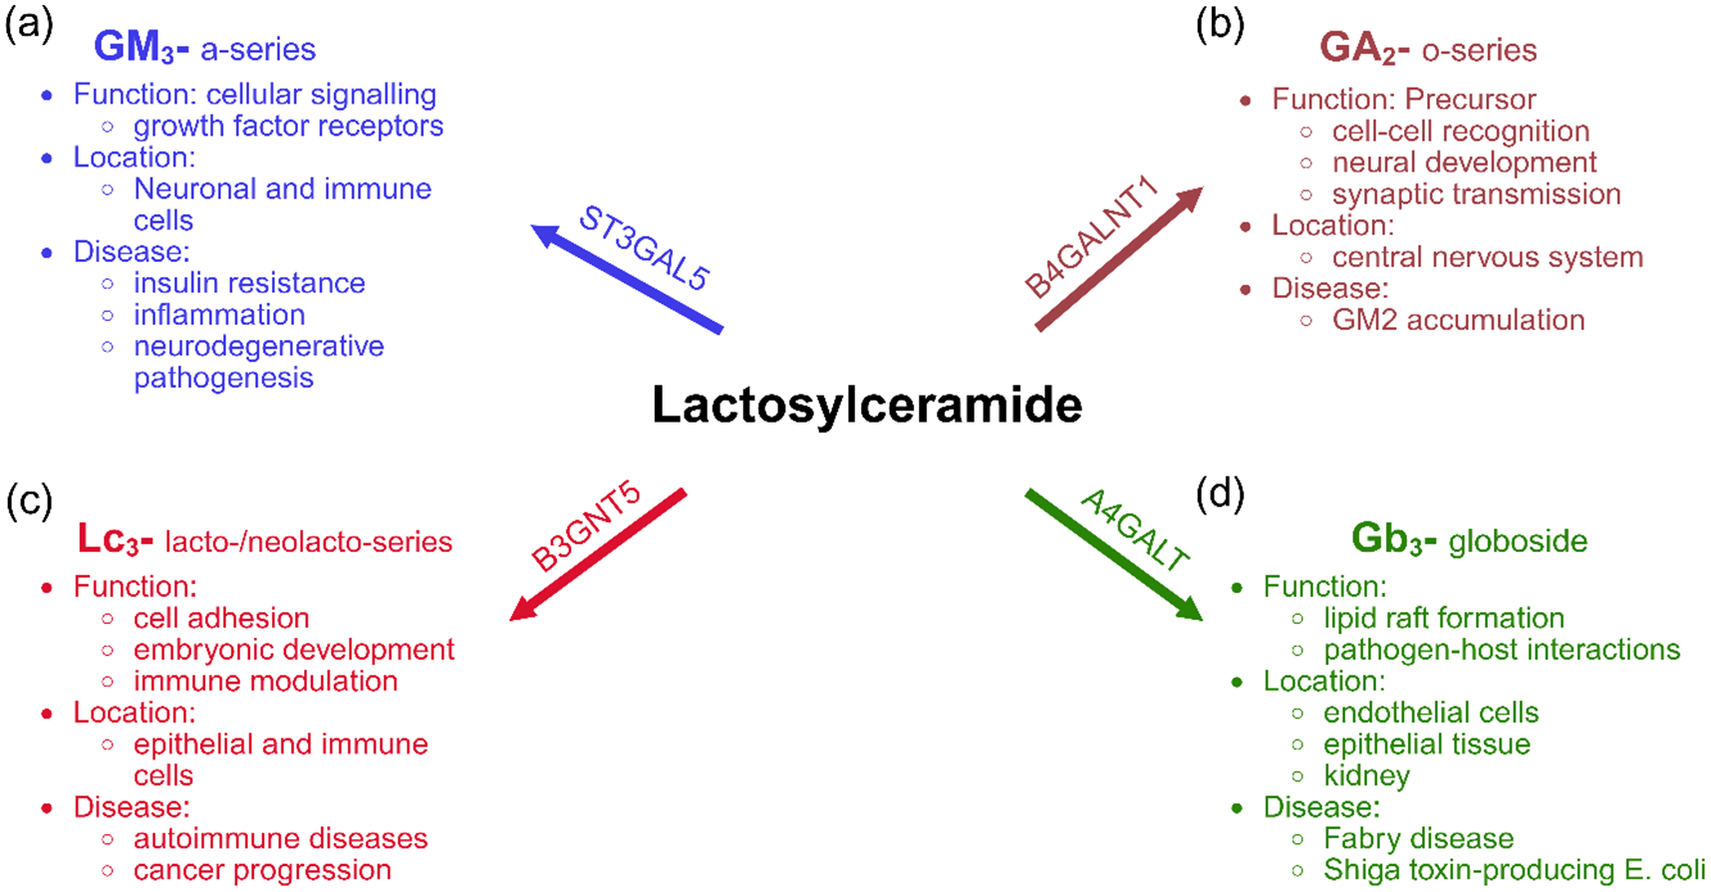
Downstream of its synthesis, LacCers function as central precursors for multiple GSL families that result from sequential addition of specific sugar residues with unique structural and functional properties (Figure 2). Monosialodihexosylganglioside (GM3) is the primary precursor for the a-series gangliosides (Figure 2A) and contributes to cellular signalling, including insulin receptor activity and neurodegenerative pathogenesis (Refs Reference Hülsmeier11, Reference Chiricozzi, Lunghi, Valsecchi, Carsana, Bassi, Di Biase, Dobi, Ciampa, Mauri, Aureli, Inamori, Inokuchi, Sonnino and Fazzari12). GM3 can also be further sialylated by ST8SIA1 (GD3 synthase) to form GD3, the precursor of the b-series gangliosides (Refs Reference Chiricozzi, Lunghi, Valsecchi, Carsana, Bassi, Di Biase, Dobi, Ciampa, Mauri, Aureli, Inamori, Inokuchi, Sonnino and Fazzari12–Reference Kanoh, Nitta, Go, Inamori, Veillon, Nihei, Fujii, Kabayama, Shimoyama, Fukase, Ohto, Shimizu, Watanabe, Shindo, Aoki, Sato, Nagasaki, Yatomi, Komura and … Inokuchi14). Subsequent glycosylation generates disialylated gangliosides such as GD2, GD1b, GT1b and related structures (Refs Reference Chiricozzi, Lunghi, Valsecchi, Carsana, Bassi, Di Biase, Dobi, Ciampa, Mauri, Aureli, Inamori, Inokuchi, Sonnino and Fazzari12–Reference Kanoh, Nitta, Go, Inamori, Veillon, Nihei, Fujii, Kabayama, Shimoyama, Fukase, Ohto, Shimizu, Watanabe, Shindo, Aoki, Sato, Nagasaki, Yatomi, Komura and … Inokuchi14). In parallel, LacCer derived o-series and lacto-neolacto-series GSL’s are involved in neural development, cell–cell recognition and specialised immune signalling, whilst globosides contribute to membrane organisation, lipid raft formation and implicated in pathogen–host interactions (Figure 2B–D) (Refs Reference Hülsmeier11, Reference Inokuchi, Nagafuku, Ohno and Suzuki13). Collectively, these biosynthetic pathways highlight the pivotal role of LacCers in shaping membrane architecture, regulating intracellular processes, modulating immune function and contributing to diverse pathophysiological mechanisms.
The four primary branches of glycosphingolipid (GSL) biosynthesis that initiate from the central intermediate Lactosylceramide (LacCer): (A) α-2,3-sialyltransferase (ST3GAL5) catalyses the formation of monosialodihexosylganglioside (GM3). GM3 can also be further sialylated by ST8SIA1 (GD3 synthase) to form GD3, the precursor of the b-series gangliosides; (B) β-1,4-N-acetylgalactosaminyltransferase (B4GALNT1) converts LacCers into asialo-GM2 (GA2); (C) β-1,3-N-acetylglucosaminyltransferase (B3GNT5) produces lactotriaosylceramide (Lc3), a precursor for the lacto- and neolacto-series GSLs involved in immune modulation and cancer progression and (D) α1–4-galactosyltransferase (A4GALT) synthesises globotriaosylceramide (Gb3).

Figure 2. Long description
At the center is bold black text Lactosylceramide. Four arrows extend outward: blue arrow (top left) labeled S T 3 G A L 5 points to GM3 a-series, with functions cellular signalling and growth factor receptors, located in neuronal and immune cells, linked to insulin resistance, inflammation, and neurodegenerative pathogenesis. Brown arrow (top right) labeled B4 G A L N T 1 points to GA2 o-series, a precursor for cell-cell recognition, neural development, and synaptic transmission, located in the central nervous system, associated with GM2 accumulation. Red arrow (bottom left) labeled B3 G N T 5 points to LC3 lacto/neolacto-series, involved in cell adhesion, embryonic development, and immune modulation, found in epithelial and immune cells, linked to autoimmune diseases and cancer progression. Green arrow (bottom right) labeled A4 G A L T points to Gb3 globoside, with functions in lipid raft formation and pathogen-host interactions, located in endothelial cells, epithelial tissue, and kidney, associated with Fabry disease and Shiga toxin-producing E. coli. Each branch is color-coded and contains bullet points for function, location, and disease.
For additional insight into LacCer biochemistry, readers are referred to the in-depth review by Chatterjee et al. (Ref. Reference Chatterjee and Pandey2), which provides an in-depth overview of LacCer metabolism, transport and functional biology. Building on this foundation, our review takes a distinct approach by synthesising insights from systems lipidomic studies, with an emphasis on species-level changes that refine current understandings of LacCer function and responses in health and disease.
Initial studies that made biological measures of LacCer relied on thin-layer chromatography, immunoblotting and radiolabelled GSLs to quantify total LacCer in biopsy tissue, cell lines and animal models (Refs Reference Rajesh, Kolmakova and Chatterjee15–Reference Bodas, Min and Vij20). These approaches provided evidence linking LacCer to chronic conditions such as cardiovascular disease (CVD), chronic inflammatory lung diseases, inflammatory bowel disease (IBD) and cancer (Refs Reference Rajesh, Kolmakova and Chatterjee15–Reference Bodas, Min and Vij20) However, these approaches lacked the resolution to distinguish individual lipid species, masking the biological relevance of specific fatty acyl-chain variants. Lipidomic studies that use mass spectrometry (MS) have reported elevated total LacCer levels across various chronic inflammatory diseases, particularly those involving cardiometabolic dysfunction, e.g., atherosclerosis (Refs Reference Mukhin, Chao and Kruth21, Reference Hammad, Harden, Wilson, Twal, Nietert and Oates22), non-alcoholic steatohepatitis (NASH) (Ref. Reference Apostolopoulou, Gordillo, Koliaki, Gancheva, Jelenik, De Filippo, Herder, Markgraf, Jankowiak, Esposito, Schlensak, Scherer and Roden23) and Type 2 Diabetes (T2D) (Refs Reference Shui, Lam, Stebbins, Kusunoki, Duan, Li, Cheong, Soon, Kelly and Wenk24, Reference Wilmott, Grambergs, Allegood, Lyons and Mandal25); immune-mediated injury, e.g., lupus nephritis (Ref. Reference Wolf, Blaschke, Mungaray, Weselman, Stefanenko, Fedoriuk, Bai, Rodgers, Palygin, Drake and Nowling26) and burn injury (Ref. Reference Yau, Fear, Gray, Ryan, Holmes, Nicholson, Whiley and Wood27); and neurodegeneration, e.g., Alzheimer’s disease (AD) (Refs Reference Noel, Ingrand and Barrier28, Reference Oizumi, Sugimura, Totsune, Kawasaki, Ohshiro, Baba, Kimpara, Sakuma, Hasegawa, Kawahata, Fukunaga and Takeda29) and Parkinson’s disease (PD) (Ref. Reference Oizumi, Sugimura, Totsune, Kawasaki, Ohshiro, Baba, Kimpara, Sakuma, Hasegawa, Kawahata, Fukunaga and Takeda29). While total LacCer is often elevated in these conditions, it has also been reported to decrease with biological ageing (Ref. Reference Liu, Aziz, Landstra and Breteler30), cancer metastasis (Ref. Reference Szász, Koroknai, Várvölgyi, Pál, Szűcs, Pikó, Emri, Janka, Szabó, Ádány and Balázs31) and in T2D risk (Ref. Reference Muilwijk, Goorden, Celis-Morales, Hof, Ghauharali-van Der Vlugt, Beers-Stet, Gill, Vaz and Van Valkengoed32). These conflicting trends of total LacCer levels in T2D likely reflect the cumulative effect of individual LacCer species, where chain-specific variations, some increasing and others decreasing, skew the overall trend at the LacCer subclass level.
Recent advances in liquid chromatography-tandem MS (LC–MS/MS) enable species-level identification and quantification of LacCers (Ref. Reference Han33). Therefore, this review builds upon the limitations of relying solely on total LacCer measurements and emphasises the need for detailed analyses to resolve the roles of individual LacCer species in specific biological contexts. Accordingly, all lipidomic studies reporting LacCer species included in this review are summarised in Supplementary Tables S1–S6 (Refs Reference Hammad, Hardin, Wilson, Twal, Nietert and Oates34–Reference Boenzi, Catesini, Sacchetti, Tagliaferri, Dionisi-Vici and Deodato80, Reference Mukhin, Chao and Kruth21–Reference Muilwijk, Goorden, Celis-Morales, Hof, Ghauharali-van Der Vlugt, Beers-Stet, Gill, Vaz and Van Valkengoed32), while key mechanistic findings are synthesised in the main text.
Systems-level LacCer signatures and disease-associated alterations
LacCer is a bioactive GSL whose abundance has been associated with immune, metabolic and inflammatory responses across systemic contexts in health and disease. Lipidomic studies demonstrate that both the abundance and acyl-chain composition of LacCers vary across biological systems, including sex-specific differences, with emerging evidence also indicating variability across ethnic groups (Ref. Reference Muilwijk, Goorden, Celis-Morales, Hof, Ghauharali-van Der Vlugt, Beers-Stet, Gill, Vaz and Van Valkengoed32). In the sections that follow, we synthesise these observations across the immune, endocrine, cardiovascular, central nervous and renal systems, and examine how LacCer dysregulation manifests in cancer. Together, these system-level signatures underscore the broad physiological relevance of LacCers and the complexity of its alterations across human systemic responses to disease.
LacCers across immune and inflammatory system
LacCers are thought to play key roles in driving systemic and inflammatory responses, promoting recruitment of immune cells, cytokine signalling and endothelial activation across cardiometabolic, neural and tumour environments (Refs Reference Chatterjee, Balram and Li1, Reference Arai, Bhunia, Chatterjee and Bulkley81, Reference Yu, Ying, Wang, Liu, Zhao, Yoon, Zheng, Fang, Yang and Hua82). Within cholesterol- and sphingolipid-rich lipid rafts, LacCers modulate nicotinamide adenine dinucleotide phosphate (NADPH) oxidase activity, triggering reactive oxygen species (ROS) production, adhesion molecule expression and pro-inflammatory cytokine release (Ref. Reference Chatterjee, Balram and Li1).
Among LacCer species, unsaturated forms such as LacCer(d18:1/24:1) are particularly prone to oxidative modification (Ref. Reference Couto, Santinha, Melo, Ferreira-Fernandes, Videira, Campos, Fardilha, Domingues and Domingues83). These species undergo free-radical reactions that generate ROS and secondary products, contributing to endothelial dysfunction and facilitating the recruitment and activation of innate immune cells, particularly monocytes and neutrophils (Refs Reference Fiorelli, Anesi, Porro, Cosentino, Werba, Di Minno, Manega, Barbieri, Colombo, Marenzi, Cavalca, Tremoli and Eligini35, Reference Nakayama, Nagafuku, Suzuki, Iwabuchi and Inokuchi84). Consistent with these mechanisms, LacCer levels correlate positively with multiple inflammatory markers, including interleukin-6 (IL-6), monocyte chemoattractant protein-1 (MCP-1), macrophage inflammatory protein-1 beta (MIP-1β), C-reactive protein (CRP), fibrinogen and intercellular adhesion molecule 1 (ICAM-1), highlighting its role in systemic inflammation (Refs Reference Edsfeldt, Dunér, Ståhlman, Mollet, Asciutto, Grufman, Nitulescu, Persson, Fisher, Melander, Orho-Melander, Borén, Nilsson and Gonçalves36, Reference Berkowitz, Salazar, Ryff, Coe and Rigotti37). As a result, altered LacCer metabolism and composition have been observed in conditions that affect multiple organ systems.
LacCers are increasingly recognised as a central node in immune regulation, integrating innate immune signalling and adaptive immune responses through their role as a precursor of complex GSLs (Refs Reference Inokuchi, Nagafuku, Ohno and Suzuki13, Reference Kanoh, Nitta, Go, Inamori, Veillon, Nihei, Fujii, Kabayama, Shimoyama, Fukase, Ohto, Shimizu, Watanabe, Shindo, Aoki, Sato, Nagasaki, Yatomi, Komura and … Inokuchi14, Reference Nakayama, Nagafuku, Suzuki, Iwabuchi and Inokuchi84, Reference Nagafuku, Okuyama, Onimaru, Suzuki, Odagiri, Yamashita, Iwasaki, Fujiwara, Takayanagi, Ohno and Inokuchi85). LacCers play several roles in innate immunity, functioning both as a structural component of neutrophil membranes and as a precursor to ganglioside GM3 (Ref. Reference Kanoh, Nitta, Go, Inamori, Veillon, Nihei, Fujii, Kabayama, Shimoyama, Fukase, Ohto, Shimizu, Watanabe, Shindo, Aoki, Sato, Nagasaki, Yatomi, Komura and … Inokuchi14). Beyond its structural role, LacCer serves as a non-protein pattern-recognition receptor (PRR) that directly binds pathogen-associated molecular patterns (PAMPs), such as fungal β-glucans and bacterial lipoarabinomannan (Ref. Reference Nakayama, Nagafuku, Suzuki, Iwabuchi and Inokuchi84).
Neutrophils, as key components of the innate immune system, drive the pathology of various inflammatory diseases through tissue infiltration and activation (Refs Reference Soehnlein86, Reference Meng, Yu, Guo, Wang, Qi, Shan, Lv and Gong87). Their plasma membranes are enriched with specific LacCer species, namely (d18:1/24:0) and (d18:1/24:1), which are implicated in the formation of lipid rafts, cholesterol- and sphingolipid-rich microdomains, that facilitate signal transduction (Refs Reference Iwabuchi, Prinetti, Sonnino, Mauri, Kobayashi, Ishii, Kaga, Murayama, Kurihara, Nakayama, Yoshizaki, Takamori, Ogawa and Nagaoka3, Reference Iwabuchi, Prinetti, Sonnino, Mauri, Kobayashi, Ishii, Kaga, Murayama, Kurihara, Nakayama, Yoshizaki, Takamori, Ogawa and Nagaoka88). Within these rafts, LacCer interacts with αMβ2-integrin and the Src-family kinase Lyn, forming a signalling platform that enables receptor clustering and downstream activation (Ref. Reference Nakayama, Nagafuku, Suzuki, Iwabuchi and Inokuchi84). Notably, αMβ2-integrin lacks intrinsic catalytic activity and instead relies on association with Lyn for intracellular signalling (Ref. Reference Nakayama, Nagafuku, Suzuki, Iwabuchi and Inokuchi84). In neutrophils, these C24-containing LacCer species interact with the palmitoylated chains of Lyn within membrane rafts (Ref. Reference Chiricozzi, Ciampa, Brasile, Compostella, Prinetti, Nakayama, Ekyalongo, Iwabuchi, Sonnino and Mauri89). Upon pathogen binding, αMβ2-integrin translocates into Lyn-associated LacCer enriched rafts promoting outside-in signalling (Ref. Reference Nakayama, Nagafuku, Suzuki, Iwabuchi and Inokuchi84). This is associated with NADPH oxidase activation and the subsequent production of ROS, contributing to neutrophil priming and effector function (Refs Reference Nakayama, Nagafuku, Suzuki, Iwabuchi and Inokuchi84, Reference Iwabuchi, Prinetti, Sonnino, Mauri, Kobayashi, Ishii, Kaga, Murayama, Kurihara, Nakayama, Yoshizaki, Takamori, Ogawa and Nagaoka88).
Elevated concentrations of LacCer (d18:1/24:0) and (d18:1/24:1) have been identified in conditions characterised by increased neutrophil infiltration, including burn injury, where they discriminate non-severe burn injury from healthy paediatric individuals (Refs Reference Yau, Fear, Gray, Ryan, Holmes, Nicholson, Whiley and Wood27, Reference Kierath, Ryan, Holmes, Nicholson, Fear, Wood, Whiley and Gray57). Increased concentrations have also been reported in the intima of atherosclerotic plaques (Ref. Reference Chatterjee, Dey, Shi, Thomas and Hutchins39), in association with COVID-19 severity (Ref. Reference Uranbileg, Isago, Nakayama, Jubishi, Okamoto, Sakai, Kubota, Tsutsumi, Moriya and Kurano60) and in paediatric bacterial infections compared to viral infections (Ref. Reference Wang, Nijman, Camuzeaux, Sands, Jackson, Kaforou, Emonts, Herberg, Maconochie, Carrol, Paulus, Zenz, Van Der Flier, De Groot, Martinon-Torres, Schlapbach, Pollard, Fink, Kuijpers and … Žukovskaja58). These species are also elevated in lupus nephritis, a disease in which neutrophils contribute significantly to disease progression (Refs Reference Wolf, Blaschke, Mungaray, Weselman, Stefanenko, Fedoriuk, Bai, Rodgers, Palygin, Drake and Nowling26, Reference Powell, Brady, Tandon, Lightman, Short, Rane, Barati and Caster90). Collectively, these findings suggest that LacCer (d18:1/24:0) and (d18:1/24:1) may serve as biomarkers and functional mediators of neutrophil activity across multiple organ systems and inflammatory states.
Beyond neutrophil function, LacCer is the immediate precursor of the ganglioside GM3, with fatty-acyl chain composition largely retained upon sialylation by ST3GAL5 (Figure 2A) (Ref. Reference Kanoh, Nitta, Go, Inamori, Veillon, Nihei, Fujii, Kabayama, Shimoyama, Fukase, Ohto, Shimizu, Watanabe, Shindo, Aoki, Sato, Nagasaki, Yatomi, Komura and … Inokuchi14). Under inflammatory conditions, ST3GAL5 expression and GM3 levels are dynamically regulated in a context-dependent manner, with several studies reporting increased GM3 synthesis in response to inflammatory and metabolic stress (Refs Reference Chiricozzi, Lunghi, Valsecchi, Carsana, Bassi, Di Biase, Dobi, Ciampa, Mauri, Aureli, Inamori, Inokuchi, Sonnino and Fazzari12, Reference Wentworth, Naselli, Ngui, Smyth, Liu, O’Brien, Bruce, Weir, Cinel, Meikle and Harrison91). GM3 species act as acyl-chain-length–dependent modulators of Toll-like receptor 4 (TLR4) signalling, a key pathway in innate immune activation and metabolic inflammation (Ref. Reference Kanoh, Nitta, Go, Inamori, Veillon, Nihei, Fujii, Kabayama, Shimoyama, Fukase, Ohto, Shimizu, Watanabe, Shindo, Aoki, Sato, Nagasaki, Yatomi, Komura and … Inokuchi14). Long-chain GM3 (LC-GM3) species, particularly GM3(d18:1/16:0), inhibit TLR4 activation, while very-LC-GM3 species, including GM3(d18:1/22:0) and GM3(d18:1/24:0), can enhance signalling if LC-GM3 species are depleted (Ref. Reference Furukawa, Clausen, Sato, Taniguchi, Honke and Fukuda5). Due to the preservation of LacCer acyl-chain patterns in GM3, any alterations in LacCer species may mirror changes in GM3-mediated immune regulation (Ref. Reference Kanoh, Nitta, Go, Inamori, Veillon, Nihei, Fujii, Kabayama, Shimoyama, Fukase, Ohto, Shimizu, Watanabe, Shindo, Aoki, Sato, Nagasaki, Yatomi, Komura and … Inokuchi14). Namely, increases in very-long-chain LacCers could indicate enhanced neutrophil priming, while depletion of LacCer(d18:1/16:0) may indicate GM3-driven activation of TLR4 signalling.
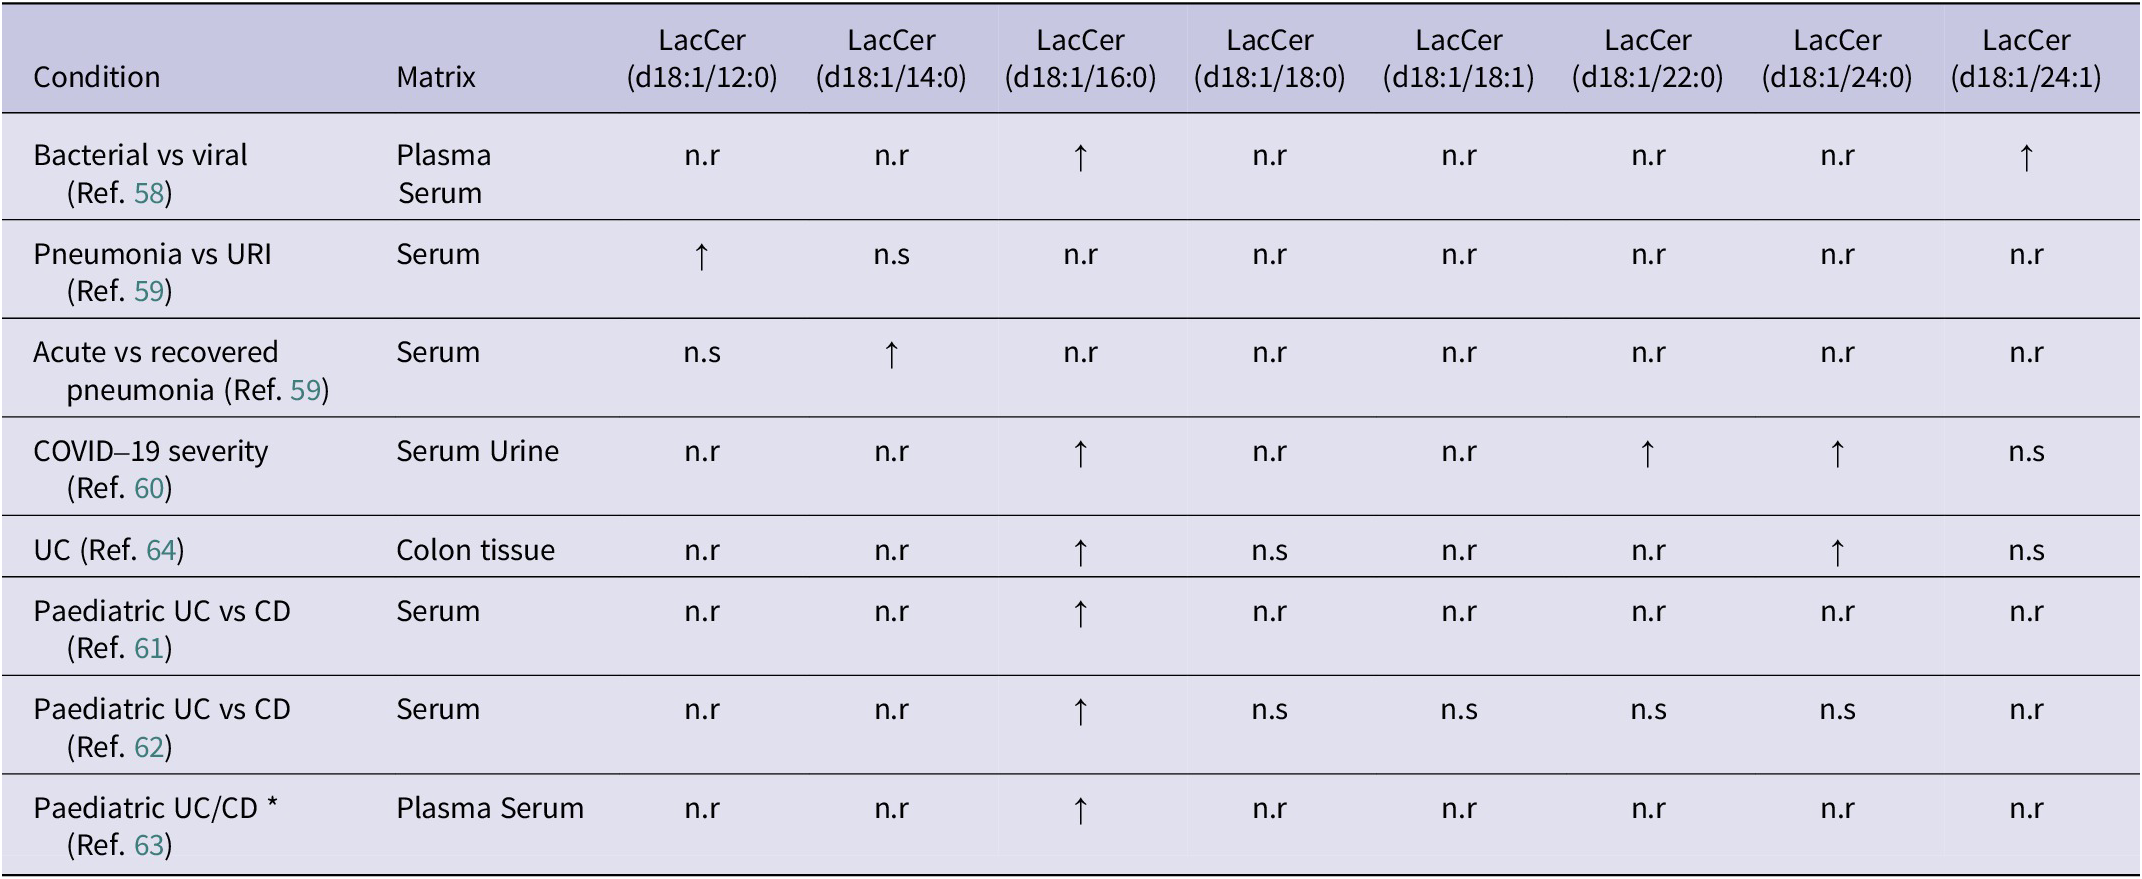
Alterations in LacCer acyl-chain composition are a recurring feature of immune-mediated inflammatory disorders, highlighting its potential role in disease pathogenesis. In respiratory infections, bacterial and viral aetiologies are associated with differing LacCer species and stage of disease dependency. For example, LacCer(d18:1/12:0) is increased in pneumonia versus upper respiratory tract infection (URI), and LacCer(d18:1/14:0) has been observed in recovered compared to acute pneumonia (Table 1) (Refs Reference Wang, Nijman, Camuzeaux, Sands, Jackson, Kaforou, Emonts, Herberg, Maconochie, Carrol, Paulus, Zenz, Van Der Flier, De Groot, Martinon-Torres, Schlapbach, Pollard, Fink, Kuijpers and … Žukovskaja58, Reference Wei, Xu, Tu, Zhang, Yang, Zhou, Zhang, Yang, Xie, Du, Chen and Lu59). In digestive immune-mediated disorders, including paediatric ulcerative colitis (UC) and Crohn’s disease (CD), Salihovic et al. (Ref. Reference Salihovic, Nyström, Mathisen, Kruse, Olbjørn, Andersen, Noble, Dorn-Rasmussen, Bazov, Perminow, Opheim, Detlie, Huppertz-Hauss, Hedin, Carlson, Öhman, Magnusson, Keita, Söderholm and … Halfvarson63) reported increased serum LacCer(d18:1/16:0) compared with symptomatic controls (Table 1). Similarly, Daniluk et al. (Ref. Reference Daniluk, Daniluk, Kucharski, Kowalczyk, Pietrowska, Samczuk, Filimoniuk, Kretowski, Lebensztejn and Ciborowski61) showed that LacCer(d18:1/16:0) discriminated UC from CD in paediatric patients (Table 1), a finding further supported by Filimoniuk et al. (Ref. Reference Filimoniuk, Blachnio-Zabielska, Imierska, Lebensztejn and Daniluk62), who demonstrated positive correlations between LacCer(d18:1/16:0) and clinical inflammatory markers, including CRP, platelet count and white blood cell (WBC) count (Supplementary Table S2). In adults with UC, Bazarganipour et al. (Ref. Reference Bazarganipour, Hausmann, Oertel, El-Hindi, Brachtendorf, Blumenstein, Kubesch, Sprinzl, Birod, Hahnefeld, Trautmann, Thomas, Herrmann, Geisslinger, Schiffmann and Grösch64) reported increased LacCer(d18:1/16:0) and LacCer(d18:1/24:0) in inflamed colonic tissue of UC participants, whereas serum LacCer(d18:1/24:1) was reduced in severe disease stages (Table 1). Collectively, these results suggest that the LacCer acyl-chain patterns are linked to distinct biological matrices, inflammatory states and immune pathways.
Summary of altered lactosylceramide (LacCer) species between immune-mediated conditions

Table 1. Long description
Beginning at the top row, the table lists eight immune-mediated conditions in the leftmost column: Bacterial vs viral, Pneumonia vs U R I, Acute vs recovered pneumonia, COVID-19 severity, U C, Paediatric U C vs C D (two references), and Paediatric U C/C D. The next column specifies sample matrices, including plasma, serum, urine, and colon tissue. Moving right, each subsequent column represents a distinct LacCer species: d18:1/12:0, d18:1/14:0, d18:1/16:0, d18:1/18:0, d18:1/18:1, d18:1/22:0, d18:1/24:0, and d18:1/24:1. For each condition, the table indicates whether a LacCer species is increased (upward arrow), decreased (downward arrow), not reported (n.r), or not significant (n.s). Increased LacCer (d18:1/16:0) is consistently observed across all conditions except U C (d18:1/18:0, d18:1/24:0 also increased), COVID-19 severity (d18:1/22:0, d18:1/24:0 also increased), and Paediatric U C vs C D (d18:1/14:0 increased in one reference). Most other species are not reported or not significant. The table footnote defines all abbreviations and symbols used.
Note: ↑: increased vs comparison; ↓: decreased vs comparison; *: condition vs control; CD: Crohn’s disease; n.r: not reported; n.s: no significance reported; UC: ulcerative colitis; URI: upper respiratory tract infection.
Endocrine system
Mechanistically, LacCers influence insulin signalling indirectly by converting to GM3 (Figure 2A), an established modulator of insulin receptor function (Refs Reference Chiricozzi, Lunghi, Valsecchi, Carsana, Bassi, Di Biase, Dobi, Ciampa, Mauri, Aureli, Inamori, Inokuchi, Sonnino and Fazzari12, Reference Yamashita92). GM3 accumulation alters the structure of lipid rafts in insulin-sensitive tissues, including the liver, skeletal muscle and adipose tissue (Refs Reference Yamashita92, Reference Dam, Wang, Sheu, Vijay, Shipp, Miller and Paller93). This impairs insulin receptor phosphorylation and reduces downstream signalling through insulin receptor substrate-1 (IRS-1) and the phosphoinositide 3-kinase (PI3K)/protein kinase B (Akt) pathway (Refs Reference Yamashita92, Reference Dam, Wang, Sheu, Vijay, Shipp, Miller and Paller93). As a result, glucose transporter type 4 (GLUT-4) translocation is diminished, which limits glucose uptake and promotes insulin resistance (IR) (Refs Reference Yamashita92, Reference Dam, Wang, Sheu, Vijay, Shipp, Miller and Paller93). This is likely compounded by LacCer, which induces the activation of NADPH oxidase within lipid rafts, promoting ROS generation and inflammatory signalling, thereby amplifying IR and endothelial dysfunction (Ref. Reference Chatterjee, Balram and Li1).
TLR4 signalling is increasingly recognised as a mediator of obesity and metabolic disorders, linking innate immune activation to endocrine dysfunction (Ref. Reference Kanoh, Nitta, Go, Inamori, Veillon, Nihei, Fujii, Kabayama, Shimoyama, Fukase, Ohto, Shimizu, Watanabe, Shindo, Aoki, Sato, Nagasaki, Yatomi, Komura and … Inokuchi14). Among the studies examining LacCer species in metabolic states, most focused on associations with insulin resistance, glucose homeostasis and vascular function (Refs Reference Shui, Lam, Stebbins, Kusunoki, Duan, Li, Cheong, Soon, Kelly and Wenk24, Reference Muilwijk, Goorden, Celis-Morales, Hof, Ghauharali-van Der Vlugt, Beers-Stet, Gill, Vaz and Van Valkengoed32, Reference Berkowitz, Salazar, Ryff, Coe and Rigotti37, Reference Kim, Jung, Lee and Lee41–Reference Mirza, Haloul, Hassan, Masrur, Mostafa, Bianco, Ali, Minshall and Mahmoud49) (Supplementary Table S2). Notably, one study in metabolic syndrome reported that total LacCer levels were significantly associated with increased inflammatory markers, including IL-6, CRP, fibrinogen and ICAM, which are well-established downstream markers of TLR4/NF-κB signalling (Ref. Reference Berkowitz, Salazar, Ryff, Coe and Rigotti37). Taken together, these findings suggest that LacCer variation in endocrine disorders may influence metabolic inflammation through GM3-mediated regulation of TLR4 signalling, although further studies are needed to confirm this mechanism.
Individual LacCer species appear to track across the differing metabolic phenotypes. In contrast, metabolic syndrome (MetS) and IR are inversely associated with LacCer(d18:1/14:0), (d18:1/16:0) and (d18:1/24:1), alongside both HOMA-IR and T2D (Table 2) (Refs Reference Berkowitz, Salazar, Ryff, Coe and Rigotti37, Reference Berkowitz, Razquin, Salazar, Biancardi, Estruch, Ros, Fitó, Corella, Coe, Ryff, Ruiz-Canela, Salas-Salvado, Wang, Hu, Deik, Martínez-Gonzalez and Rigotti45). However, LacCer(d18:1/18:1) exhibits a positive association with HOMA-IR (Supplementary Table S2), suggesting that the metabolic burden of LacCer is driven by specific acyl-chain remodelling rather than a uniform shift across all species (Ref. Reference Berkowitz, Salazar, Ryff, Coe and Rigotti37). Notably, while these specific species are reduced, total LacCer levels remain positively associated with systemic inflammatory markers, such as IL-6 and CRP (Supplementary Table S2) (Ref. Reference Berkowitz, Salazar, Ryff, Coe and Rigotti37).
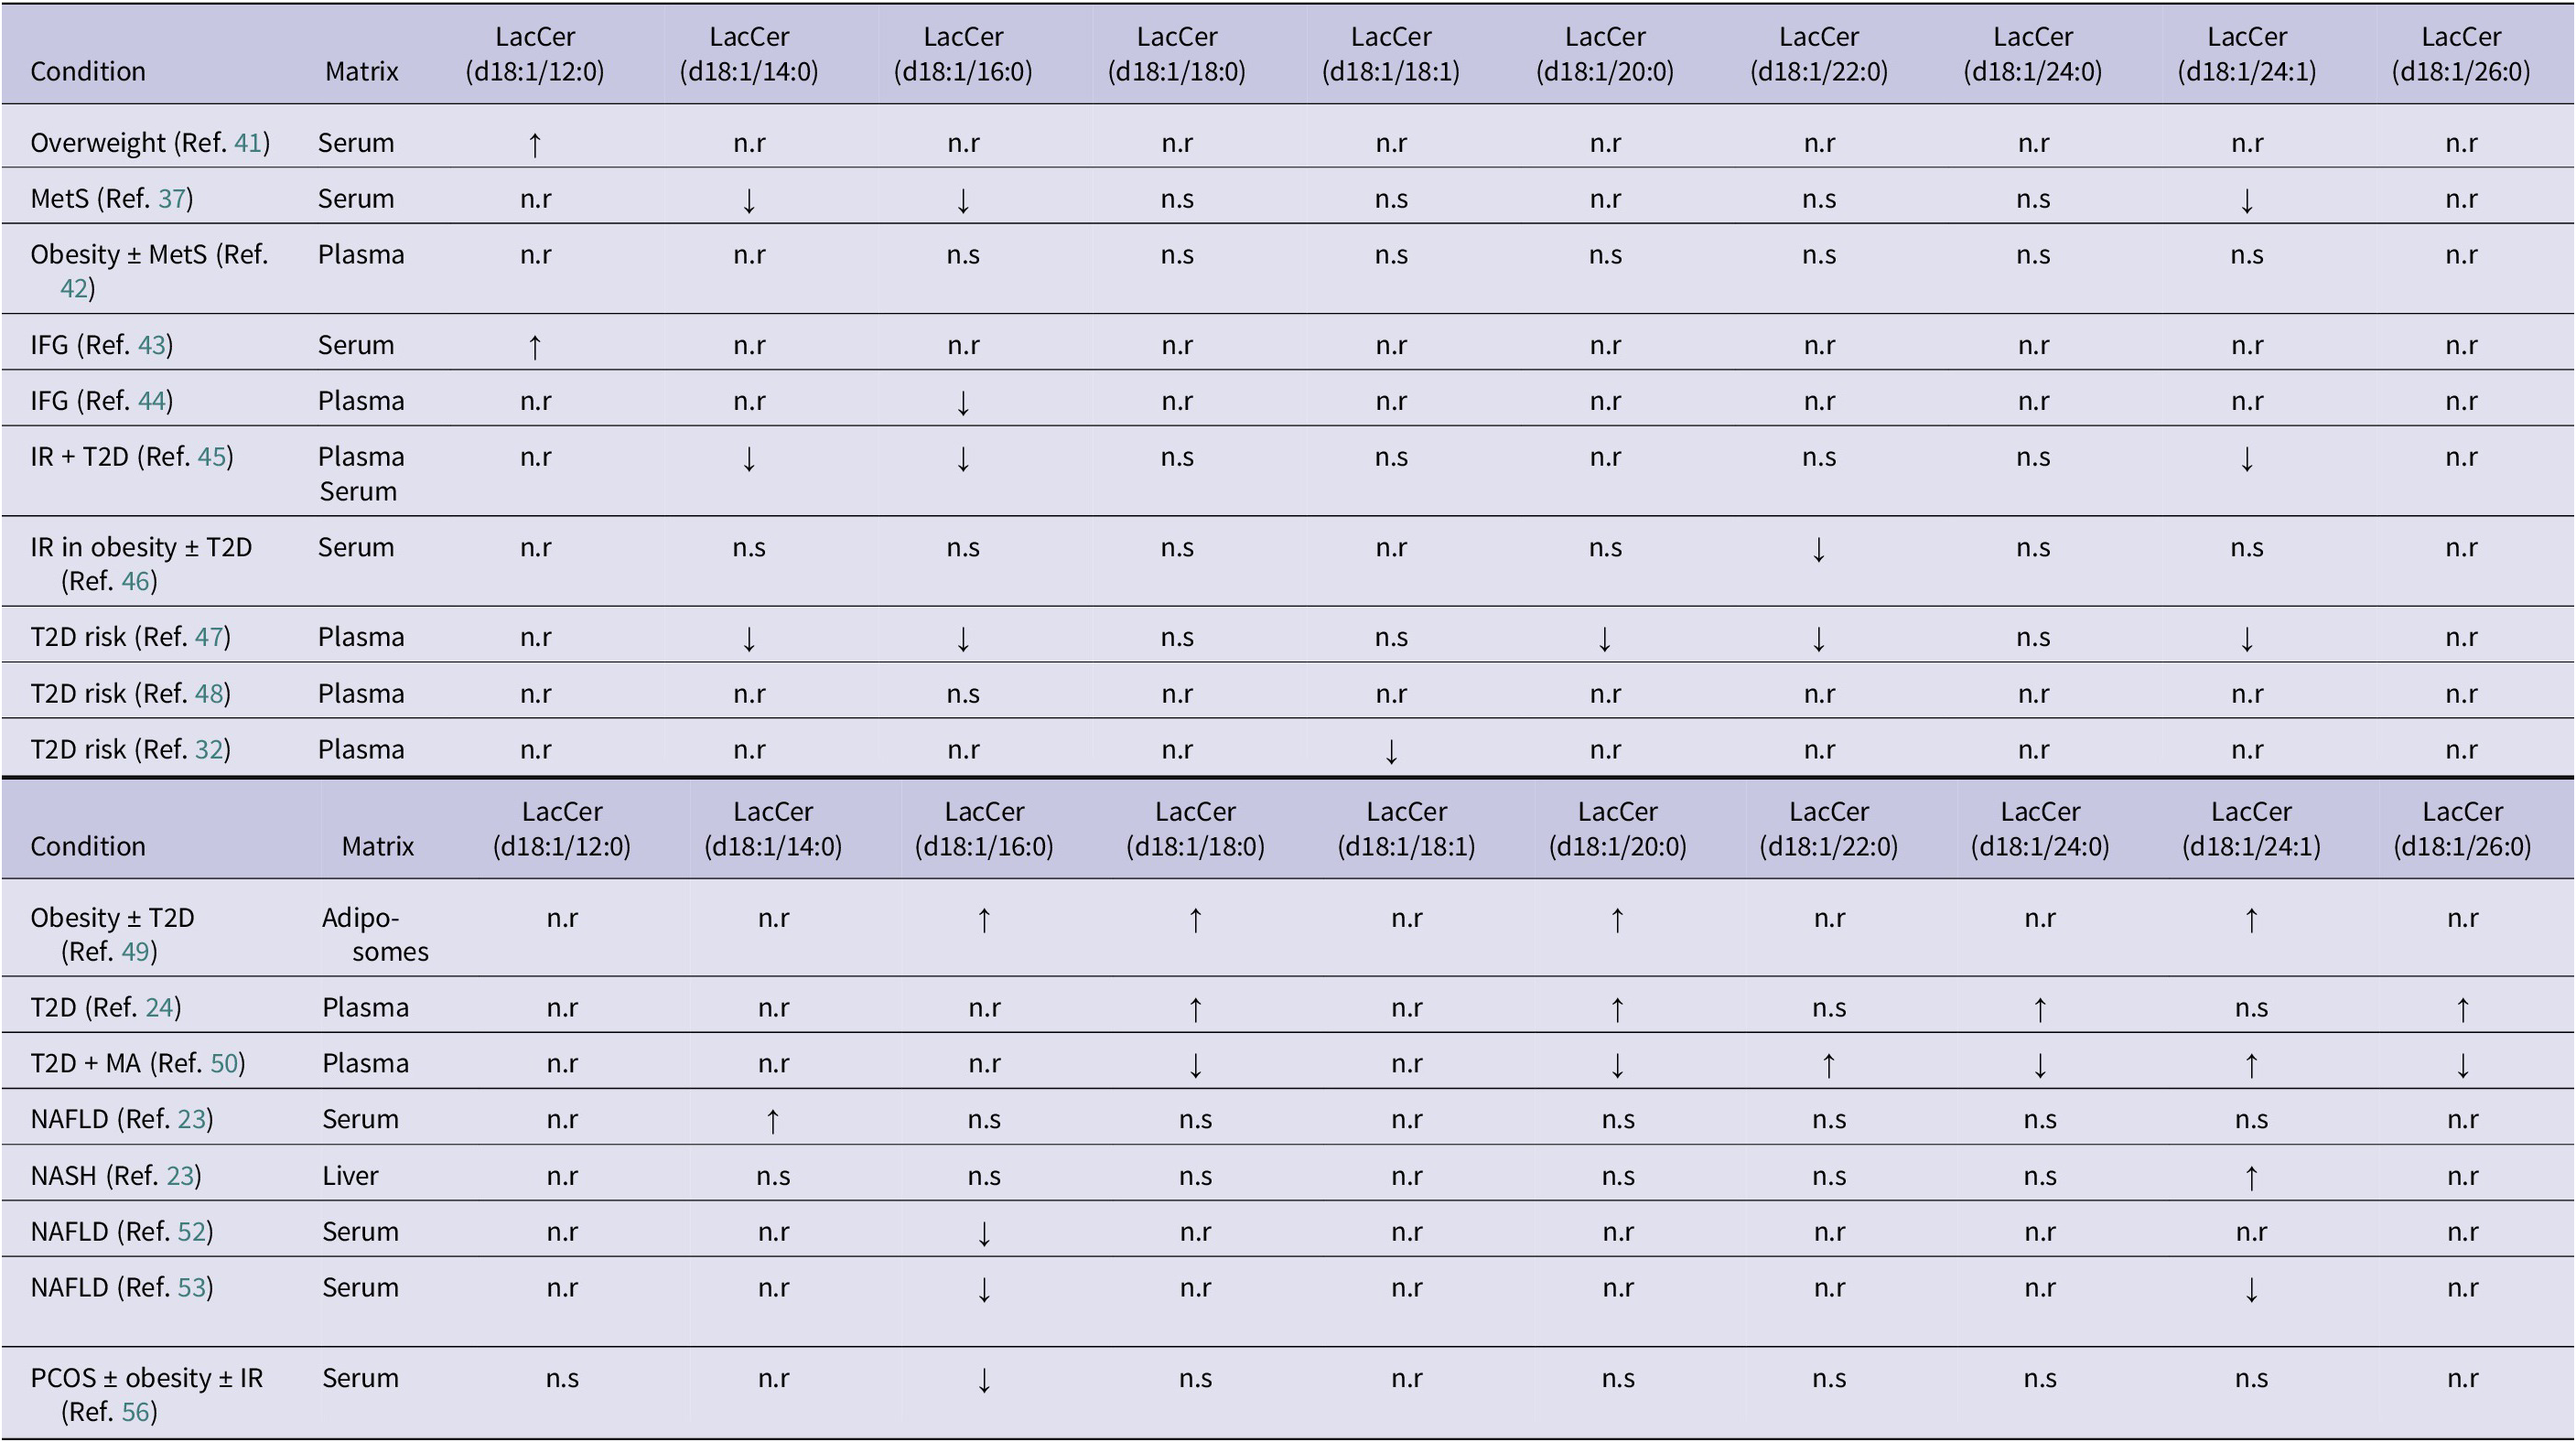
Summary of altered lactosylceramide (LacCer) species between endocrine-mediated conditions

Table 2. Long description
The table columns are Condition, Matrix, and LacCer species (d18:1/12:0, 14:0, 16:0, 18:0, 18:1, 20:0, 22:0, 24:0, 24:1, and 26:0).
Key findings include:
* Overweight (Serum): LacCer (d18:1/12:0) is increased.
* MetS (Serum): LacCer (d18:1/14:0), (d18:1/16:0), and (d18:1/24:1) are decreased.
* IFG (Serum): LacCer (d18:1/12:0) is increased.
* IFG (Plasma): LacCer (d18:1/16:0) is decreased.
* I R plus T 2 D (Plasma/Serum): LacCer (d18:1/14:0), (d18:1/16:0), and (d18:1/24:1) are decreased.
* T 2 D risk (Plasma): Multiple species including (d18:1/14:0), (d18:1/16:0), (d18:1/20:0), (d18:1/22:0), and (d18:1/24:1) are decreased across different studies.
* Obesity plus T 2 D (Adipo-somes): LacCer (d18:1/16:0), (d18:1/18:0), (d18:1/20:0), and (d18:1/24:1) are increased.
* T 2 D (Plasma): LacCer (d18:1/18:0), (d18:1/20:0), (d18:1/24:0), and (d18:1/26:0) are increased.
* T 2 D plus M A (Plasma): LacCer (d18:1/18:0), (d18:1/20:0), (d18:1/24:0), and (d18:1/26:0) are decreased, while (d18:1/22:0) and (d18:1/24:1) are increased.
* N A F L D and N A S H: Show mixed results with increases in (d18:1/14:0) or (d18:1/24:1) and decreases in (d18:1/16:0).
* P C O S (Serum): LacCer (d18:1/16:0) is decreased.
Note: ↑: increased vs control; ↓: decreased vs control; IFG: impaired fasting glucose; IR: insulin resistance; MA: macroalbuminuria; MetS: metabolic syndrome; NAFLD: non-alcoholic fatty liver disease; NASH: non-alcoholic steatohepatitis; n.r: not reported; n.s: no significance reported; PCOS: polycystic ovarian syndrome; T2D: type 2 diabetes mellitus.
In the serum of obese (BMI 28.0–39.9 kg/m2) individuals with IR, LacCer(d18:1/14:0) associates positively with intramuscular triglyceride accumulation (Supplementary Table S2), whereas LacCer(d18:1/22:0) is predictive of whole-body IR (Table 2) (Ref. Reference Perreault, Starling, Glueck, Brozinick, Sanders, Siddall, Kuo, Dabelea and Bergman46). In contrast, plasma studies of T2D risk show divergent trends. In women with gestational diabetes, LacCer species, including (d18:1/14:0), (d18:1/16:0), (d18:1/20:0), (d18:1/22:0) and (d18:1/24:1) (Table 2), are negatively associated with the 8-year progression to T2D (Ref. Reference Lai, Al Rijjal, Röst, Dai, Gunderson and Wheeler47). Furthermore, total plasma LacCer, along with the (d18:1/18:1) and (d18:1/18:2) species, was found to be negatively associated with T2D risk in a separate study (Table 2) (Ref. Reference Muilwijk, Goorden, Celis-Morales, Hof, Ghauharali-van Der Vlugt, Beers-Stet, Gill, Vaz and Van Valkengoed32). Beyond the systemic circulation, LacCer levels were significantly altered within adiposomes from obese participants (BMI > 30.0 kg/m2) with T2D (Ref. Reference Mirza, Haloul, Hassan, Masrur, Mostafa, Bianco, Ali, Minshall and Mahmoud49). Adiposomes from obese patients with T2D exhibit enriched LacCer(d18:1/16:0), (d18:1/18:0), (d18:1/20:0) and (d18:2/24:1) (Table 2), with the authors reporting that the uptake and fusion of these adiposomes with endothelial cells was fourfold higher than in controls, leading to an increase of LacCer(d18:1/16:0) and (d18:1/18:0) in these cells (Ref. Reference Mirza, Haloul, Hassan, Masrur, Mostafa, Bianco, Ali, Minshall and Mahmoud49). These findings suggest that whilst plasma LacCer levels may vary with T2D risk, these specific species are sequestered and transported via adiposomes, which may contribute to endothelial dysfunction.
The association between LacCers and metabolic dysfunction extends to hepatic lipid accumulation, where findings vary according to both the tissue compartment and the degree of underlying pathology. In serum, LacCer(d18:1/14:0) is positively associated with the presence of non-alcoholic fatty liver disease (NAFLD) (Table 2) (Ref. Reference Apostolopoulou, Gordillo, Koliaki, Gancheva, Jelenik, De Filippo, Herder, Markgraf, Jankowiak, Esposito, Schlensak, Scherer and Roden23). In liver tissue, however, both total LacCer and the (d18:1/24:1) species are increased in patients with non-alcoholic steatohepatitis (NASH) (Table 2) (Ref. Reference Apostolopoulou, Gordillo, Koliaki, Gancheva, Jelenik, De Filippo, Herder, Markgraf, Jankowiak, Esposito, Schlensak, Scherer and Roden23). Other serum analyses indicate that LacCer(d18:1/16:0) is associated with higher hepatic attenuation, despite exhibiting an inverse association with fasting glucose and T2D incidence over 5 years (Ref. Reference Gadgil, Sarkar, Sands, Lewis, Herrington and Kanaya52). In contrast, LacCer(d18:1/16:0) and (d18:1/24:1) in both serum and liver tissue have been associated with lower hepatic triglyceride levels (Ref. Reference Faquih, Van Klinken, Li‐Gao, Noordam, Van Heemst, Boone, Sheridan, Michelotti, Lamb, De Mutsert, Rosendaal, Van Hylckama Vlieg, Van Dijk and Mook‐Kanamori53). Further shifts are evident in visceral adipose tissue, where LacCer(d18:1/14:0), (d18:1/16:0), (d18:1/24:0) and (d18:1/24:1) exhibit positive associations with adiponectin (Ref. Reference Apostolopoulou, Gordillo, Koliaki, Gancheva, Jelenik, De Filippo, Herder, Markgraf, Jankowiak, Esposito, Schlensak, Scherer and Roden23).
Collectively, these findings indicate that LacCer variation across metabolic disorders is attributed to specific acyl-chain reorganisation and its distribution across differing tissue types. Whether these variations are driven by inflammatory or metabolic signalling remains to be determined, highlighting an important gap in our mechanistic understanding of endocrine dysfunction.
Cardiometabolic health
LacCers have been implicated as a mediator of vascular inflammation and endothelial dysfunction, processes central to atherosclerosis development and progression. Mechanistically, LacCer activates protein kinase C alpha and epsilon isoforms (PKCα/ε) and phospholipase A₂ pathways in monocytes (Ref. Reference Gong, Wei, Chowdhury and Chatterjee94). This activation leads to upregulation of platelet endothelial cell adhesion molecule-1 (PECAM-1) and increases monocyte adhesion to endothelial cells (Ref. Reference Gong, Wei, Chowdhury and Chatterjee94). These events promote vascular inflammation and contribute to early atherogenic processes.
LacCer(d18:1/12:0) is elevated in overweight individuals (BMI 25–<30 kg/m2) compared with normal-weight individuals (BMI 18.5–<25 kg/m2) and positively correlates with brachial–ankle pulse wave velocity (baPWV), a marker of arterial stiffness and cardiovascular risk (Ref. Reference Kim, Jung, Lee and Lee41). Elevations in LacCer(d18:1/12:0) characterise both overweight individuals (BMI 25.0–29.9 kg/m2) and those with impaired fasting glucose (IFG) (Table 2), where it further correlates with arterial stiffness (Supplementary Table S2) (Refs Reference Kim, Jung, Lee and Lee41, Reference Jung, Kim, Lee, Lee and Lee43). In a separate study, LacCer(d18:1/12:0) was positively associated with both fasting glucose and baPWV, supporting a mechanistic link between arterial stiffness and cardiovascular risk (Ref. Reference Jung, Kim, Lee, Lee and Lee43). Chatterjee et al. (Ref. Reference Chatterjee, Dey, Shi, Thomas and Hutchins39) examined LacCer distribution across arterial layers, categorising intima samples as normal (no lesions), fibrous plaques without calcification, or plaques with calcification; in each case, the intima was separated from the media before analysis. LacCer(d18:1/16:0), (d18:1/22:0), (d18:1/22:1) and (d18:1/24:0) were enriched in the intima of atherosclerotic plaques compared with unaffected aortic intima, whereas LacCer(d18:1/18:0) and (d18:1/18:1) were reduced, and LacCer(d18:1/16:1), (d18:1/17:0), (d18:1/18:2) and (d18:1/20:1) were absent (Ref. Reference Chatterjee, Dey, Shi, Thomas and Hutchins39). In systemic lupus erythematosus (SLE), circulating LacCer species show distinct vascular associations. LacCer(d18:1/24:1) negatively correlated with total plaque area (TPA) at baseline but positively correlated with TPA after one year of follow-up, while LacCer(d18:1/26:0) and (d18:1/26:1) differentiated individuals with atherosclerosis from those without (Refs Reference Hammad, Harden, Wilson, Twal, Nietert and Oates22, Reference Hammad, Hardin, Wilson, Twal, Nietert and Oates34). Notably, LacCer(d18:1/16:0) and (d18:1/24:0) were enriched in aortic plaques but inversely associated with age- and sex-adjusted TPA in SLE (Refs Reference Hammad, Harden, Wilson, Twal, Nietert and Oates22, Reference Hammad, Hardin, Wilson, Twal, Nietert and Oates34). This contrast between tissue enrichment and plasma associations may reflect distinct local versus systemic regulation of LacCer species or immune-mediated mechanisms specific to SLE. Significantly, LacCer(d18:1/16:0) and (d18:1/24:0), while enriched in aortic plaques, were inversely associated with age- and sex-adjusted TPA in a SLE cohort (Refs Reference Hammad, Harden, Wilson, Twal, Nietert and Oates22, Reference Chatterjee, Dey, Shi, Thomas and Hutchins39). This contrast between arterial enrichment and plasma associations may reflect distinct local versus systemic LacCer species regulation or immune-mediated mechanisms specific to SLE.
These findings suggest that LacCers may contribute to atherogenesis through processes shaped by their localisation in the arterial wall and inflammatory influences. However, whether these inflammatory influences are local, systemic, or both remains unknown, highlighting an important gap in our understanding of how LacCers contribute to atherosclerosis.
Central nervous system
The brain is particularly vulnerable to disruptions in lipid metabolism due to its exceptionally high lipid content and reliance on GSLs, including LacCers, for membrane structure, signalling and synaptic function (Refs Reference Hülsmeier11, Reference Hamilton, Hillard, Spector and Watkins95). Mechanistically, LacCer is a pivotal intermediate in both ceramide and broader GSL metabolism (Figures 1 and 2). In addition to synthesis from ceramide, LacCers can also arise through ganglioside remodelling. For example, binding of elastin-derived peptides to the elastin receptor complex leads to activation of the neuraminidase-1 (NEU1) sialidase subunit, which converts GM3 to LacCers, leading to extracellular signal-regulated kinase (ERK) activation (Ref. Reference Scandolera, Rabenoelina, Chaintreuil, Rusciani, Maurice, Blaise, Romier-Crouzet, El Btaouri, Martiny, Debelle and Duca97). This NEU1-dependent route provides an additional mechanism by which altered LacCer metabolism may contribute to neurodegenerative diseases.
The accumulation of LacCers contributes to the disruption of plasma membrane microdomains, particularly lipid rafts, thereby impairing neuronal signalling and promoting the generation of ROS, which impairs mitochondrial function (Refs Reference Chatterjee, Balram and Li1, Reference Chatterjee and Pandey2). Within neurons, astrocytes and microglia, LacCer-enriched lipid rafts facilitate inflammation that exacerbates oxidative damage in the brain (Refs Reference Yu, Ying, Wang, Liu, Zhao, Yoon, Zheng, Fang, Yang and Hua82, Reference Grassi, Giussani, Mauri, Prioni, Sonnino and Prinetti98, Reference Zhang, Gao, Feng and Li99). In astrocytes, LacCer activates nuclear factor-κB (NF-κB), promoting chemokine release, such as MCP-1 (Refs Reference Yu, Ying, Wang, Liu, Zhao, Yoon, Zheng, Fang, Yang and Hua82, Reference Zhang, Gao, Feng and Li99). Under these pro-inflammatory conditions, the accumulation of LacCers result in the dysregulation of GSL hydrolases and elevated cholesterol in lipid rafts (Ref. Reference Chiricozzi, Lunghi, Valsecchi, Carsana, Bassi, Di Biase, Dobi, Ciampa, Mauri, Aureli, Inamori, Inokuchi, Sonnino and Fazzari12). The resulting activation of mitogen-activated protein kinase (MAPK), ERK 1/2 and NF-κB signalling pathways leads to astrocyte proliferation and neuronal apoptosis (Ref. Reference Yu, Ying, Wang, Liu, Zhao, Yoon, Zheng, Fang, Yang and Hua82). Additionally, LacCer accumulation dysregulates ganglioside metabolism by enriching GM3, which compromises membrane stability, reduces lipid raft fluidity and impairs signal transduction (Figure 2A) (Refs Reference Chiricozzi, Lunghi, Valsecchi, Carsana, Bassi, Di Biase, Dobi, Ciampa, Mauri, Aureli, Inamori, Inokuchi, Sonnino and Fazzari12, Reference Yu, Ying, Wang, Liu, Zhao, Yoon, Zheng, Fang, Yang and Hua82). Altered GSL composition in lysosomes and plasma membranes exacerbates neurodegenerative processes (Refs Reference Chiricozzi, Lunghi, Valsecchi, Carsana, Bassi, Di Biase, Dobi, Ciampa, Mauri, Aureli, Inamori, Inokuchi, Sonnino and Fazzari12, Reference Yu, Ying, Wang, Liu, Zhao, Yoon, Zheng, Fang, Yang and Hua82).
Beyond its role in catabolism, NEU1 participates in receptor signalling within lipid rafts, activating ERK1/2 and NF-κB pathways and is implicated in Alzheimer’s disease (AD) pathology (Refs Reference Rusciani, Duca, Sartelet, Chatron-Colliet, Bobichon, Ploton, Le Naour, Blaise, Martiny and Debelle96, Reference Alzarea100). Overall, dysregulated LacCer metabolism is linked to oxidative stress, neuroinflammatory signalling, compromised synaptic function and progressive neuronal loss across a range of neurodegenerative conditions (Refs Reference Yu, Ying, Wang, Liu, Zhao, Yoon, Zheng, Fang, Yang and Hua82, Reference Couto, Santinha, Melo, Ferreira-Fernandes, Videira, Campos, Fardilha, Domingues and Domingues83). However, these disorders differ markedly in their underlying molecular drivers, including protein aggregation, immune-mediated injury and cell-type specificity, which provides a framework for interpreting disease-specific LacCer signatures.
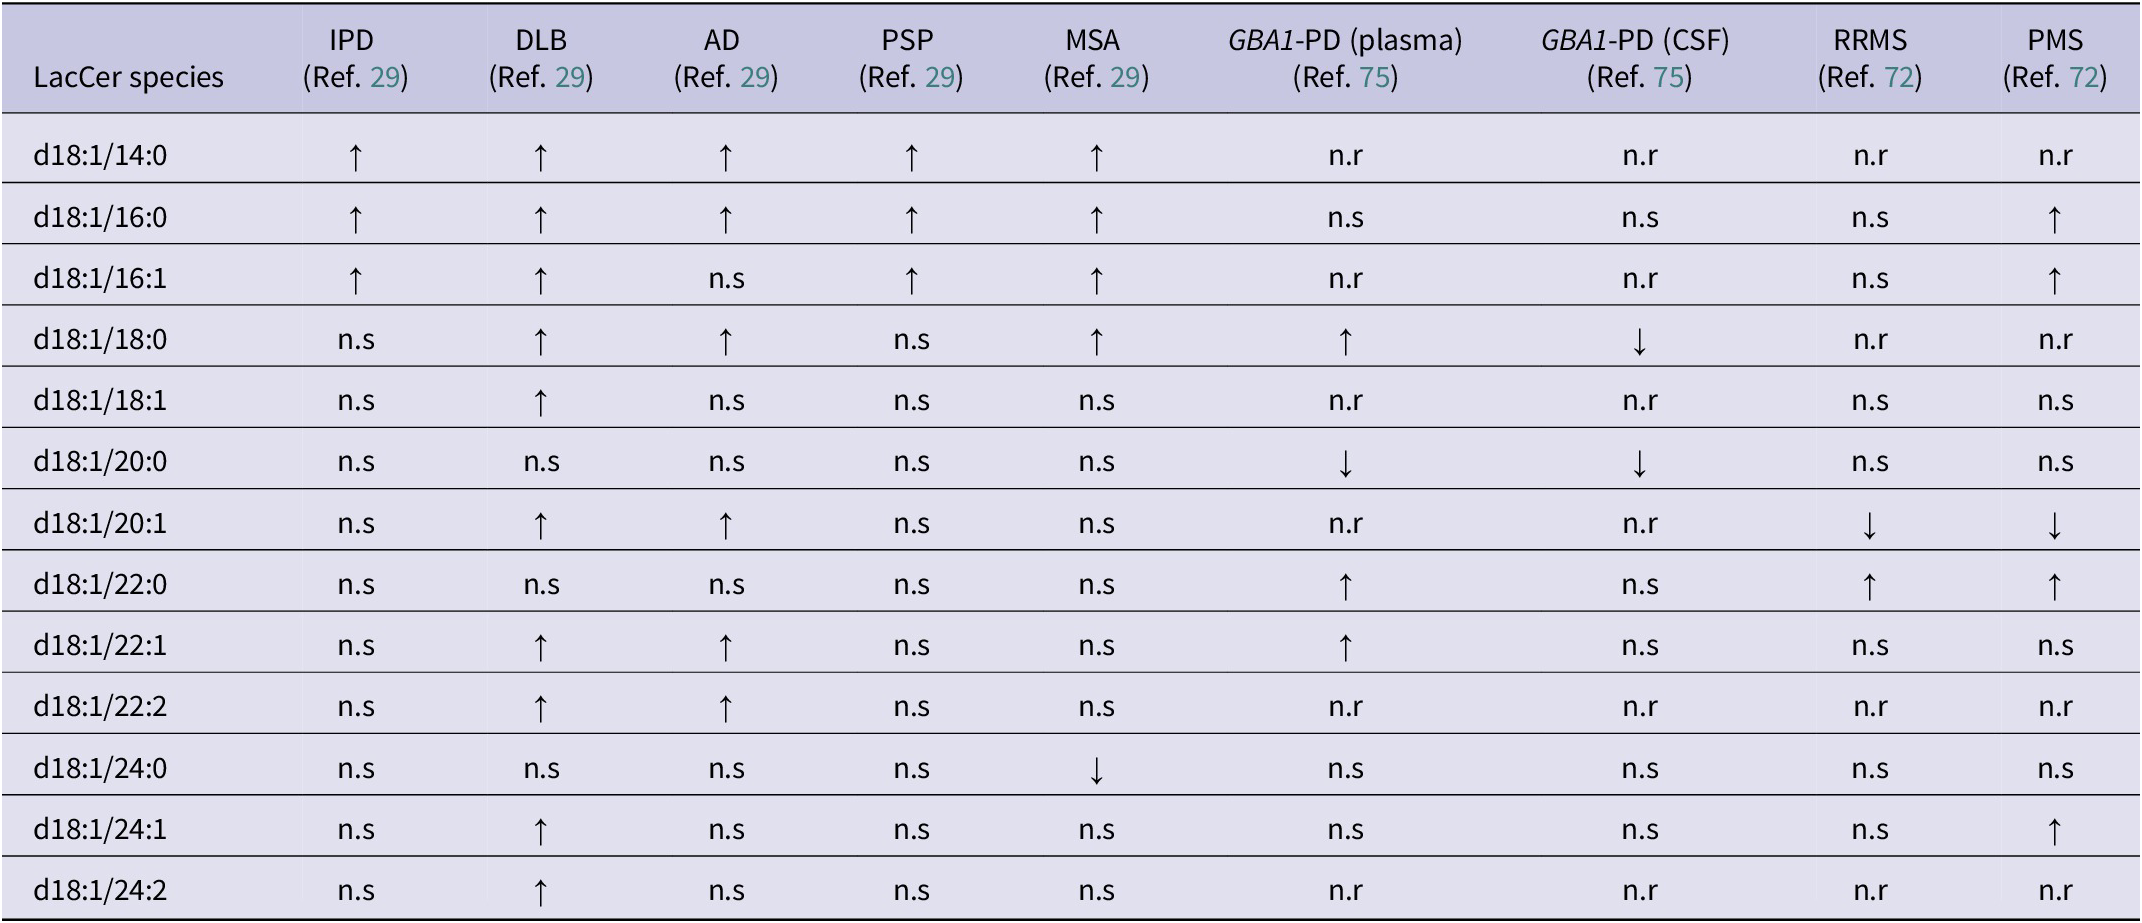
Neurodegenerative disorders are classified by their dominant pathogenic protein aggregates; however, many conditions exhibit overlapping or comorbid pathologies (Refs Reference Oizumi, Sugimura, Totsune, Kawasaki, Ohshiro, Baba, Kimpara, Sakuma, Hasegawa, Kawahata, Fukunaga and Takeda29, Reference Skrahin, Horowitz, Istaiti, Skrahina, Lukas, Yahalom, Cohen, Revel-Vilk, Goker-Alpan, Becker-Cohen, Hassin-Baer, Svenningsson, Rolfs and Zimran104–Reference Jackson, Melloni, Fykstra, Serrano-Pozo, Shinobu and Hyman107). α-Synucleinopathies, including idiopathic Parkinson’s disease (IPD), dementia with Lewy bodies (DLB), multiple system atrophy (MSA) and GBA1-associated Parkinson’s disease (GBA1-PD), are defined by α-synuclein accumulation, yet may coexist with additional aggregates such as tau or amyloid-β, particularly in DLB and advanced disease stages (Refs Reference Oizumi, Sugimura, Totsune, Kawasaki, Ohshiro, Baba, Kimpara, Sakuma, Hasegawa, Kawahata, Fukunaga and Takeda29, Reference Arai, Bhunia, Chatterjee and Bulkley81, Reference Fedorova, Knudsen, Horsager, Hansen, Okkels, Gottrup, Vang and Borghammer101–Reference Skrahin, Horowitz, Istaiti, Skrahina, Lukas, Yahalom, Cohen, Revel-Vilk, Goker-Alpan, Becker-Cohen, Hassin-Baer, Svenningsson, Rolfs and Zimran104). AD is characterised by amyloid-β plaques and tau neurofibrillary tangles, while progressive supranuclear palsy (PSP) is a primary tauopathy (Ref. Reference Oizumi, Sugimura, Totsune, Kawasaki, Ohshiro, Baba, Kimpara, Sakuma, Hasegawa, Kawahata, Fukunaga and Takeda29). In contrast, multiple sclerosis is a chronic immune-mediated disorder defined by multifocal CNS inflammation, demyelination and gliosis rather than protein aggregation (Ref. Reference Boutitah-Benyaich, Eixarch, Villacieros-Álvarez, Hervera, Cobo-Calvo, Montalban and Espejo108). Distinct LacCer profiles appear to align with the primary protein aggregates across neurodegenerative disorders. Disorders dominated by α-synuclein pathology (IPD, DLB, GBA1-PD and MSA) showed increases in LacCer (d18:1/14:0), (d18:1/16:0) and (d18:1/16:1) (Table 3) (Ref. Reference Oizumi, Sugimura, Totsune, Kawasaki, Ohshiro, Baba, Kimpara, Sakuma, Hasegawa, Kawahata, Fukunaga and Takeda29). DLB further includes the unsaturated species (d18:1/20:1), (d18:1/22:1), (d18:1/22:2), (d18:1/24:1) and (d18:1/24:2) (Table 3) (Ref. Reference Oizumi, Sugimura, Totsune, Kawasaki, Ohshiro, Baba, Kimpara, Sakuma, Hasegawa, Kawahata, Fukunaga and Takeda29). AD results also include increases of LacCer(d18:1/14:0) and (d18:1/16:0) but additionally includes unsaturated species LacCer (d18:1/20:1), (d18:1/22:1) and (d18:1/22:2), suggesting further remodelling linked to mixed pathology (Table 3) (Ref. Reference Oizumi, Sugimura, Totsune, Kawasaki, Ohshiro, Baba, Kimpara, Sakuma, Hasegawa, Kawahata, Fukunaga and Takeda29). However, PSP contrasted with the broader changes observed in AD (Table 3) (Ref. Reference Oizumi, Sugimura, Totsune, Kawasaki, Ohshiro, Baba, Kimpara, Sakuma, Hasegawa, Kawahata, Fukunaga and Takeda29). Immune-mediated disorders show a distinct signature with RRMS characterised by increases in LacCer (d18:1/22:0) and reductions in (d18:1/20:1) (Table 3) (Ref. Reference Filippatou, Moniruzzaman, Sotirchos, Fitzgerald, Kalaitzidis, Lambe, Vasileiou, Saidha, Prince, Haughey, Calabresi and Bhargava72). LacCer (d18:1/16:0), (d18:1/16:1), (d18:1/22:0) and (d18:1/24:1) are increased in PMS, alongside the same reduction in LacCer (d18:1/20:1) (Table 3) (Ref. Reference Filippatou, Moniruzzaman, Sotirchos, Fitzgerald, Kalaitzidis, Lambe, Vasileiou, Saidha, Prince, Haughey, Calabresi and Bhargava72). Overall, these results suggest that LacCer (d18:1/14:0) and (d18:1/16:0) are common across the proteinopathies (Table 3). In contrast, distinct unsaturated and very-long LacCer species help distinguish AD and DLB from α-synuclein disorders, and immune-driven processes define a unique LacCer profile. However, the in-depth interpretation remains limited by data availability, underscoring the need for additional studies to clarify the mechanistic links between LacCer metabolism and neurodegenerative pathology.
Summary of altered lactosylceramide (LacCer) species between neurodegenerative disorders

Table 3. Long description
Beginning at the top row, the LacCer species d18:1/14:0 shows increased levels in I P D, D L B, A D, P S P, and M S A, with not reported for G B A 1-P D plasma, G B A 1-P D C S F, R R M S, and P M S. The next row, d18:1/16:0, is increased in I P D, D L B, A D, P S P, and M S A, not significant in G B A 1-P D plasma, G B A 1-P D C S F, and R R M S, and increased in P M S. For d18:1/16:1, increased in I P D, D L B, P S P, and M S A, not reported in G B A 1-P D plasma and C S F, not significant in A D and R R M S, and increased in P M S. The d18:1/18:0 species is not significant in I P D and P S P, increased in D L B, A D, M S A, and G B A 1-P D plasma, decreased in G B A 1-P D C S F, not reported in R R M S and P M S. For d18:1/18:1, not significant in I P D, A D, P S P, M S A, G B A 1-P D plasma and C S F, D L B is increased, R R M S and P M S are not significant. The d18:1/20:0 row is not significant in I P D, D L B, A D, P S P, M S A, R R M S, and P M S, decreased in G B A 1-P D plasma and C S F. For d18:1/20:1, not significant in I P D, P S P, M S A, G B A 1-P D plasma and C S F, increased in D L B and A D, decreased in R R M S and P M S. The d18:1/22:0 species is not significant in I P D, D L B, A D, P S P, M S A, G B A 1-P D C S F, R R M S, increased in G B A 1-P D plasma, P M S. For d18:1/22:1, not significant in I P D, P S P, M S A, G B A 1-P D C S F, R R M S, increased in D L B, A D, G B A 1-P D plasma, P M S. The d18:1/22:2 row is not significant in I P D, P S P, M S A, G B A 1-P D plasma and C S F, increased in D L B and A D, not reported in R R M S and P M S. For d18:1/24:0, not significant in I P D, D L B, A D, P S P, G B A 1-P D plasma and C S F, R R M S, P M S, decreased in M S A. The d18:1/24:1 row is not significant in I P D, A D, P S P, M S A, G B A 1-P D plasma and C S F, R R M S, increased in D L B and P M S. For d18:1/24:2, not significant in I P D, A D, P S P, M S A, G B A 1-P D plasma and C S F, R R M S, P M S, increased in D L B. The table footnotes clarify that upward arrows indicate increased versus controls, downward arrows indicate decreased versus controls, n.r means not reported, n.s means no significance reported, and all disorder abbreviations are defined.
Note: ↑: increased vs controls; ↓: decreased vs controls; AD: Alzheimer’s disease; CSF: cerebrospinal fluid; DLB: dementia with Lewy bodies; GBA-PD: GBA1-associated Parkinson’s disease; IPD: idiopathic Parkinson’s disease; LacCer: lactosylceramide; MSA: multiple system atrophy; n.r: not reported; n.s: no significance reported; PMS: progressive multiple sclerosis; PSP: progressive supranuclear palsy; RRMS: relapsing–remitting multiple sclerosis.
Renal system
LacCers function as a mediator of renal signalling and disease progression. Under physiological conditions, LacCer synthesis is restrained by a low-density lipoprotein receptor (LDLR)-dependent pathway, in which native LDL exerts a dose-dependent inhibition (Refs Reference Chatterjee, Balram and Li1, Reference Chatterjee, Clarke and Kwiterovich16, Reference Florens, Calzada, Lyasko, Juillard and Soulage109). This regulatory mechanism is disrupted under conditions of oxidative stress, where methylation of lysine residues impairs LDLR recognition and weakens feedback control of LacCer synthesis (Ref. Reference Florens, Calzada, Lyasko, Juillard and Soulage109). Consistent with impaired LDLR-mediated regulation in human disease, multiple LacCer species, including LacCer(d18:1/16:0), (d18:1/18:0), (d18:1/20:0), (d18:1/22:0), (d18:1/24:0) and (d18:1/24:1), are increased within the LDL fraction in individuals with CKD compared with controls (Supplementary Table S5), indicating altered LacCer trafficking within circulating lipoproteins (Ref. Reference Lopes-Virella, Hammad, Baker, Klein and Hunt51). As a result, LDL uptake is redirected towards scavenger receptor pathways, leading to increased LacCers being generated and subsequent activation of ERK1/2 (p44 MAPK) signalling (Refs Reference Chatterjee, Balram and Li1, Reference Chatterjee, Clarke and Kwiterovich16, Reference Chatterjee, Shi, Wilson and Mazumdar78, Reference Balram, Thapa and Chatterjee110). Experimental models indicate that NEU1 activity rises prior to LacCer accumulation, implicating GSL remodelling as an early trigger in renal inflammation (Ref. Reference Nowling, Mather, Thiyagarajan, Hernández-Corbacho, Powers, Jones, Snider, Oates, Drake and Siskind77). Consistent with this disease-associated shift, basal p44 MAPK activity has been reported to be elevated in proximal tubular cells from those with autosomal dominant polycystic kidney disease (ADPKD), compared to controls (Ref. Reference Chatterjee, Shi, Wilson and Mazumdar78). This was built upon previous research by Chatterjee et al. (Ref. Reference Wilson, Du and Norman111), who observed increased epidermal growth factor (EGF) activity and LacCer synthesis, supporting the dysregulation of LacCer-linked signalling pathways in renal disease.
Renal disease is associated with alterations in LacCer profiles across plasma, serum, urine and kidney tissue, indicating that LacCer remodelling accompanies kidney injury irrespective of the initiating condition. Lopes-Virella et al. (Ref. Reference Lopes-Virella, Baker, Hunt, Hammad, Arthur, Virella and Klein112) reported that LacCer profiles differ by kidney disease stage, with microalbuminuria (MA) and CKD showing distinct patterns in plasma (Supplementary Table S5). In MA, circulating short-chain species LacCer(d18:1/14:0), (d18:1/16:0) and (d18:1/18:0) were reduced, while LacCer(d18:1/22:1) was increased (Supplementary Table S5) (Ref. Reference Lopes-Virella, Baker, Hunt, Hammad, Arthur, Virella and Klein112). With progression to CKD, depletion of the short-chain species persisted, and additional very-long-chain species such as LacCer(d18:1/24:0) and (d18:1/26:1) (Supplementary Table S5) also decreased, reflecting a stage-dependent remodelling of LacCers rather than uniform loss (Ref. Reference Lopes-Virella, Baker, Hunt, Hammad, Arthur, Virella and Klein112). The progressive rise in LacCer (d18:1/22:1) from control to MA, CKD and combined MA + CKD suggests that it tracks renal injury and may serve as a marker of disease progression (Ref. Reference Lopes-Virella, Baker, Hunt, Hammad, Arthur, Virella and Klein112). Similar LacCer alterations were observed in paediatric CKD, with serum LacCer(d18:1/16:0) and (d18:1/24:0) elevated relative to controls (Supplementary Table S5). However, the opposing direction of these species compared with the aforementioned adult CKD cohort may reflect potential age or matrix differences in LacCer metabolism (Ref. Reference Mitsnefes, Scherer, Friedman, Gordillo, Furth and Warady76). Urinary LacCer(d18:1/16:0) was elevated in SLE nephritis patients (Supplementary Table S5), whereas plasma levels remained unchanged, indicating that urine may be a more sensitive matrix for detecting renal LacCer perturbations (Ref. Reference Nowling, Mather, Thiyagarajan, Hernández-Corbacho, Powers, Jones, Snider, Oates, Drake and Siskind77). In lupus nephritis, Wolf et al. (Ref. Reference Wolf, Blaschke, Mungaray, Weselman, Stefanenko, Fedoriuk, Bai, Rodgers, Palygin, Drake and Nowling26) expanded upon these findings by demonstrating broader increases in LacCer species across both serum and urine, including LacCer(d18:1/16:0), (d18:1/22:0) and (d18:1/24:0) (Supplementary Table S5). Furthermore, urinary LacCer(d18:1/16:0), (d18:1/24:0) and (d18:1/24:1) concentrations were approximately twice as high in males as in females, indicating sex-specific differences (Ref. Reference Wolf, Blaschke, Mungaray, Weselman, Stefanenko, Fedoriuk, Bai, Rodgers, Palygin, Drake and Nowling26). Tissue-level LacCer variations are contrasting from these systemic patterns observed in biofluids. Chatterjee et al. (Ref. Reference Chatterjee, Shi, Wilson and Mazumdar78) examined tissue from polycystic kidney disease (PKD) and reported an increase in LacCer(d18:1/16:0), (d18:1/18:0) and (d18:1/18:1), alongside decreased LacCer(d18:1/24:0) and (d18:1/24:1), and complete absence (d18:1/19:0) and (d18:1/20:0) (Supplementary Table S5), when compared to control samples. These findings indicate either a disease – or matrix-specific reorganisation of LacCer acyl-chain composition within the kidney itself (Ref. Reference Chatterjee, Shi, Wilson and Mazumdar78).
Cancer and LacCer dysregulation across tissues
Cancer-associated LacCer dysregulation is likely driven by perturbed GSL metabolism and enzymatic remodelling of upstream gangliosides. Experimental studies in colon and renal carcinoma models indicate that increased sialidase NEU3 activity promotes the hydrolysis of gangliosides, including GM3 and GD3, leading to LacCer enrichment (Refs Reference Kakugawa, Wada, Yamaguchi, Yamanami, Ouchi, Sato and Miyagi113, Reference Ueno, Saito, Wada, Yamaguchi, Satoh, Arai and Miyagi114). Additionally, this shift in NEU3 balance has been associated with reduced apoptotic signalling and enhanced motility-related pathways (Ref. Reference Ueno, Saito, Wada, Yamaguchi, Satoh, Arai and Miyagi114). Collectively supporting a functional role for NEU3-linked LacCer remodelling in tumour progression.
Emerging evidence indicates that LacCer profiles are altered across diverse cancer types, reflecting tumour type, stage and progression. In primary colorectal cancer (CC), Procházková et al. (Ref. Reference Procházková, Slavík, Bouchal, Levková, Hušková, Ehrmann, Ovesná, Kolář, Skalický, Straková, Zapletal, Kozubík, Hofmanová, Vondráček and Machala65) demonstrated increased LacCer(d18:1/16:0), (d18:1/18:0), (d18:1/22:0), (d18:1/24:0) and (d18:1/24:1) in colon tumour tissue compared with controls (Supplementary Table S6). Complementing these findings, Telleria et al. (Ref. Reference Telleria, Alboniga, Clos-Garcia, Nafría-Jimenez, Cubiella, Bujanda and Falcón-Pérez66) reported that faecal LacCer(d18:1/16:0) discriminates CC from advanced adenoma (Supplementary Table S6), which is suggestive of both local and systemic changes in LacCer metabolism. In hepatic malignancies, cholangiocarcinoma (CCA) tissue shows elevated LacCer(d18:1/16:0) and LacCer (d18:1/h16:0 and d18:1/h24:0, where h denotes a hydroxylated fatty acyl chain), while plasma LacCer(40:3), likely representing (d18:1/22:2), is increased in hepatocellular carcinoma (HCC) (Supplementary Table S6) (Refs Reference Silsirivanit, Phoomak, Teeravirote, Wattanavises, Seubwai, Saengboonmee, Zhan, Inokuchi, Suzuki and Wongkham68, Reference Yang, Bai, Han, Shi and Liu69). In the central nervous system, serum LacCer(d18:1/12:0) is elevated in anaplastic astrocytoma (Supplementary Table S6), whereas in prostate cancer, urinary exosomal LacCer(d18:1/16:0) is increased (Supplementary Table S6) (Refs Reference Du, Huang, Wei and Li67, Reference Skotland, Ekroos, Kauhanen, Simolin, Seierstad, Berge, Sandvig and Llorente70). In haematological malignancies, total LacCer is reduced in bone marrow and plasma from multiple myeloma (MM) compared with asymptomatic monoclonal gammopathy of undetermined significance (MGUS) (Supplementary Table S6) (Ref. Reference Gonsalves, Broniowska, Jessen, Petterson, Bush, Gransee, Lacy, Hitosugi and Kumar71). In melanoma metastases, total LacCer is also decreased; however, higher circulating LacCer(d18:1/16:0) was inversely associated with mortality (Supplementary Table S6), indicating species-specific associations with disease progression and outcome (Ref. Reference Szász, Koroknai, Várvölgyi, Pál, Szűcs, Pikó, Emri, Janka, Szabó, Ádány and Balázs31).
Integrated LacCer species patterns across disease contexts
Integration of species-level data throughout this review (Tables 1–3; Supplementary S5–S6) reveals that the broader LacCer profile is characterised by significant heterogeneity or is insufficiently reported across the literature. However, LacCer(d18:1/16:0), (d18:1/24:0) and (d18:1/24:1) demonstrate cross-system trends linking disparate pathologies through convergent inflammatory and metabolic pathways. LacCer(d18:1/16:0) represents the most frequently reported species, and the direction of change appears to be dependent on biological matrix, tissue compartment and disease stage. It is frequently reduced in the circulation in patients with chronic metabolic and renal disorders, likely because it is the immediate precursor of GM3(d18:1/16:0), an inhibitor of TLR4 activation. Consequently, depleted LacCer(d18:1/16:0) may drive persistent low-grade inflammation.
In contrast, very-long-chain LacCer species display marked compartmentalisation across disease contexts. LacCer(d18:1/24:0) and (d18:1/24:1) are reduced in circulation in patients with metabolic syndrome, SLE-associated atherosclerosis and CKD. However, they are enriched within localised diseased matrices, such as liver biopsies from NASH patients, atherosclerotic plaques and the urine of individuals with lupus nephritis (Table 2, S Supplementary Tables S3 and S5). This accumulation in local microenvironments suggests these species may contribute to local pathological processes. As established in the immune context (Section ‘LacCers across immune and inflammatory system’), the longer acyl chains of LacCer(d18:1/24:0) and (d18:1/24:1) are structural requirements for stabilising signalling rafts that activate NADPH oxidase. Their localised accumulation in diseased tissues, rather than in the circulation, likely facilitates the persistent production of ROS and subsequent tissue remodelling.
Limitations
A limitation of this review was the inability to draw definitive conclusions for individual LacCer species due to differing analytical approaches utilised across the literature, including LC–MS/MS methodologies, extraction protocols, species coverage, quantification and reporting methods. Additionally, the use of diverse sample matrices (plasma, serum, urine, tissue and cells) introduces further heterogeneity. Such variability complicates cross-study comparisons, as differences in matrix composition and analytical conditions can influence detection sensitivity and relative abundance measurements. Consequently, whilst we have observed recurring patterns, we have avoided direct species-specific comparisons.
Conclusion and future directions
This review demonstrates that LacCer is a central intermediate in many common inflammatory and immune-mediated pathways, serving as a link between multiple biological systems. Most studies examined LacCer in the context of specific diseases using untargeted lipidomics or GSL profiling. These approaches have been valuable for discovery, especially since lipidomics has traditionally been a hypothesis-driven field. However, the evidence here suggests a shift of integrating lipidomics into a systems biology framework will enable moving beyond biomarker identification towards clarifying mechanisms. Therefore, future research should adopt integrated multi-omics strategies to link LacCer biology with upstream precursors, downstream products (e.g., GSLs) and associated signalling pathways. Combining lipidomics with transcriptomics and proteomics will enable mechanistic insight beyond association studies and accelerate the identification of therapeutic targets for metabolic, immune and inflammatory disorders.
Supplementary material
To view supplementary material for this article, please visit http://doi.org/10.1017/erm.2026.10054.
Acknowledgements
Figures were created with BioRender (https://biorender.com/).
Funding statement
LW is supported by a Dementia Australia and Royce Simmons Foundation Mid-Career research fellowship.
Competing interests
The authors declare none.


 Open access

