





Introduction
Which groups within the polity should be enfranchised? This question has recently gained new traction. In several European countries and U.S. states, youth between 16 and 18 years of age, as well as migrants with permanent residence, have won the right to vote in local, regional, and sometimes national elections (Eichhorn and Bergh Reference Eichhorn and Bergh2021; Ferris et al. Reference Ferris, Hayduk, Richards, Schubert and Acri2020). Yet, underage citizens and non-naturalized migrants remain excluded from national suffrage in most polities around the world. While the share of youth and children among European electorates is shrinking due to demographic aging, the share of migrants is rising due to increasing mobility and globalization (Goerres and Vanhuysse Reference Goerres and Vanhuysse2021). These developments potentially enhance the salience of new political cleavages (Ford and Jennings Reference Ford and Jennings2020; Kroeber Reference Kroeber2018). For example, it is often cited that almost a third of the residents of Austria’s capital, Vienna, cannot vote because they lack Austrian citizenship.Footnote 1 Meanwhile, the problem of how to represent the interests of young and future generations has also become salient, due to long-term political challenges such as housing and climate change (Buchmeier and Vogt Reference Buchmeier and Vogt2024; González-Ricoy and Gosseries Reference González-Ricoy and Gosseries2016; Vlandas, McArthur and Ganslmeier Reference Vlandas, McArthur and Ganslmeier2021).
Discussions about enfranchisement are linked to a more general debate about the extent to which voting rights are necessary to ensure the substantive representation of people’s interests (Erzeel and Rashkova Reference Erzeel and Rashkova2023). The right to vote provides citizens with direct influence over two central mechanisms of political representation: authorization and accountability. Voting is the primary tool for interest holders to select politicians who they feel will look after their interests (authorization) and to reward or punish those politicians by (not) supporting them again in future elections (accountability). Political theorists have thus increasingly debated the question of appropriate democratic inclusion, i.e., who should be formally enfranchised in any given polity. Three solutions have been prominent: extending the franchise to ‘all subjected to coercion’, or to ‘all affected by decisions’, or simply keeping the status quo (Bauböck Reference Bauböck2005; Beckman Reference Beckman2006; Owen Reference Owen2011).
An important argument for the last perspective is that unenfranchised groups’ interests are already taken into account by enfranchised citizens and elected politicians (Scalia Reference Scalia1998). This sort of indirect representation has variously been called ‘surrogate representation’ (Mansbridge Reference Mansbridge2003), ‘fiduciary representation’ (Leib and Ponet Reference Leib and Ponet2012), ‘virtual representation’ (Fishkin Reference Fishkin2017), or – our preferred term – ‘proxy representation’ (Herenstein and Rudensky Reference Herenstein and Rudensky2021). While politicians have a clear incentive to represent the interests of their voters (to get support renewed) as well as of voters who supported other parties or candidates (to win their vote in the next election), politicians acting as proxy representatives would also look out for the interests of the unenfranchised. Voters, too, might act as proxies, voting not simply based on self-interest but also on behalf of, for example, their children.
However, we so far know little about how well unenfranchised groups’ preferences are represented politically and whether voters and politicians are in fact willing to proxy-represent these groups’ interests. The answer to this question is dialectically linked to questions about the necessity of enfranchisement. Simply put, if unenfranchised people’s interests are not significantly different from those of the majority of voters, or if they are actively taken into account by voters and/or politicians during the representative process, there is no substantive need for suffrage extensions. In contrast, if this is not the case, voting rights might indeed be necessary (though not automatically sufficient) to ensure equal political representation of affected/subjected groups.
Previous empirical research assessing the political representation of voters versus non-voters tends to focus on voluntary non-voters, i.e., those who decide not to use their right to vote. These studies suggest voters and the politically active are better represented in terms of ideological congruence and policy responsiveness (Dassonneville et al. Reference Dassonneville, Feitosa, Hooghe and Oser2021; Griffin and Newman Reference Griffin and Newman2005; Lindqvist et al., Reference Lindqvist, Oser, Dassonneville, Persson and Sundell2026). Arguably, this could be a mechanical effect of parties and politicians supported by a majority and catering to the interests of that majority. On the other hand, it could also be that parties and politicians consciously or unconsciously prioritize the needs and interests of (their) voters over those of non-voters (Ibenskas and Polk Reference Ibenskas and Polk2022). Furthermore, a number of studies point to links between the descriptive and substantive representation of groups: Legislative bodies that are more demographically reflective of the population also tend to better represent their diverse interests and priorities (Wängnerud Reference Wängnerud2009). The fact that both young people and citizens with migrant backgrounds are highly underrepresented in most parliaments worldwide (Sundström and Stockemer Reference Sundström and Stockemer2021) should thus amplify concern about the adequate representation of these groups’ preferences.
In this article, we draw on parallel surveys conducted with citizens and national politicians in fourteen liberal democracies. We address one overarching research question: Are underage youths’ and migrants’ political interests taken into account via proxy representation? Theoretically, we suggest proxy representation can be the result of two distinct, though not mutually exclusive, mechanisms: mechanical and solidarity representation. The first occurs if the respective groups’ preferences do not significantly differ from those of the general electorate and/or elected politicians and would thus automatically have the chance to be proxy represented. The second mechanism implies that voters and/or politicians consider youths and migrants as deserving representation equal to that of enfranchised people and would then strive to represent their interests equally.
In our empirical analysis, we find mixed support for the mechanical route to proxy representation. While both underage youth and migrant non-voters’Footnote 2 preferences on several policy issues are similar to those of the general electorate and/or politicians, there are several issues where their preferences remain mechanically unmatched by both potential proxy representatives. Importantly, these are issues where the respective groups tend to be affected differently than the general electorate, e.g., regarding educational policy, corona measures, and climate/mobility policies. While underage youths’ preferences are at least matched by those of young voters (aged 18 to 25 years) and thus have a remote chance to be heard in the representative process, this is not the case for migrant non-voters whose preferences also substantially differ from those of migrant voters. We then test to what extent voters and politicians feel unenfranchised groups deserve political representation equal to that of adult national citizens – our operationalization of the solidarity route to proxy representation. We find this is only the case for youth, children, and future generations. In contrast, politicians as well as citizens are unwilling to grant equal representation to migrants.
This article takes a novel perspective on political representation and voting by empirically and comparatively assessing the extent to which the normative ideal of inclusion is fulfilled for underage youth and migrant non-voters. Our empirical findings contribute to the emerging research agenda in political demography and are relevant for policy discussions about enfranchisement reforms. They suggest that suffrage might indeed be necessary for excluded groups to have their preferences represented, and that representation by proxy might fail exactly in areas where unenfranchised groups’ interests are substantially different from that of the majority.
Normative political theory: the boundary problem
Meaning literally ‘rule by the people’, democracy is distinguished from other forms of government by its broad inclusivity. Yet democracy nonetheless excludes. Functionally, though democracy amplifies some voices, it has been said to mute others, such as those of women (MacKinnon Reference MacKinnon1991), the poor (Gutmann Reference Gutmann1980), ‘permanent minorities’ (Guinier Reference Guinier1995), and the politically inactive. Legally, meanwhile, democracy is even more exclusive. Beyond any given polity are outsiders, all legally unenfranchised. And even within the polity, full participation – most notably voting – is denied to a substantial proportion deemed not (yet) qualified: e.g., underage youths and non-naturalized migrants (López-Guerra Reference López-Guerra2014: 1).
The problem of who to exclude, and how to decide, is the ‘democratic boundary problem’. The problem has in recent decades prompted considerable discussion (e.g., Abizadeh Reference Abizadeh2012; Arrhenius Reference Arrhenius2005; Bauböck Reference Bauböck2017; Cabrera Reference Cabrera2014; Goodin Reference Goodin2007; Miller Reference Miller2020; Owen Reference Owen2012; Song Reference Song2012; Whelan Reference Whelan1983). Scholars have approached the problem descriptively as well as prescriptively, exploring how demoi are delimited in practice, how they should be in principle, and how each informs the other. Their work comprises a number of distinct conversations, two being most relevant to this article.
The first and most prominent boundary-problem conversation focuses on the interests of state demoi vis-a-vis migrants. This conversation largely concerns spatial boundaries, as it grapples with the responsibility of democracies not just toward resident (im)migrants but also (em)migrants abroad – and vice-versa. Proposed solutions have generally fallen into three categories, with scholars (1) defending the (stable, predictable, and identity-shaping) boundaries of present states, or championing (2) expanding demoi to include all those affected by democratic decisions, or (3) expanding demoi to include all those subject to state coercion. Other scholars have explored even more nuanced solutions. Should states recognize multiple, nested boundaries, thus distinguishing gradations of democratic rights holders (Bauböck Reference Bauböck2018)? Should demoi dynamically adjust to include all those with stakes in the particular policy choice at hand (Bohman Reference Bohman2007)? Should they adjust to account not just for who is affected but how much, weighting each voter’s vote in line with their disparate stakes (Brighouse and Fleurbaey Reference Brighouse and Fleurbaey2008)?
These discussions link to the growing body of literature on transnational representation. Here, scholars theoretically and empirically move away from an exclusive focus on the nation-state as the central arena for representation, examining the multiple ways of participation and representation that are offered by transnational organizations and networks. For instance, studies point to politicians in national parliaments making claims on behalf of citizens belonging to other member states (Kinski and Crum Reference Kinski and Crum2019) – i.e., people that they do not have an electoral relationship to. Other studies examine the various ways non-resident citizens living abroad can and do affect politics in their home country (Soare and Gherghina Reference Soare and Gherghina2024) – again, in some cases without possessing formal voting rights.
The second boundary-problem conversation relevant to this article grapples not with the spatial but rather temporal boundaries of democracy. Should the demos comprise only present people? Or is democracy a ‘trans-generational project’, encompassing our ancestors and descendants? Looking backward, must we honor the decisions of voters now dead? Looking forward, what obligations do we have toward future people, who stand to be impacted by decisions made today? Bengtson and Albertsen (Reference Bengtson and Albertsen2023) argue that according to both the all-affected and all-subjected principles, disenfranchising senior citizens – or at least underweighting their votes – is legitimate. This suggestion garnered popular attention following the Brexit vote, in which ‘leave’ supporters skewed significantly older than the British mean.Footnote 3 Angell (Reference Angell2025) makes a similar argument, citing the principle of democratic inclusion as reason to overweight the voting power of young people.
The above boundary problem scholarship is, however, based on a particular premise: that equal participation is a necessary condition for democracy to achieve the ideal of equal substantive representation. But there is a secondary, indirect mechanism by which this ideal might be achieved. Enfranchised citizens and elected politicians could act not only in their own, or their voters’, interests, but also in the interest of unenfranchised groups – as in the above example of EU-politicians engaging in transnational representation of citizens not belonging to their ‘own’ nation-state. Such representation has been variously named. It has been named ‘fiduciary representation’ especially when it involves representing legal dependents, such as children or the incapacitated (Leib and Ponet Reference Leib and Ponet2012). It has been called ‘surrogate representation’ particularly when it involves representing groups, such as co-ethnics, outside the representative’s own district (Mansbridge Reference Mansbridge2003). It has been called ‘virtual representation’ when discussing the historic, and now discredited, view that women, the poor, or minorities are adequately represented by landowning white males (Fishkin Reference Fishkin2017). Finally, our preferred term, ‘proxy representation’, has recently been employed to encompass all of the above (and additional) forms of indirect representation (Herenstein and Rudensky Reference Herenstein and Rudensky2021). Notwithstanding the above discussions, proxy representation has been ‘a seriously neglected topic in modern constitutional thought’ (Fishkin Reference Fishkin2017: 1690). It has been especially neglected by empiricists. We thus do not know if proxy representation occurs and whether it is sufficient to look after the interests of the presently unenfranchised.
The question of whether unenfranchised interest holders can enjoy equal substantive representation is increasingly salient. This is due to two recent developments. The first is increased mobility. Today, in certain democratic states, as much as a quarter of all residents are non-naturalized migrants. From a democratic-inclusion standpoint, the vast majority of scholars argue in favor of noncitizen enfranchisement (Ferris et al. Reference Ferris, Hayduk, Richards, Schubert and Acri2020). The second development is the global climate crisis – a political challenge made vexing by its severity as well as its very long time-horizon, whereby decisions made today will have their greatest impact decades or even centuries from now. Although, as noted, some argue in favor of age-weighted voting, this remains controversial. These two developments highlight two sorts of boundary problems – first, whether to ‘bound in’ migrants, and second, whether to bound in underage and future citizens. At least in the case of future peoples and very young persons, formal enfranchisement seems impossible, thus leaving proxy representation as the only option. At the same time, we know little about the degree to which citizens and politicians are willing to provide proxy representation to non-voters.
Preferences, voting, and representation
Arguably, we would not need to worry about unequal representation of unenfranchised groups if we could assume that their preferences do not significantly differ from those of enfranchised people (Esaiasson and Wlezien Reference Esaiasson and Wlezien2017). Proxy representation would then (potentially) occur automatically, via the electoral aggregation of preferences, as politicians who respond to voter preferences would mechanically also represent unenfranchised groups’ interests. Importantly, while voting rights are by no means a guarantee to get one’s preferences politically represented, they mean at least that voters can hold unresponsive parties or politicians accountable. So, is there reason to expect that young generations and migrants have different political preferences than the general voting population?
There are a number of studies that have investigated how preferences vary by respondents’ age. It has been shown that the young tend to prioritize spending on education and childcare over health care and pensions (Kweon and Choi Reference Kweon and Choi2022; Sorensen Reference Sørensen2013), especially when trade-offs exist between these areas (Bonoli and Reber Reference Bonoli and Reber2010; Cattaneo and Wolter Reference Cattaneo and Wolter2009). Further, older generations are less likely than younger ones to prioritize environmental concerns over economic concerns (Lorenzini, Monsch and Rosset Reference Lorenzini, Monsch and Rosset2021). When asked directly, young people are generally more willing than older citizens to support policies that benefit future generations (Busemeyer Reference Busemeyer2024).
As summarized by Breidahl et al. (Reference Breidahl, Hedegaard, Kongshøj and Larsen2021: 2–15), there are also reasons to believe migrants hold different political preferences in various domains compared to non-migrants. This can be due to various factors, including their distinct socio-economic positions, which, for example, can influence their support for social-welfare policies. Experiences of discrimination and levels of integration into the host society also play a significant role, with those facing discrimination potentially being more concerned about minority rights. Additionally, the political socialization migrants experienced in their countries of origin can shape their political preferences. In other words, migrants’ political preferences are shaped by at least two contexts of political socialization. Migrants also maintain transnational social ties and are more mobile, which can be reflected in their identity and sense of belonging, subsequently affecting their political preferences toward the host country.
Importantly, we ought not forget that underage youth and migrants are comparatively small and specific segments of the general population. It is thus a priori more likely that they have ‘crystallized interests’ (Mansbridge Reference Mansbridge1999) in some policy areas that concern them to a larger degree than the rest of the population. For instance, regarding youth policy, immigration policy, and social affairs, we expect the respective groups to hold preferences that significantly differ from those of the general electorate. This leads to our first hypothesis.
H1: Underage youth and migrants hold preferences that systematically differ from those of voters.
A second way of mechanically representing unenfranchised groups’ interests is provided via the political system’s pluralistic structure. Political representation and policy congruence are the basic principles for how representative democracy works (Rosema, Aarts and Denters Reference Rosema, Aarts and Denters2011). Pitkin (Reference Pitkin1967: 209) defines representation as ‘acting in the interest of the represented, in a manner responsive to them’. Powell (Reference Powell2004) describes political representation along two large research programs: Procedural representation (beginning with (Rae Reference Rae1971) and substantive representation (beginning with (Miller and Stokes Reference Miller and Stokes1963)). The former program emphasizes citizens’ party votes in elections, which are linked to party representation in legislatures (vote-seat representation). The latter starts with the preferences of citizens, and elections are the causal connection to the preferences and behavior of elected politicians (voter-party dyads). Research on representation has mainly focused on the extent to which the citizens who elect governments are represented (Dalton, Farrell and McAllister Reference Dalton, Farrell, McAllister, Rosema, Denters and Aarts2012: 23) (emphasis is ours). Similarly, congruence scholars ‘compare the policy preferences of voters with the policy preferences of representatives’ (Andeweg Reference Andeweg, Rosema, Denters and Aarts2012: 39) (emphasis is ours).
According to the crucial function of voting in the authorization and accountability of politicians, one would arguably expect that congruence and responsiveness are higher toward groups whose support is important for parties and politicians. This is largely supported by previous empirical findings. First, Ibenskas and Polk (Reference Ibenskas and Polk2022) show that parties are indeed more congruent with their voters – the ones that authorized them to govern in the first place. More generally, those who vote are, on average, better represented than those who do not, as studies from the US (Griffin and Newman Reference Griffin and Newman2005) and Europe (Dassonneville et al. Reference Dassonneville, Feitosa, Hooghe and Oser2021; Lindqvist et al. Reference Lindqvist, Oser, Dassonneville, Persson and Sundell2026) illustrate. Second, there is also evidence that large demographic groups receive better representation of their interests: This has been shown for senior citizens in the U.S. (Curry and Haydon Reference Curry and Haydon2018), especially if they are highly mobilized as a group (Anzia Reference Anzia2019).
A third empirical indication that voting rights matter for substantive representation is provided by studies into the effects of electoral reforms. When non-voters are turned into voters, they appear to have a higher chance that their interests will receive political attention. For instance, consider evidence about the effects of compulsory voting. Mainly affecting the participation of the working class, compulsory voting in Australia has led to significantly higher vote shares for the Labour party and increased pension spending (Fowler Reference Fowler2013). Likewise, Abou-Chadi and Orlowski (Reference Abou-Chadi and Orlowski2015) demonstrate that suffrage extensions to the working class positively affected public goods provision and redistribution, and Morgan-Collins (Reference Morgan-Collins2021) shows that women’s enfranchisement led to better representation of women’s interests in districts where they were highly mobilized (and, thus, an influential group of voters). The crucial role of group turnout is also emphasized in Dingler, Kroeber and Fortin-Rittberger (Reference Dingler, Kroeber and Fortin-Rittberger2019), a study showing that gender gaps in congruence vary with gender gaps in electoral participation. Furthermore, cases where resident migrants and 16- to 17-year-olds gained suffrage had tangible policy effects that can be interpreted as providing better group representation (Bertocchi et al. Reference Bertocchi, Dimico, Lancia and Russo2020; Vernby Reference Vernby2013). In sum, we expect that:
H2: Elected representatives are more congruent with voters than with underage youth and migrant non-voters.
Even if parties and politicians must make decisions about whose preferences to prioritize, this may not be a conscious decision, but rather an effect of voters being a much larger group than the unenfranchised. Thus, even if we find that there is inequality in representation, this need not be the result of a conscious unwillingness to regard certain groups’ interests. Therefore, we suggest investigating a complementary mechanism that can lead to proxy representation: deservingness considerations motivated by solidarity with unenfranchised groups.
Previous research has shown that both voters and parties are not exclusively pursuing their own political self-interest. Voters tend to be motivated by a mix of self-interest and altruism when making their electoral decisions (Carlsson and Johansson-Stenman Reference Carlsson and Johansson-Stenman2010; Mueller, Vatter and Schmid Reference Mueller, Vatter and Schmid2016), and parties explicitly use solidarity frames to express their commitment to the common good (Thijssen and Verheyen Reference Thijssen and Verheyen2022). For instance, solidarity can be an explanation for why older people support green parties or why European citizens vote for parties that defend liberal migration policies (Pellegata and Visconti Reference Pellegata and Visconti2022). Our guiding assumption is that both (enfranchised) citizens and politicians will consider adult national citizens as most deserving of political representation. Drawing on the work of Peter Thijssen (Thijssen Reference Thijssen2016; Thijssen and Verheyen Reference Thijssen and Verheyen2022), we then expect that the degree to which they consider the unenfranchised as deserving equal representation (as adult citizens) can follow different logics of solidarity: group-based solidarity, compassionate solidarity, exchange-based-solidarity, or empathic solidarity (Thijssen Reference Thijssen2012).
Simply put, the two first logics of solidarity rely on the principle of similarity. Group-based solidarity describes the idea that one wants the best outcome for one’s own group and will thus support re-distribution that benefits group members. We here expect, first, that (enfranchised) young and migrant voters will be more likely to feel their respective group members deserve equal representation. In contrast, while still based on the idea of similarity, compassionate solidarity is more expansive. We here suggest that compassionate solidarity would lead individuals who belong to now enfranchised groups that have individually or collectively been disenfranchised in the past to recognize their similarity to excluded groups in general and, thus, be more willing to equally share representation. Importantly, while the group-based logic limits solidarity to within-groups, compassionate solidarity would extend across groups. We thus suggest testing the two following hypotheses:
H3a: Enfranchised young and migrant respondents are more likely to feel that unenfranchised youth and migrants, respectively, deserve representation equal to that of adult national citizens.
H3b: Enfranchised young, migrant, and female respondents are more likely to feel that (all) unenfranchised groups deserve representation equal to that of adult national citizens.
The other two logics are what Thijssen calls organic solidarity forms. These are based on the principle of difference. The first is ‘exchange-based solidarity’. The core idea here is that – due to differences between the subjects – both can help each other out. Solidarity is then an investment in the future. By showing solidarity, the provider accumulates credit from the recipient that the latter will ‘pay back’ later. In this perspective, elected representatives should be more willing than voters to proxy represent those unenfranchised groups that will automatically gain suffrage in the foreseeable future (i.e., the underaged), as these groups might vote for them once enfranchised. This logic of ‘investment’ could explain parties’ efforts to reach teenagers on social media, for instance. The final logic of solidarity in Thijsen’s typology is empathic solidarity. As Thijsen states, empathic solidarity is based ‘on the principle of mutual and unconditional respect’ (Thijssen Reference Thijssen2012: 464). Exactly because two subjects differ in what they have (access to), but share the universal right to equality, solidarity occurs. In this logic, we expect that politicians, based on their responsibility as elected representatives who have the most privileged access to power, will be more willing than voters to proxy-represent unenfranchised groups.
H4a: Elected representatives are more likely than citizens to feel that unenfranchised youth and children deserve representation equal to that of adult national citizens.
H4b: Elected representatives are more likely than citizens to feel that (all) unenfranchised groups deserve representation equal to that of adult national citizens.
Data and methods
Importantly, while the two suggested mechanisms underlying proxy representation are theoretically distinct, they can empirically occur in parallel. Therefore, we proceed in a three-step analysis where we sequentially answer the following questions to pinpoint whether and for whom proxy representation is likely to occur. First, do underage youth and migrants have different policy preferences than the general electorate? Second, how congruent are politicians with underage youth and migrants as compared to voters? And, third, to what extent do voters and politicians feel that unenfranchised groups deserve representation equal to that of adult national citizens?
The analysis is based on two comparative datasets compiled from parallel citizen-politician surveys conducted in 14 Western democracies: Australia, Canada, Czechia, Denmark, Belgium (Flanders and Wallonia), Germany, Israel, Luxembourg, the Netherlands, Norway, Portugal, Sweden, and Switzerland. While all these countries are established democracies, they exhibit significant variation in electoral and party systems, encompassing both majoritarian and proportional models as well as diverse party system configurations. These institutional differences will obviously shape processes of preference formation and political representation for both citizens and politicians. In this article, we focus on describing and comparing the political representation of underage youth and migrants, leveraging institutional and cross-national variation to assess average effects across different contexts, rather than explaining where preference differences and varying degrees of congruence might come from.
The first dataset are representative citizen surveys fielded by Dynata in February–March 2022 (see summary statistics and N per country in Table C.1 in the online Appendix). The samples aim to represent the respective populations and were compiled by using sampling quotas on gender, age, and educational level. To adjust for remaining imbalances, we computed post-estimation raking weights using age, gender, education, and party choice in the most recent national election.
The second dataset are surveys with over 1,000 national and regional elected politicians, conducted between February 2022 and May 2023.Footnote 4 In all countries, the surveys were conducted face-to-face to ensure the actual politicians, rather than members of staff, answered. While response rates vary considerably across countries (average response rate: 34%), the total number of completed surveys is remarkably high for research involving active members of parliament. In most countries, the target population included all national legislators, while in federal systems such as Belgium, Canada, and Switzerland, provincial or state parliamentarians were also invited to participate. Our sample of participating politicians is broadly representative of the overall population in terms of gender, age, and ideological orientation (see Table A.1 in the online Appendix for further details on the politician samples). To adjust for remaining biases – in some countries, right-wing politicians are underrepresented – we use weights based on parties’ left-right scores in the Chapel Hill Expert Survey in all analyses involving the politician sample (Rovny et al. Reference Rovny, Polk, Bakker, Hooghe, Jolly, Marks, Steenbergen and Vachudova2025).Footnote 5
Respondents in all countries were presented with the same survey questions. In our analysis, we focus on four main variables of interest to distinguish unenfranchised youth and migrants from the rest of the electorate. First, respondents were asked whether they voted in the last national election. Those who answered ‘yes’ were coded as ‘voters’; those who answered ‘no’ were coded as ‘non-voters’. While we lack a direct measure of the reasons for non-voting, we proxied those who are ‘unenfranchised’ by defining them as the non-voters who were younger than 18 in the year of the previous election in each country and those who were born in another country than that in which they are currently living. While this is no perfect distinction and there might be foreign respondents who would technically have had the right to vote but decided to not use it, we then arrive at four categories of (non-)voters: voters, (voluntary) non-voters, underage youth, and migrant non-voters. As our original sample is large, we receive a reasonably high N for our subgroups of interest: about 400 underage youths and close to 1,000 migrant non-voters.Footnote 6
To assess preferences and, subsequently, (in)congruence, we rely on (dis)agreement with nine policy proposals that were fielded in all countries, covering the topics of re-distribution and social policy, immigration policy, climate policy, corona policy, medically assisted suicide, and gender-equal representation (see online Appendix B for all items and the exact question wording). To assess whether mechanical proxy representation occurs, we conduct two complementary analyses. First, we assess the extent to which mechanical representation occurs via electoral aggregation. Here, we compare whether underage youths’ and migrant non-voters’ preferences align with those of voters (i.e., the general electorate). We report standardized effect sizes to identify substantial preference differences. In the second analysis, we assess whether mechanical representation occurs through the political system’s pluralistic structure. Here, rather than comparing means between groups, we measure the degree to which the distribution of preferences in national parliaments (i.e., among national elected representatives) matches those of underage youth and migrant non-voters as compared to those of voters. Thus, we measure the (in)congruence of politicians with the respective groups compared to voters across policy issues and countries. To do so, we make use of the Earth Mover’s Distance (Lupu, Selios and Warner Reference Lupu, Selios and Warner2017).
Finally, we focus on a subset of countriesFootnote 7 to investigate respondents’ preferences for (proxy) representation, which we use as a measure for solidarity representation. In the Netherlands, Norway, and Portugal, citizens and politicians were asked to indicate the extent to which an elected politician in the national parliament should represent the interests of ‘adult [nationality] citizens’ and three unenfranchised groups – ‘youth and children’, ‘foreigners living in this country’, and ‘future generations’ – on a seven-point Likert scale. The order in which the groups appeared was randomized. Importantly, we did not require respondents to rank order the groups. This decision was made to increase the external validity of our findings: Arguably, for proxy representation to occur, it will often be unnecessary to prioritize unenfranchised groups’ interests over those of enfranchised citizens: Considering them as equally relevant should suffice for a fair chance of democratic inclusion. Therefore, rather than forcing respondents to choose a rank order, we let them decide for each group how deserving it is of political representation. We then estimate differences between the perceived deservingness of unenfranchised groups across and within respondents. We argue that proxy representation via solidarity is likely to occur when respondents consider unenfranchised groups to be at least as deserving of representation as (enfranchised) adult citizens.
Results
There are different approaches for theoretically and empirically assessing the quality of – and inequality in – political representation (Enns Reference Enns2022; Wlezien Reference Wlezien2017). In our approach, we first assess whether and how political preferences vary between groups to test H1 (mechanical proxy representation by voters). We then proceed to assessing politicians’ (in)congruence with unenfranchised youth and migrant non-voters, testing H2 (mechanical proxy representation by politicians). Finally, we assess and compare the extent to which citizens and politicians consider youth and children, future generations, and migrants as deserving political representation equal to that of adult national citizens, testing H3 and H4 (proxy representation by solidarity).
Mechanical proxy representation by voters
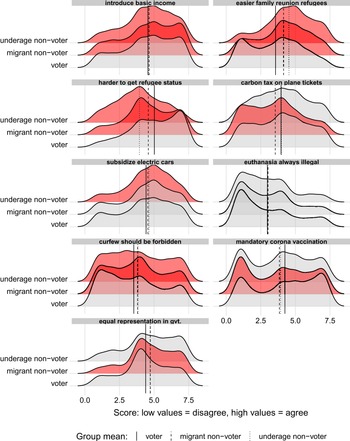
In a first step, we assess the degree of support for nine different policy proposals that cover the topics of redistribution, immigration, medically assisted suicide, climate policy, corona policy, and gender-equal representation.Footnote 8 Figure 1 shows how preferences are distributed across policy proposals and groups of (non-)voters across all countries. Red ridges indicate where underage youth’s and migrant non-voters’ preferences differ significantly (p < 0.05) from those of voters.Footnote 9 The significance estimates are obtained from nine OLS models with country-fixed effects and controls for left-right-placement, as shown in online Appendix D (Figure D.1 and Table D.1). By comparing to what extent and in which areas policy preferences of underage youth and migrant non-voters differ from those of the general electorate, we test whether proxy representation occurs mechanically through electoral aggregation.
Policy preferences by groups of (non-)voters.
Note: Distribution of policy preferences across various voter groups for multiple policy issues. Each facet represents a specific policy issue, and the smoothed distributions of responses illustrate how the preferences for that policy vary by voter group. The vertical lines mark group means. Statistically significant differences in mean preferences between non-voter groups compared to voters are highlighted in red. This is based on the model presented in Table D.1, which is estimated with robust standard errors, self-placement on a left-right scale, and country-fixed effects.
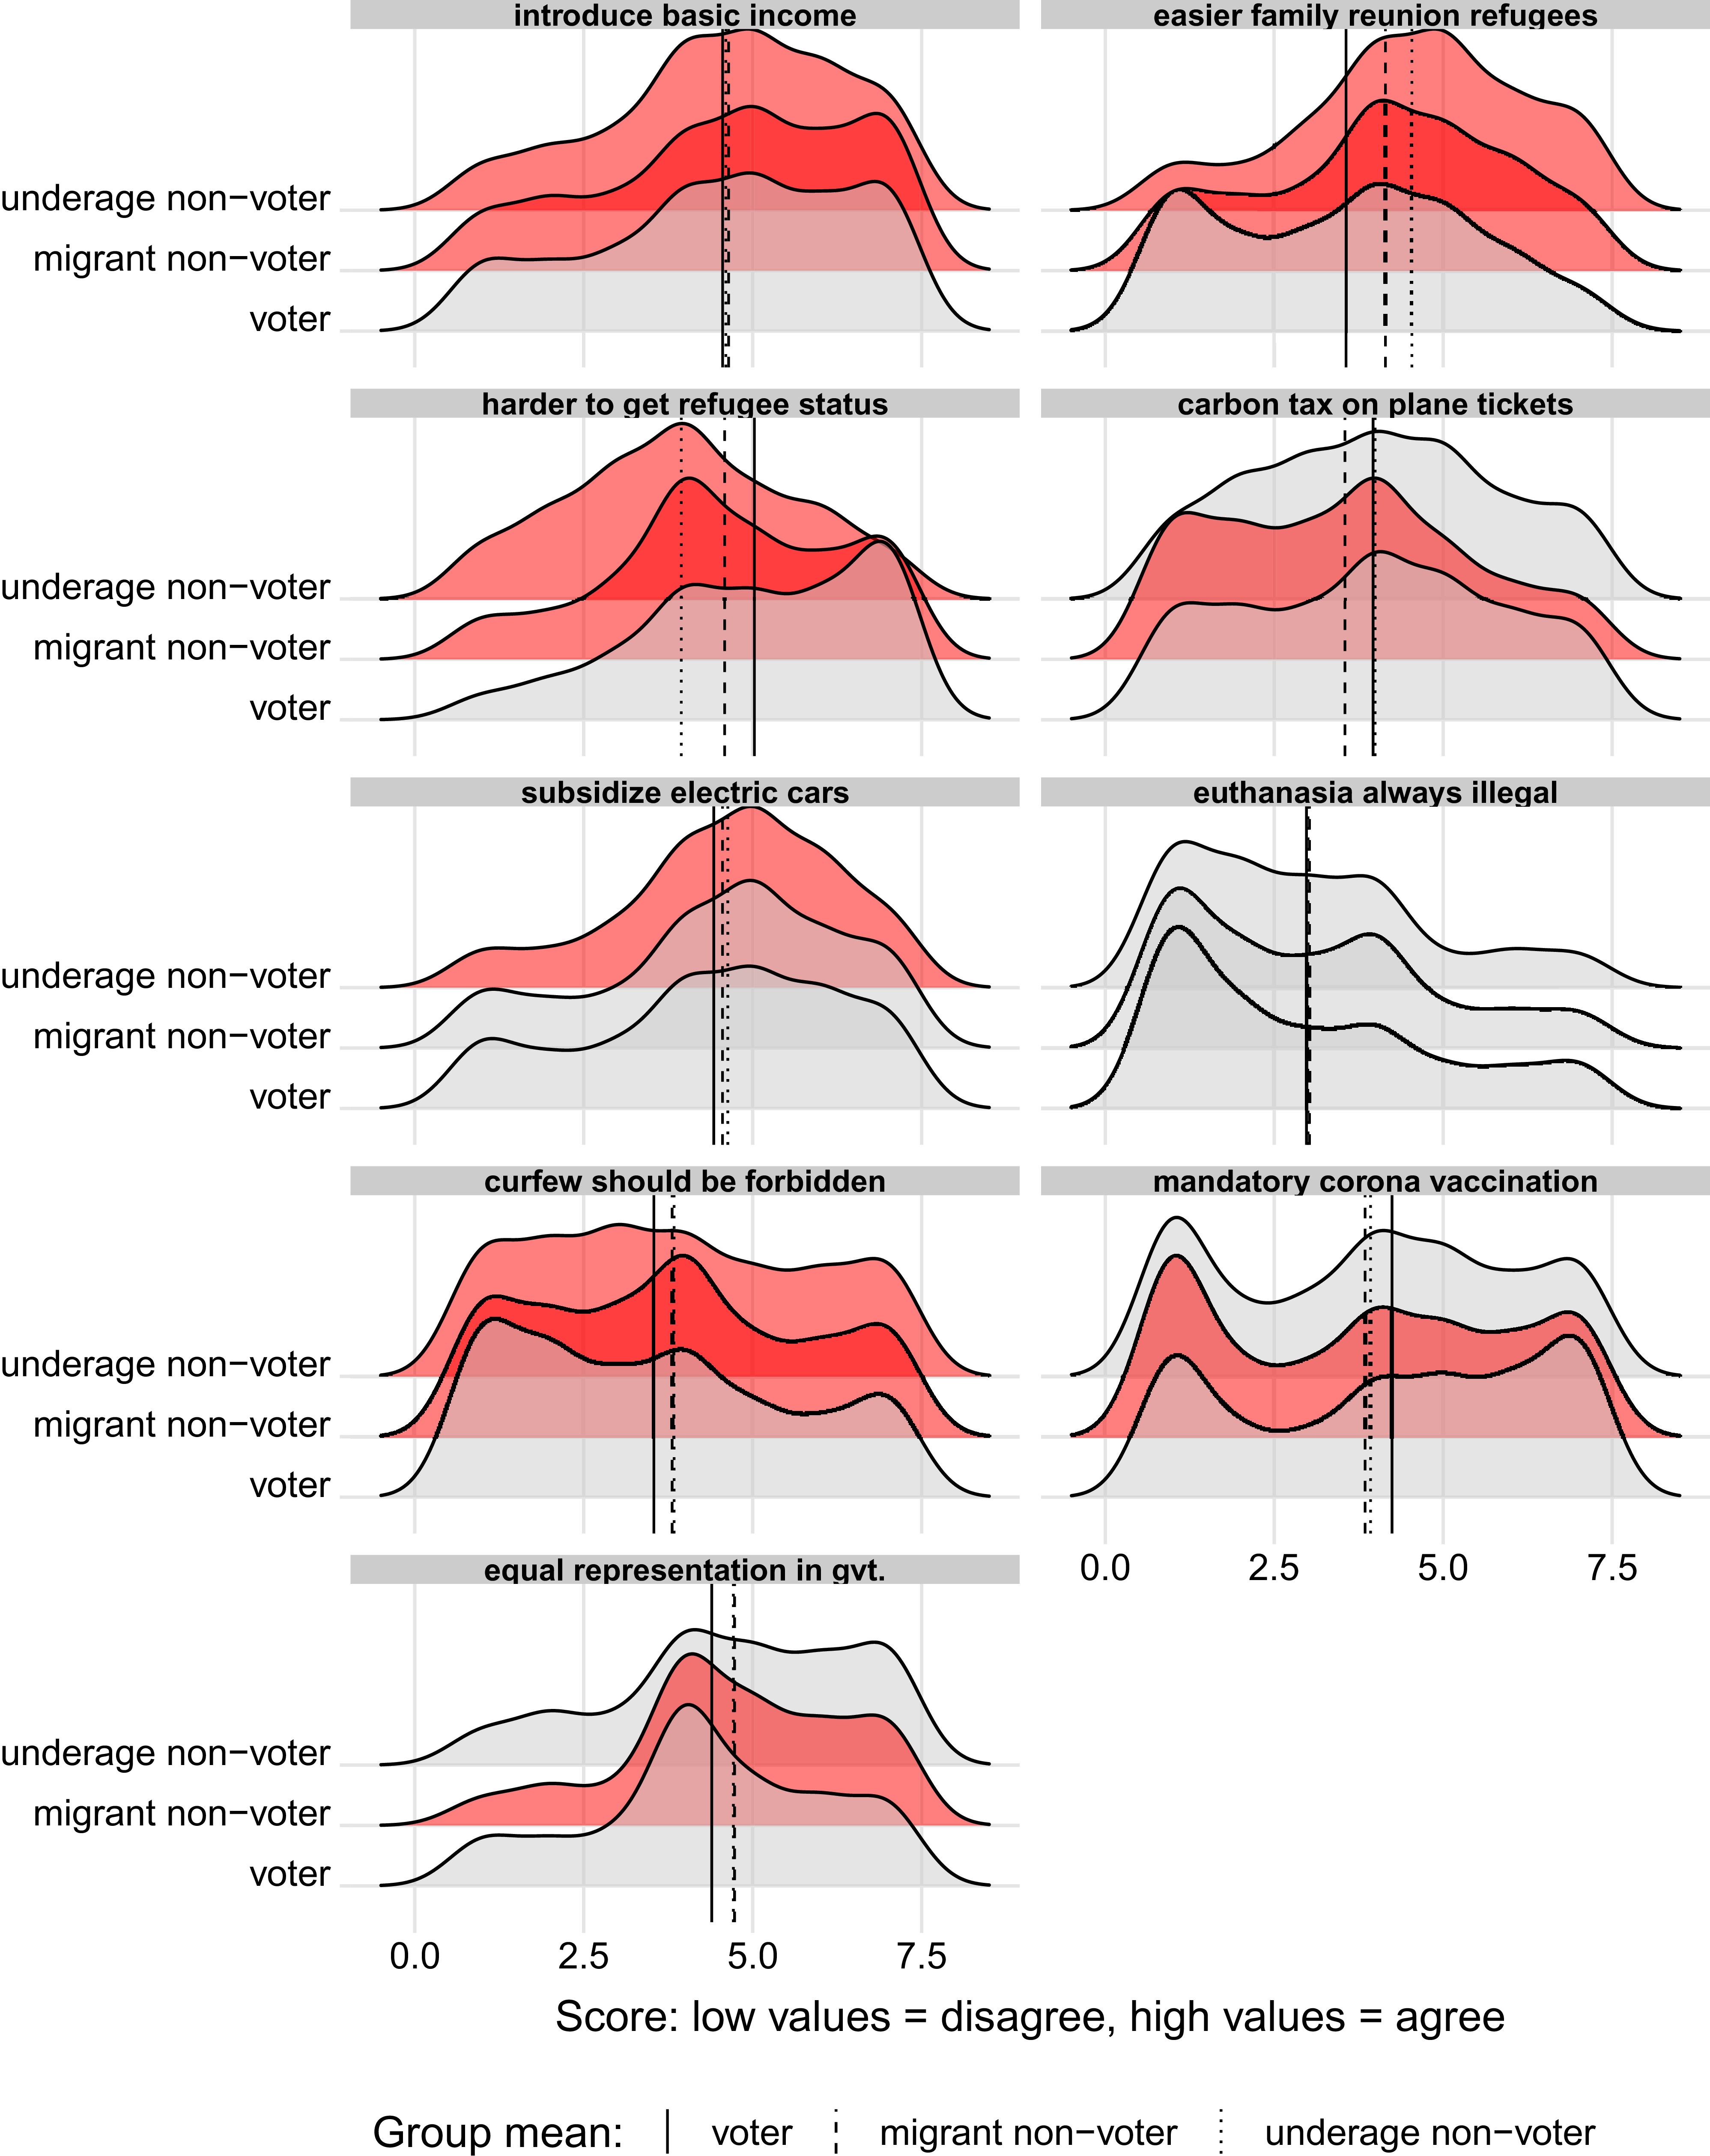
Figure 1. Long description
The image contains multiple density plots comparing policy preferences among underage non-voters, migrant non-voters, and voters. Each plot represents a different policy statement, with the x-axis labeled ‘Score: low values = disagree, high values = agree’ ranging from 0.0 to 7.5. The y-axis is not labeled but represents the density of responses. Group means are indicated by vertical dashed lines for voters, migrant non-voters, and underage non-voters. Panel A: The plot for ‘introduce basic income’ shows that voters and migrant non-voters have similar distributions, while underage non-voters show a slightly different pattern. Panel B: The plot for ‘easier family reunion refugees’ indicates that all three groups have overlapping distributions, with slight variations. Panel C: The plot for ‘harder to get refugee status’ shows distinct peaks for each group, with voters and migrant non-voters having more pronounced disagreement. Panel D: The plot for ‘carbon tax on plane tickets’ reveals that all groups have similar distributions, with a slight peak towards agreement. Panel E: The plot for ‘subsidize electric cars’ shows that voters and migrant non-voters have similar distributions, while underage non-voters show a different pattern. Panel F: The plot for ‘euthanasia always illegal’ indicates that all three groups have overlapping distributions, with slight variations. Panel G: The plot for ‘curfew should be forbidden’ shows distinct peaks for each group, with voters and migrant non-voters having more pronounced agreement. Panel H: The plot for ‘mandatory corona vaccination’ reveals that all groups have similar distributions, with a slight peak towards disagreement. Panel I: The plot for ‘equal representation in government’ shows that voters and migrant non-voters have similar distributions, while underage non-voters show a different pattern.
As can be seen, the underage hold preferences that differ from the general electorate in five of nine policy issues: They are more liberal regarding immigration policies (more in favor of family reunion for refugees and less supportive of stricter rules to get refugee status), more in favor of introducing a basic income, more supportive of subsidizing electric cars, and more supportive of forbidding corona-related curfews.
Migrant non-voters also appear to have distinct preferences, regarding seven of nine policy issues: They are more liberal regarding refugee and immigration policies and generally less supportive of corona measures (more supportive of forbidding curfews and less supportive of mandatory vaccinations). They are also more positive toward introducing a basic income and of gender-equal governments and more opposed to introducing carbon taxes on plane tickets than are voters.
While it can appear that the selection of the policy issues constitutes a ‘most-likely’ case for preference differences, especially regarding immigration and corona policies, Fig. E.1 in the online Appendix presents the coefficients of similar models regarding nine other policy issues that have been fielded only in subsets of the 14 countries. Again, there are a number of significant preference differences for both unenfranchised groups: Underage youth are less supportive of increasing taxes on stock trade, more supportive of restricting the use of CCTV cameras in public spaces, less in agreement that hate speech should be removed from social media, and more in favor of subsidizing breast pumps than are voters. Migrant non-voters differ from voters regarding their opinions on stock trade taxes (less supportive), removal of hate speech (more supportive), and educational policy (more supportive of increased focus on the strongest students).
Importantly, all models include self-placement on a left-right scale as a control variable, thus indicating an effect of being an underage/foreign-born non-voter that is independent from political ideology. At the same time, we do not argue that these groups have distinct preferences because they lack the right to vote. Differences in educational achievement, social economic background, and the identity of being young/migrant (independent of enfranchisement status) very likely explain some of the differences between our groups of interest and the general electorate. Arguably, however, mechanical proxy representation via electoral aggregation is most likely to occur if preferences match with the general electorate – regardless of why that might be the case (or not).
This said, underage youth and migrant non-voters might get at least some chance of having their voices heard if their preferences closely match those of the voting members of their groups. While young and foreign-born voters will still be minorities within electorates, (some) mechanical proxy representation might happen via these subgroups. We, therefore, conducted two additional analyses to assess the extent to which underage and migrant non-voters could potentially rely on mechanical proxy representation by their close ‘relatives’. As can be seen in Figures E.3 and E.4 in the online Appendix, the within-group differences are indeed smaller than when compared to the general electorate, but there are still some issues that distinguish our groups of interest. When comparing underage youth to young voters aged 18–25 years, we see that they are relatively similar but have different opinions on two issues (refugee policy and medically assisted suicide). The differences within the migrant population are more pronounced: Migrant non-voters differ from migrant voters regarding their opinions on four of nine issues: refugee policies, taxing plane tickets, medically assisted suicide, and corona vaccination. These findings likely reflect the greater diversity in terms of background among our sample of migrants as compared to the relatively homogeneous group of youth aged 16–25 years.
To understand the magnitude of preference differences between our groups of interest and the general electorate, we computed standardized coefficients (Cohen’s d equivalent). As can be seen in online Appendix D (Table D.2), the effect sizes range from 0.17 standard deviations (underage youths’ preference for subsidizing electric cars) to 0.61 standard deviations (underage non-voters’ disagreement with stricter refugee policy). This means that, within the statistically significant areas, between 55% and 75% of youth and migrants hold preferences that differ from the general electorate. As can be seen in Table D.2, effect sizes are somewhat larger for underage youth than for migrant non-voters but concern more policy issues for the latter than for the former.
Our expectation formulated in H1 is thus generally supported: Underage youth and migrant non-voters do indeed hold preferences that systematically differ from those of enfranchised voters at least in some policy areas. They can thus not unequivocally rely on mechanical proxy representation exercised by the general electorate.
Mechanical proxy representation by elected representatives
Next, we compare the stated preferences on the same policy issues between sitting national representatives and the respective groups of (non-)voters. We do this by calculating the Earth Mover’s Distance (EMD) (Lupu, Selios and Warner Reference Lupu, Selios and Warner2017). The EMD is a measure of the dissimilarity between two distributions and, as such, an assessment of many-to-many congruence. It can be conceptualized as the minimum amount of work required to transform one distribution into another, where work is defined as the amount of distribution weight that must be moved, multiplied by the distance it must travel. Thus, larger values indicate larger disparities (or distances to cover) between groups. The advantage of the EMD is that the whole distribution of answers is taken into account, rather than just the mean values.
In contrast to mechanical proxy representation by voters, which we argued should be most likely to occur when the mean preferences of underage youth and migrant non-voters do not significantly differ from those of the general electorate (i.e., the majority of voters), we suggest that mechanical proxy representation by elected politicians follows a slightly different logic. Here, we test whether the political system’s pluralistic structure can accommodate these groups’ preferences. Therefore, the full distributional match matters, as politicians can advocate for positions held by any segment of the population, regardless of size – and indeed many parties will do exactly that.
In our analysis, we calculate the EMD (using weights for both citizens and politician samples) between the distribution of policy preferences for politicians and each voter group (voters, underage youth, migrant non-voters), for each policy area and country. Recall that lower EMD values indicate higher congruence. Table 1 shows the average EMD values for each group of (non-)voters across countries: On average, politicians tend to be most congruent with voters and least congruent with underage youth, with foreign non-voters lying in between.Footnote 10 We acknowledge that the average EMD values are generally low, and thus indicate satisfactory average levels of congruence. However, our primary concern lies in the difference between the politician-voter EMD and the politician-underage/foreign non-voter EMD. This difference is present in the expected direction, and thus underscores our main argument.
Average EMD by group across countries

Note: Average Earth Mover’s Distance (EMD) between politicians and groups across all countries. Individual survey weights for citizens and politicians are included in the calculation to ensure representativeness per country. The average is then calculated across countries, while weighting all countries equally. NB: Lower values indicate higher congruence.
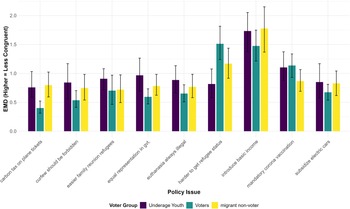
Figure 2 examines how the average EMD across countries varies by policy areas. It shows that incongruence between politicians and citizens is generally largest regarding the introduction of a basic income and regarding refugee-status policy. When looking specifically at the areas where politicians are significantly (p < 0.10) more congruent with voters than with underage youth and foreign non-voters, we can see that incongruence with underage youth is driven by different opinions regarding curfews in connection with corona (youth are less supportive), a carbon tax on plane tickets (youth are more supportive), the legalization of euthanasia (youth are more supportive), and gender-equal representation in government (youth are more supportive).
Weighted average EMDs by voter group and policy across countries.
Note: Average Earth Mover’s Distance (EMD) by policy and group across countries. Survey weights for citizens and politicians are applied to ensure representativeness. Higher values indicate lower congruence. Error bars show 95% CIs from bootstrapped resampling.
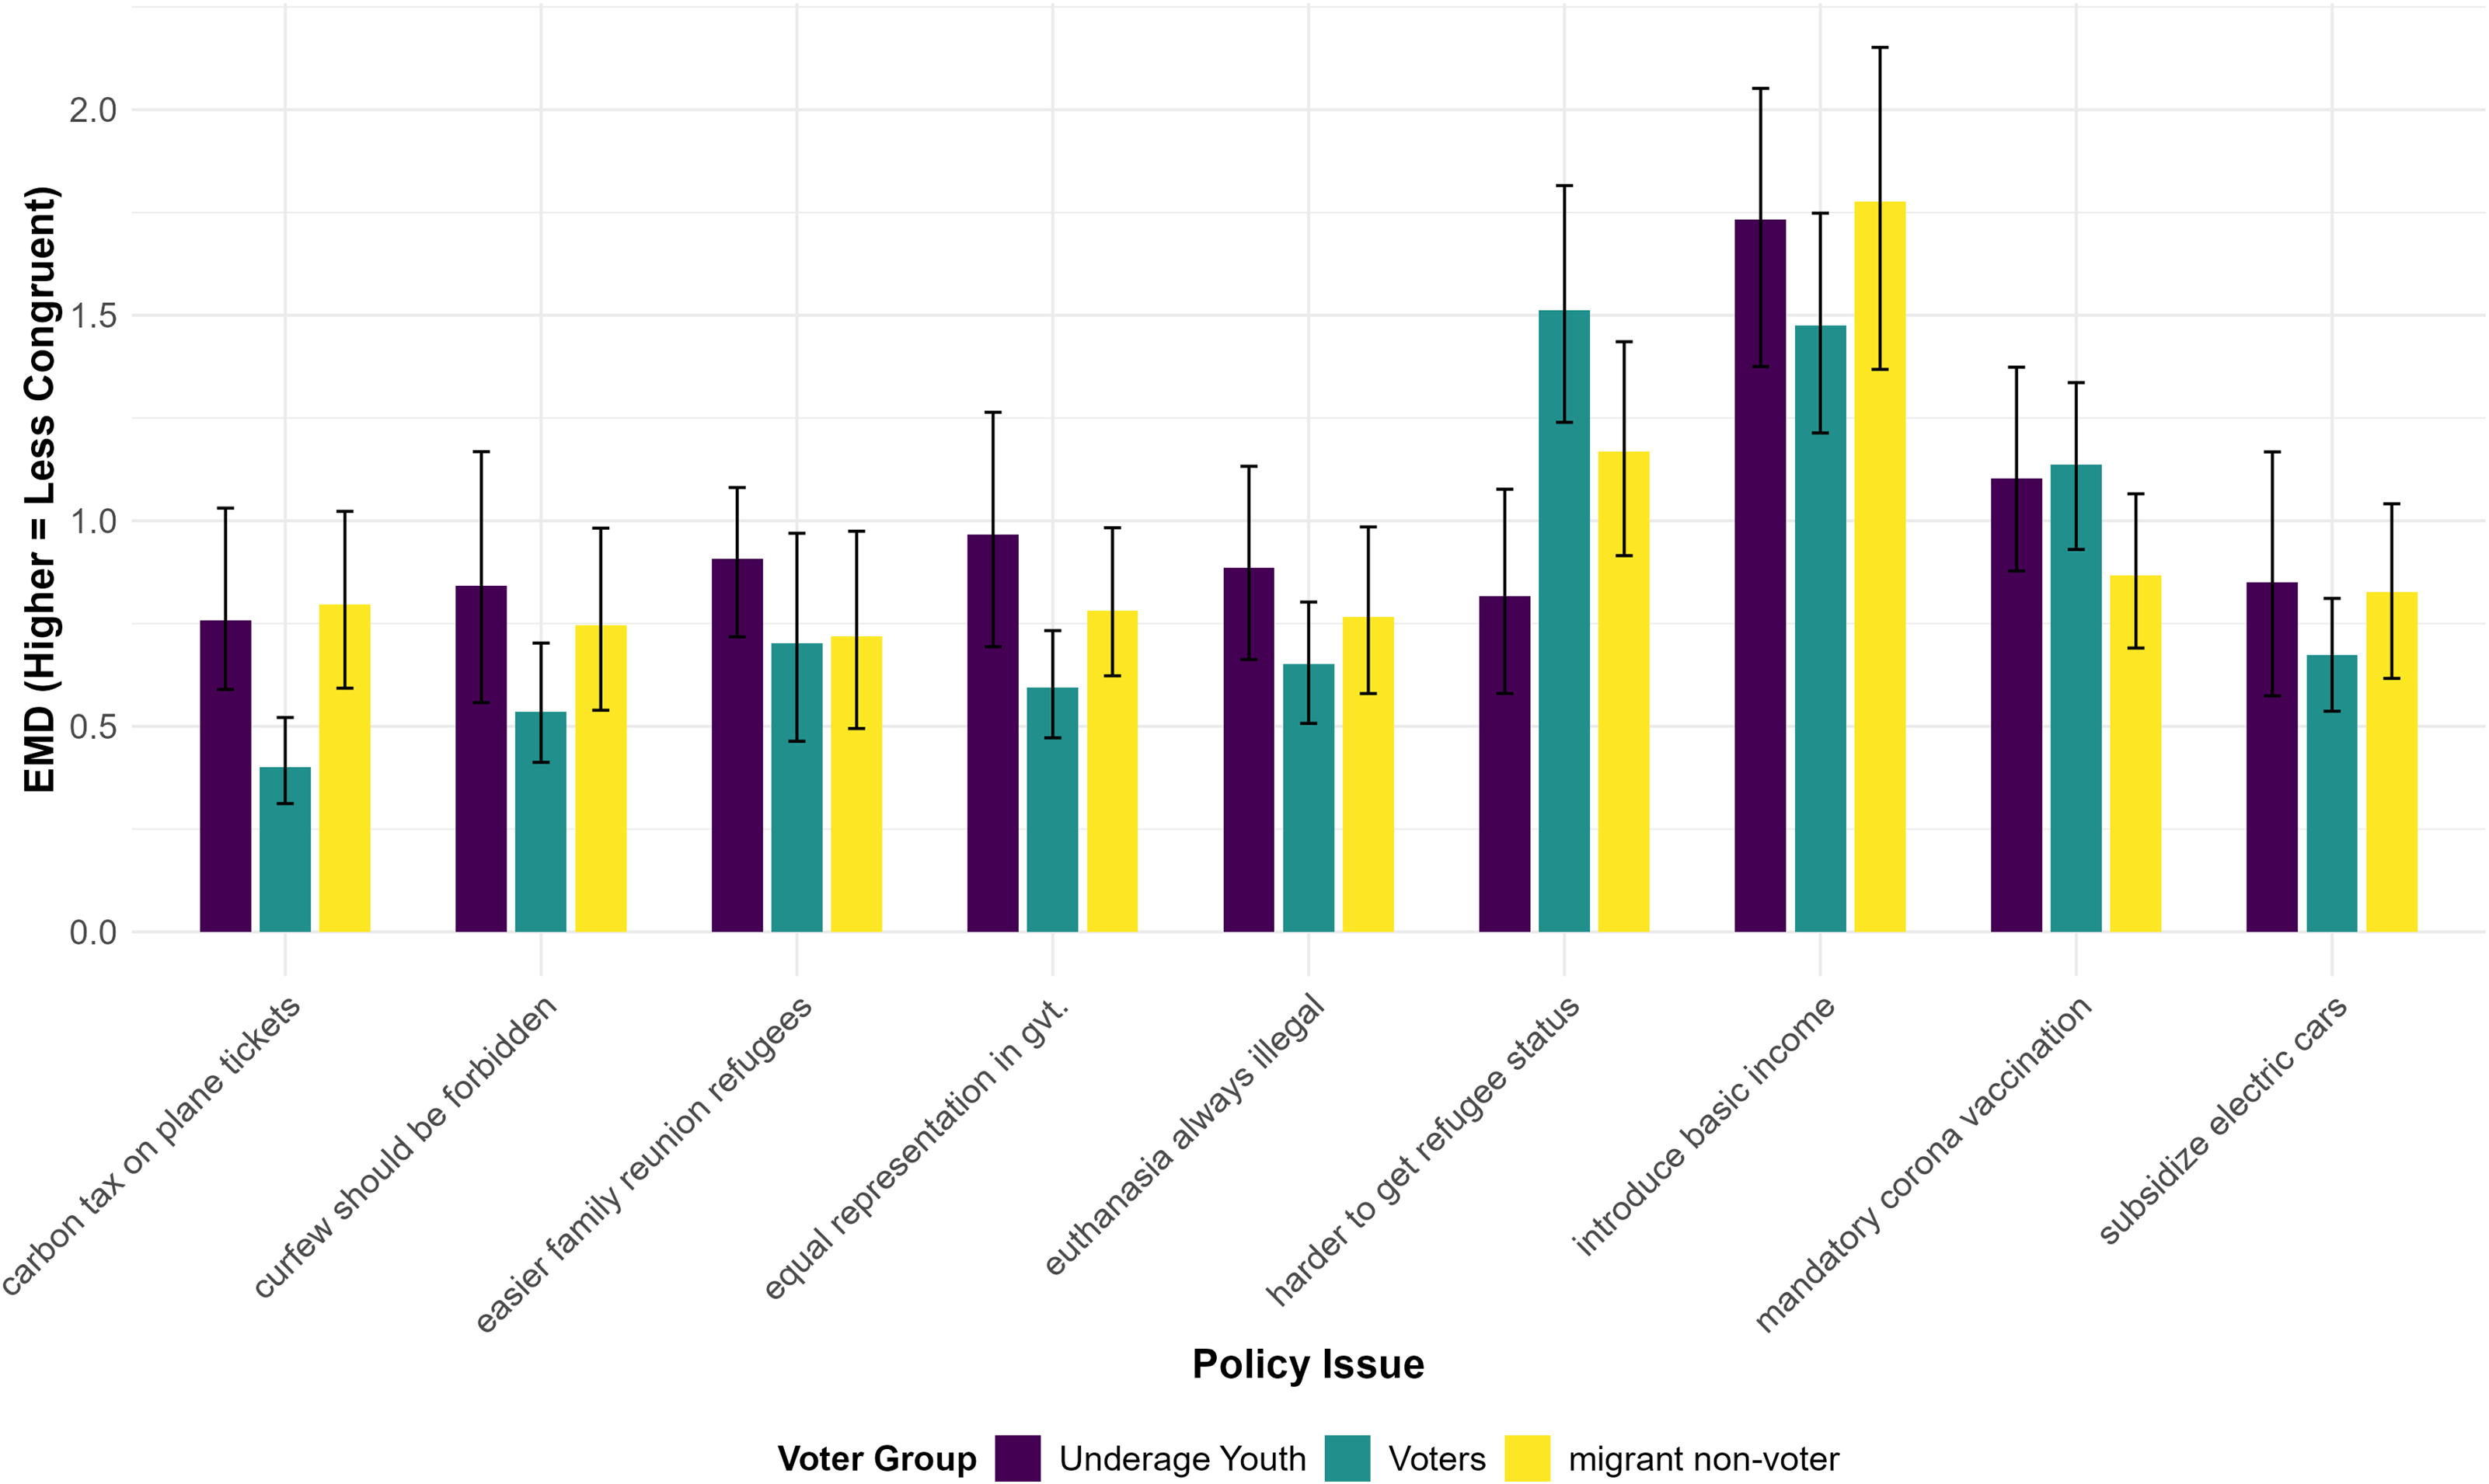
Examining congruence with migrant non-voters, representatives are less congruent with them than with voters regarding attitudes toward curfews (migrants agree more that curfews should be forbidden) and the introduction of a carbon tax on plane tickets (migrants are more opposed). Interestingly, politicians appear to be more congruent with underage youth and migrant non-voters than with the general electorate regarding refugee policies (politicians are more lenient than voters concerning refugee status, as are both youth and migrants) and mandatory corona-vaccines (politicians are less supportive, as are both youth and migrants).
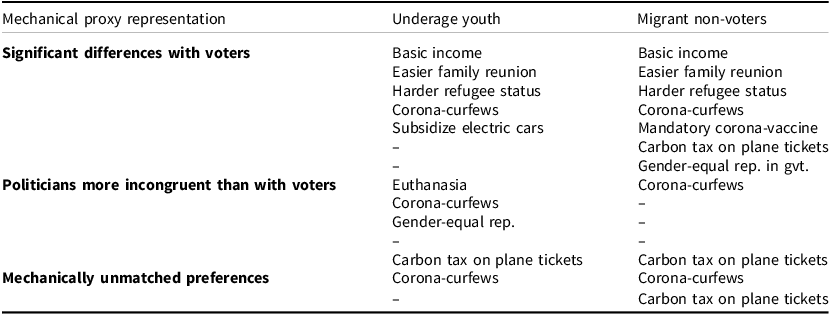
In sum, the average EMD levels do indeed suggest that politicians are slightly less congruent with underage youth and migrant non-voters than with voters, thus supporting H2. At the same time, there are some policies where a lack of mechanical representation through one channel (via voters or politicians) is resolved by matching preferences with the other group. Table 2 attempts to show the results of both analyses side-by-side, identifying in the last row the policy areas where preferences of youth and migrants remain mechanically unmatched by both voters and politicians.
Preference (in)congruences between youth/migrants and politicians
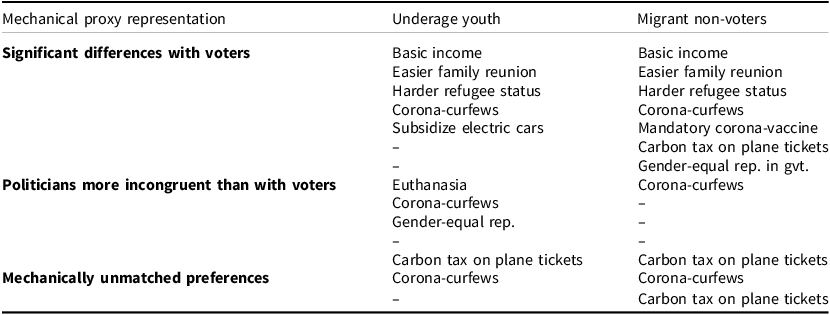
This gives us some idea of which preferences significantly differ from both voters and politicians for each of our groups of interest. As can be seen, preferences regarding eight of nine policy issues are indeed mechanically represented either by the general electorate or by politicians when it comes to underage youth. At the same time, their preferences regarding curfews during corona are unmatched by both voters and politicians. The picture looks comparable for migrant non-voters. For them, preferences in two of nine policy issues remain mechanically unrepresented, regarding curfews and the introduction of carbon taxes on plane tickets.Footnote 11 If we take a look at incongruences related to the additional issues (Figures E.1 and E.2), the list of unmatched preferences for the youth expands to include increasing stock trading taxes and subsidies for breastpumps. Migrant non-voters’ preferences are additionally unmatched regarding their views on criminal policy (offenders should be making amends) and regarding elite orientation in educational policy. In sum, while incongruences are not massive, they are consistently present for both underage youth and migrant non-voters. Notably, mechanical representation is absent exactly in the policy areas where youth and migrants, respectively, tend to have crystallized interests and are affected differently than the general electorate.
Proxy representation by solidarity
In the final step of our analysis, we evaluate to what degree citizens and politicians think that different unenfranchised groups deserve equal representation of their political preferences. This, we argue, is a measure of their solidarity toward the different groups and allows us to test hypotheses H3 to H4. Arguably, the incongruences that we found in the previous steps of our analysis could stem from the fact that unenfranchised people belong to comparatively small groups in the population whose interests are likely to differ from the majority opinion especially in some policy areas that are comparatively more salient for them. Therefore, we test whether voters and politicians are in principle willing to represent the interests of unenfranchised groups, which is, we argue, an alternative route to proxy representation.
In the Netherlands, Norway, and Portugal, all respondents were asked to indicate the degree to which a politician in the national parliament should represent the interests of ‘adult [national] citizens’, ‘foreigners living in [country]’, ‘youth and children’, and ‘future generations’ (in randomized order and without the necessity to rank). For the analysis of this item, we subtracted each respondent’s response to ‘adult [national] citizens’ from their response to the respective unenfranchised groups. For each group, we thus receive a value between −6 and 6, where 0 signifies the belief that politicians should represent the respective non-voter group as much as adult citizens. Negative values denote a perception of the group as less deserving of representation than adults, while positive values indicate a perception of greater deservingness of representation than adult citizens.
As the summary statistics in the online Appendix C show, there are differences in how much respondents are willing to show solidarity toward the different unenfranchised groups. In the citizen sample, the average mean difference is negative for all groups and lowest for migrants. This is also the case in the politician sample, but here the mean value for representing underaged persons is positive and very close to zero, suggesting that most politicians have chosen the same value for adults and underaged persons. It is, however, notable that, across respondent groups and unenfranchised groups, respondents do differentiate between groups in the expected direction, even if they were not required to do so by the question design.
First, we compare whether deservingness perceptions vary between politicians and citizens (H4). As the estimates in Figure 3 show, this is not the case. Both representatives and citizens are very similar and statistically indistinguishable in their willingness to grant unenfranchised groups political representation. H4a and H4b are thus not supported by the data.
To what extent should a national politician represent the interests of the following groups?
Note: Plots show predicted values for difference of agreement in comparison with adult national citizens. The predictions are based on the estimates in Table D.5 and calculated with robust standard errors. Fixed effects for countries, controls for left-right placement, and survey weights for citizens and politicians are included. Bandwidths indicate 95% confidence intervals.

Regarding the comparison between groups, Figure 3 reveals another interesting finding. As can be seen, both politicians and citizens generally make very little distinction between adult national citizens and youth, children, and future generations. The point estimates are very close to 0 for the politicians and substantially small for citizen respondents. All respondents are, however, clearly unwilling to grant equal representation to migrants. The point estimate for migrants’ deservingness is at −1.1 for both politicians and citizens, thus indicating a 1 to 2 point difference on the Likert scale per respondent. Note that we again include self-placement on a left-right scale as a control variable, as well as survey weights for citizens and politicians and country-fixed effects. This can thus be interpreted as an average effect that applies across parties and countries.
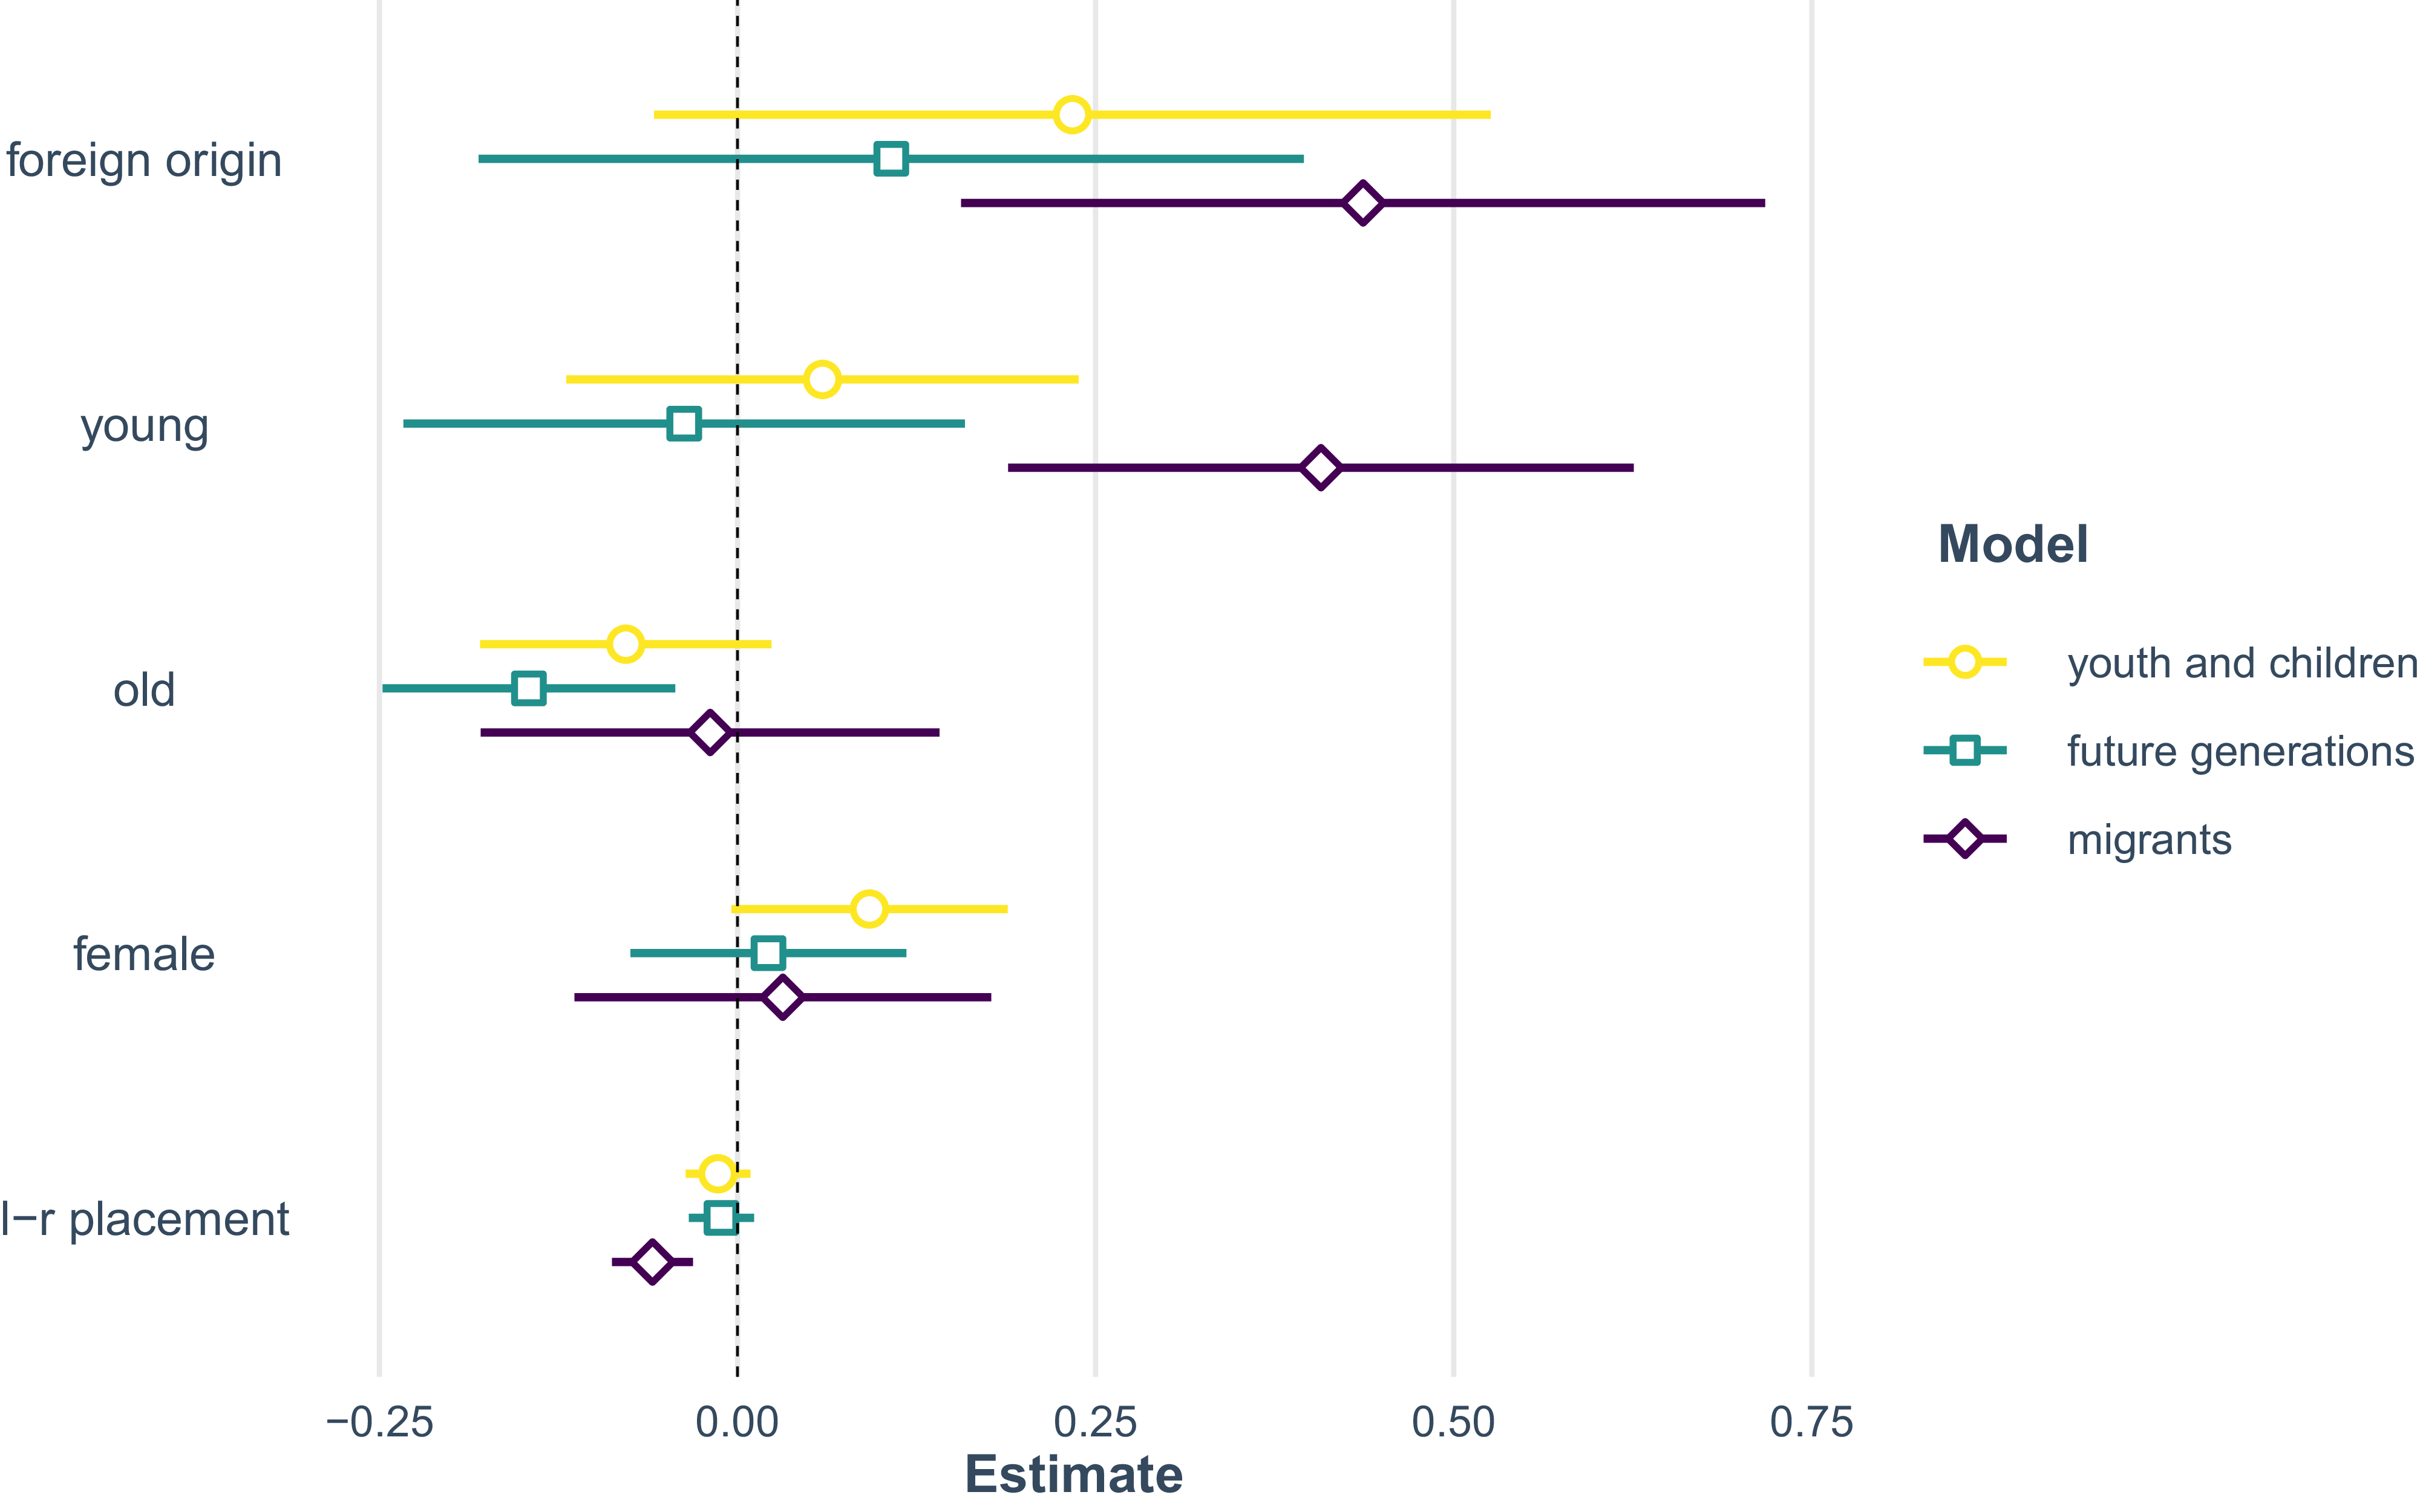
Next, we test our hypotheses about heterogeneity in solidarity attitudes among enfranchised citizens (H3). We regressed the differentiated values for each unenfranchised group on citizens’ characteristics (foreign origin, age group, and sex). Figure 4 and Table D.4 show how deservingness perceptions vary across groups and by respondent characteristics.
To what extent should a national politician represent the interests of the following groups?
Note: Plot shows coefficients for deservingness perceptions among enfranchised respondents (across unenfranchised groups). Reference categories: not foreign-born; middle-aged; male. Note that migrant non-voters and underage respondents are excluded from this analysis. The estimates can be found in Table D.4 and are calculated with robust standard errors. Fixed effects for countries, controls for left-right placement, and survey weights are included. Bandwidths indicate 95% confidence intervals.
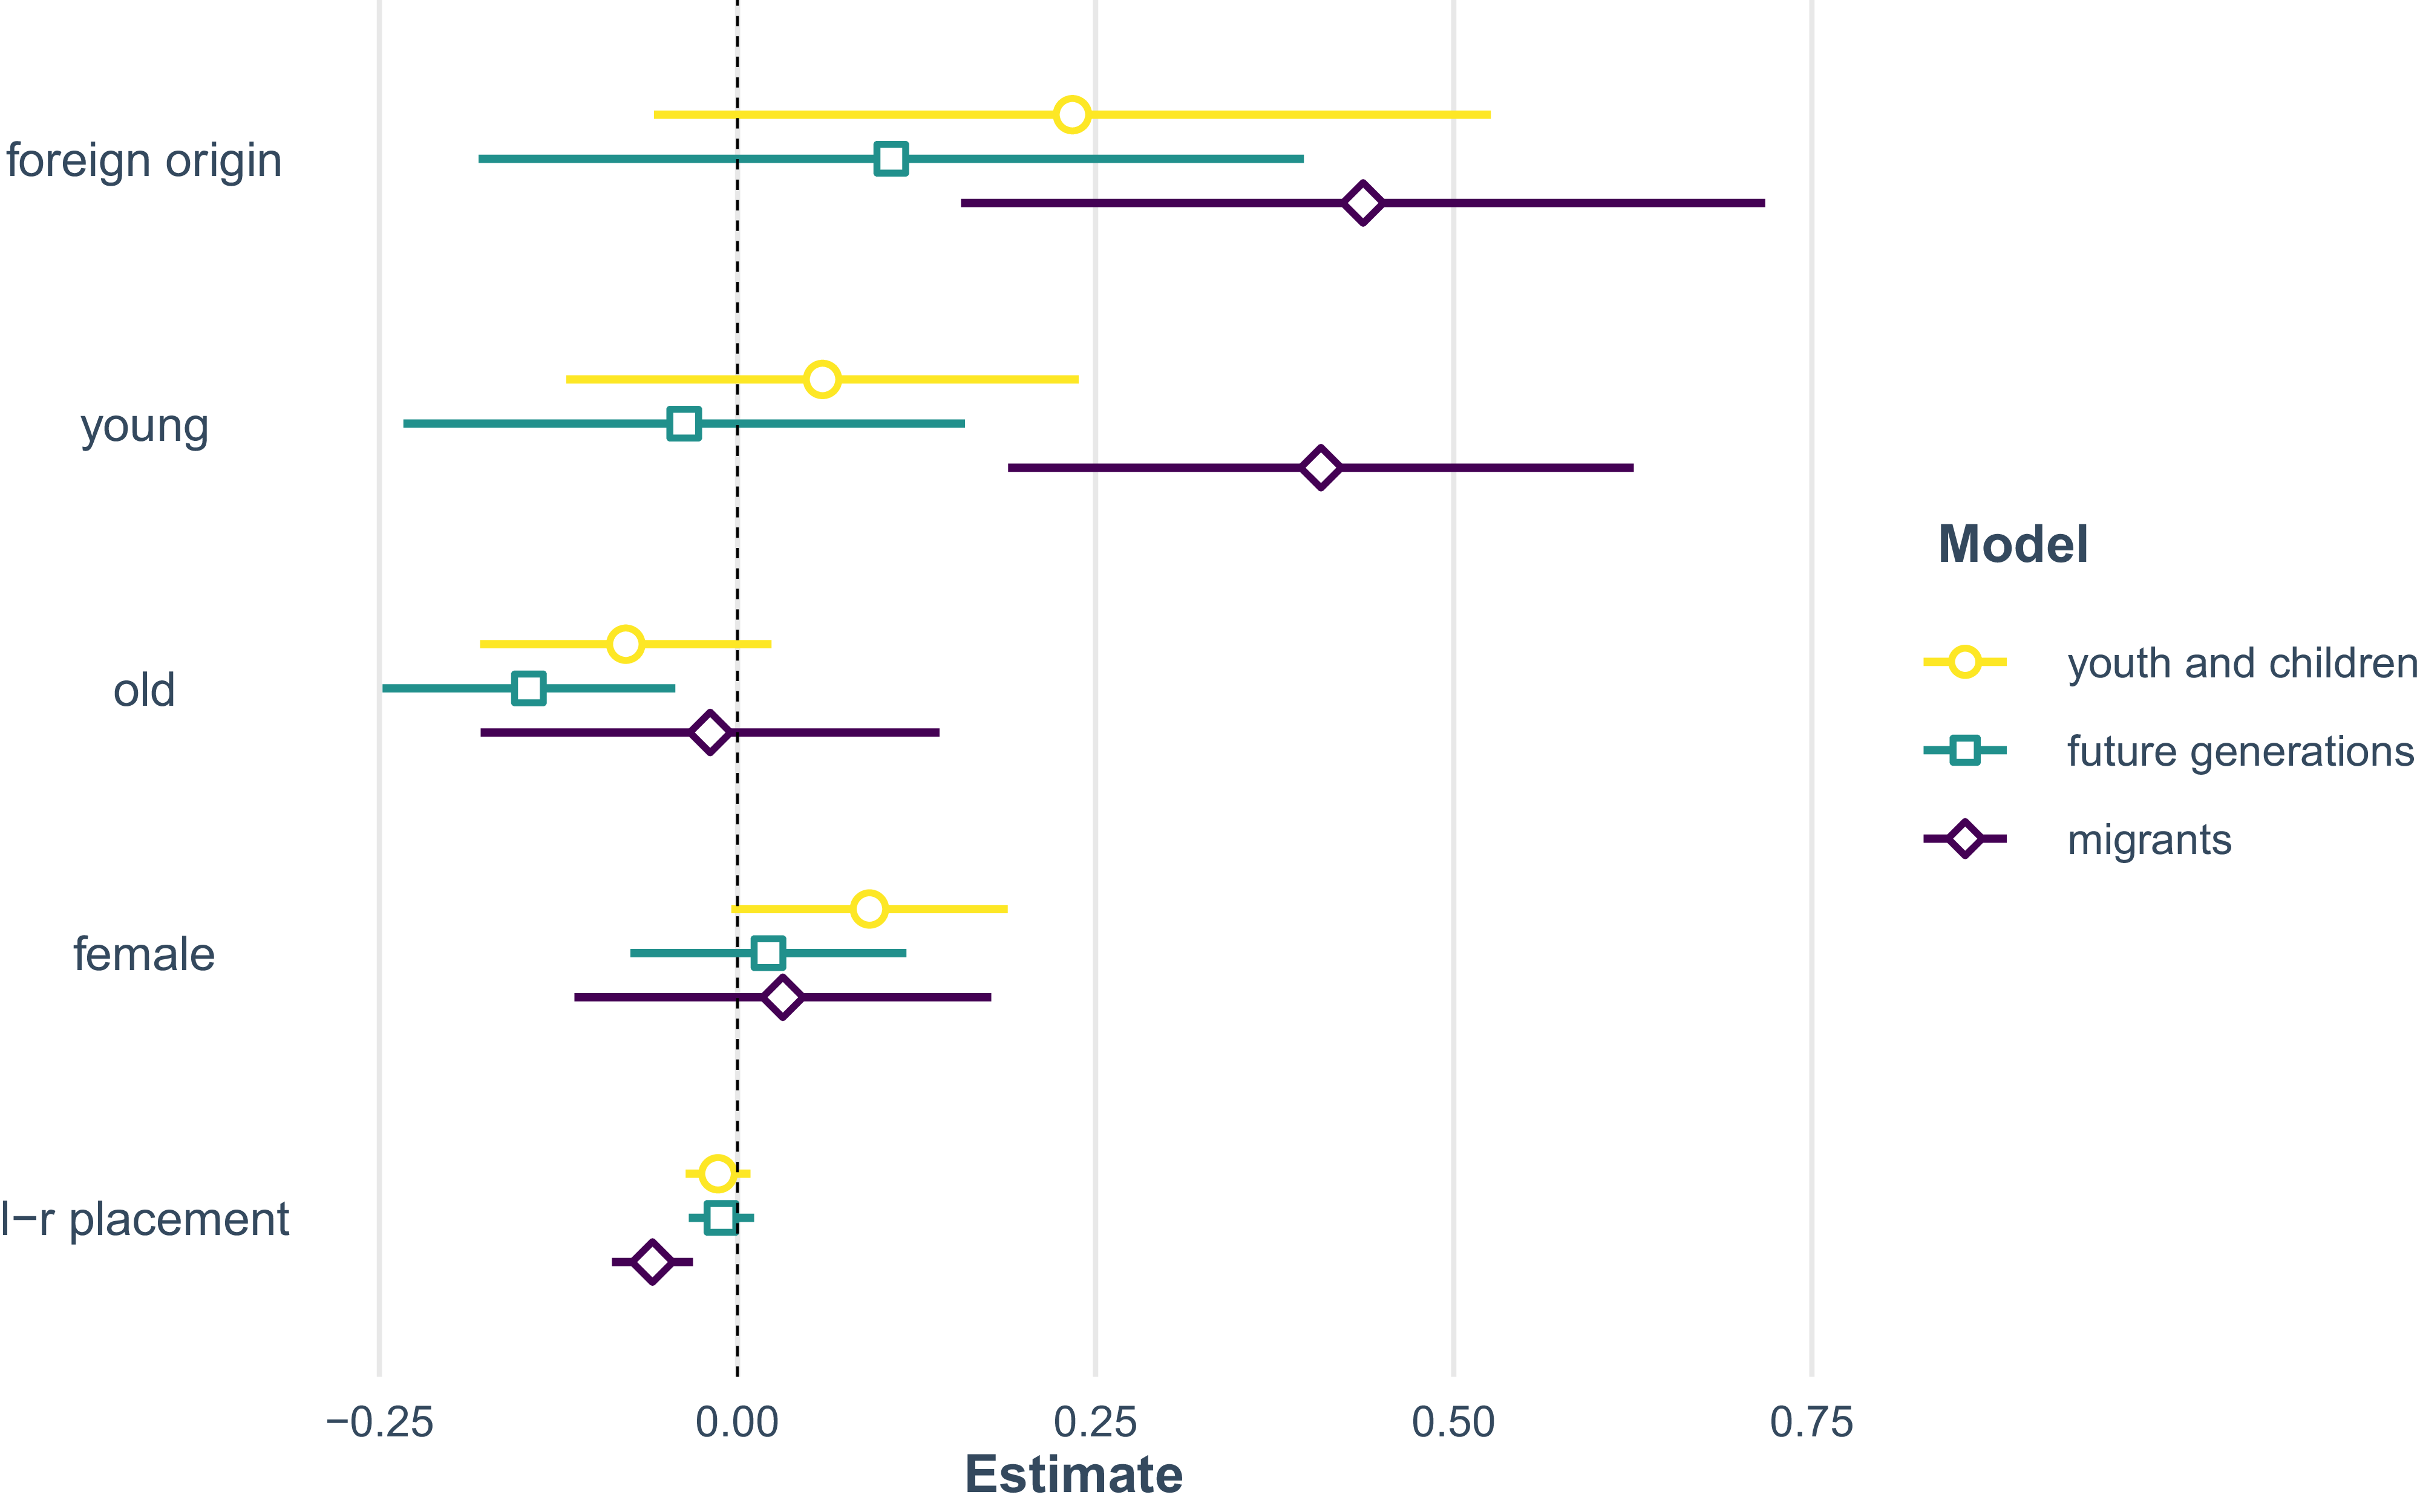
The data provide only weak support for H3a and H3b. On the one hand, in regard to group-based solidarity, citizens, who were born in a country different than that in which they are currently living, do indeed show comparatively more solidarity toward migrants. Also, citizens over the age of 60 are less willing to grant future generations’ preferences political representation. Young respondents up to 25 years of age are, however, not more willing than middle-aged respondents to grant youth, children, or future generations’ representation equal to that of adult citizens. There are also some indications for compassionate solidarity logics: young respondents are more willing to grant migrants political representation, while women show some solidarity toward children and youth. Coefficients for the other groups are, however, insignificant.
Note that our findings regarding solidarity representation must be interpreted in the light of the relatively lenient question design. When more constraints are introduced, for example when representatives have to prioritize preferences of one group over the other, solidarity consideration might not in fact be strong enough to ensure proxy representation.
Robustness and generalizability
One main limitation of our data is the fact that we have no direct measure of the reasons for not voting and thus had to proxy unenfranchised migrants as migrant non-voters. The reason for not having such an item in the survey is that it was a collaborative project where country teams could include only a limited number of items. This leads to some challenges for our empirical analysis of migrants’ mechanical representation. First, while we can be certain that people who were 17 or younger in the year of the last election did not have the right to vote, the group of migrant non-voters can only proxy the actual group of unenfranchised migrants. This group might, in our specification, indeed contain foreign-born individuals that did have the right to vote but who decided not to use it. We thus risk conflating the effect of voluntary abstention with the effect of being disenfranchised when it comes to migrants’ mechanical representation.
To address such concerns, we estimated our preferences models, using the full sample, with an interaction effect of voting and foreign origin to understand whether our findings regarding preference differences between voters and migrant non-voters are importantly driven by voluntary abstention. However, this does not seem to be the case. As can be seen in Figure E.6 and Table E.5, the interaction effects between foreign-born and voting are minimal. The effect is only slightly significant for preferences in two out of nine policy issues (refugee status and medically assisted suicide – both of which do not figure as mechanically unmatched preferences in our results), which suggests that being foreign-born conditions preference differences similarly regardless of voting behavior. While this test suggests that our proxy should capture differences between migrants’ and voters’ preferences rather precisely, we acknowledge that it is not suitable as a way to explain variation in migrants’ preferences. This remains a limitation of our article, and we encourage future studies to assess more precisely how and why the interests of migrants might differ by enfranchisement status.
A second challenge relates to the fact that we only conducted our solidarity analyses in three rather than the full sample of 14 countries. While this decision was largely dictated by the collaborative nature of the survey project and question inclusion, it has implications for the generalizability of our findings regarding proxy representation via the solidarity-mechanism. First, we note that the three countries are remarkably different in terms of geographical location (Southern, Western, and Northern Europe), their cultural/religious heritage, and their immigration and naturalization policies (the Netherlands being the most restrictive and Portugal having relatively liberal policies). At the same time, they are all relatively small countries, have a comparative demographic structure (their populations are ageing and will need to rely on immigration to prevent shrinking), and employ some form of proportional representation electoral system.
On the one hand, the countries’ diversity in terms of migration policies and histories provides meaningful variation for testing our theoretical expectations, especially regarding solidarity with migrants. On the other hand, the commonalities they share in terms of size, electoral systems, and demographic structure mean our findings may not straightforwardly extend to larger countries, majoritarian democracies, or nations with different demographies. For instance, as previous research indicates that majoritarian systems tend to correlate with lower levels of citizen-politician congruence and potentially larger group inequality (Ferland and Golder Reference Ferland and Golder2021), we could potentially expect even lower levels of solidarity. Respondents in countries with younger populations may also hold different views regarding young generations’ deservingness of political representation.
Relatedly, one might worry about the lower size of the politician samples in the three countries and their representativeness. In Norway, the Netherlands, and Portugal, only about a fourth of national politicians in each country participated in the survey. While the samples are, as shown in online Appendix A, fairly representative regarding the socio-economic background of respondents, right-wing politicians are clearly underrepresented. As right-wing orientation is highly negatively correlated with proxy representation by solidarity (see Table D.3), we might in fact overestimate politicians’ general willingness to engage in solidarity proxy representation.
To alleviate such concerns, we conducted an additional test for robustness and generalizability with larger samples of politicians in a different country than those in our main analysis: local representatives and political candidates in Finland. As can be seen in Figures E.7 and Table E.6, the results are quite similar to those of the national politician samples in the Netherlands, Norway, and Portugal. Finnish candidates and local politicians are more positive toward solidarity representation of youth, children, and future generations while the point estimate for migrants is clearly negative. Interestingly, the effect sizes are very similar to the findings from our main analysis. The larger sample sizes (N candidates = 483, N local politicians = 733) make our predictions more precise, and let us additionally estimate the effect of parties’ placement on an economic left-right as well as on a liberal-conservative scale. As the models in Table E.6 show, the latter is much more strongly correlated with willingness to proxy represent all three groups than economic left-right placement, which is an important indication of where ideological cleavages regarding enfranchisement discussions might emerge.
Conclusion
In this article, we made an empirical contribution to the scholarly debate on the ‘democratic boundary problem’ – the normative question of who should be included in the demos. Every demos is bounded, excluding certain groups from suffrage. Some boundaries are temporal, excluding the underaged or unborn; others are in effect spatial, excluding foreigners, whether resident or abroad. Political theorists have intensely debated whether, when, and why such exclusions are morally justifiable and what, if anything, should be done about it. A central question is whether the boundaries of the demos should expand to include all those affected by or subject to democratic decisions or remain as they are. One possible argument for maintaining current boundaries is that exclusion has little substantive effect, since outsiders’ interests are already represented by insiders via proxy representation. This could happen mechanically or by solidarity, through the choices of voters or politicians. If so, the ‘boundary problem’ may be less of a problem.
We set out to empirically explore this possibility. First, we argued that underaged citizens and non-naturalized migrants are clearly subjected to and affected by political decisions, and that the salience of these decisions is likely growing due to increased mobility and globalization and to the long time-horizon of matters such as housing and climate change. While none of the above groups has a direct possibility to authorize politicians and/or to hold them accountable for their decisions on these matters, we suggested that their interests might be taken into account indirectly by enfranchised (voting) citizens and politicians through proxy representation, either via mechanical representation or via some form of solidarity. If either of the two is true, enfranchisement would technically not be necessary to ensure a fair chance of substantive representation.
We then evaluated these conditions. First, we estimated whether and in which policy areas underage youth and migrant non-voters have different preferences than the general electorate and to what extent these are reflected by politicians. While incongruences are in sum moderate, our findings suggest that underage youths’ and migrants’ preferences tend to remain unmatched in exactly the areas where they have crystallized interests and may be affected differently by the respective policies. While the unmatched policy areas regarding the underage are ‘covered’ by young voters aged 18 to 25 years and might thus at least have some chance to be heard in the representative process, this is not the case for migrant non-voters. Their unmatched preferences also significantly differ from those of the voting members of their group. Second, we found that while both voters and elected representatives are generally willing to grant young generations’ interests representation equal to that of adult national citizens, this solidarity does not extend to migrants. Voters and representatives consider them clearly less deserving of equal representation – an effect that is significant and substantial across countries and parties.
Ironically, one policy where unenfranchised groups are both likely to have crystallized interests and will need to rely on solidarity by voters and representatives is precisely the question of enfranchisement. While our findings show the importance of enfranchising especially migrants, those same findings suggest that such a reform will be quite unpopular among both voters and politicians.
Our findings point a way forward for empirical researchers: More work will be necessary to assess precisely when, why, and how unenfranchised groups’ preferences differ from majority opinions as well as to pinpoint which factors contribute to higher or lower levels of congruence and proxy representation. Especially learning more about migrants’ political preferences – both those with and without citizenship – will require targeted data collection to arrive at representative samples of this growing segment of the population. Our findings also point a way forward for normative researchers. Knowing where the legally excluded are least likely to enjoy proxy inclusion helps sharpen the normative agenda for ‘boundary problem’ thinkers, pointing out what sort of boundary adjustments are the most morally urgent. In short, the ‘boundary problem’ is especially a normative problem with regard to migrants, whose interests and indeed whose inclusion get little proxy support.
Supplementary material
The supplementary material for this article can be found at https://doi.org/10.1017/S1475676526101443
Data availability statement
All (pseudonomized) data used for the statistical analyses in this article as well as the complete replication code will be published alongside the article.
Acknowledgements
We would like to thank the anonymous reviewers for thorough, encouraging, and very constructive feedback on previous versions of this manuscript. We would also like to thank participants of the 2025 Norwegian annual conference of political science who provided valuable feedback and suggestions.
Funding statement
Jana Belschner’s work on this article was funded by a Starting Grant from the Trond Mohn Foundation under grant number TMS2024STG02.
The data used in this article stem from the POLPOP project and was partly financed by an ERC Advanced Grant (POLEVPOP, ID: 101018105). POLPOP is an international collaboration examining elected politicians’ opinions, perceptions, and evaluations in thirteen countries. The project is led by Stefaan Walgrave (University of Antwerp) and supported by an ERC Advanced Grant (POLEVPOP, ID: 101018105). In Australia, the project is led by Patrick Dumont, Marija Taflaga, and Annika Werner (Australian National University), in Belgium (Flanders) by Stefaan Walgrave (University of Antwerp), in Francophone Belgium by Jean-Benoit Pilet and Nathalie Brack (Université Libre de Bruxelles), in Canada by Peter Loewen (University of Toronto) and Jack Lucas (University of Calgary), in the Czech Republic by Ondrej Cisar (Charles University Prague), in Denmark by Anne Rasmussen (University of Copenhagen), in Germany by Christian Breunig (University of Konstanz – supported by the DFG’s Excellence Strategy – EXC-2035/1-390681379) and Stefanie Bailer (University of Basel), in Israel by Lior Sheffer (Tel Aviv University) and Eran Amsalem (Hebrew University Jerusalem), in Luxembourg by Javier Olivera (Luxembourg Institute of Socio-Economic Research), in the Netherlands by Rens Vliegenthart (Wageningen University), and Marc Van de Wardt (Free University of Amsterdam), in Norway by Yvette Peters (University of Bergen), in Portugal by Miguel Pereira (University of Southern California) and Jorge Fernandes (University of Lisbon), in Sweden by Mikael Persson (University of Gothenburg), and in Switzerland by Fréderic Varone (University of Geneva) and Pirmin Bundi (University of Lausanne).
Competing interests
No competing interests to report.
Ethical statement
Ethical approval has been collected from institutional IRB boards for all surveys conducted in the countries included in the analysis.




 Open access

