

Appendix: Chapter 1 Corruption and GDP Growth
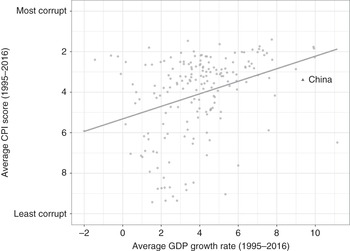
It is commonly asserted that China is an “outlier” in achieving rapid growth despite corruption. One example is an article in The Wall Street Journal (WSJ), which used a scatterplot of CPI scores and average GDP growth rates to illustrate that “corruption normally goes hand in hand with low growth – but China doesn’t fit that pattern.”Footnote 1 In fact, the figure in the WSJ makes the opposite point: corruption goes hand in hand with high growth.
Figure A1.1 updates the aforementioned figure with recent data of CPI scores of all countries plotted against their average growth rates from 1995 to 2016. As we can clearly see, more corrupt countries have higher GDP growth. This is not surprising, as corrupt countries tend to be low-income countries, which usually experience faster growth. In Figure A1.1, China’s corruption score falls below the regression line, which means that given its high growth rate, it was less corrupt than expected. The general correlation between corruption and poverty is measured by GDP per capita (see Chapter 1), not growth rates.
Updated replication of the WSJ’s scatterplot on corruption and growth rate.
As argued in the introduction, China is not anomalous in having corruption with high growth rates; rather, what makes it an outlier is that it has achieved a 40-year period of sustained economic expansion on a nearly unparalleled scale, despite moderately high levels of perceived corruption.
This example illustrates the necessity of being precise about what we mean both by corruption (see Chapter 2) and by growth. In fact, different measures of “growth” (GDP per capita, GDP growth rates, absolute GDP growth, and durability of high growth) correlate with corruption in dramatically different ways. In order to make sense of the Chinese paradox, we must first define the basic terms of our analysis.

 Open access