

1 INTRODUCTION
Data compression, issued from the field of information theory (Shannon Reference Shannon1948), is the practice of transforming a data file into a more compact representation of itself. Data compression increases the amount of data that can be stored on disk (or other storage medium), and helps reduce the time required to transmit data over a noisy network. It has been used to minimise the volume of astronomical data since the 1970s, and has continued to be developed and used ever since (e.g. Labrum, McLean, & Wild Reference Labrum, McLean and Wild1975; White & Percival Reference White, Percival and Stepp1994; Pence et al. Reference Pence, White, Greenfield, Tody, Manset, Veillet and Crabtree2000; Pence, Seaman, & White Reference Pence, Seaman, White, Evans, Accomazzi, Mink and Rots2011; Tomasi Reference Tomasi2016). Two main categories of compression exist: lossless and lossy compression. Lossless compression yields smaller compression ratios than lossy compression, but permits one to retrieve the exact original data after decompression. Lossy compression results in an approximation of the original data, requiring one to assess the decompressed data, but can still enable sound scientific analysis.
In recent years, ‘Big Data’ issues have become more prominent for large astronomical projects. The main characteristics of ‘Big Data’ are often described as volume, velocity, and variety (Wu & Chin Reference Wu and Chin2014). The volume refers to the amount of information that systems must ingest, process, and disseminate. The velocity refers to the speed at which information grows or disappears. Finally, the variety refers to the diversity of data sources and formats. While the variety of formats is generally represented by a limited set of options for a given sub-field [e.g. FITS (Wells, Greisen, & Harten Reference Wells, Greisen and Harten1981), HDF5 (Folk et al. Reference Folk, Heber, Koziol, Pourmal and Robinson2011)], the volume and velocity have a direct impact in modern astronomy.
Recently, a large collaboration of astronomers has been taking part in the Deeper Wider Faster (DWF) initiative (Cooke et al., in preparation)—a remote and time-critical observation programme. DWF is a coordinated multi-wavelength observing effort, that includes ≳ 20 facilities located worldwide and in space, which aims to identify, in near real-time, fast transient events on millisecond-to-hours timescales. Such events include Fast Radio Bursts (FRBs, Lorimer et al. Reference Lorimer, Bailes, McLaughlin, Narkevic and Crawford2007), Gamma-ray bursts (GRBs, Klebesadel, Strong, & Olson Reference Klebesadel, Strong and Olson1973), kilonovæ (Li & Paczyński Reference Li and Paczyński1998), and ultra-luminous X-Ray sources (Miller, Fabian, & Miller Reference Miller, Fabian and Miller2004).
To cover a wide range of wavelengths, DWF uses a variety of instruments including the Dark Energy Camera (DECam; Diehl & Dark Energy Surve Reference Diehl2012; Flaugher et al. Reference Flaugher, McLean, Ramsay and Takami2012, Reference Flaugher2015) installed at the Cerro Tololo Inter-American Observatory (CTIO), the Molonglo Observatory Synthesis Telescope (MOST), the NASA SWIFT Space Telescope, the Parkes observatory, the Antarctica Schmidt telescopes (AST3), the Gemini Observatory, Southern African Large Telescope (SALT), the Anglo-Australian Telescope (AAT), the SkyMapper telescope, the Zadko Telescope, the Rapid Eye Mount telescope (REM), and the Laser Interferometer Gravitational-Wave Observatories (LIGO). In the present paper, we focus our attention on DECam and its data products.
Data generated with DECam are of imposing size. DECam is composed of a mosaic of 70 coupled-charged devices (CCDs; Figure 1), including 62 science CCDs and 8 guide CCDs. Each science CCD is of dimension 4146 × 2160 pixels, while each guide CCD contains 2098 × 2160 pixels. A mosaic image is saved as a FITS file, where each pixel of an image is stored as a 32-bit integer (BITPIX). This result is a data file requiring ~1.2 gigabyte (GB) of storage space (pre-processing).
Example of a raw and uncalibrated mosaic image, as captured by the 62 science CCDs and 8 guides CCDs of DECam. Each science CCD is of dimension 4146 × 2160 pixels, while each guide CCD contains 2098 × 2160 pixels. Each pixel is encoded as a 32-bit integer, resulting to ~1.2 GB of storage space for the whole mosaic. Each CCD has two amplifiers, providing the ability to read the pixel arrays using either or both amplifiers. The uncalibrated image displays a split darker and lighter sides for each CCD, corresponding to the regions covered by each amplifier. The mosaic was visualised with SAOImage DS9 (Smithsonian Astrophysical Observat 2000) using the heat colour map. The blue masks and dashed lines highlight the size of a science and guide CCD, respectively.

During a DWF observation campaign (hereafter run), data files are acquired every 40 s from a continuous stream of 20-s exposures, each followed by a 20-s readout time provided by the DECam electronics. This observing cadence, and the high sensitivity of DECam, enables the DWF campaign to search for fast transients, while maintaining survey depth and time on sky. Each field is observed simultaneously for 1 to 2 h per night by several observatories, as a result of field constraints imposed by the coincident visibility of DECam in Chile and Parkes and Molonglo in Australia. As a result, around 100 to 200 DECam optical images are acquired per field per night during a run (and three to seven fields per night).
To search for transient candidates in near real-time requires computational power that exceeds what is currently available on-site at CTIO. In this context, data files constantly need to be transmitted to a suitable location for post-processing, source finding, visualisation, and analysis (Meade et al. Reference Meade2017, Andreoni et al. Reference Andreoni, Jacobs, Hegarty, Pritchard, Cooke and Ryder2017). The Green II supercomputerFootnote 1 at Swinburne University of Technology in Australia provides the computational power necessary for the main DWF goals. However, transmission of large amount of raw data from CTIO to Australia, where our group is located, represents a major bottleneck. To accelerate this process, we integrate data compression as part of the science pipeline. To maximise our gain in transmission time, we choose to use lossy compression—keeping in mind that raw data is archived and can be evaluated at a later time.
1.1. JPEG2000 and lossy data compression
Several lossy compression techniques have been proposed for astronomical images over the years. These include compression techniques based on Rice compression (Pence, White, & Seaman Reference Pence, White and Seaman2010), low-rank matrix decomposition for movie data (Morii et al. Reference Morii, Ikeda, Sako and Ohsawa2017), discrete cosine transform (Brueckner et al. Reference Brueckner1995; Belmon Reference Belmon1998; Vohl Reference Vohl2013), and discrete wavelet transform (Belmon et al. Reference Belmon, Benoit-Cattin, Baskurt and Bougeret2002).
In this work, we consider the JPEG2000 (ISO/IEC 15444) standards (part 1; ISO/IEC 15444-1:2000 2000) which offer lossy compression for both integer and real data. JPEG2000 compression is applied as a stream of processing steps that includes pre-processing (tiling, level offset), wavelet transformFootnote
2
, quantisation, entropy coding [via adaptive arithmetic coding (Rissanen & Langdon Reference Rissanen and Langdon1979)], rate control, and data ordering (Figure 2). A low-level description of the standards, its algorithms, and their related mathematics is beyond the scope of this paper. Instead, we refer the reader to the JPEG2000 specification documentation and other related papers (e.g. ISO/IEC 15444-1:2000 2000; Rabbani & Joshi Reference Rabbani and Joshi2002; Li Reference Li2003). To evaluate the amount of storage space saved by compression, we use the concept of compression ratio. We define the compression ratio ( $\#$
:1) as
$\#$
:1) as
 $$\begin{equation}
\# = \frac{\text{size}_{\text{o}}}{\text{size}_{\text{c}}},
\end{equation}$$
$$\begin{equation}
\# = \frac{\text{size}_{\text{o}}}{\text{size}_{\text{c}}},
\end{equation}$$
where sizeo is size of the original file and sizec the size of the compressed file.
JPEG2000 compression is applied as a stream of processing steps based on the discrete wavelet transform, scalar quantisation, context modelling, entropy coding, and post-compression rate allocation [adapted from Kitaeff et al. (Reference Kitaeff, Cannon, Wicenec and Taubman2015)].

Recent investigations of lossy JPEG2000 compression for astronomical images (Peters & Kitaeff Reference Peters and Kitaeff2014; Kitaeff et al. Reference Kitaeff, Cannon, Wicenec and Taubman2015; Vohl, Fluke, & Vernardos Reference Vohl, Fluke and Vernardos2015) show that it can lend high factors of compression while preserving scientifically important information in the data. For example, Peters & Kitaeff (Reference Peters and Kitaeff2014) compressed synthetic radio astronomy data at several levels of compression, and evaluated how the loss affects the process of source finding. In this case, it was shown that the strongest sources (2 000 mJy km s−1 and higher) could still be retrieved at extremely high compression ratio, where the compressed file would be more than 15 000 times smaller than the original file. When using a high quantisation step (compression ratio of about 90:1), low integrated flux sources (less than 800 mJy km s−1) were still identified.
To date however, no study has investigated the effect of lossy JPEG2000 on the process of transient finding, and no study has been conducted to evaluate its potential to accelerate data transmission in time-critical observation scenarios. In this paper, we report on the evaluation of lossy JPEG2000 as part of DWF.
The remaining of the paper is structured as follows. Section 2 presents a brief overview of the DWF science pipeline along with information about previous observation runs. Section 3 describes the compression software used for the experiments, and the rationale behind its custom design. Section 4 investigates the effect of lossy JPEG2000 on the DWF science pipeline. In particular, Section 4.1 presents the methodology and experimental results, evaluating the effect of compression on finding transient through the DWF science pipeline. Section 4.2 presents compression, decompression, and transmission timing results obtained during DWF observation runs. Finally, Section 5 discusses the results and their implications, while Section 6 concludes and presents future work.
2 BRIEF OVERVIEW OF THE DWF SCIENCE PIPELINE
To date, DWF has seen a total of five observation runs, two pilot runs, and three operational runs—refining the overall practices each time. The two pilot runs occurred during 2015 January and February, respectively (pilot-1 and 2). Since then, three operational runs occurred from 2015 December 17–22 UT (O1), 2016 July 26 to 2016 August 7 UT (O2), and 2017 February 2–7 UT (O3). The grand lines of the science pipeline are as follows. For detailed descriptions of the many DWF components, we refer the reader to Meade et al. (Reference Meade2017), Andreoni et al. (under review), and Cooke et al. (in preparation).
During the operational time of typical DWF run, following three main steps are continuously being repeated for the optical data gathered by DECam:
-
1. Data collection and transfer
-
a. Images are acquired with DECam and saved as FITS files.
-
b. Each image is compressed to JPEG2000 and packaged to TAR.
-
c. Each TAR is transferred to the Green II supercomputer.
-
d. Each TAR is unpacked, and each resulting image is decompressed.
-
-
2. Initial processing
-
a. Individual CCD images are calibrated using parts of the PhotPipe pipeline (Rest et al. Reference Rest2005).
-
b. Image coaddition, alignment, and subtraction is performed using the Mary pipeline (Andreoni et al. Reference Andreoni, Jacobs, Hegarty, Pritchard, Cooke and Ryder2017).
-
c. Mary generates a catalogue of possible transients, along with other data products (e.g. region files, small ‘postage stamp’ images, light curves, etc.).
-
-
3. Visual inspection
-
a. Visual analytics of potential candidates is performed by a group of experts and trained amateurs using an advanced visualisation facility (see Meade et al. Reference Meade2017) and an online platform (database and other visualisation tools)Footnote 3 .
-
b. Provided that an interesting candidate is identified with sufficient confidence, a trigger is sent to the other telescopes for follow-up.
-
We note that steps 1b and 1c are executed in parallel, typically for about four files at a time on the observer’s computer at CTIO. Similarly, the step 1D, and the initial processing steps are executed in parallel for as many CCDs as possible on reserved computing nodes of the SwinSTARFootnote 4 component of the Green II supercomputer.
3 SOFTWARE DESIGN RATIONALE
In the time-critical scenario of DWF, a gain in transmission time offered by data compression is only interesting if compression and decompression can be achieved quickly. To this end, Vohl et al. (Reference Vohl, Fluke and Vernardos2015) demonstrated that KERLUMPH Footnote 5 —a multi-threaded implementation of the JPEG2000 standard—can compress and decompress large files quickly.
For a sample of 1 224 files, KERLUMPH achieved both compression and decompression of a 400 megabyte (MB) binary file in less than 10 s, with median and mean time under 3 s using the Green II supercomputer. The tests on Green II were performed using Linux (CentOS release 6.6) running on SGI C2110G-RP5 nodes—one node at a time—containing two eight-core SandyBridge processors at 2.2 GHz, where each processor is 64-bit 95W Intel Xeon E5-2660.
We modified KERLUMPH to specifically compress the FITS files from DECam into JPEG2000. In addition of allowing the compression of FITS files, we customised the compression pathway to modify the input file in a number of ways (Figure 3). At compression, the multi-extension FITS file of DECam is lossily compressed into multiple JPEG2000 files (one per extension)—merging its specific extension header with the primary header. The rationale behind this decision is to simplify parallel processing in the next steps of the pipeline.
Compression procedure schematic diagram. The multi-extension FITS file from DECam is lossily compressed into multiple JPEG2000 (one per extension), and then grouped together into a TAR file ready for transmission. Note that the primary header is merged with the extension header.

To avoid having to send ~60 individual files over the internet, we group them together into a single TAR fileFootnote 6 before transmission. To save extra space, we do not include information relative to guide CCDs. Moreover, at the time of observation, two CCDs (at position S2 and N30) were not working and the amplifier of another CCD (S26) had a defect leading to difficult calibration. The cumulated raw data of these CCDs represents ~100 MB that would need to be compressed and transmitted, to be eventually left out of the analysis. We therefore decided to discard these extensions for the near real-time analysis.
At decompression (Figure 4), the software recreates the FITS file using the cfitsio library—as several of the subsequent processing steps, many using standard ‘off-the-shelf’ available tools, do not yet support JPEG2000. The recreation of the FITS file enables us to proceed with the pre-processing required by PhotPipe. During this phase, we add and modify specific keywords in the header, avoiding the slow procedure of updating the FITS header further down in the pipeline (see Appendix A for more details).
Decompression procedure schematic diagram. The TAR file is expanded to recover all JPEG2000 files; each of them is then decompressed into a single extension FITS file. Each FITS file corresponds to a given extension of the original file, where the primary header contains the merged information of the original primary header and the current extension header.

Similar to the original version of KERLUMPH, the modified version allows setting and modifying JPEG2000 compression parameters (Part 1, shown in Table 1). This capability includes the coefficient quantisation step size (Qstep)—which is used to discretise the wavelet coefficient values—and the number of wavelet transform levels (Clevels) used to influence the wavelet domain before quantisation and encoding (Clark Reference Clark2008). In addition, it is possible to specify a target bit-rate parameter (rate) to set an upper limit on the output storage size. This is done via the post-compression rate allocation, in which the compressed blocks are passed over to the Rate Control unit. The unit determines how many bits of the embedded bit stream of each block should be truncated to achieve the target bit rate—aiming to minimise distortion while still reaching the target bit-rate (Kitaeff et al. Reference Kitaeff, Cannon, Wicenec and Taubman2015).
Parameters in Part 1 of the JPEG2000 Standard, ordered as encountered in the encoder. The only parameter for which the default value is modified during an observation run is highlighted.

Peters & Kitaeff (Reference Peters and Kitaeff2014) show that the code block size and precincts size had no effect on both compression and soundness of their spectral cube data. Therefore, we have bypassed these parameters for this evaluation. Vohl et al. (Reference Vohl, Fluke and Vernardos2015) show that the combined use of Qstep and a high Clevels value can increase the compression ratio while preserving a similar root-mean-squared-error, as the wavelet decomposition levels increase for a similar quantisation step size. However, we do not increase Clevels from the default value of 5 in the context of DWF. An increased Clevels value requires a larger amount of random access memory—as more level of wavelet decomposition are being processed—which would penalise us while we aim to reduce the weight of the compression on the overall computation at CTIO.
4 EFFECT OF LOSSY JPEG2000 ON THE DWF SCIENCE PIPELINE
In this section, we evaluate the effect of using lossy JPEG2000 as part of the DWF science pipeline. In particular, we present an experiment evaluating how the different levels of compression affect the process of transient finding with the DWF science pipeline. Finally, we report on transmission time recorded during the O2 and O3 run.
4.1. Effect on transient search
While we note that all raw data for DWF is archived and can be evaluated at a later time, it is nevertheless important to evaluate how lossy JPEG2000 affects the process of finding transients for the near real-time analysis. As DWF uses a custom pipeline, we use it integrally in this experiment. We refer the reader to Andreoni et al. (Reference Andreoni, Jacobs, Hegarty, Pritchard, Cooke and Ryder2017) for details on the Mary pipeline, based on image subtraction techniques, and its candidate selection parameters. Furthermore, to provide a realistic case study (e.g. instrumental noise characteristics), we use raw images obtained with DECam during the DWF O2 run as the starting point of the experiment. The results of this study finds no significant loss of transient detection at all brightnesses relevant to the DWF survey to compression ratios ~25:1.
4.1.1. Methodology
We select three raw FITS images from DECam obtained on 2016-08-02, between 09:22:05 UTC and 09:42:08 UTC (post exposure time). While it would be possible to identify transients within these images directly, it would also be a difficult task to assess their reliability and intrinsic parameters—a task that we reserve for future DWF papers. Instead, we manually inject artificial transient sources for which we know the characteristics in advance (e.g. flux, position, point spread function). We set the range of injected sources between magnitudes 17 (brightest) to 26 (faintest) to probe the detection limits of the survey—which is expected to have a minimum source detection magnitude of ~22.3–22.5 for these images.
All three images are used as a set for transient detection. In addition, an image taken on 2016-07-28 and processed using the DECam Community Pipeline (Valdes, Gruendl, & DES Project Reference Valdes, Gruendl, Manset and Forshay2014) is used as template. Transients are added to every image in the set. For each CCD in the set, we inject 273 sources (2D gaussian) drawn from a uniform distribution of magnitudes. The range is split into bins of 0.1 mag, corresponding to threes sources per magnitude bin. Sources locations are allocated randomly, while avoiding a 75-pixel border around the edge of the CCD—to avoid being cropped out during the alignment process. Sky coordinates are preserved throughout all images (e.g. a given source is found at the same location in all images). Sources are generated using the make_gaussian_sources function of the photutils package (Bradley et al. Reference Bradley2016), an affiliated package of astropy (Astropy Collaboration et al. 2013).
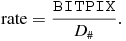
Each image is compressed at several fixed compression ratio, ranging from 5:1 to 100:1, with a step of 5. To do so, we set the ‘rate’ parameter to the ratio between the original BITPIX value of the 32-bit image to the desired compression ratio ( $D_{\#} \in [5, 10, 15, ..., 90, 95, 100]$
):
$D_{\#} \in [5, 10, 15, ..., 90, 95, 100]$
):
 $$\begin{equation}
\text{rate} = \frac{{\tt BITPIX}}{D_{\#}}.
\end{equation}$$
$$\begin{equation}
\text{rate} = \frac{{\tt BITPIX}}{D_{\#}}.
\end{equation}$$
For each level of compression, we proceed with the initial processing steps of the pipeline (Section 2). The three images in the set are calibrated, aligned, and coadded (image stacking) to better detect the transients, and to eliminate cosmic rays—reflecting a transient lasting longer than three images worth of time (about 120 s). The stacked image is used for difference imaging with the template image. Finally, we cross-match the Mary pipeline’s candidate list with the list of positions for the injected sources. In this context, we define the transient finding completeness $c_{\#}$
for compression ratio
$c_{\#}$
for compression ratio $\#$
:1 as
$\#$
:1 as
 $$\begin{equation}
c_{\#} = \frac{N_{\text{M},\#}}{N_{\text{I}}},
\end{equation}$$
$$\begin{equation}
c_{\#} = \frac{N_{\text{M},\#}}{N_{\text{I}}},
\end{equation}$$
where $N_{M,\#}$
is the number of sources found by Mary for a file compressed at a ratio of #:1, and N
I
is the number of transients injected. We normalise
$N_{M,\#}$
is the number of sources found by Mary for a file compressed at a ratio of #:1, and N
I
is the number of transients injected. We normalise $c_{\#}$
by comparing it to the completeness obtained with the original data c
1 (never compressed) to avoid reporting biases incoming from the source finder that are unrelated to this work. Therefore, we report the normalised completeness
$c_{\#}$
by comparing it to the completeness obtained with the original data c
1 (never compressed) to avoid reporting biases incoming from the source finder that are unrelated to this work. Therefore, we report the normalised completeness $\mathcal {C}_{\#}$
for compression ratio #:1 as
$\mathcal {C}_{\#}$
for compression ratio #:1 as
 $$\begin{equation}
\mathcal {C}_{\#} = \frac{c_{\#}}{c_{1}}.
\end{equation}$$
$$\begin{equation}
\mathcal {C}_{\#} = \frac{c_{\#}}{c_{1}}.
\end{equation}$$
An overview of the different steps of the experiment is shown in Figure 5.
Schematic diagram of the experiment setup. Three images taken at different epochs form a set. Transients are added to each image of the set, using the same sky coordinates in all three images. Images of the set are coadded (median stacking) to better detect the transients, and to eliminate cosmic rays—reflecting a transient lasting longer than three images worth of time (about 120 s). Difference imaging is then applied between the stacked image and a template image, resulting in a residual image. Transient detection is applied on the residual image using the Mary pipeline, which outputs a transient candidates list. This list is cross-matched with the list of injected sources to evaluate the completeness. We note that a loss in completeness will naturally occur when sources fall onto bright sources, making its detection difficult or impossible.

4.1.2. Results
Figure 6 shows the normalised completeness as a function of magnitude for the different compression ratios. The four panels split the compression ratios into groups of five (i.e. the first panel shows results for compression between 5:1 and 25:1 inclusively, the second panel shows results between 30:1 to 50:1, and so on). Results are limited to cases where a completeness ⩾0.5 was found by the Mary pipeline for the original data (never compressed)—which eliminates data below our detection threshold (i.e. down to source magnitudes of ~22.5).
Normalised completeness as a function of magnitude for all evaluated compression ratio [Equation (4)]. A normalised completeness of 10° indicates no difference in transient finding results between the compressed and never-compressed data. Results above and below this line show that compression affected the findings positively or negatively, respectively. Results are limited to cases where completeness on original data was ⩾0.5 (i.e. down to magnitude ~22.5).

A normalised completeness of 1.0 indicates that compression had no effect on the process of finding transients compared to working with original data (never compressed). Results above and below this line show that compression affected the findings positively (more transients were correctly identified) or negatively (less transients were identified), respectively.
As expected, as the compression ratio increases, the number of sources missed by the source finder also increases. In general, fainter sources are more affected by compression than brighter sources, while the brightest sources are the least affected overall. This is noticeable when comparing the slopes of the distributions, increasing in steepness as the compression ratio increases. We find that compression up to about ~25:1 has a negligible effect on the process of finding transients, and only a small affect for the faintest magnitude. This result can be further confirmed by looking at the mean normalised completeness.
Figure 7 shows the mean normalised completeness as a function of compression ratio. In addition, the error bars indicate the 95% confidence interval, defined as
 $$\begin{equation}
\epsilon = \frac{2\sigma }{\sqrt{N}},
\end{equation}$$
$$\begin{equation}
\epsilon = \frac{2\sigma }{\sqrt{N}},
\end{equation}$$
where σ is the standard deviation, and N is the number of sources used to evaluate the normalised completeness. The black markers show the overall mean value per compression ratio. Results show that a compression up to 35:1 provides on average a normalised completenesses ⩾95%, and ⩾90% for a compression ratio up to 40:1.
Mean normalised completeness and 95% confidence interval as a function of compression ratio. Results are limited to cases where completeness on original data was ⩾0.5.

Figure 7 also shows the mean normalised completeness for three magnitudes ranges. Specifically, the red markers indicate the mean for magnitudes between 17 and 19, the green markers for magnitudes between 19 and 21, and the blue markers for magnitudes between 21 and 23. Breaking down magnitude range this way highlights how bright sources (mag = 17–19) are less affected by compression than the faintest sources (mag = 21–23), where the mean normalised completeness decreases faster for fainter sources. In all cases, however, results show that a relatively high compression ratio of 30:1 has minimal impact on source finding, where sources of magnitudes between 21 and 23 show a mean normalised completeness >95% in the DECam images as compared to source identification in non-compressed data.
Another concern is that the time savings gained due to the usage of lossy compression may be diminished if a significant number of false positives sources are detected (requiring human validation) compared to our fiducial baseline. From this experiment, we find the total number of identified sources to be within ≲5–8% of those found without compression at compression ratios of ≲35:1, and an increase up to <20% at higher compression ratios. Furthermore, during an observation run, the behaviour of the transients will further ‘clean’ the data of any false positive detection from compression. DWF only triggers other telescopes on transient sources with ~30 min to h duration. Therefore, a transient must be detected in multiple images (more than three images) to be considered a true candidate by the campaign.
From these results, we estimate that utilising lossy JPEG2000 compression with a compression ratio up to 25:1 enables the DWF team to efficiently retrieve transient sources within the detection limits of the survey without significant loss. These results are in agreement with those obtained by Peters & Kitaeff (Reference Peters and Kitaeff2014).
4.2. Timing
In this section, we evaluate how compression accelerates data transmission from CTIO (Chile) to the Green II supercomputer (Australia). We evaluate the speed-up factor in data transfer time, in addition to compression and decompression time. Timing data was recorded for a total of 13 081 files during the O2 (year 2016) and O3 (year 2017) observation runs. We find that the speed-up factor in transfer time outweigh the compression and decompression time—validating the decision of integrating lossy data compression as part of our pipeline.
4.2.1. Estimation of the data transfer acceleration
For each file transferred (using the unix command scp), we record the size of the compressed file and the transfer time. From these two measures, we evaluate the compression ratio as defined by Equation (1), where sizeo is equal to 1 184 MB. We also evaluate the transfer rate, defined as
 $$\begin{equation}
r = \frac{\text{size}_{\text{c}}}{t},
\end{equation}$$
$$\begin{equation}
r = \frac{\text{size}_{\text{c}}}{t},
\end{equation}$$
where sizec is the size of the compressed file (MB), t is the transfer time (s) of the compressed file, and r is the transfer rate (MB s−1). The compression ratio, transfer time, and transfer rate distributions for each day of the O2 and O3 observation runs are provided in Figure 8. Compression ratio was varied by the team during each run to provide data with visual quality as high as possible, while providing fast enough transfer time. As the transfer rate varies during an observation run, we proceed with the following method to evaluate the speed-up factor provided by compression.
Box and whiskers plot showing distributions of transfer rate (MB s−1, top panel), transfer time (s, central panel), and compression ratio (:1, bottom panel) obtained during each day of the O2 (2016) and O3 (2017) runs. The median (line) is within the box bounded by the first and third quartiles range ( $\mathtt {IQR}$
=
$\mathtt {IQR}$
= $\mathtt {Q3}-\mathtt {Q1}$
). The whiskers are
$\mathtt {Q3}-\mathtt {Q1}$
). The whiskers are $\mathtt {Q1-1.5 \times IQR}$
and
$\mathtt {Q1-1.5 \times IQR}$
and $\mathtt {Q3+1.5 \times IQR}$
. Beyond the whiskers, values are considered outliers and are plotted as diamonds. We note that transfer rate varied greatly from day to day. Compression ratio was varied by the team during each run to provide data with visual quality as high as possible, while providing fast enough transfer time.
$\mathtt {Q3+1.5 \times IQR}$
. Beyond the whiskers, values are considered outliers and are plotted as diamonds. We note that transfer rate varied greatly from day to day. Compression ratio was varied by the team during each run to provide data with visual quality as high as possible, while providing fast enough transfer time.

For each transferred file, we estimate the transfer time $\hat{t}$
(s) that would have been required without compression, assuming the transfer rate at the time of transmission:
$\hat{t}$
(s) that would have been required without compression, assuming the transfer rate at the time of transmission:
 $$\begin{equation}
\hat{t} = \frac{\text{size}_{\text{o}}}{r}.
\end{equation}$$
$$\begin{equation}
\hat{t} = \frac{\text{size}_{\text{o}}}{r}.
\end{equation}$$
Using $\hat{t}$
, we estimate the speed-up factor
$\hat{t}$
, we estimate the speed-up factor $\hat{s}$
for a given file, defined as
$\hat{s}$
for a given file, defined as
 $$\begin{equation}
\hat{s} = \frac{\hat{t}}{t},
\end{equation}$$
$$\begin{equation}
\hat{s} = \frac{\hat{t}}{t},
\end{equation}$$
Similarly, we estimate the saved transmission time $\hat{\theta }$
(s) for this file:
$\hat{\theta }$
(s) for this file:
 $$\begin{equation}
\hat{\theta } = \hat{t} - t.
\end{equation}$$
$$\begin{equation}
\hat{\theta } = \hat{t} - t.
\end{equation}$$
Figure 9 shows the mean estimated speed-up factor $\hat{s}$
and 95% confidence interval [Equation (5)] as a function of compression ratio. The summary of results obtained during the O2 and O3 runs are shown in Table 2. From these results, we note a linear relation between compression ratio and the estimated speed-up factor. During the two observation runs evaluated (O2 and O3), we obtained a mean compression ratio of 13:1 (targeted ‘on-the-fly’ by the team), which provided a mean estimated speed-up factor of 13.04—equivalent to an estimated 14.60 min saved per file transfer.
$\hat{s}$
and 95% confidence interval [Equation (5)] as a function of compression ratio. The summary of results obtained during the O2 and O3 runs are shown in Table 2. From these results, we note a linear relation between compression ratio and the estimated speed-up factor. During the two observation runs evaluated (O2 and O3), we obtained a mean compression ratio of 13:1 (targeted ‘on-the-fly’ by the team), which provided a mean estimated speed-up factor of 13.04—equivalent to an estimated 14.60 min saved per file transfer.
Mean estimated speed-up factor ( $\hat{s}$
) and 95% confidence interval as a function of compression ratio for 13 081 files transferred during the O2 run (2016) and O3 run (2017).
$\hat{s}$
) and 95% confidence interval as a function of compression ratio for 13 081 files transferred during the O2 run (2016) and O3 run (2017).

Summary of transmission timing results for the combined (Both) and individual (O2, O3) observation runs. Columns show compression ratio (#), transfer rate (r), estimated speed-up factor ( $\hat{s}$
), and estimated transfer time saved (
$\hat{s}$
), and estimated transfer time saved ( $\hat{\theta }$
). Rows show minimum, maximum, mean, median, and standard deviation of the distribution.
$\hat{\theta }$
). Rows show minimum, maximum, mean, median, and standard deviation of the distribution.

4.2.2. Compression and decompression time
We also recorded the time required to compress the data at CTIO during both runs. Compression was performed on the observer computer at CTIO. The computer includes an ASUS P6X58D LGA 1366 motherboard with 24 GB of DDR3 1600 memory, an i7-950 quad core processor in the LGA 1366 form factor, and 3 TB of hard disk drive (HDD) for storage. We note that compression is only one of many processes running on the observer computer—where it is common to have multiple internet browser windows opened onto SISPIFootnote 7 (the DECam software), weather stations, etc., in addition to any other software used by the observer. We obtain a mean, median, minimum, and maximum compression time of 42.49, 37.75, 33.27, and 84.81 s, respectively, with a standard deviation of 9.95 s.
Decompression is performed on the Green II supercomputer. Contrary to the experiment performed by Vohl et al. (Reference Vohl, Fluke and Vernardos2015)—which proceeded with decompression on the Lustre File SystemFootnote 8 directly—we perform the decompression via the local storage of Green II (using PBS_JOBFS) to obtain fast read and write access to HDD storage. We obtain a mean and median of 1.82 s, minimum of 1.57 s, and maximum of 1.86 s, with a standard deviation of 0.03 s. This timing represents the decompression of a single CCD. Therefore, one needs to cumulate the time for all the 57 CCDs. However, as this is performed in parallel on Green II , this cumulated time does not reflect user wait time.
5 DISCUSSION
For projects dealing with very large datasets, a perfect scenario would be that all data processing would be done on site at the data acquisition location, with minimal data movement. However, as it is still common for international teams to post-process their data on local computing and supercomputing resources, the need to transfer data is unlikely to be removed completely on short timescale. In this context, lossy compression provides faster data transfer to execute science otherwise not possible in fast targeted timescales, including the near real-time data processing required for the DWF survey.
While the addition of lossy compression to the science pipeline of DWF introduces an additional need for care by the team, the discovery of potential transients, including supernova shock breakouts, off-axis GRBs, counterparts to FRBs and gravitational waves, and other highly sought-after sources, along with flare stars, cataclysmic variables, X-ray binaries, etc., highlight its ability to accelerate discovery in time-critical scenarios.
As the steps between data acquisition and transient confirmation are dependent on one another, the transfer time speed-up factor provided by data compression reduces the overall time before a trigger can be sent to other observatories. Further comparative investigation of the process of transient finding—comparing results obtained with and without lossy compression—should provide insights on the necessity of using raw data.
During run O2 and O3, file transfer to Australia was faster than the rate in which the data could be processed using the version of the reduction pipeline used at that time. Hence, the compression ratio was manually set by a member of the observatory team at CTIO, using the Qstep parameter in order to regulate transfer time. Regulation considered current empirical internet speeds and data processing status in Australia. Doing so, creates data with the highest visual quality as possible, while providing the necessary fast transfer time. During O2 and O3, the team aimed for transfer time ~1–2 min. A compression ratio ⩽20:1 was judged to be a comfortable upper limit for transfer time, and a safe choice in term of loss and visual quality.
The timing results show however that transfer rates can vary significantly during an observation run, and hence, the compression ratio is not the only factor that influences the total transfer time. Future work should evaluate methods to automatise the compression parameters selection (e.g. Qstep, CLevels) to provide the minimal loss for a targeted bit rate selected for a targeted optimal transfer time (based on criteria defined by the team). Future investigation to further accelerate data transmission should consider tracking individual packet transmission to identify bottlenecks.
6 CONCLUSIONS AND FUTURE WORK
When considering the three Vs of ‘Big Data’ (variety, volume, velocity), volume and velocity have a direct impact on modern astronomy endeavours, such as time domain science. In recent years, the DWF initiative—a collaborative, remote, and time-critical observation programme—has been detecting and identifying, in near real-time, fast transient events on millisecond-to-hours timescales using DECam and ~20 other telescopes. Data files generated with DECam are large (~1.2 GB per FITS file) and the high volume of short-exposure images provide data of imposing size.
To search for transient candidates in near real-time imposes computational requirements exceeding the processing capacity available on-site at the observatory in Chile. Instead, data files need to be constantly transmitted to the Green II supercomputer in Australia for post-processing, source finding, visualisation, and analysis. To reduce the stress imposed by the transmission of large amount of raw data, we integrate lossy data compression as part of the science pipeline—keeping in mind that raw data is archived and can be evaluated at a later time.
In this paper, we present an evaluation of the impact of lossy JPEG2000 on the DWF pipeline. In particular, we estimate that the compression ratio is linearly related to the speed-up factor. In particular, the average measured file compression ratio of ~13:1 during two DWF observation runs, resulted in a mean estimated speed-up factor of 13.04. In addition, we find that the speed-up factor outweighs the added compression and decompression time.
We also presented an experiment evaluating the impact of lossy JPEG2000 on the process of finding transient sources. We find that utilising compression ratios up to 30:1 will enable transient source detection to the detection limits of the survey with negligible efficiency losses, and ~10–15 min saved per file transfer—enabling rapid transient science that would otherwise not be possible. These results validate the choice of integrating lossy data compression to accelerate the overall DWF scientific pipeline.
ACKNOWLEDGEMENTS
This research was undertaken with the assistance of resources provided by the Green II supercomputer through the ASTAC scheme supported by the Australian Government’s Education Investment Fund. We thank Tim Abbott for providing the hardware information for the observer’s computer at CTIO. DV thanks George Bekiaris, Christopher J. Fluke, and Amr H. Hassan for valuable discussions during the development of the KERLUMPH software, and the Fonds de recherche du Quèbec – Nature et technologies (FRQNT) and Swinburne Research for postgraduate scholarships. Research support to IA is provided by the Australian Astronomical Observatory. JC acknowledges support of this research by the ARC Future Fellowship grant FT130101219. Parts of this research were conducted by the Australian Research Council Centre of Excellence for All-sky Astrophysics (CAASTRO), through project number CE110001020. Parts of this research were conducted by the Australian Research Council Centre of Excellence for Gravitational Wave Discovery (OzGrav), through project number CE170100004.
A DETAILS OF FITS HEADER MODIFICATIONS
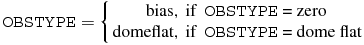
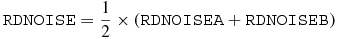
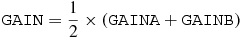
We modify the OBSTYPE value following equation (A1), and add three keywords based on the current header’s content: RDNOISE, GAIN, and SATURATE. The definitions of these keywords are expressed in Equations (A2)–(A4).
 $$\begin{equation}
\texttt {OBSTYPE} = \left\lbrace \begin{array}{rl}\text{bias}, &\mbox{\text{if } \texttt {OBSTYPE} = \text{zero}} \\
\text{domeflat}, &\mbox{\text{if } \texttt {OBSTYPE} = \text{dome flat}} \end{array} \right.
\end{equation}$$
$$\begin{equation}
\texttt {OBSTYPE} = \left\lbrace \begin{array}{rl}\text{bias}, &\mbox{\text{if } \texttt {OBSTYPE} = \text{zero}} \\
\text{domeflat}, &\mbox{\text{if } \texttt {OBSTYPE} = \text{dome flat}} \end{array} \right.
\end{equation}$$
 $$\begin{equation}
\texttt {RDNOISE} = \frac{1}{2}\times (\texttt {RDNOISEA} + \texttt {RDNOISEB})
\end{equation}$$
$$\begin{equation}
\texttt {RDNOISE} = \frac{1}{2}\times (\texttt {RDNOISEA} + \texttt {RDNOISEB})
\end{equation}$$
 $$\begin{equation}
\texttt {GAIN} = \frac{1}{2}\times (\texttt {GAINA} + \texttt {GAINB})
\end{equation}$$
$$\begin{equation}
\texttt {GAIN} = \frac{1}{2}\times (\texttt {GAINA} + \texttt {GAINB})
\end{equation}$$
 $$\begin{equation}
\texttt {SATURATE} = \text{min}(\texttt {SATURATA}, \texttt {SATURATB})
\end{equation}$$
$$\begin{equation}
\texttt {SATURATE} = \text{min}(\texttt {SATURATA}, \texttt {SATURATB})
\end{equation}$$


