

1. Introduction
The Arctic has warmed at twice the global average over the past 50 years, meaning that its glaciers and ice caps are undergoing rapid change and they will contribute an estimated 19–25 cm to sea level rise by 2100 (SWIPA, 2017). The Russian High Arctic (RHA) has a glaciated area of ~52 000 km2 (Millan and others, Reference Millan, Mouginot, Rabatel and Morlighem2022) and lost over 1000 Gt of ice between 1961 and 2016, equating to ~3 mm of sea level rise (Zemp and others, Reference Zemp2019). The RHA accounts for approximately 11% of glacial ice globally, excluding the ice sheets (Dowdeswell and others, Reference Dowdeswell and Williams1997; Radić and others, Reference Radić2014; Millan and others, Reference Millan, Mouginot, Rabatel and Morlighem2022), making it a major ice reservoir and key area for studying the impacts of climate change on the Arctic cryosphere. Globally, the RHA is a major source of glacial loss since, contributing 10.6 ± 1.7 Gt a−1 to sea level between 2002 and 2016 (Wouters and others, Reference Wouters, Gardner and Moholdt2019). During the 21st century, the RHA is forecast to lose between 21 ± 11% (RCP2.6) and 43 ± 11% of its mass (RCP8.5), relative to 2015 (Rounce and others, Reference Rounce2023), and is projected to contribute between 14 ± 10 (Rounce and others, Reference Rounce2023) and 26 ± 10 mm (Marzeion and others, Reference Marzeion2020) to sea level rise by 2010, under the RCP8.5 scenario. Furthermore, the Barents Sea has been identified as a key area of oceanic warming (Lind and others, Reference Lind, Ingvaldsen and Furevik2018), sea ice decline and air temperature increases (Tepes and others, Reference Tepes, Nienow and Gourmelen2021b), with January 2016 temperature anomalies reaching 7 °C above the 1981–2010 mean (SWIPA, 2017). Thus, it is vital to quantify the contribution of the RHA to contemporary and near-future global sea level rise and determine the processes driving the response of its ice masses to observed rapid warming.
The RHA is composed of three main ice masses: Novaya Zemlya, which is the largest in terms of glaciated area at 21 200 km2 and is the dominant source of recent ice loss in the region (Moholdt and others, Reference Moholdt, Wouters and Gardner2012; Melkonian and others, Reference Melkonian, Willis, Pritchard and Stewart2016; Tepes and others, Reference Tepes, Nienow and Gourmelen2021b; Jakob and Gourmelen, Reference Jakob and Gourmelen2023); Severnaya Zemlya, which has an area of 16 700 km2 and has recently exhibited major, rapid-onset changes in the dynamics of some of its outlet glaciers (Willis and others, Reference Willis, Melkonian and Pritchard2015, Reference Willis2018; Sánchez-Gámez and others, Reference Sánchez-Gámez2019); and Franz Josef Land with an area 12 700 km2, where ice losses have recently accelerated (Zheng and others, Reference Zheng2018). Novaya Zemlya's mass balance was negative during the 2000s (Moholdt and others, Reference Moholdt, Wouters and Gardner2012; Matsuo and others, Reference Matsuo and Heki2013; Zhao and others, Reference Zhao, Ramage, Semmens and Obleitner2014), with losses increasing from 10 ± 5 Gt a−1 for 2003–2009 to 14 ± 4 Gt a−1 for 2010–2016, and mass balance being close to zero between 2009 and 2011 (Ciracì and others, Reference Ciracì, Velicogna and Sutterley2018). Negative mass balance coincided with retreat of Novaya Zemlya's marine-terminating glaciers: retreat rates were significantly higher between 2000 and 2013 than any other time since the mid-1970s (Carr and others, Reference Carr, Stokes and Vieli2014, Reference Carr, Bell, Killick and Holt2017a). This period of accelerated retreat coincided with atmospheric warming and reduced sea ice concentrations and retreat rates were an order of magnitude higher on glaciers terminating in the ocean than those on land (Carr and others, Reference Carr, Stokes and Vieli2014, Reference Carr, Bell, Killick and Holt2017a). Retreat rates were also significantly higher on the Barents Sea coast compared to the Kara Sea, which likely reflects their differing atmospheric and oceanic conditions (Carr and others, Reference Carr, Stokes and Vieli2014, Reference Carr, Bell, Killick and Holt2017a): the Barents Sea coast is exposed to warm ocean currents and air masses from the north Atlantic, resulting in warmer ocean and air temperatures and higher precipitation rates (Zeeberg and others, Reference Zeeberg and Forman2001; Politova and others, Reference Politova, Shevchenko and Zernova2012; Przybylak and others, Reference Przybylak and Wyszyński2016), whereas the Kara Sea coast is exposed to cool ocean waters and air masses emanating from the Arctic Ocean (Pavlov and others, Reference Pavlov and Pfirman1995; Zeeberg and others, Reference Zeeberg and Forman2001). Subsequent to enhanced retreat between 2000 and 2013, many of Novaya Zemlya's outlet glaciers underwent a short period of reduced retreat between 2013 and 2015, with several glaciers on the Barents Sea coast advancing (Carr and others, Reference Carr, Bell, Killick and Holt2017a). However, it was unclear whether this was a temporary hiatus or the start of a longer-term trend of reduced retreat (Carr and others, Reference Carr, Bell, Killick and Holt2017a). This is particularly timely, with the ‘Atlantification’ of the Barents Sea (Tepes and others, Reference Tepes2021a, Reference Tepes, Nienow and Gourmelen2021b; Jakob and Gourmelen, Reference Jakob and Gourmelen2023), whereby air and ocean temperatures are warming and sea ice is declining (Årthun and others, Reference Årthun, Eldevik, Smedsrud, Skagseth and Ingvaldsen2012; Polyakov and others, Reference Polyakov2017; Barton and others, Reference Barton, Lenn and Lique2018; Stroeve and others, Reference Stroeve, Schroder, Tsamados and Feltham2018).
Seasonal-scale variations in terminus position, and the factors controlling them, have not previously been analysed on Novaya Zemlya. However, work from the Greenland Ice Sheet has shown that analysing seasonal controls can provide important insights into the factors driving interannual glacier behaviour (e.g. Carr and others, Reference Carr, Vieli and Stokes2013; Moon and others, Reference Moon2014; Fried and others, Reference Fried2018; Catania and others, Reference Catania, Stearns, Moon, Enderlin and Jackson2020). On the Greenland Ice Sheet, previous work has demonstrated that the onset of glacier retreat coincides with the beginning of the melt season in late spring / early summer (e.g. Sohn and others, Reference Sohn, Jezek and van der Veen1998; Moon and others, Reference Moon2014; Fried and others, Reference Fried2018; Vijay and others, Reference Vijay2019; Davison and others, Reference Davison2020), which may drive retreat through a combination of hydrofracturing and/or increased basal melting, due to enhanced plume flow (e.g. Vieli and others, Reference Vieli and Nick2011; Carr and others, Reference Carr, Vieli and Stokes2013; Straneo and others, Reference Straneo2013). Similarly, ocean temperatures display seasonal cycles, and can therefore seasonally-enhance basal melting and undercutting of the terminus in the warmer months (e.g. Benn and others, Reference Benn, Warren and Mottram2007; Straneo and others, Reference Straneo2012; O'Leary and others, Reference O'Leary and Christoffersen2013; Straneo and others, Reference Straneo2013; Todd and others, Reference Todd, Christoffersen, Zwinger, Råback and Benn2019). Finally, an ice mélange (a semi-rigid mix of icebergs and sea ice) forms seasonally at ice fronts in Novaya Zemlya and the Greenland Ice Sheet and can strongly suppress the movement of icebergs away from the terminus (e.g. Sohn and others, Reference Sohn, Jezek and van der Veen1998; Amundson and others, Reference Amundson2010; Carr and others, Reference Carr, Vieli and Stokes2013; Moon and others, Reference Moon, Joughin and Smith2015). Thus, an earlier onset and/or late formation of the ice mélange can result in higher calving rates and/or a longer calving season and hence net recession of the terminus (Robel, Reference Robel2017; Amundson and others, Reference Amundson and Burton2018; Todd and others, Reference Todd, Christoffersen, Zwinger, Råback and Benn2019). Previous work on Novaya Zemlya has suggested that glacier retreat corresponds with warmer air temperatures and reduced sea ice concentrations at decadal timescales, and that ocean warming may play a role (Carr and others, Reference Carr, Bell, Killick and Holt2017a), but the role of each forcing factor remains uncertain, particularly at seasonal timescales. To address this knowledge gap, we construct the first time series of seasonal frontal position variation on Novaya Zemlya for a subset of our study glaciers and analyse these variations in relation to seasonal-scale climatic forcing factors.
Changes in the dynamics of marine-terminating outlet glaciers represent an important ice loss mechanism from Arctic ice caps and ice sheets (e.g. Mouginot and others, Reference Mouginot2019; IMBIE, 2020; Kochtitzky and others, Reference Kochtitzky2022), both through immediate losses from iceberg calving and longer-term draw-down of inland ice, or ‘dynamic thinning’ (e.g. Pritchard and others, Reference Pritchard, Arthern, Vaughan and Edwards2009; Price and others, Reference Price, Payne, Howat and Smith2011). Across the Barents and Kara Sea region, changes in ice discharge accounted for 43% of ice mass loss between 2010 and 2020, with the remaining 57% resulting from negative surface mass balance (Jakob and Gourmelen, Reference Jakob and Gourmelen2023). On Novaya Zemlya, SMB accounts for the majority of mass loss (89%), while increased discharge account for 76 and 100% of mass loss for Franz Josef Land and Severnaya Zemlya respectively (Jakob and Gourmelen, Reference Jakob and Gourmelen2023). Rapid thinning rates have been observed on Novaya Zemlya, particularly at low elevations (Tepes and others, Reference Tepes2021a, Reference Tepes, Nienow and Gourmelen2021b), but it is unclear whether observed thinning on Novaya Zemlya is a response to enhanced surface melt, which has then promoted glacier retreat and terminus ungrounding, or whether outlet glacier retreat has caused thinning, due to draw down of inland ice. Thus, this paper aims to systematically investigate the relationship between terminus retreat and surface elevation change on Novaya Zemlya.
Here, we use remotely sensed data to: (i) determine whether reduced retreat rates observed on Novaya Zemlya between 2013 and 2015 have persisted or whether the enhanced retreat observed between 2000 and 2012 has resumed; (ii) quantify seasonal-scale variations in frontal positions for selected glaciers; (iii) assess the relationship between frontal position change and external forcing at seasonal to interannual timescales and; (iv) determine whether glacier retreat corresponds to thinning and the direction of this relationship, i.e. does retreat precede or follow thinning. We determined frontal position changes between 2015 and 2020 for all major glaciers (i.e. >1 km wide) identified by Carr and others, Reference Carr, Bell, Killick and Holt2017a. To investigate seasonal-scale variations in frontal position and their relationship with forcing, we also mapped terminus positions for six glaciers on each coast, at weekly to monthly temporal resolution between 2010 and 2020. To do this, we selected glaciers that had the biggest change in retreat rates between 2013–2015 and 2015–2020, thus enabling us to assess the switch in retreat behaviour in more detail. Surge-type glaciers were excluded (Grant and others, Reference Grant, Stokes and Evans2009), leaving a total of 53 outlets (Fig. 1), which were distributed across the three main ice caps of Novaya Zemlya (northern island ice cap, subsidiary ice mass 1 and subsidiary ice mass 2), and between the Barents and the Kara Sea coasts. Retreat rates were analysed in relation to: (1) air temperature, determined from ERA-5 reanalysis data and meteorological station data; (2) sea ice and (3) ocean potential temperature data from the Global Ocean Physics Reanalysis dataset GLORYS12V1; and (4) surface elevation change from CryoSat-2 interferometric radar altimetry.
Location map showing the location of (a) Novaya Zemlya within the Russian High Arctic and (b) to location of the main ice masses and study glaciers on Novaya Zemlya. Glaciers are symbolised according to terminus type and surge-type glaciers are identified with a star. Three letter IDs are given for each marine-terminating glacier and a full list of glacier IDs and names are given in Supplementary Table 1.

2. Methods
2.1. Glacier frontal positions
Outlet glacier frontal positions were determined for the 53 study glaciers between 2015 and 2020, which were >1 km in width (Fig. 1). The outlets are located on Novaya Zemlya's main ice mass (Fig. 1), the northern ice cap, also known as Severny Island ice cap (n = 45), and its two smaller ice masses, Sub 1 (n = 4) and Sub 2 (n = 4). We include glaciers of different terminus types, specifically, ocean-terminating (n = 32), land-terminating (n = 15) and lake terminating (n = 6). On the northern ice cap, outlet glaciers flow from the main divide, either west towards the Barents Sea coast (n = 27) or east towards the Kara Sea coast (n = 18; Fig. 1). Glaciers on Sub 1 and Sub 2 were not categorised as Barents or Kara Sea, as they predominantly flow north/south from their ice divides (Fig. 1).
We mapped terminus position for all 53 study glaciers between 2015 and 2020 from Landsat 8 imagery, which was acquired from the USGS Earth Explorer and has a spatial resolution of 30 m. To avoid seasonal variability and ensure comparability with data from Carr and others (Reference Carr, Bell, Killick and Holt2017a), imagery was obtained from as close to 31 July as possible for each year. Following previous studies, glacier termini were digitised for each time interval using the box method, whereby a reference box was created for each glacier, which falls between its bounding fjord walls. The terminus was then digitised from each image, so that any changes in area are due to changes in frontal position, which was calculated by dividing area change by the reference box width. This enables uneven retreat across the terminus to be captured. To investigate seasonal scale terminus variations and the period of reduced retreat rates between 2013 and 2015, we produced a high temporal resolution time series of frontal positions for six glaciers on both the Barents Sea (CHA, INO, KRI, NOR, SH, VIJ, VIS) and the Kara Sea coasts (KRO, OGA, POL, SHU1, VER, VYL2). To construct the most comprehensive time series available, we used Imagery from Landsat 7 and 8 and Sentinel 1 and 2. Data availability ranged from a few images per year between 2010 and 2015 to approximately weekly resolution from 2016 onwards, when Landsat 8 and Sentinel data were available. Average retreat rates for the 12 glaciers were 90.2 m a−1 between 2015 and 2020, which equates to 1.7 m per week, meaning that weekly to monthly resolution data are likely sufficient to capture the majority of short-term terminus change.
All imagery used to map terminus positions was assessed for potential geolocation errors, by comparing features that should not move between images (e.g. bedrock ridges), and no discernible differences in geolocation were observed. Thus, the primary source of error in our terminus positions comes from digitising errors associated with correct identification of the glacier margin. To assess these errors, we re-digitised the terminus positions for three marine-terminating, three lake terminating and three land-terminating glaciers for each time interval between 2015 and 2020, without reference to the original mapping. We then calculated the average divergence between the frontal positions for each image date, for each glacier. The resultant errors for marine-terminating glaciers was 26.8, 35.4 m for lake-terminating and 77.6 m for land-terminating glaciers, equating to errors in retreat rate of 5.4, 7.1 and 15.5 m a−1 for the period 2015 to 2020 respectively.
Frontal positions from 2015 to 2020 extend the previous dataset created by Carr and others (Reference Carr, Bell, Killick and Holt2017a), which documented frontal position changes on Novaya Zemlya between 1973/6 and 2015. Here we use the same study glaciers and reference boxes, to allow for direct comparison and to construct a coherent, consistent record through to 2020. The Carr and others, Reference Carr, Bell, Killick and Holt2017a dataset was created from a range of satellite imagery, including: Landsat 1–5, Landsat 7 and Landsat 8 imagery from the 1970s through to the 2010s; declassified Hexagon HK-9 imagery from 1976 and 1977; and Synthetic Aperture Radar (SAR) Image Mode Precision data from the European Remote-sensing Satellite-1 (ERS-1) and ERS-2 for the 1990s. Full details of the specific imagery used are available in Carr and others, Reference Carr, Bell, Killick and Holt2017a. Frontal position errors for the 1973/6–2015 datasets were calculated at 17.5 m for marine- and lake-terminating glaciers, equating to an error in retreat rates of 3.5 m a−1 per five-year period, which is comparable to our errors of 5.4 and 7.1 m a−1 for 2015 to 2020. For land-terminating glaciers, the error in the Carr and others (Reference Carr, Bell, Killick and Holt2017a) dataset was 68.4 m, equating to a five-year error in retreat rates of 13.7 m a−1, which is also comparable to the error in retreat rate of 15.5 m a−1 for the 2015–2020 data.
2.2. Surface elevation change data
Surface elevation data were sampled from CryoSat-2 interferometric radar altimetry data for the period August 2010 to August 2020. Data processing follows the methods outlined in Jakob and Gourmelen (Reference Jakob and Gourmelen2023). Swath processing was applied to the CryoSat-2 data, which increases the quantity of data retrieved, compared to conventional processing approaches, and increases the temporal and spatial resolution across complex topography (Foresta and others, Reference Foresta2016; Gourmelen and others, Reference Gourmelen2018; Jakob and others, Reference Jakob, Gourmelen, Ewart and Plummer2021; Jakob and Gourmelen, Reference Jakob and Gourmelen2023). In this study we use two surface elevation change datasets; (1) a gridded product of 10-year elevation change rates and (2) a glacier-wide monthly time series of elevation changes. For the 10-year surface elevation change dataset a plane-fit algorithm was applied to the swath points to derive a gridded elevation change raster at a spatial resolution of 500 m (Jakob and Gourmelen, Reference Jakob and Gourmelen2023). To obtain the monthly elevation change time series the swath data are gridded into 2 km pixels using a 90-day moving time window (Jakob and Gourmelen, Reference Jakob and Gourmelen2023). The RGI v6.0 outlines are used to generate integrated elevation change time series over the study glaciers. We sampled elevation change from within a 5 km buffer of the July 2010 terminus positions for each study glacier. Buffers were then clipped to the RGI v6.0 outlines, so that the elevation change was sampled for the area within each outlet glacier basin with 5 km of the July 2010 terminus and within the glacier catchment, as defined in the RGI v6.0.
2.3. Climatic and oceanic data
Data on air temperatures were obtained from the ERA5 reanalysis dataset ‘ERA5 monthly averaged data on single levels from 1979 to present’ (Hersbach and others, Reference Hersbach2019), which have a spatial resolution of 0.25° and cover the period 1979 to present. The 2 m temperature product was used, and data were sampled from the gird cell closest to Novaya Zemlya's coast, using the product's ocean vs land mask. Average values were calculated for the Barents and Kara Sea coasts. For both the meteorological station data and the reanalysis data, we calculated meteorological seasonal means for Winter (December-February), Spring (March-May); Summer (June-August); and Autumn (September-November). Seasonal and annual means were only calculated if data were available for all months.
Sub-surface ocean temperatures and sea ice data were obtained from the Global Ocean Physics Reanalysis dataset GLORYS12V1 (Fernandez and others, Reference Fernandez and Lellouche2018), provided by the Copernicus Marine Environment Monitoring Service (CMEMS). The dataset has a horizontal resolution of 0.083° and 50 vertical levels in the ocean and extends from 1 January 1993 to 31 December 2019. We determined sea ice concentration for the Barents and Kara seas, by sampling from the grid squares immediately offshore of each coast, using the land/ocean mask. The number of ice-free months (i.e. months where the concentration was zero) were also calculated. We also sampled potential ocean temperature data from the GLORYS12V1 dataset, at depths of 5 m (i.e. near-surface water) and 92 m, with 92 m being the greatest depth attainable immediately offshore of Novaya Zemlya and thus likely to be most representative of the ocean conditions influencing glacier behaviour (Carr and others, Reference Carr, Bell, Killick and Holt2017a).
2.4. Statistical analysis
We used a Wilcoxon test to identify significant differences between our study time periods, for glacier retreat rates, air temperatures, sea ice concentrations, number of sea ice free months and ocean temperatures at depths of 5 and 92 m. Wilcoxon tests were used, as the test is nonparametric and is suitable for assessing statistical differences between two time periods of data (Miles and others, Reference Miles, Stokes, Vieli and Cox2013; Carr and others, Reference Carr, Stokes and Vieli2017b). Following statistical convention, a p-value of less than or equal to 0.05 is taken as significant. The Matlab function xcorr was used to calculate the cross-correlation between the time series of surface elevation change and relative frontal position change for each glacier between 2011 and 2020. Cross-correlation determines the similarity between one discrete time series (x) and another discrete time series (y), at a series of lagged intervals, i.e. it calculates the correlation between the two time series for x time =1 and y time =1, then x time =1 and y time =2, then x time =1 and y time =3, until the final value of y is reached in the time series. In our analysis, x was the surface elevation time series and y was the relative frontal position time series, so that:
(i) A lag of −1 years evaluates the correlation between glacier frontal position (y) and surface elevation change in the previous year (x), i.e. glacier frontal position (y) at time 0, is correlated with surface elevation change (x) at time −1.
(ii) A lag of + 1 years evaluates the correlation between surface elevation change (x) and glacier frontal position (y) in the previous year, i.e. surface elevation change (x) at time 0, is correlated with glacier frontal position (y) at time −1.
(iii) A lag of 0 evaluates the correlation between surface elevation change and relative frontal position for the same year, i.e. surface elevation change (x) at time 0, is correlated with glacier frontal position (y) at time 0.
The correlation coefficient for each cross-correlation was normalised to give a value between 0 and 1, with 1 indicating the highest correlation. This is to ensure comparability between different glaciers. As such, we use the cross correlation to determine the timing of the maximum correlation and to thus identify when the maximum correlation occurs between surface elevation change and glacier frontal position.
3. Results
3.1. Interannual changes in glacier frontal position
Results show that 92% (49 out of 53 glaciers) of our study glaciers retreated between 2015 and 2020, across all terminus types (Figs 1, 2). The highest retreat rates occurred on marine-terminating outlet glaciers located on the Barents Sea coast, where rates averaged −116.9 m a−1 and reached a maximum of −297.0 m a−1 at KRI (Fig. 2). Retreat rates on these glaciers were significantly higher than during the 2013–2015 pause, when termini underwent a slight net advance on average (+11.4 m a−1) and were comparable to those observed during the previous phase of marine-terminating outlet glacier retreat on Novaya Zemlya between 2000 and 2013 (−107.6 m a−1; Table 1; Fig. 2). Mean retreat rates from 2015–2020 on the Barents Sea coast were approximately five times greater than those observed prior to the 2000s (Table 1; Fig. 2). The range in rates of frontal position change between individual marine-terminating outlet glaciers on the Barents Sea Coast was much higher during periods of rapid retreat, reaching 299.4 m a1 (2000–2013) and 294.2 m a1 (2015–2020), compared to 160.5 m a1 (1976–1986), 73.5 m a1 (1986–2000) and 108.5 m a1 (2013–2015).
Box chart showing median retreat rates of Novaya Zemlya outlet glaciers, divided by study time period and terminus type. Retreat rates are plotted for the five study time periods: 1973/76–1986, 1986–2000, 2000–2013 and 2013–2015 and 2015–2020. Data are split according to terminus type (marine, land and lake) and marine-terminating glaciers are further sub-divided by coast. The median retreat rate is shown as the line inside the box and the upper (lower) quartile is shown as the top (bottom) edges of the box. The lines extending beyond the boxes show the full range in values and any outliers are indicated by circles.

P-values from Wilcoxon test results, to test for statistical difference between the study time periods (1973/76–1986, 1986–2000, 2000–2013 and 2013–2015 and 2015–2020) for glacier retreat

Data were divided by terminus type (marine-, land -and lake-terminating glaciers) and the marine-terminating glacier category was further sub divided by coast (Barents and Kara). Significant p-values <0.05 are highlighted in bold and p-values are given to four decimal places.
Marine-terminating outlets on the Kara Sea coast followed a similar, although more muted, pattern to those on the Barents Sea: retreat rates were highest in 2015–2020, at −64.6 m a−1, and this was a significant increase from 2013–2015, when retreat rates averaged −18.2 m a−1 (Table 1; Fig. 2). As on the Barents Sea coast, retreat rates between 2015 and 2020 were not significantly different from those between 2000 and 2013 (−58.4 m a−1) but were three times higher than between 1973/76 and 2000 (Table 1; Fig. 2). Variability in retreat rates between glaciers was also much higher during periods of rapid retreat, with a range of 172.7 m a1 for 2000–2013 and 208.0 m a1 for 2015–2020, compared to 32.6 m a1 (1976–1986), 64.7 m a1 (1986–2000) and 69.3 m a1 (2013–2015).
In contrast to their marine-terminating neighbours, the lake-terminating outlets showed no significant differences in their retreat rates between any of the study time periods: we did not observe significantly higher retreat rates in either 2000–2013 or 2015–2020 nor significantly reduced retreat in 2013–2015 (Fig. 2, Fig. S1; Table 1). Indeed, mean retreat rates were notably consistent between time periods, ranging from −30.6 m a1 in 1976–1986 to −61.7 m a1 in 2015–2020 (Fig. 2), and all lake-terminating outlets followed a linear pattern of terminus retreat between 1976 and 2020 (Fig. S1). The range in retreat rates was highest in 2013–2015 (90.8 m a−1) and lowest in 2015–2020 (66.9 m a−1), meaning that the greatest range in retreat rates did not correspond to the periods of highest retreat rates. Land-terminating outlet glaciers experienced the lowest retreat rates of any terminus type, ranging between −7.1 m a−1 in 1976–1986 and −32.1 m a−1 between 2015 and 2020 (Fig. 2, Fig. S1). Retreat rates were higher in 2015–2020 (−32.1 m a−1) than in any other time period, but this difference was not statistically significant, and no significant differences were found between retreat rates for any of the time periods (Table 1). As for lake-terminating glaciers, variability in retreat rates for land-terminating outlet glaciers was highest for 2013–2015 (−137.9 m a−1) and showed no clear correspondence to mean retreat rates (Fig. 2).
3.2. Seasonal cycles of frontal position change
Across the six study glaciers on the Barents Sea coast, seasonal retreat began between mid-June and mid-July each year and most often started in July, for the period 2016 to 2020 (Figs 3a, 4a; Table S2). The most seasonally retreated position showed more temporal and spatial variability and generally occurred between November and December (Figs 3b, 4a; Table S2). On all six of the glaciers, larger than average seasonal retreats occurred in both 2016 and 2020 (Fig. 4a). The duration of seasonal retreat was not greater than usual during these events, meaning that the additional retreat occurred through higher rates of retreat (Fig. 4a). For example, KRI retreated 832 m between 6 July and 27 December 2016, compared to just 182 m between 7 July and 22 December 2017 (Fig. 4a). Retreat rates in 2016 were between 5 (VIJ) and 10 (VIS) times higher than the average for each glacier between 2015 and 2020.
Histogram showing the month of the year for seasonal changes in frontal position for selected glaciers on the Barents Sea coast (a & b) and Kara Sea coast (c & d). Frequency is shown for the date of seasonal retreat onset (a & c) and for the date of the end of seasonal retreat (b & d).

High temporal resolution frontal position of selected study glaciers on the Barents Sea coast, shown with anomalies in forcing factors. (a) Frontal positions are relative to 7 July 2010 and are colour-coded by glacier name. Glaciers are in order of latitude, with the first glacier (CHA) being furthest north and the last glacier (NOR) being furthest south. Glacier locations are shown in Figure 1. (b) Air temperature anomalies (°C) from ERA5 data, for the Barents Sea coast. Anomalies were calculated relative to the 1979–2020 mean (i.e. the duration of the ERA5 data), for all seasons and annual values. (c) Sea ice concentration anomalies (%) for the Barents Sea coast from the Global Ocean Physics Reanalysis dataset GLORYS12V1. Anomalies were calculated relative to the 1993–2020 mean (i.e. the duration of the GLORYS12V1 data), for all seasons and annual values. (d & e) Ocean temperature anomalies (°C) for the Barents Sea coast GLORYS12V1, at depths of 5 (d) and 92 m (e). Anomalies were calculated relative to the 1993–2020 mean and are shown for all seasons and annual values.

On the Kara Sea coast, seasonal retreat usually began in June or July (Figs 3c, 5a; Table S3). The glaciers usually reached their seasonally retreated position in late October, with mid-October and early November also being common (Figs 3d, 5a; Table S3). Changes in the magnitude of seasonal retreat varied between the six study glaciers. In 2018, a larger seasonal retreat was observed on KRO (823 m) and on POL (552 m), which, in both cases, was driven by greater retreat rates, rather than a longer season (Figs 5a, b). POL also retreated substantially in 2020 (465 m). The other four study glaciers on the Kara Sea coast underwent larger retreats in 2019 and 2020, and ROZE only established a clear seasonal cycle in these years (Figs a, b).
High temporal resolution frontal position of selected study glacier on the Kara Sea coast, shown with anomalies in forcing factors. (a) Frontal positions are relative to 7th July 2010 and are colour-coded by glacier name. Glaciers are in order of latitude, with the first glacier (ROZE) being furthest north and the last glacier (POL) being furthest south. Glacier locations are shown in Figure 1. (b) Air temperature anomalies (°C) from ERA5 data, for the Kara Sea coast. Anomalies were calculated relative to the 1979–2020 mean (i.e. the duration of the ERA5 data), for all seasons and annual values. (c) Sea ice concentration anomalies (%) for the Kara Sea coast from the Global Ocean Physics Reanalysis dataset GLORYS12V1. Anomalies were calculated relative to the 1993–2020 mean (i.e. the duration of the GLORYS12V1 data), for all seasons and annual values. (d & e) Ocean temperature anomalies (°C) for the Kara Sea coast GLORYS12V1, at depths of 5 (d) and 92 m (e). Anomalies were calculated relative to the 1993–2020 mean and are shown for all seasons and annual values.

3.3. Climate and ocean forcing
Between 1990 and 2020, air temperatures from ERA5 reanalysis data followed a similar pattern on the Barents and Kara Sea coasts and showed large interannual variability (Figs 6b, e). Overall, the record was dominated by positive air temperature anomalies from 2005 onwards with negative anomalies beforehand (Figs 6c, f). This is supported by Wilcoxon test results, which showed that both the Barents and Kara Sea coasts were significantly warmer in 2015–2020 than in 1986–1999, for all seasons and annually (Table 2). The air temperature record on both coasts was characterised by 1 to 3 year long periods of warmer or cooler temperatures: warmer air temperatures were observed in 2011, 2012, 2016 and 2020, while cooler temperatures occurred in 1998, 2004, 2009 and 2013 to 2015 (Figs 4b, 5b, 6b, e). However, there was no significant difference between air temperatures in 2015–2020 and 2013–2014 during any season, while summer and annual mean temperatures in 2015–2020 were significantly warmer than those in 2000–2012 (Table 2).
Relative frontal position change of marine-terminating outlet glaciers and air temperature (T) between 1990 and 2020, for the Barents Sea coast (left-hand panels) and the Kara Sea Coast (right-hand panels). Frontal positions (a and d) are relative to 1986, which is the earliest date common to all glaciers, and are colour-coded according to glacier name, in alphabetical order. Glacier locations are shown in Figure 1. Air temperatures are from ERA5 data and are for the Barents Sea coast (b) and Kara Sea coast (e), for the period 1990 to 2020. Data are coloured coded by annual and meteorological season averages. Air temperature anomalies were calculated for the Barents Sea coast (c) and Kara Sea coast (f) for the annual and seasonal means and are relative to the 1979–2020 mean (i.e. the duration of the ERA5 data).

P-values from Wilcoxon test results, to test for statistical difference between 2015–2020 and the other study time periods (1979–1985, 1986–1999, 2000–2012 and 2013–2014) for air temperatures from ERA5 reanalysis data

Significant p-values <0.05 are highlighted in bold and p-values are given to four decimal places.
On both the Barents and Kara Sea coasts, sea ice concentrations were lower than the 1993–2019 mean across all seasons and annually from 2005 onwards (Figs 7c, g). There was also large interannual variability in sea ice concentrations along both coasts, particularly during winter and spring (Figs 7b, f). The number of ice-free months on both coasts increased over time: on the Barents Sea (Kara Sea) coast, there were an average of 5 (2.5) ice free months between 1993 and 2005, compared to 6.4 (4.4) months between 2006 and 2019 (Figs 7d, h). The Barents Sea coast was sea ice free during the summer for the entire study period (Fig. 7d) and the Kara Sea became ice free in summer from 2005 onwards (Fig. 7h). Wilcoxon tests showed no significant difference in sea ice concentrations or the number of ice-free months in 2015–2019, compared to either 2000–2012 or 2013–2014, with the exception of autumn on the Barents Sea coast (Table 3). As with air temperatures, sea ice concentrations were characterised by short-term (1–3 years) periods of lower or higher concentrations. On both coasts, sea ice concentrations were comparatively high in 1998 and low in 2000–2001 (Figs 7b, f). Sea ice concentrations then generally declined over the 2000s, but with large interannual variability, before reaching the lowest concentrations observed during the study period in 2012 (Figs 4b, 5b, 7b, f). Subsequently, sea ice concentrations on both coasts increased between 2013 and 2015 (Figs 7b, f) and reached another low point in 2016 (Figs 4b, 5b, 7b, f).
Relative frontal position change of marine-terminating outlet glaciers and sea ice conditions between 1990 and 2020, for the Barents Sea coast (left-hand panels) and the Kara Sea Coast (right-hand panels). Frontal positions (a and d) are relative to 1986, which is the earliest date common to all glaciers, and are colour-coded according to glacier name, in alphabetical order. Glacier locations are shown in Figure 1. Sea ice concentrations (%) are from the Global Ocean Physics Reanalysis dataset GLORYS12V1 and are shown for the Barents Sea coast (b) and Kara Sea coast (e), for the period 1993 to 2019. Data are coloured coded by annual and meteorological season averages. Sea ice concentration anomalies (%) were calculated for the Barents Sea coast (c) and Kara Sea coast (f) for the annual and seasonal means and are relative to the 1993–2019 mean (i.e. the duration of the GLORYS12V1 data). The average number of sea ice free months for each year is displayed for the Barents Sea (d) and Kara Sea (h).

P-values from Wilcoxon test results, to test for statistical difference between the study time periods (1993–1999, 2000–2012 and 2013–2014 and 2015–2020) for sea ice concentrations and the number of ice-free months

Data were divided by coast. Significant p-values <0.05 are highlighted in bold and p-values are given to four decimal places.
Potential ocean temperatures on both coasts and at both depths (5 m and 92 m) showed mostly positive anomalies after 2010 and negative anomalies beforehand (Figs 8c, e, h, j). There was large interannual variability, which was particularly marked on the Barents Sea coast, and this variability increased substantially on both coasts after 2010 (Figs 8b, d, g, i). For example, on the Barents Sea coast at 92 m depth, potential temperature warmed by 0.40 °C between 1993 and 1995, then cooled by 0.61 °C by 1997 (Fig. 8d). In contrast, temperatures cooled by 1.21 °C between 2012 and 2014 and then warmed by 1.35 °C between 2014 and 2016 (Fig. 8d). On the Barents Sea, ocean temperatures at 5 at 92 m depth were significantly warmer in 2015–2019 for all seasons (except winter 2000–2012) than for 1993–1999 and 2000–2012, but were not significantly warmer than ocean temperatures in 2013–2014 (Table 4). For the Kara Sea, ocean temperatures at 5 m depth were significantly warmer in 2015–2019 than for 1993–1999 for summer, spring and annual values, while at 92 m depth, 2015–2019 temperatures were warmer than those in 1993–1999 (all seasons except spring) and 2000–2012 (in summer autumn and annual data). Ocean temperatures were characterised by 1 to 4 year periods of warming and cooling, which were particularly marked on the Barents Sea and after 2010 (Figs 8b, d). On the Barents Sea, ocean temperatures at both depths were particularly warm in 2012 and 2016 in all seasons (Figs 8b, d) and the warmest anomalies were observed in 2016, particularly in summer and autumn (Figs 4d, e). At both depths, ocean temperatures were comparatively cool in 2010, 2014 and 2019 (Figs 8b, d), with 2014 showing slightly cooler than average conditions (Figs 4d, e). On the Kara Sea coast, ocean temperatures were also warmest in 2012 and 2016 (Figs 8g, i), particularly during the summer (Figs 4d, e). At both depths, ocean temperatures were cool in 214, 2017 and 2018 (Figs 4d, e, 8g, i).
Relative frontal position change of marine-terminating outlet glaciers and ocean temperature (T) between 1990 and 2020, for the Barents Sea coast (left-hand panels) and the Kara Sea Coast (right-hand panels). Frontal positions (a and d) are relative to 1986, which is the earliest date common to all glaciers, and are colour-coded according to glacier name, in alphabetical order. Glacier locations are shown in Figure 1. Ocean temperatures are from the Global Ocean Physics Reanalysis dataset GLORYS12V1, for the period 1993–2019. Both absolute ocean temperatures and anomalies relative to the 1993–2019 mean (i.e. the duration of the GLORYS12V1 data) are shown for depths of 5 m and 92 m depth. Data are coloured coded by annual and meteorological season averages.

P-values from Wilcoxon test results, to test for statistical difference between the study time periods (1993–1999, 2000–2012 and 2013–2014 and 2015–2020) for potential ocean temperature

Data were divided by coast (Barents and Kara coasts) and test statistics were calculated for depths of 5 and 92 m. Significant p-values <0.05 are highlighted in bold and p-values are given to four decimal places.
3.4. Glacier surface elevation change
Results show a significant correlation between outlet glacier retreat rates for the period 2015–2020 and surface thinning rates between 2010 and 2020 (Fig. 9). Specifically, regressing 2015–2020 retreat against surface elevation change within 5 km of the terminus gave an R 2 value of 0.46 for all glaciers and 0.36 for marine terminating outlets only, both with a p-value of 0.00, to two decimal places. Despite an overall significant correlation, there was a spread in the relationship between thinning and retreat rates. For example, mean retreat rates on KRA1, KRI, KRO and VIS were high compared to thinning rates, i.e. the four glaciers were substantially below the linear regression line in Figure 9. The four glaciers were all marine terminating, and three glaciers were located close together on central portion of Novaya Zemlya's Barents Sea coast (KRA1, KRI and VIS) and one was located midway along Novaya Zemlya's Kara Sea coast (KRO; Fig. 1). Conversely, four glaciers exhibited retreat rates that were low compared to their thinning rates, i.e. they sat above the regression line in Figure 9, specifically: RYK and KRA2, located on the central Barents Sea coast, INO, located on the northern portion of the Barents Sea coast, and VYL1, located on the central Kara Sea coast (Fig. 1).
Mean retreat rate for 2015–2020 regressed against mean thinning rate for Aug 2010 to Aug 2020 for: (a) All glacier terminus types (i.e. marine-, land- and lake-terminating glaciers); and (b) marine terminating glaciers only. Thinning rates were sampled from within 5 km from each glacier terminus, as of July 2010, and within each glacier catchment, as defined in the Randolph Glacier Inventory (RGI) v6.0. Thinning rates were calculated across Novaya Zemlya for the period August 2010 to August 2020 and the average thinning rate for each glacier catchment was calculated, using the RGI v6.0 outlines.

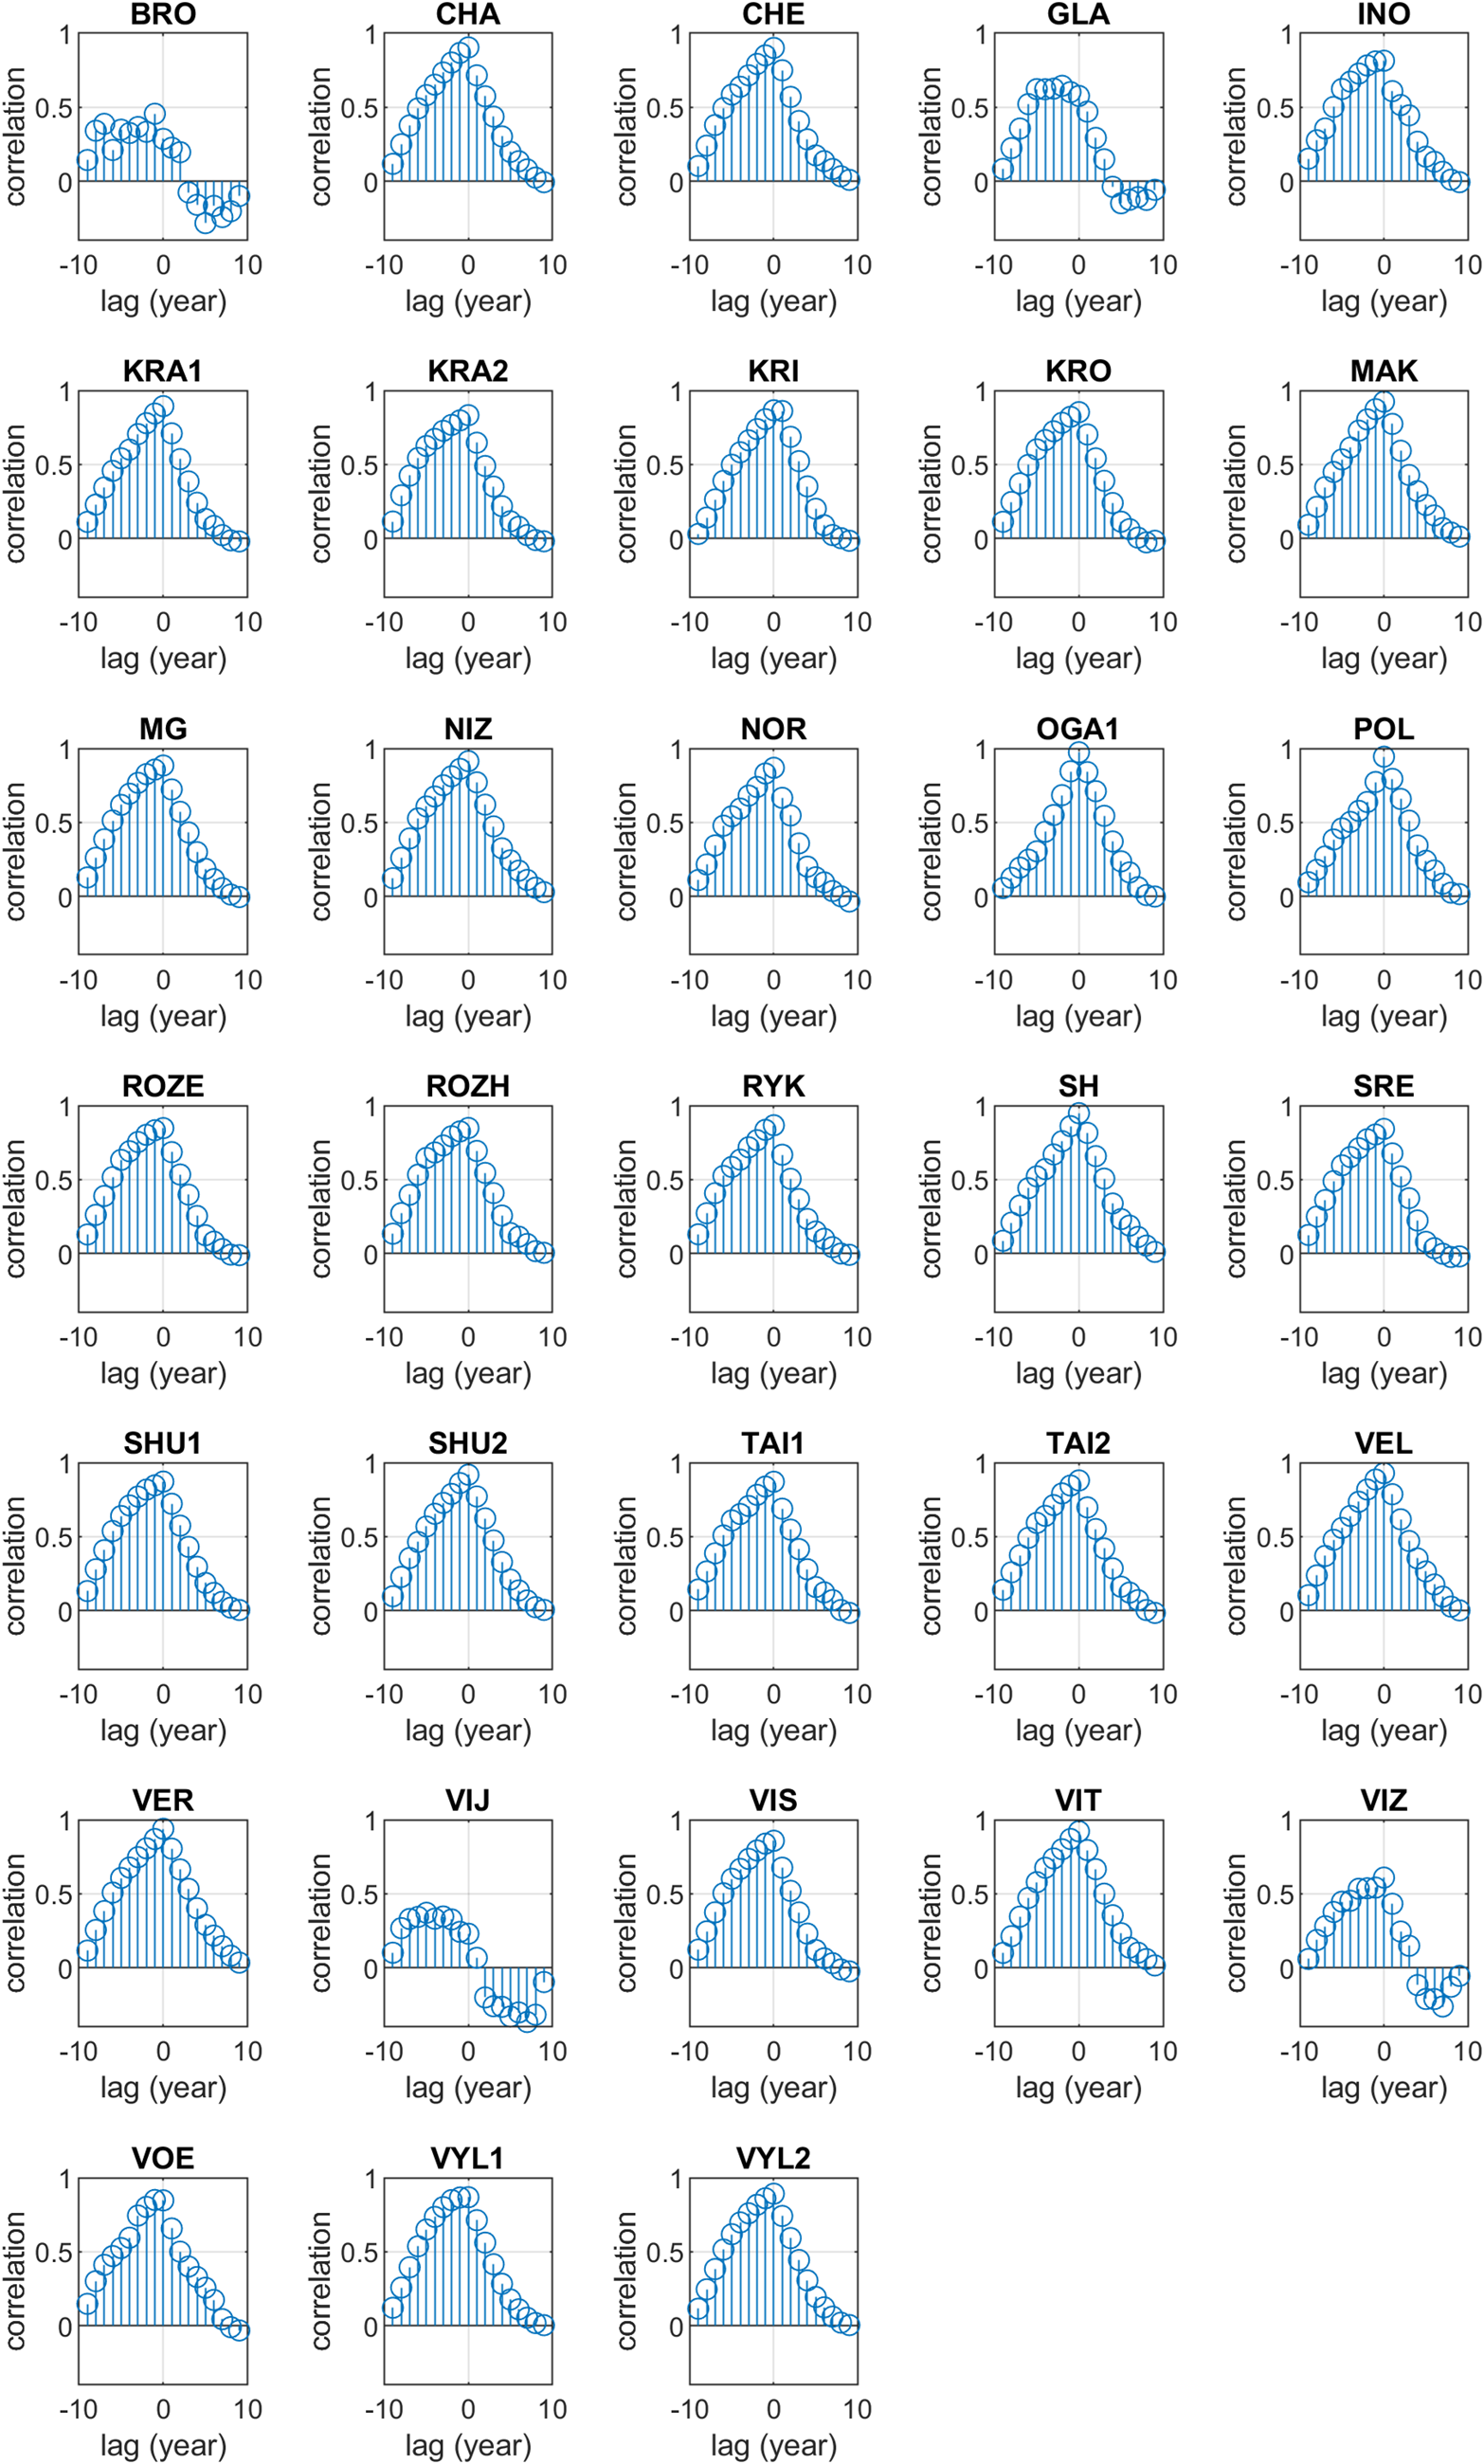
We used cross-correlation to evaluate the relationship between time series of elevation change and frontal position change and to identify any lags and/or leads within this relationship (Fig. 10). For most marine-terminating outlet glaciers, relative frontal position showed strong correlation with the previous ~5 years of surface elevation change and the maximum correlation occurred with zero lag: I.e. the strength of the correlation (shown by the length of the stick on the y-axis in Fig. 10) was greatest when the lag value on the x axis was between 0 and −5 years (i.e. the correlation between frontal position and thinning in the same year, through to thinning five years previously). This suggests that thinning over the previous ~5 years may drive frontal position change and that thinning in the same year has the most significant influence. At some glaciers (e.g. KRA1 and VEL), the correlation between surface elevation change and frontal position change decreases rapidly as the lag increases i.e. the influence of past surface elevation change on glacier retreat reduces rapidly with time. At other outlets (e.g. GLA, INO and VYL1), the decline in correlation with increasing lag is less marked, suggesting that previous thinning impacts glacier frontal position for longer. Focusing on positive lags, i.e. the relationship between current thinning rates and past frontal position change, the correlation reduces rapidly with time, suggesting that the impacts of changes in glacier frontal position on surface elevation change are shorter-lived than the impacts of thinning on retreat. Finally, a small number of glaciers (e.g. BRO and VIJ) show a different relationship between changes in frontal position and surface elevation, whereby there is no peak in correlation at the zero-lag time and surface elevation change shows a consistent correlation with frontal position for all negative lags. Conversely, there is an inverse correlation between surface elevation change and relative frontal position after the zero lag. This suggests that frontal position change at these glaciers is approximately equally influenced by surface elevation change in the previous years, and that retreat (advance) may drive thickening (thinning), which is the inverse of the relationship observed at the other glaciers.
Cross correlation results for surface elevation change between 2011 and 2020 vs relative frontal position change between 2011 and 2020. Stick height (y-axis) indicates the strength of the correlation at each lag time in years (x axis) between surface elevation change and relative frontal position change. Cross correlation evaluates correlation at all possible lags (indicated by a positive value on the x axis) and leads (indicated by a negative value on the x axis) between the two datasets. For example, the value at −1 on the x axis gives the correlation between frontal position change and thinning one year previous. Conversely, the value at 1 on the x axis gives the correlation between thinning and frontal position change one year previous. Finally, the value at x = 0 gives the correlation between frontal position change and thinning during the same year, i.e. no lag in either direction.
4. Discussion
4.1. Have reduced retreat rates observed on Novaya Zemlya between 2013 and 2015 persisted?
The pause in marine-terminating outlet glacier retreat observed on Novaya Zemlya between 2013 and 2015 (Carr and others, Reference Carr, Bell, Killick and Holt2017a) has not persisted and, instead, rapid retreat has resumed (Fig. 2): retreat rates between 2015 and 2020 were significantly higher than those observed pre-2000 (Table 1) and were comparable to Novaya Zemlya's previous phase of rapid retreat between in 2000–2012 (Table 1; Fig. 2) (Carr and others, Reference Carr, Bell, Killick and Holt2017a). Retreat rates on land- and lake-terminating glaciers on Novaya Zemlya showed no significant difference between any of the time periods (Table 1; Fig. 2; Fig. S1), suggesting that periods of enhanced glacier retreat on Novaya Zemlya are primarily due to changes on marine-terminating outlet glaciers, as has been widely documented on the Greenland Ice Sheet (e.g. Howat and others, Reference Howat, Joughin, Fahnestock, Smith and Scambos2008; Moon and others, Reference Moon and Joughin2008; Joughin and others, Reference Joughin, Smith, Howat, Scambos and Moon2010; Murray and others, Reference Murray2015).
On the Barents Sea Coast, we see remarkable commonality in the timing of changes in marine-terminating outlet glacier frontal positions. Our data show a dramatic reduction in retreat rates for all marine-terminating glaciers between 2013 and 2015 (Figs 2, 6a) and large retreats in 2016: retreat rates on our six focus glaciers in 2016 were between 5 and 10 times greater than the 2015–2020 average (Fig. 6a). Furthermore, detailed seasonal data highlights the common characteristics of the 2016 retreat event between the six glaciers: retreat began and ended on very similar dates and occurred through higher magnitude seasonal ice loss, as opposed to a longer seasonal retreat duration (Fig. 4a). Thus, marine-terminating outlets on the Barents Sea coast show far more commonality in retreat patterns than observed elsewhere across the Arctic (e.g. Murray and others, Reference Murray2015; Carr and others, Reference Carr, Stokes and Vieli2017b; Bunce and others, Reference Bunce, Carr, Nienow, Ross and Killick2018; Catania and others, Reference Catania2018; Fried and others, Reference Fried2018). Furthermore, they appear to respond rapidly to external forcing, as exemplified by the 2016 retreat event (Figs 4a, d, e). We attribute this to the very short fjords in Novaya Zemlya (Fig. 1), which directly expose the glaciers to variability in adjacent water mass characteristics in the Barents Sea and thus to Atlantic Water (Zeeberg and others, Reference Zeeberg and Forman2001; Polyakov and others, Reference Polyakov2017). Finally, our data suggest that periods of frontal position change on the Barents Sea coast are dominated by short-lived (1–2 years) ‘steps’, as opposed to longer-term trends (Fig. 4a). These events are only distinguishable from the high temporal resolution data available from ~2013 onwards but may also have occurred during the period of enhanced retreat between 2000 and 2013.
On the Kara Sea coast, the response of marine-terminating glaciers was less consistent than on the Barents Sea, in both our interannual (Figs 6a, b) and high temporal resolution (Figs 4a, 5a) data. For example, larger seasonal retreats (Figs 5a, b) were observed on certain glaciers in 2018 (KRO and POL) and in 2019 and 2020 on others (ROZE, SHU1, VER, VYL2). Glacier location did not appear to impact the timing of this retreat event: SHU1 and VYL2 retreated in 2019 and 2020 and are located between KRO and POL, which retreated in 2018 (Fig. 1). We suggest that the more limited commonality in patterns of frontal position is due to the glaciers' location on the Kara Sea coast, which is more isolated from Atlantic Water influences and subject to colder water masses from the Arctic (Pavlov and others, Reference Pavlov and Pfirman1995; Zeeberg and others, Reference Zeeberg and Forman2001). Thus, our data indicate that glacier-specific factors, such as fjord length and depth, play a greater role on the Kara Sea coast and that ocean warming is not such a dominant driver of retreat as on the Barents Sea coast. Nevertheless, retreat on the Kara Sea coast was still dominated by larger seasonal retreats in specific years (Fig. 4a), indicating some commonality in response to external forcing.
Focusing on seasonal timescales, the timing of the onset of seasonal retreat on Novaya Zemlya is comparable between glaciers and coasts, with retreat most often starting in July, followed by June (Fig. 3, Tables S2, S3). This suggests Novaya Zemlya glaciers respond consistently to forcing at seasonal, as well as annual, timescales. The date on which seasonal retreat ended was more variable on both coasts than the date of onset, but generally fell within a two-month window (Fig. 3, Tables S2, S3), and seasonal retreat usually ended earlier on the Kara Sea coast (most often in October) than on the Barents Sea (most often in November or December). The longer retreat season on the Barents Sea coast most likely reflects the warmer ocean and air temperatures experienced on the Barents Sea coast, due to its exposure to Atlantic water and air masses (e.g. Zeeberg and others, Reference Zeeberg and Forman2001; Politova and others, Reference Politova, Shevchenko and Zernova2012; Przybylak and others, Reference Przybylak and Wyszyński2016; Polyakov and others, Reference Polyakov2017). This is supported by patterns observed in Greenland, whereby outlet glaciers located in the central- and north-west (i.e. further from the north-Atlantic and higher latitude) tend to retreat from June or July (e.g. Moon and others, Reference Moon, Joughin and Smith2015; Fried and others, Reference Fried2018; Carr and others, Reference Carr, Carr and Ross2023), compared to May onwards for those located further south, in south-east Greenland (Howat and others, Reference Howat, Box, Ahn, Herrington and McFadden2010; Schild and others, Reference Schild and Hamilton2013). Similarly, the variability in the timing of the end of retreat was greater than that for the start of retreat for two north-west Greenland glaciers (Carr and others, Reference Carr, Carr and Ross2023).
4.2. What is the relationship between frontal position change and external forcing at seasonal to interannual timescales?
Overall, our data demonstrate a marked shift to warmer air (Figs 6c, f) and ocean (Figs 8c, e, h, j) temperatures and reduced sea ice concentrations (Figs 7c, g) from 2005 onwards. Following this shift to warmer conditions, these climatic factors were characterised by short-term (1–3 year) variations (Figs 6–8) and the magnitude of ocean variability increased markedly after 2010 (Figs 8c, h). These results are consistent with other reports of marked warming in the Barents and Kara Sea region since 2010, which has been termed ‘Atlantification’ (Ma and others, Reference Ma, Steele and Lee2017; Tepes and others, Reference Tepes2021a, Reference Tepes, Nienow and Gourmelen2021b; Jakob and Gourmelen, Reference Jakob and Gourmelen2023), and has been linked to increased storminess and enhanced Atlantic Water inflow and upwelling (Polyakov and others, Reference Polyakov2017; Barton and others, Reference Barton, Lenn and Lique2018; Lind and others, Reference Lind, Ingvaldsen and Furevik2018). We suggest that this shift to warmer climatic and oceanic conditions was responsible for the much higher retreat rates observed on both coasts of Novaya Zemlya from the 2000s onwards (Figs 6–8), which also coincided with elevated glacier velocities on Barents Sea marine-terminating outlets (Melkonian and others, Reference Melkonian, Willis, Pritchard and Stewart2016).
On the Barents Sea coast, our data demonstrate a rapid and consistent glacier response to ocean temperatures. Specifically, in 2016, enhanced seasonal retreat (Figs 4a, 8a) coincided with the warmest ocean temperatures in our record, at depths of both 5 and 92 m, and this anomaly was the largest we observed across all climatic/oceanic datasets (Figs 4, 8). The role of ocean temperatures in driving the 2016 retreat is further supported by the warmest anomalies occurring in the summer and autumn (Figs 4d, e), which is consistent with seasonal retreat rates being higher, rather than seasonal retreat persisting until later in the year (Fig. 4a). In addition, the 2016 event is not observed in the land- or lake-terminating glaciers on the Barents Sea coast (Fig. S1), further supporting an oceanic trigger. Comparatively low sea ice concentrations were also observed in 2016, but we suggest they did not play a primary role in driving glacier retreat, since: (i) sea ice concentration anomalies were not as exceptional as those for ocean temperatures (Figs 4c–e) and (ii) studies from Greenland suggest that reduced sea ice concentration may elongate the calving season, by delaying the formation of the seasonal ice mélange and/or causing earlier break up (e.g. Amundson and others, Reference Amundson2010; Robel, Reference Robel2017; Amundson and others, Reference Amundson and Burton2018; Todd and others, Reference Todd, Christoffersen, Zwinger, Råback and Benn2019). However, this does not correspond with the observation that retreat in 2016 was high in magnitude, but not in duration (Fig. 4a). Although air temperatures were generally warmer from the 2000s onwards, 2016 was not anomalously warm on the Barents Sea coast (Fig. 4b), and high retreat rates in 2016 persisted until November, long after the end of seasonal melt on Novaya Zemlya in mid-August (Zhao and others, Reference Zhao, Ramage, Semmens and Obleitner2014). This suggests that air temperatures are not directly driving marine-terminating outlet glacier retreat. However, they may play a role via the enhancement of ocean melting due to plume activity (e.g. Vieli and others, Reference Vieli and Nick2011; Straneo and others, Reference Straneo2012; Straneo and others, Reference Straneo2013; Catania and others, Reference Catania, Stearns, Moon, Enderlin and Jackson2020) and/or via their longer-term impacts on ice thinning rates and surface mass balance (discussed in Section 4.3). Enhanced glacier retreat also coincided with high rates of mass loss from the RHA as a whole (Jakob and Gourmelen, Reference Jakob and Gourmelen2023), suggesting that the observed changes in oceanic forcing had widespread impacts across the region and were the primary trigger of observed retreat.
High resolution frontal position data were not available for the pause in retreat between 2013 and 2015. However, ocean temperatures were anomalously cool at both 5 and 92 m depth in 2014 (Figs 4d, e) and this was the only ‘cool’ anomaly from 2007 onwards (Figs 8c, e). Thus, we suggest that ocean temperatures were likely responsible for the 2013–2015 pause, as well as the high retreat rates in 2016. This is likely due to a combination of enhanced basal melting across the glacier fronts, due to warmer ocean temperatures, and undercutting of the glacier termini leading to enhanced calving, (e.g. Benn and others, Reference Benn, Warren and Mottram2007; Straneo and others, Reference Straneo2012; O'Leary and others, Reference O'Leary and Christoffersen2013; Straneo and others, Reference Straneo2013; Todd and others, Reference Todd, Christoffersen, Zwinger, Råback and Benn2019) given that the glaciers do not have substantial floating sections (Carr and others, Reference Carr, Stokes and Vieli2014). These cooler ocean temperatures and reduced retreat rates also coincided with low rates of ice loss across the Russian High Arctic as a whole in 2014 and 2015, (Wouters and others, Reference Wouters, Gardner and Moholdt2019; Hugonnet and others, Reference Hugonnet2021; Jakob and Gourmelen, Reference Jakob and Gourmelen2023). Overall, our data suggest that ocean temperatures are the primary control on marine-terminating outlet glacier retreat in the Barents Sea and that the glacier termini respond very rapidly (with ~1 year) to changes in forcing. Furthermore, previous work has documented a 1.5-year response time between changes in ocean and/or atmospheric forcing and thinning rates on Novaya Zemlya (Tepes and others, Reference Tepes, Nienow and Gourmelen2021b). This suggests that the Novaya Zemlya is highly responsive to climate forcing, via both terminus retreat and glacier thinning, particularly on the Barents Sea coast.
On the Kara Sea coast, the relationship between forcing factors and glacier retreat is less clear than for the Barents Sea. As on the Barents Sea, our data show a shift to warmer air and ocean temperatures and reduced sea ice concentrations from the mid-2000s onwards (Figs 6–8). However, the main phases of retreat in the high-resolution terminus data occur in 2018, 2019 and 2020, when ocean and air temperatures on the Kara Sea coast were comparable to those in 2013 and 2014, when glacier retreat was substantially reduced (Fig. 5). Furthermore, warm ocean temperatures in 2016 do not correspond to enhanced glacier retreat on the Kara Sea coast (Fig. 5). We suggest that this difference in glacier responsiveness is due to the Kara Sea glaciers being more remote from warm Atlantic Water than those on the Barents Sea coast. This is consistent with previous work which has suggested that ocean forcing explains 59% of the difference in mass loss between the Barents and Kara Sea coasts, between 2010 and 2018 (Tepes and others, Reference Tepes, Nienow and Gourmelen2021b). Thus, we suggest that ocean warming is likely to substantially influence retreat on the Kara Sea coast, but its role is less clear and less immediate than on the Barents Sea.
The importance of ocean forcing in driving Novaya Zemlya glacier retreat agrees with previous findings from three major Svalbard glaciers, which suggested that ocean temperatures were the dominant control on frontal ablation and found limited correlation between air temperature and frontal ablation (Luckman and others, Reference Luckman2015; Holmes and others, Reference Holmes, Kirchner, Kuttenkeuler, Krützfeldt and Noormets2019). Furthermore, there was spatial variability in the relationship between ocean temperature and frontal ablation, which was attributed to differences in Atlantic Water access to the glacier termini (Luckman and others, Reference Luckman2015), and we suggest a similar explanation for the observed differences in responsiveness to ocean forcing between the Barents and the Kara Sea coasts observed in our study (Figs 4, 5, 8). Results from LeConte Glacier, Alaska, have also highlighted the substantial contribution of submarine melt rates to total ice loss and demonstrated that seasonal changes in terminus position tracked changes in water temperatures (Motyka and others, Reference Motyka, Hunter, Echelmeyer and Connor2003), as we observed on the Barents Sea coast glaciers (Fig. 4). In Greenland, previous work has underscored the role of warm Atlantic Water in driving glacier retreat and contributing to spatial variability in glacier behaviour (e.g. Rignot and others, Reference Rignot, Koppes and Velicogna2010; Morlighem and others, Reference Morlighem2017; Catania and others, Reference Catania2018; Catania and others, Reference Catania, Stearns, Moon, Enderlin and Jackson2020). However, the response to ocean forcing we observed on the Barents Sea coast is both more consistent between individual glaciers and faster than observed in Greenland (e.g. Murray and others, Reference Murray2015; Carr and others, Reference Carr, Stokes and Vieli2017b; Bunce and others, Reference Bunce, Carr, Nienow, Ross and Killick2018; Catania and others, Reference Catania2018; Fried and others, Reference Fried2018). Furthermore, the apparent sensitivity of Novaya Zemlya outlet glaciers to oceanic forcing contrasts with findings in the Canadian Arctic, where regional retreat showed no correlation with ocean forcing and, instead, correlated with melt rates (Cook and others, Reference Cook2019). Thus, we suggest that Novaya Zemlya glaciers, particularly on the Barents Sea coast, respond to ocean forcing, as observed in Svalbard, Alaska and Greenland, but that this response is quicker and more consistent than observed in Greenland. This has important implications of Novaya Zemlya's near-future contribution to sea level rise, as its glaciers may rapidly retreat if ocean temperatures continue to warm, whereas these glaciers could, in principle, reduce their contribution to sea level rise in the unlikely event that ocean temperatures cool.
4.3. Does glacier retreat correspond to thinning and what is the direction of this relationship?
Overall, our results suggest that retreat was primarily triggered by warmer ocean temperatures and that episodes of ocean warming determined the timing of major retreat phases, particularly on the Barents Sea coast (Figs 4, 5). However, analysis of thinning data suggests that multi-year thinning may have preconditioned glaciers to retreat in response to this ocean forcing and may also have contributed to the variation in response between individual glaciers. Specifically, our results show a strong relationship between glacier retreat and thinning (Fig. 9). Furthermore, the data suggest that thinning during the preceding ~5 years promotes retreat, whereas retreat only impacts thinning within ~1 year (Fig. 10). We therefore suggest that multi-year thinning, potentially in response to warmer air temperatures since 2005 (Fig. 6) (Tepes and others, Reference Tepes, Nienow and Gourmelen2021b) has preconditioned glaciers on Novaya Zemlya to retreat in response to oceanic warming, by bringing the glaciers closer to flotation and making them more vulnerable to full-thickness fracture and calving (e.g. van der Veen, Reference van der Veen1996, Reference van der Veen1998, Reference van der Veen2002, Reference van der Veen2007; Pfeffer, Reference Pfeffer2007; Joughin and others, Reference Joughin and Alley2011; Vieli and others, Reference Vieli and Nick2011). Our data suggest that glacier retreat correlates with thinning within ~1 year (Fig. 10), most likely as a result of a reduction in buttressing due to loss of a section of the grounded terminus, which in turn leads to increased ice flow and dynamic thinning (e.g. Joughin and others, Reference Joughin, Abdalati and Fahnestock2004). However, thinning data are only available between 2011 and 2020, meaning that we may be missing the longer-term impacts of glacier retreat on dynamic thinning, which can operate over multidecadal timescales on the Greenland Ice Sheet (e.g. Pritchard and others, Reference Pritchard, Arthern, Vaughan and Edwards2009; Price and others, Reference Price, Payne, Howat and Smith2011). Furthermore, our data document the relationship between terminus position, surface elevation change and climatic and oceanic forcing. However, they do not provide insight into the mechanisms by which this ice loss occurred, i.e. the extent to which changes can be attributed to surface mass balance vs calving. Unfortunately, accurate data on basal topography and offshore bathymetry for Novaya Zemlya are very scarce, which limits our ability to investigate calving rates from Novaya Zemlya's outlet glaciers. A potential avenue for future research is to generate basal topography by inverting from high resolution ice velocity data, although the lack of directly measured data to verify these ice thicknesses may limit their reliability and hence our abilities to accurately determine calving rates.
Although we observe commonality in the timing of marine-terminating outlet glacier retreat, particularly on the Barents Sea coast, the magnitude of this retreat varies greatly and this variability is highest during periods of rapid retreat, i.e. 2000–2012 and 2015–2020 (Figs 2, 6a, b). This indicates that glacier specific factors are influencing the magnitude of glacier retreat, after retreat is initially triggered by ocean warming. Previous work on Novaya Zemlya has identified the role of fjord width in modulating retreat on Novaya Zemlya (Carr and others, Reference Carr, Stokes and Vieli2014, Reference Carr, Bell, Killick and Holt2017a), and the role of bed topography has been highlighted in numerous studies on the Greenland Ice Sheet (e.g. Porter and others, Reference Porter2014; Carr and others, Reference Carr2015; Catania and others, Reference Catania2018; Hill and others, Reference Hill, Carr, Stokes and Gudmundsson2018), although Novaya Zemlya's basal topography is largely unquantified, making its role difficult to quantify. However, a further potential contributor to variability in retreat rates between individual glaciers is variability in thinning rates: despite an overall significant correlation between glacier thinning and retreat, we observed spread in this relationship (Fig. 9). We suggest that this spread is due to the specific fjord bathymetry and/or subglacial topography of each glacier. For example, glaciers that have much higher rates of retreat compared to thinning (E.g. KRA, KRI, KRO and VIS; Fig. 9) may have already thinned to floatation and/or off pinning points, meaning that further thinning has limited impact on retreat. Conversely, the impact of thinning on glacier retreat may be lower on specific glaciers (e.g. INO, KRA2, RYK, VYL1) if thinning is partially offset by e.g. glacier retreat into narrower and/or shallower fjords. As such, while Novaya Zemlya glaciers showed commonality in the timing of phases of frontal position change, which we suggest was triggered by ocean forcing, the magnitude of their response is likely modulated by glacier specific factors and multi-year thinning patterns.
5. Conclusions
Our data demonstrate that the pause in retreat on Novaya Zemlya's marine-terminating outlet glaciers between 2013 and 2015 has not persisted and that rapid retreat rates observed in the 2000s have resumed. We see remarkable consistency in the timing of frontal positional change on the Barents Sea coast, both at seasonal and interannual timescales, which we attribute to the glaciers' short fjords and exposure to variability in Atlantic Water conditions immediately offshore. In 2016, glaciers on the Barents Sea coast experienced a large and synchronous retreat event, which occurred via enhanced rates of ice loss, rather than an extended period of seasonal retreat. We attribute this event to anonymously warm ocean temperatures during summer and autumn 2016. We suggest that air temperatures did not directly drive this retreat event, as they were not anomalously warm in 2016 and high retreat rates persisted long past the end of the melt season on Novaya Zemlya. We also tentatively attribute the 2013–2015 pause in retreat to cool ocean temperatures in 2014. On the Kara Sea, interannual changes in glacier frontal position were less synchronous than on the Barents Sea and the response to forcing was less clear, most likely due to their comparative isolation from warm waters in the North Atlantic. Our data suggests that multi-year thinning may condition Novaya Zemlya's outlet glaciers to retreat, in response to periods of warmer ocean temperatures, meaning that warmer air temperatures since the 2000s may be indirectly driving glacier retreat via thinning. Glacier frontal position change predominantly impacts thinning within 1 year, most likely due to the immediate impact of loss of ice buttressing. However, thinning data were only available for 2011–2020, and so longer-term thinning data are needed to investigate whether retreat can cause multi-decadal thinning on Novaya Zemlya, as observed in Greenland. Although glacier frontal position changes showed commonality in timing, the magnitude of the subsequent retreats varied greatly, likely due to glacier specific factors, such as basal topography, fjord bathymetry and thinning rates. Overall, our results show that marine-terminating outlet glaciers on the Barents Sea coast of Novaya Zemlya respond rapidly and synchronously to ocean forcing and may be pre-conditioned for retreat by multi-annual surface thinning, likely due to multi-annual air temperature increases observed in the region since 2005.
Supplementary material
The supplementary material for this article can be found at https://doi.org/10.1017/jog.2023.104.
Data
Climate and ocean data are freely available online and the sources are specified in the methods section. Frontal position data are available on request from the corresponding author (Rachel.carr@newcastle.ac.uk).
Acknowledgements
We thank the editor, Dr Shad O'Neel, and the two reviewers, Prof. Doug Benn and Prof Tad Pfeffer for their supportive and insightful comments. These comments significantly improved the paper.


 Open access