


Introduction
According to the IUPAC definition (Connelly et al., Reference Connelly, Damhus, Hartshorn and Hutton2005), the rare earth elements (REE) consist of a group of 17 elements, comprising the lanthanides (La–Lu or ‘Ln series’), Y and Sc, characterised by a similar geochemical behaviour. REE are conventionally divided into light REE (LREE) and heavy REE (HREE) based on their atomic number. However, there are some complications and several authors have provided different thresholds to separate the two groups (Zepf, Reference Zepf2013). An elegant classification system has been provided by U.S. Geological Survey (2011), based on the electronic configuration of the 4f electron shell: LREE (Ce–Gd) are characterised by unpaired 4f electrons, whereas HREE (Tb–Lu) show paired electrons in the 4f shell; in addition, Y was included as one of the HREE (U.S. Geological Survey, 2011), as its atomic radius is intermediate between those of Ho and Er. REE are used in several applications, including permanent magnets, phosphors, catalytic converters, or as additives in glass and metal alloys. Their mining exploitation is concentrated largely in China (U.S. Geological Survey, 2021) and their commodities export policy has changed significantly in the last decade, with the introduction of export quotas and taxes (Mancheri, Reference Mancheri2015). For their elevated supply risk, all the REE have been classified as ‘critical raw materials’ by the European Commission (Blengini et al., Reference Blengini, Mathieux, Mancini, Nyberg and Viegas2020). Major REE resources are hosted by carbonatites and other alkaline igneous rocks, pegmatites, iron oxide copper–gold deposits, skarn deposits and placers (Balaram, Reference Balaram2019). Hydrothermal alteration of granites and the related pegmatites, as well as the connected mobilisation and concentration of REE minerals, is a phenomenon of which the importance has been reported by several authors (e.g. Andersson, Reference Andersson2019; Cheng et al., Reference Cheng, Zhang, Aibai, Kong and Holtz2018; Migdisov et al., Reference Migdisov, Guo, Nisbet, Xu and Williams-Jones2019). Along with the carbonate bastnäsite (Ce(CO3)F) and common phosphates, i.e. monazite-(Ce) and xenotime-(Y), which are important REE ore minerals (Voncken, Reference Voncken2016), the isostructural arsenates gasparite-(Ce) and chernovite-(Y) have gained increasing attention (e.g. Cabella et al., Reference Cabella, Lucchetti and Marescotti1999; Mancini, Reference Mancini2000; Anthony et al., Reference Anthony, Bideaux, Bladh and Nichols2000; Kolitsch and Holtsam Reference Kolitsch and Holtstam2004a; Ondrejka et al., Reference Ondrejka, Uher, Pršek and Ozdín2007; Breiter et al., Reference Breiter, Čopjaková and Škoda2009; Mills et al., Reference Mills, Kartashov, Kampf and Raudsepp2010; Förster et al., Reference Förster, Ondrejka and Uher2011; Kerbey, Reference Kerbey2013; Papoutsa and Pe-Piper, Reference Papoutsa and Pe-Piper2014; Vereshchagin et al., Reference Vereshchagin, Britvin, Perova, Brusnitsyn, Polekhovsky, Shilovskikh, Bocharov, van der Burgt, Cuchet and Meisser2019). The aforementioned phosphates and arsenates belong to the large family of ATO4 minerals, where A stands for REE, Ca, U and Th, and T stands for tetrahedrally-coordinated cations (As, P and minor Si). The crystal structure of these minerals has been the subject of a large number of studies and reviews (e.g. Mooney, Reference Mooney1948; Boatner, Reference Boatner, Kohn, Rakovan and Hughes2002; Ni et al., Reference Ni, Hughes and Mariano1995; Kolitsch and Holtstam, Reference Kolitsch and Holtstam2004b; Clavier et al., Reference Clavier, Podor and Dacheux2011). These ATO4 compounds show two possible structural arrangements (Fig. 1): a monoclinic monazite-type structure (Fig. 1a) and a tetragonal zircon-type (also known as ‘xenotime-type’) structure (Fig. 1b). Chernovite-(Y), the zircon-type structured HREE-bearing arsenate, is a rare mineral; its crystal structure was first solved from the synthetic counterpart YAsO4 (Strada and Schwendimann, Reference Strada and Schwendimann1934). The mineral chernovite-(Y) was first described from the Nyarta-Sya-Yu River, Urals (Goldin et al., Reference Goldin, Yushkin and Fishman1967), and later found at the Mt. Cervandone mineral deposit in the Western Alps, Italy, as a solid solution between chernovite-(Y) and xenotime-(Y) (Graeser et al., Reference Graeser, Schwander and Stalder1973). Chernovite-(Y) has been recovered as an accessory mineral in hydrothermal environments, commonly found as an alteration product of minerals within A-type granites and gneisses (Breiter et al., Reference Breiter, Čopjaková and Škoda2009, Förster et al., Reference Förster, Ondrejka and Uher2011, Papoutsa and Pe-Piper, Reference Papoutsa and Pe-Piper2014, Li et al., Reference Li, Zhou and Williams-Jones2019) and within reduction spots in slates by Kerbey (Reference Kerbey2013). Microcrystalline YAsO4, along with LaAsO4 (i.e. gasparite-(La)), were also detected within the Fe–Mn deposits of the Corsaglia Valley, Maritime Alps, Italy (Cabella et al., Reference Cabella, Lucchetti and Marescotti1999). In addition Mills et al. (Reference Mills, Kartashov, Kampf and Raudsepp2010) reported the presence of chernovite-(Y) along with arsenoflorencite-(La) in Mn-rich nodules from the Grubependity Lake cirque, Komi Republic, Urals.
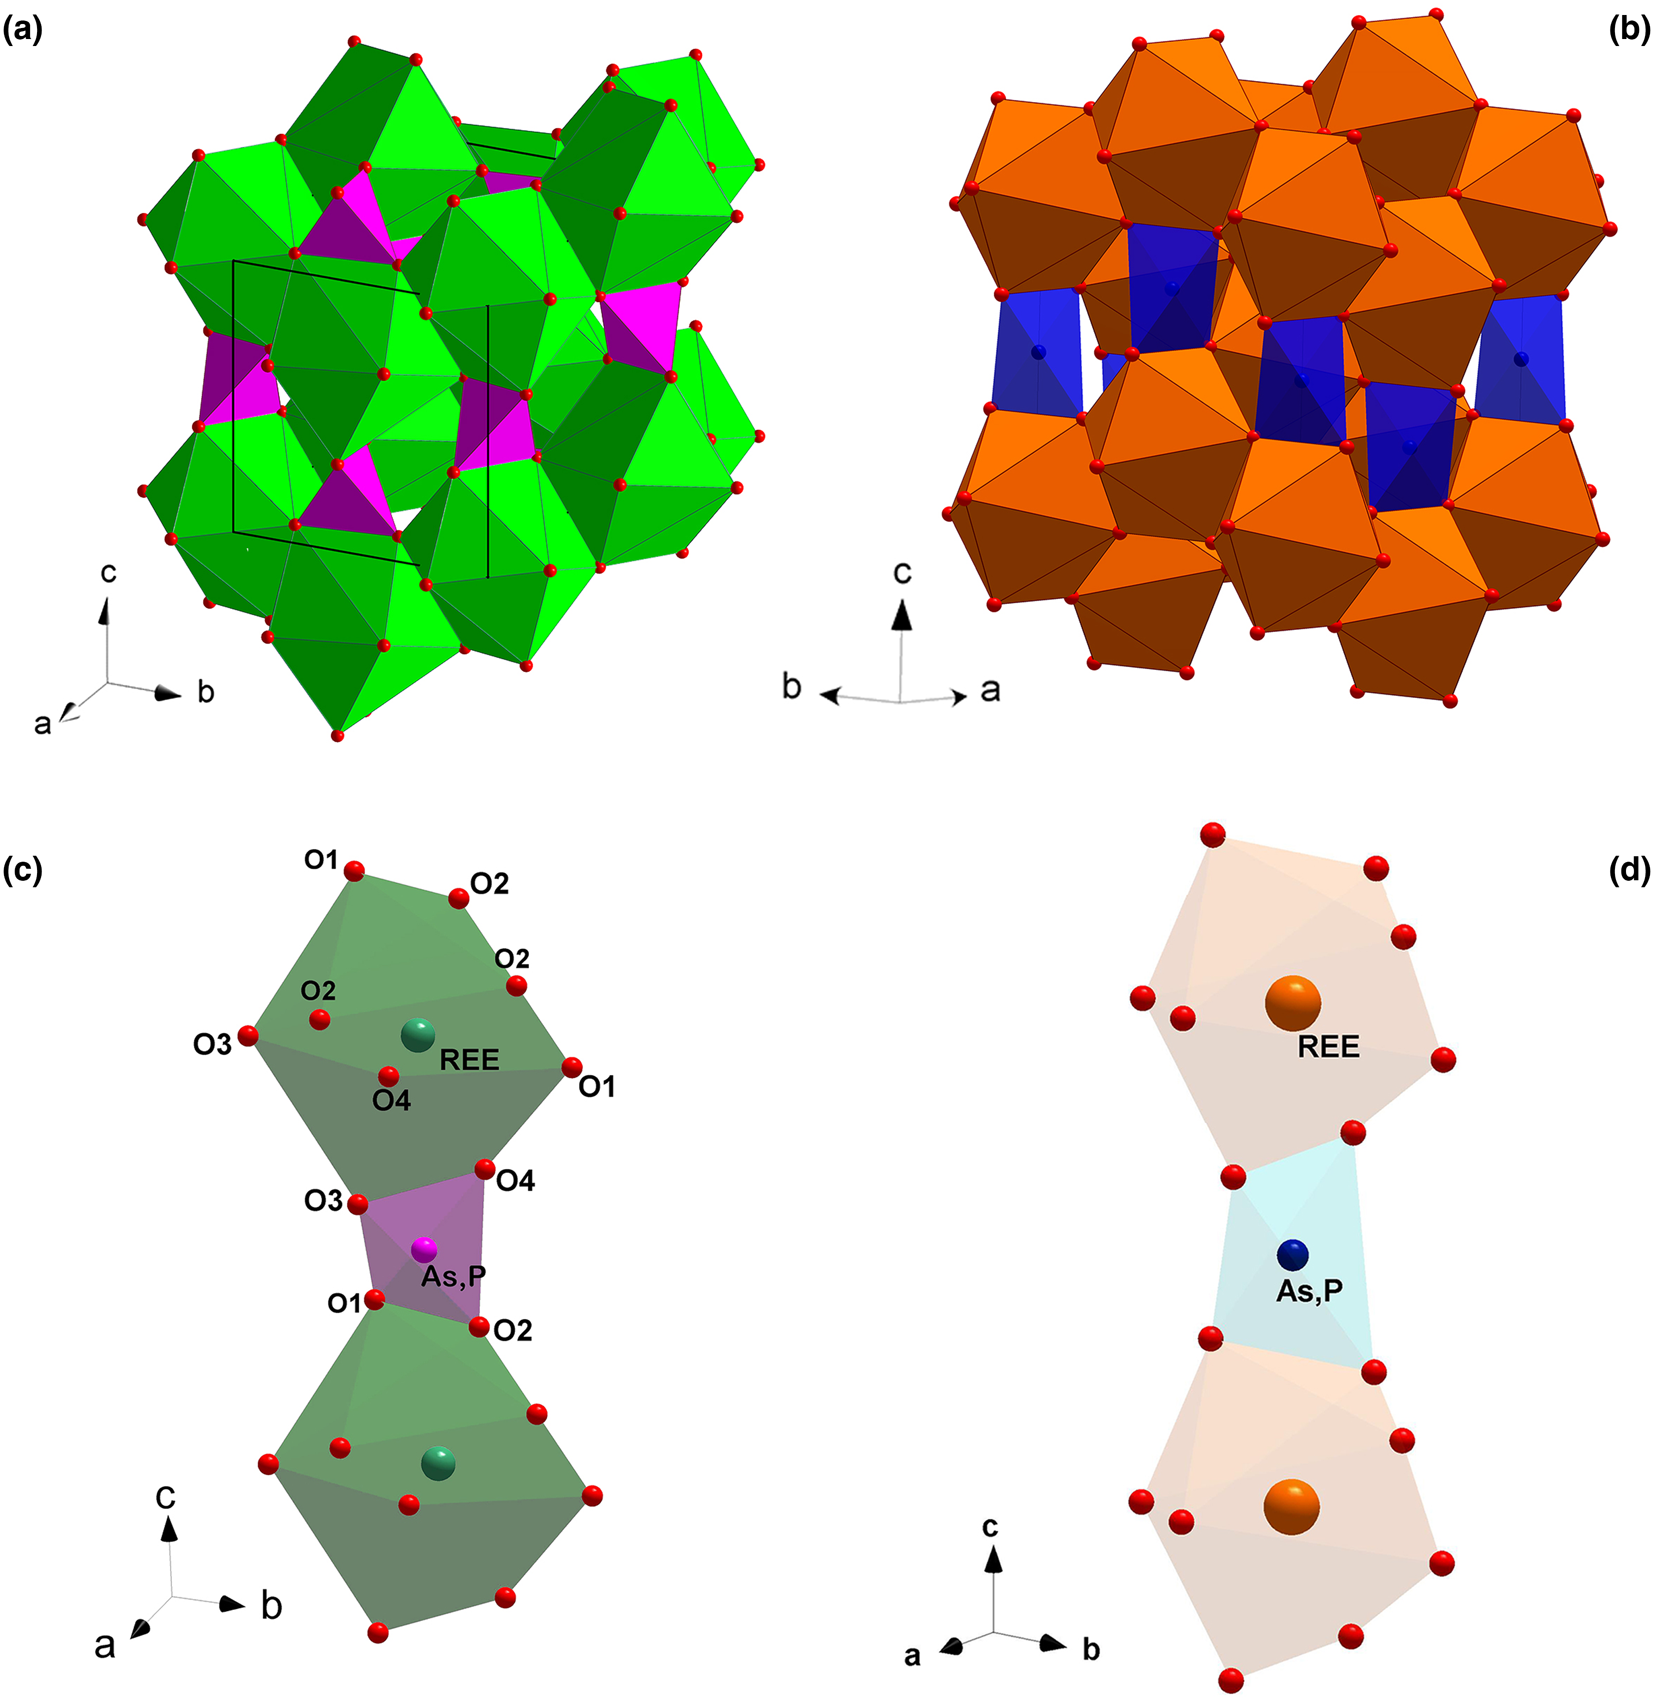
The monazite-type (a) and the zircon-type crystal structures (b); (REE)-polyhedra and (P,As)-tetrahedra making the chains parallel to [001] in the monazite-type (c) and zircon-type structures (d).
The As-bearing analogue of monazite, a monoclinic arsenate, was also first described on the basis of the synthetic counterpart by Beall et al. (Reference Beall, Boatner, Mullica and Milligan1981). It was first described in nature as gasparite-(Ce) by Graeser and Schwander (Reference Graeser and Schwander1987) and more recently also found as gasparite-(La) by Vereshchagin et al. (Reference Vereshchagin, Britvin, Perova, Brusnitsyn, Polekhovsky, Shilovskikh, Bocharov, van der Burgt, Cuchet and Meisser2019). A solid solution between monazite-(Ce) and gasparite-(Ce) has been found to occur at the Kesebol Mn–Fe–Cu deposit, Västra Götaland, Sweden (Kolitsch and Holtsman, Reference Kolitsch and Holtstam2004a) and within the Tisovec–Rejkovo rhyolite, Slovakia (Ondrejka et al., Reference Ondrejka, Uher, Pršek and Ozdín2007). However, all the studies conducted so far on the samples from Mt. Cervandone, Italy, show the presence of a miscibility gap between the arsenate and phosphate end-members (Graeser and Schwander, Reference Graeser and Schwander1987; Demartin et al., Reference Demartin, Pilati, Diella, Donzelli and Gramaccioli1991). Monazite and xenotime are two of the most widespread REE-bearing minerals and are, along with the carbonate bastnäsite (Ce(CO3)F), the major ores exploited for REE. Monazite-(Ce) represents the most common form of monazite, whereas the natural La-, Nd- and Sm-dominant forms are fairly rare (Fleischer and Altschuler, Reference Fleischer and Altschuler1969; Rosenblum and Fleischer, Reference Rosenblum and Fleischer1995; Long et al., Reference Long, Van Gosen, Foley, Cordier, Sinding-Larsen and Wellmer2012). Monazite-(Ce) is a rather common accessory mineral in different geological settings, including granites, aluminous metamorphic rocks (e.g. amphibolites or medium- to high-grade pelitic rocks), carbonatites, pegmatites and hydrothermal veins (Cesbron, Reference Cesbron, Möller, Černý and Saupé1989). Moreover, monazite-(Ce) is also a common detrital mineral in sedimentary placers and a newly formed phase during diagenesis (Sengupta and Van Gosen, Reference Sengupta, Van Gosen, Verplanckand and Hitzman2016; Čopjaková et al., Reference Čopjaková, Novák and Franců2011). Xenotime-(Y) is an accessory component in several metasedimentary or igneous rocks, hydrothermal systems and early diagenesis environments (Spear and Pyle, Reference Spear, Pyle, Kohn, Rakovan and Hughes2002; Richter et al., Reference Richter, Diamond, Atanasova, Banks and Gutzmer2018).
In this work, focused on the case study of the Alpine quartz fissures (related to pegmatites overprinted by amphibolite facies) of Mt. Cervandone, the crystal chemistry and structure of chernovite-(Y), gasparite-(Ce), xenotime-(Y) and monazite-(Ce) is reinvestigated using electron probe microanalysis in wavelength dispersion spectroscopy mode (EPMA-WDS) and single-crystal X-ray diffraction. In addition, a comparative analysis of the crystal chemistry of chernovite-(Y), on the basis of literature data (Breiter et al., Reference Breiter, Čopjaková and Škoda2009; Förster et al., Reference Förster, Ondrejka and Uher2011; Kerbey, Reference Kerbey2013, Papoutsa and Pe-Piper, Reference Papoutsa and Pe-Piper2014; Li et al., Reference Li, Zhou and Williams-Jones2019) is given. This study is part of a broader project aimed at improving the knowledge on the hydrothermal mineral deposit of Mt. Cervandone and the role of REE on the minerals phase stability and structure-related properties (Gatta et al., Reference Gatta, Milani, Corti, Comboni, Lotti, Merlini and Liermann2019; Reference Gatta, Pagliaro, Lotti, Guastoni, Cañadillas-Delgado, Fabelo and Gigli2021).
Crystal structure of chernovite-(Y), gasparite-(Ce), xenotime-(Y) and monazite-(Ce)
The aforementioned ATO4 minerals crystalise in a monoclinic monazite-type or in a tetragonal xenotime-type structure. The two structural models share a similar topology, characterised by the presence of chains, running along the [001] direction, made by the alternation of (REE)-polyhedra and tetrahedral units, the latter occupied mainly by As and P (Fig. 1c and d, respectively). In the monazite-type structure, space group P21/n, the REE cation is ninefold-coordinated in a distorted polyhedron (Clavier et al., Reference Clavier, Podor and Dacheux2011). REEO9-polyhedra and (As,P)-tetrahedra are edge-sharing connected to form infinite chains running along the c axis (Fig. 1c). The tetragonal zircon-type structure, space group I41/amd, shows the alternation of 8-coordinated (REE) polyhedra and tetrahedra, giving rise to infinite chains along [001] (Fig. 1d). Within the REE-bearing phosphates, the larger and lighter REE ranging from La to Eu are hosted preferentially by the monazite-type structure, whereas the smaller and heavier REE, from Tb to Lu, and including Y and Sc, fit best into the zircon-type structure (Mooney, Reference Mooney1948; Boatner, Reference Boatner, Kohn, Rakovan and Hughes2002; Ni et al., Reference Ni, Hughes and Mariano1995; Kolitsch and Holtstam, Reference Kolitsch and Holtstam2004b; Clavier et al., Reference Clavier, Podor and Dacheux2011). For synthetic Gd, Tb and Dy phosphates, the possible presence of two coexisting polymorphs is observed: they may crystallise in both monazite- and zircon-type structures. A similar behaviour has been reported for the REEAsO4 series: the monoclinic structure preferentially hosts the larger REE (from La to Nd), whereas the smaller REE (from Sm to Lu, as well as Y and Sc) are hosted preferentially by the tetragonal crystal structure (Ushakov et al., Reference Ushakov, Helean, Navrotsky and Boatner2001; Boatner et al., Reference Boatner, Kohn, Rakovan and Hughes2002).
Geological background
The Mt. Cervandone mineral deposit is renowned for the discoveries of several REE-bearing minerals. These minerals are hosted within Alpine fissures in quartz veins (e.g. Graeser and Albertini, Reference Graeser and Albertini1995), closely related to pegmatitic dykes (Guastoni et al., Reference Guastoni, Pezzotta and Vignola2006). These dykes, tens of cm thick, intrude fine-grained two-mica leucocratic gneisses, metamorphosed under amphibolite-facies conditions (Dal Piaz, Reference Dal Piaz1975), and extend for hundreds of metres within the ‘Mount Leone–Arbola’ nappe, being concordant with the gneiss schistosity. The dykes show a pegmatitic texture and a strong NYF (niobium–yttrium–fluorine) chemical signature (Černý, Reference Černý1991a,Reference Černýb; Ercit et al., Reference Ercit, Linnen and Samson2005; Černý and Ercit, Reference Černý and Ercit2005), which is reflected in the formation of Be–As–Nb–REE minerals, represented here by allanite-(Ce) and REE-bearing carbonates, arsenates, phosphates and oxides. Locally, the pegmatitic dykes are interrupted by discordant, subvertical quartz veins, composed mainly by vitreous and smoky quartz and muscovite. These quartz veins commonly contain open Alpine-type fissures, which host several REE-bearing accessory minerals, including cafarsite, synchysite-(Ce), chernovite-(Y), gasparite-(Ce), xenotime-(Y) and monazite-(Ce). Rutile, magnetite, hematite, titanite and tourmaline represent other common accessory minerals within these fissures. During the Alpine orogenic event, the circulation of hydrothermal fluids within the pegmatitic dykes, strongly enriched in arsenic, led to the mobilisation of Y, Nb, Ta, REE, Th and U. Subsequently, the circulating hydrothermal fluids led to the formation of the aforementioned quartz veins with the concomitant precipitation of As-, P- and REE-enriched minerals (Guastoni et al., Reference Guastoni, Pezzotta and Vignola2006; Gatta et al., Reference Gatta, Rotiroti, Cámara and Meven2018).
Unfortunately, no data on the temperatures of the hydrothermal fluids of this area are available. The discussion of the experimental data (below), is somewhat hindered by the complexity of the geological evolution of the area, characterised by several different phases and fluids of different nature within the vein system.
Materials and methods
Fourteen rock specimens, from different Alpine quartz fissures, cropping out at Mt. Cervandone, containing REE-bearing arsenates and phosphates, have been selected for this investigation. They were first observed under a stereomicroscope to identify their mineralogical assemblage, which was later confirmed by single-crystal X-ray diffraction. Table 1 reports the mineral association within each rock sample, coupled with a specific label for the REE-bearing minerals. Fifteen REE-bearing phosphate and arsenate crystals have been selected and extracted from the fourteen rock specimens under study (see Table 1), and then characterised by means of electron probe microanalysis in wavelength dispersion spectroscopy mode (EPMA-WDS) and single-crystal X-ray diffraction.
Mineralogical assemblage of each sample from the quartz Alpine-fissures of Mt. Cervandone (quartz is ubiquitous and not reported), identified by single-crystal X-ray diffraction, except for the ThSiO4 grains.

Sample description
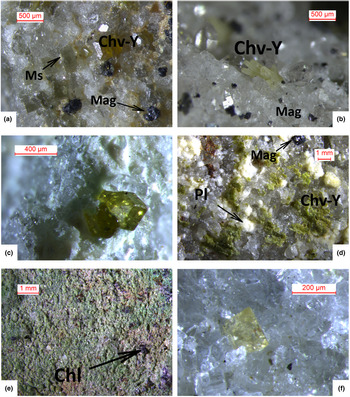
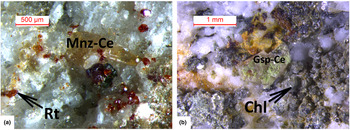
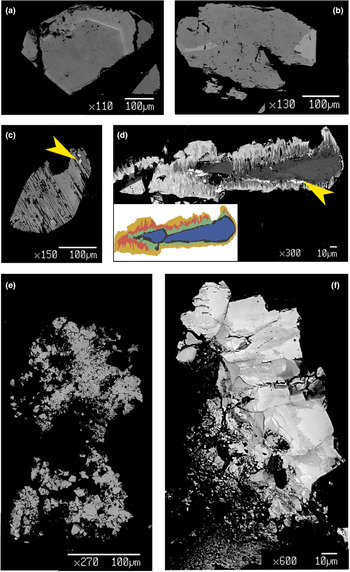
Chernovite-(Y) occurs as idiomorphic bipyramidal or prismatic crystals, as well as micrometric aggregates (Fig. 2). Bipyramidal crystals represent the most common form: they were identified within the samples Ch6, Ch7, Ch8, Ch9, Ch10 (Fig. 2a), Ch12 (Fig. 2c) and Ch13. Xenotime-(Y) also has a bipyramidal habit (Fig. 2f). Chernovite-(Y) forms idiomorphic crystals such as Ch11 (Fig. 2b) and Ch12 (Fig. 2c) or Ch13 and Ch16, ranging from 40 μm to 2 mm in size (Fig. 2d,e). Among the chernovites-(Y) crystals, only the Ch11 sample (Fig. 2b) shows a prismatic habit. The three monazite-(Ce) samples are euhedral and vitreous orangish aggregates (or millimetric crystals) (Fig. 3a), coupled with anhedral aggregates in Mon2 and Mon14. The samples of gasparite-(Ce) are characterised by brownish to green crystals (3 to 20 μm in diameter, Fig. 3b) clustered in aggregates. Both samples of gasparite-(Ce) under investigation were formed by replacement of barrel-shaped crystals of synchysite-(Ce).
Photographs of selected samples from the Alpine quartz fissures of Mt. Cervandone bearing REE-phosphates and -arsenates: (a) yellow Ch10 chernovite-(Y) sample with magnetite and muscovite on quartz; (b) prismatic Ch11 chernovite-(Y) sample with magnetite grains on quartz; (c) yellow Ch12 chernovite-(Y) sample on quartz; (d) greenish microcrystals of Ch16 chernovite-(Y) sample, with plagioclase and magnetite, on quartz; (e) M-C13 orthogneiss lined with several Ch13 chernovite-(Y) microcrystals and few grains of clinochlore; (f) bipyramidal crystal of Xen14 xenotime-(Y) on quartz (see also Table 1). [Chv-Y: chernovite-(Y); Mag: magnetite; Ms: muscovite; Pl: plagioclase; Chl: clinochlore. Warr (Reference Warr2021)].
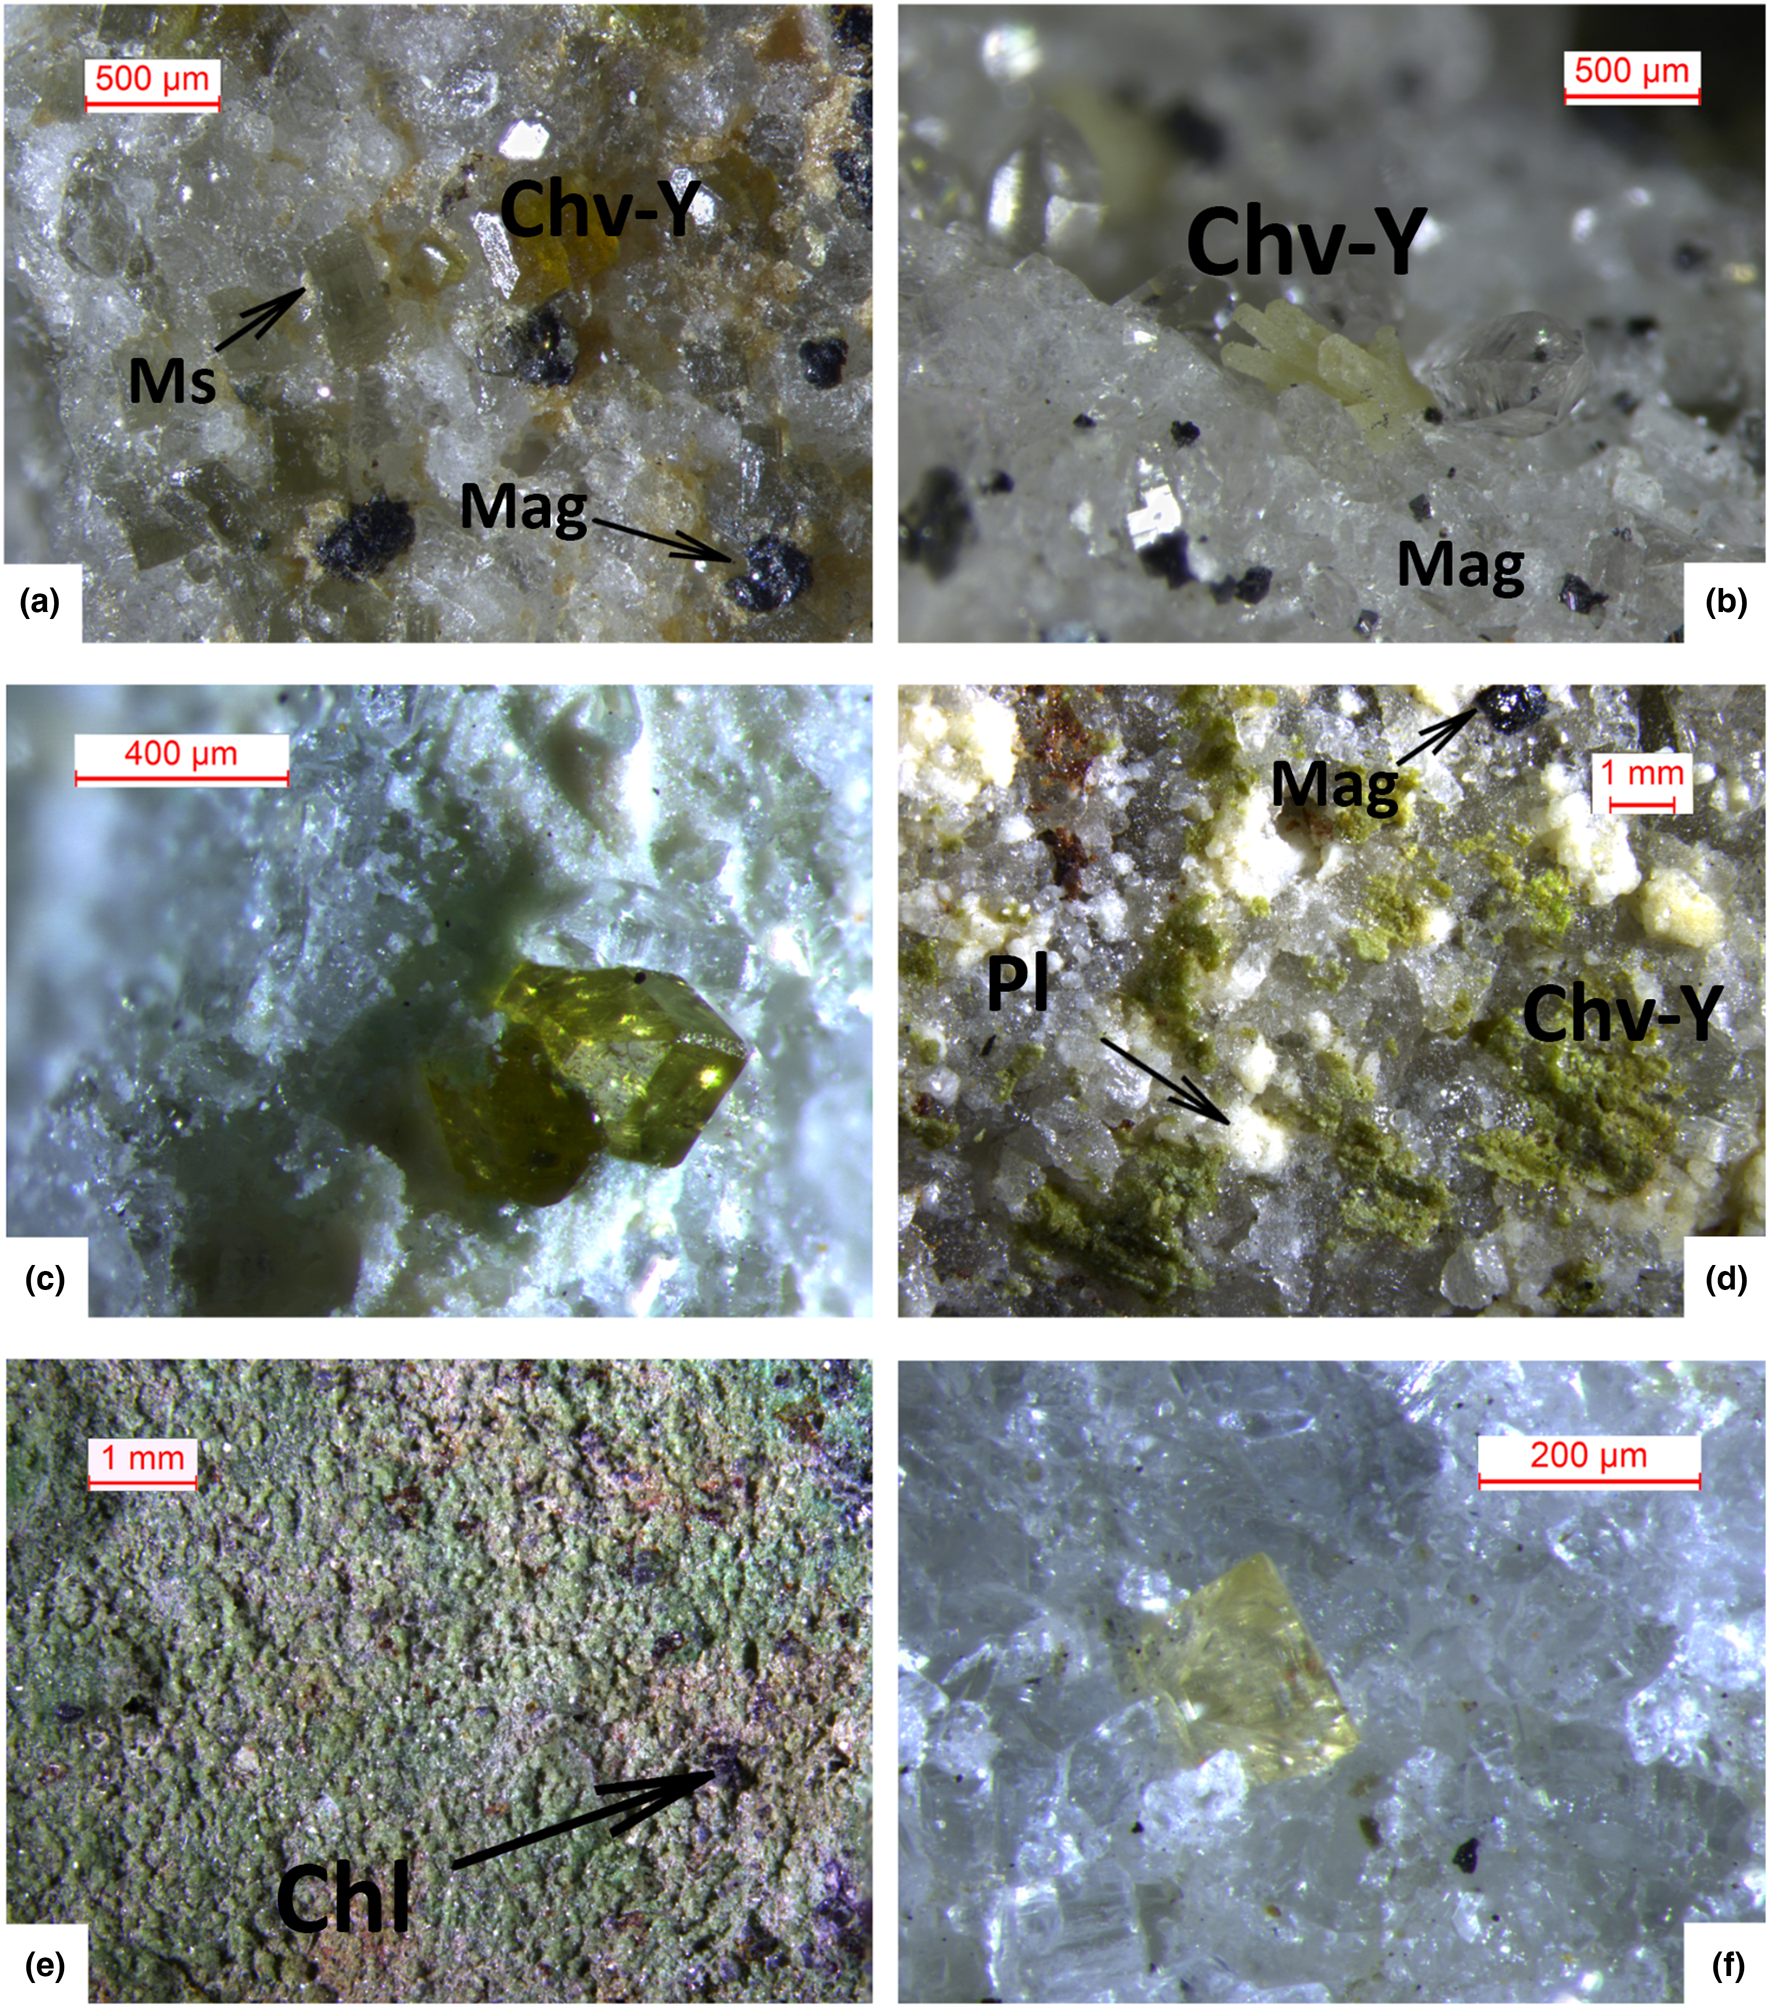
Photographs of two samples of the gasparite-(Ce)–monazite-(Ce) series: (a) Mon2 monazite-(Ce) sample, with rutile (red); (b) greenish, barrel-shape Gasp4 gasparite-(Ce) sample, pseudomorph after synchysite-(Ce), with clinochlore grains, on quartz. [Rt: rutile; Mnz-Ce: monazite-(Ce); Gsp-Ce: gasparite-(Ce); Chl: clinochlore. Warr, Reference Warr2021].

Electron microprobe analysis
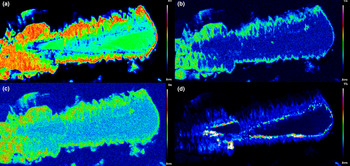
The chemical composition of the REE-bearing phosphates and arsenates investigated was determined using a JEOL JXA–8200 electron microprobe at the Earth Sciences Dept. of the University of Milano (ESD-MI), operating in WDS mode with a focused beam (~5 μm in diameter), an acceleration voltage of 20 kV and a beam current of 20 nA. The counting time was set to 30 s for peaks and 10 s for the background. Correction for matrix effects was applied using the PhiRhoZ method, as implemented in the JEOL suite of programs. The following natural and synthetic standards (with spectral lines) were used: grossular (CaKα and SiKα), nickeline (AsKα), synthetic YPO4 (YLα and PKα), synthetic Ln(PO4) set (LaLα, CeLα, PrLα, NdLα, SmLα, EuLα, GdLα, TbLα, DyLα, HoLα, ErLα, TmLα, YbLα and LuLα), synthetic UO2 (UMβ), synthetic ThO2 (ThMα) and galena (PbMα). Back-scattered (BSE) images were acquired (Fig. 4), together with EDS compositional maps for the Ch11 sample, detailing the concentrations of As, Ce, Sm and Th (Fig. 5). The average chemical composition for all the samples (excluding the more heterogeneous Ch13 and Ch16 specimens) is reported in Table 2. The chemical composition, expressed as oxide wt.% and atoms per formula unit (apfu), pertaining to all the analytical points, is reported in Supplementary material (Tables S1–S15).
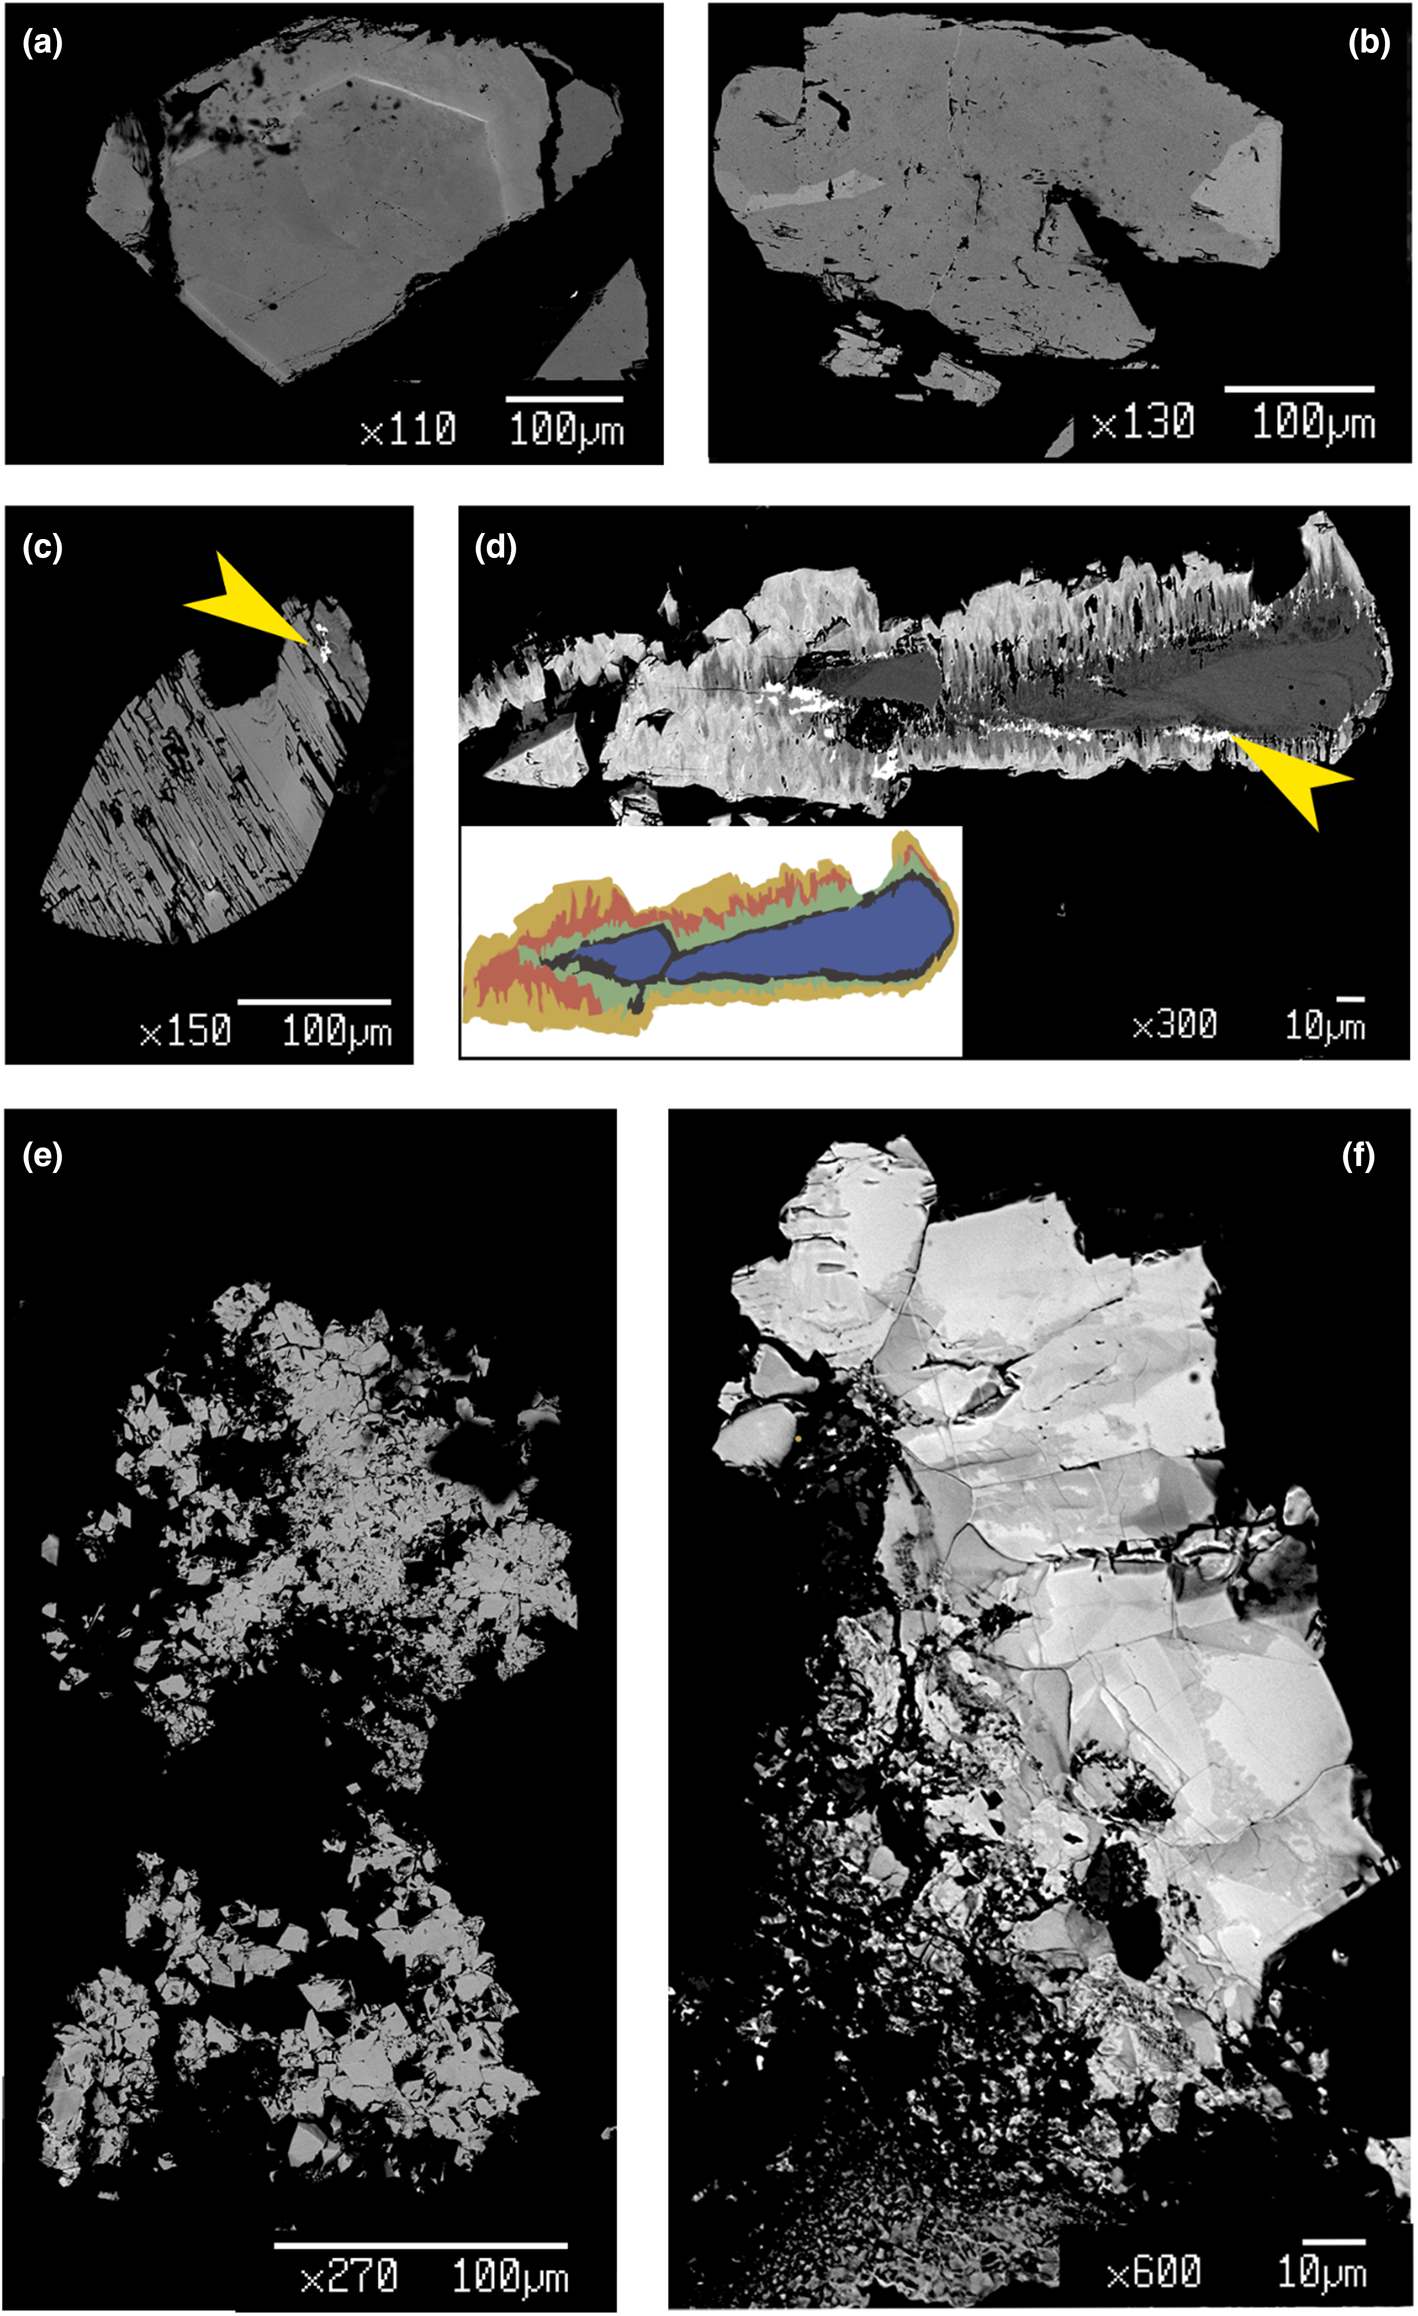
BSE images of selected samples under investigation: (a) quasi-homogeneous crystal of Ch10, containing a brighter ThSiO4-enriched level; (b) crystal of Mon2 monazite-(Ce) sample, showing brighter domains characterized by a higher Th content; (c) chemically-homogeneous and fractured Xen14 xenotime-(Y) sample, containing ThSiO4 grains (indicated by the yellow arrow); (d) highly zoned Ch11 sample, showing five main domains highlighted with different colours in the insert (see Fig. 5 and text), with ThSiO4 grains indicated by the yellow arrow; (e) gasparite-(Ce) sample, Gasp3, comprising several microcrystals (~10 μm size); (f) highly-zoned Ch16 chernovite-(Y) sample, containing P-enriched darker patchy domains and brighter As-enriched domains, separated by lobate interface.
Compositional maps for the Ch11 chernovite-(Y) sample, showing the distribution of (a) As, (b) Ce, (c) Sm and (d) Th.

Average chemical composition (expressed in oxide wt.% and in atoms per formula unit (apfu) calculated on the basis of 4 oxygen atoms) of all the samples under investigation (except for the heterogeneous Ch13 and Ch16 specimens, the compositions of which are reported in Table S12 and Table S15, respectively). For the sample Ch11, the average composition of four distinct domains is reported as Ch11a (P-enriched core), Ch11b (P- and Th-enriched intermediate zone), Ch11c (P-depleted and Th-enriched intermediate zone) and Ch11d (P-depleted and LREE-enriched outer rim) [see text and Figs 4, 5 for further details].

b.d.l.: below the detection limit
(Continued)

b.d.l.: below the detection limit
(Continued)

b.d.l.: below the detection limit
Single-crystal X-ray diffraction and structure refinement protocol
The single-crystal X-ray diffraction experiments were performed at the ESD-MI using a Rigaku XtaLAB Synergy-S diffractometer, equipped with a HyPix–6000HE HPC area detector and a PhotonJet-S Mo-Kα (λ=0.71073 Å) microsource, operating at 50 kV and 1 mA. Each data collection was performed using a sample-to-detector distance of 62 mm and a step-scan width of 0.5°. The crystal size of all the samples investigated and the exposure times are reported in Supplementary Table S16. For all the collected datasets, indexing of the diffraction peaks, unit-cell refinement and intensity data reduction were performed using the CrysAlisPro software (Rigaku Oxford Diffraction, 2019). The unit-cell parameters for all the samples under investigation are reported in Table 3.
Unit-cell parameters of all the samples under investigation.

The structure refinements were performed using the Jana2006 software (Petříček et al., Reference Petříček, Dušek and Palatinus2014), starting from the models reported by Strada and Schwendimann (Reference Strada and Schwendimann1934) for chernovite-(Y), Ni et al. (Reference Ni, Hughes and Mariano1995) for xenotime-(Y), Kolitsch and Holtsman (Reference Kolitsch and Holtstam2004a) for gasparite-(Ce) and Ni et al. (Reference Ni, Hughes and Mariano1995) for monazite-(Ce). The site occupancy factors of the A (REE-bearing) and tetrahedral sites were fixed according to the average chemical composition obtained from WDS analysis for each crystal sample (Table 2), leaving out the elements with a low concentration and assuming a full occupancy for both the sites. For the Ch11 and Ch13 samples, characterised by a significant chemical variability (Figs 4, 5; Supplementary Tables S10, S12), the same strategy has been followed, however the relative occupancies of the different chemical species have been varied (keeping the consistency with the measured chemical data) in order to obtain the best figures of merit of the structure refinements. Each structure refinement was performed adopting anisotropic displacement parameters. All the refinements converged with no significant correlations among the refined variables. The refined structure models are deposited as crystallographic information files and are available as Supplementary material (see below). Some relevant structural features, including the interatomic bond distances and the volumes of the coordination polyhedra, are reported in Table 4.
A–O and T–O bond distances (in Å), volumes of A- and T-coordination polyhedra (in Å3) and distortion index (DI, calculated using the routine implemented in the software Vesta 3, Momma and Izumi, Reference Momma and Izumi2011), based on the structure refinements conducted on all the samples.

Results and discussion
Chemical composition and REE pattern
The average chemical composition of the samples Mon1, Mon2, Gasp3, Gasp4, Ch6, Ch7, Ch8, Ch9, Ch10, Ch11, Ch12, Xen14 and Mon14 are given in Table 2, while Supplementary Tables S12 and S15 report the results from each point analysis of the chemically heterogeneous samples, Ch13 and Ch16. For Ch11, the average chemical compositions of four domains, identified from EPMA compositional maps (Fig. 5), are labelled as Ch11a Ch11b, Ch11c and Ch11d. Thorium shows the most variable content, for both zircon- and monazite-type minerals. The enrichment of Th within the REETO4 compounds is controlled by two potential substitution mechanisms:


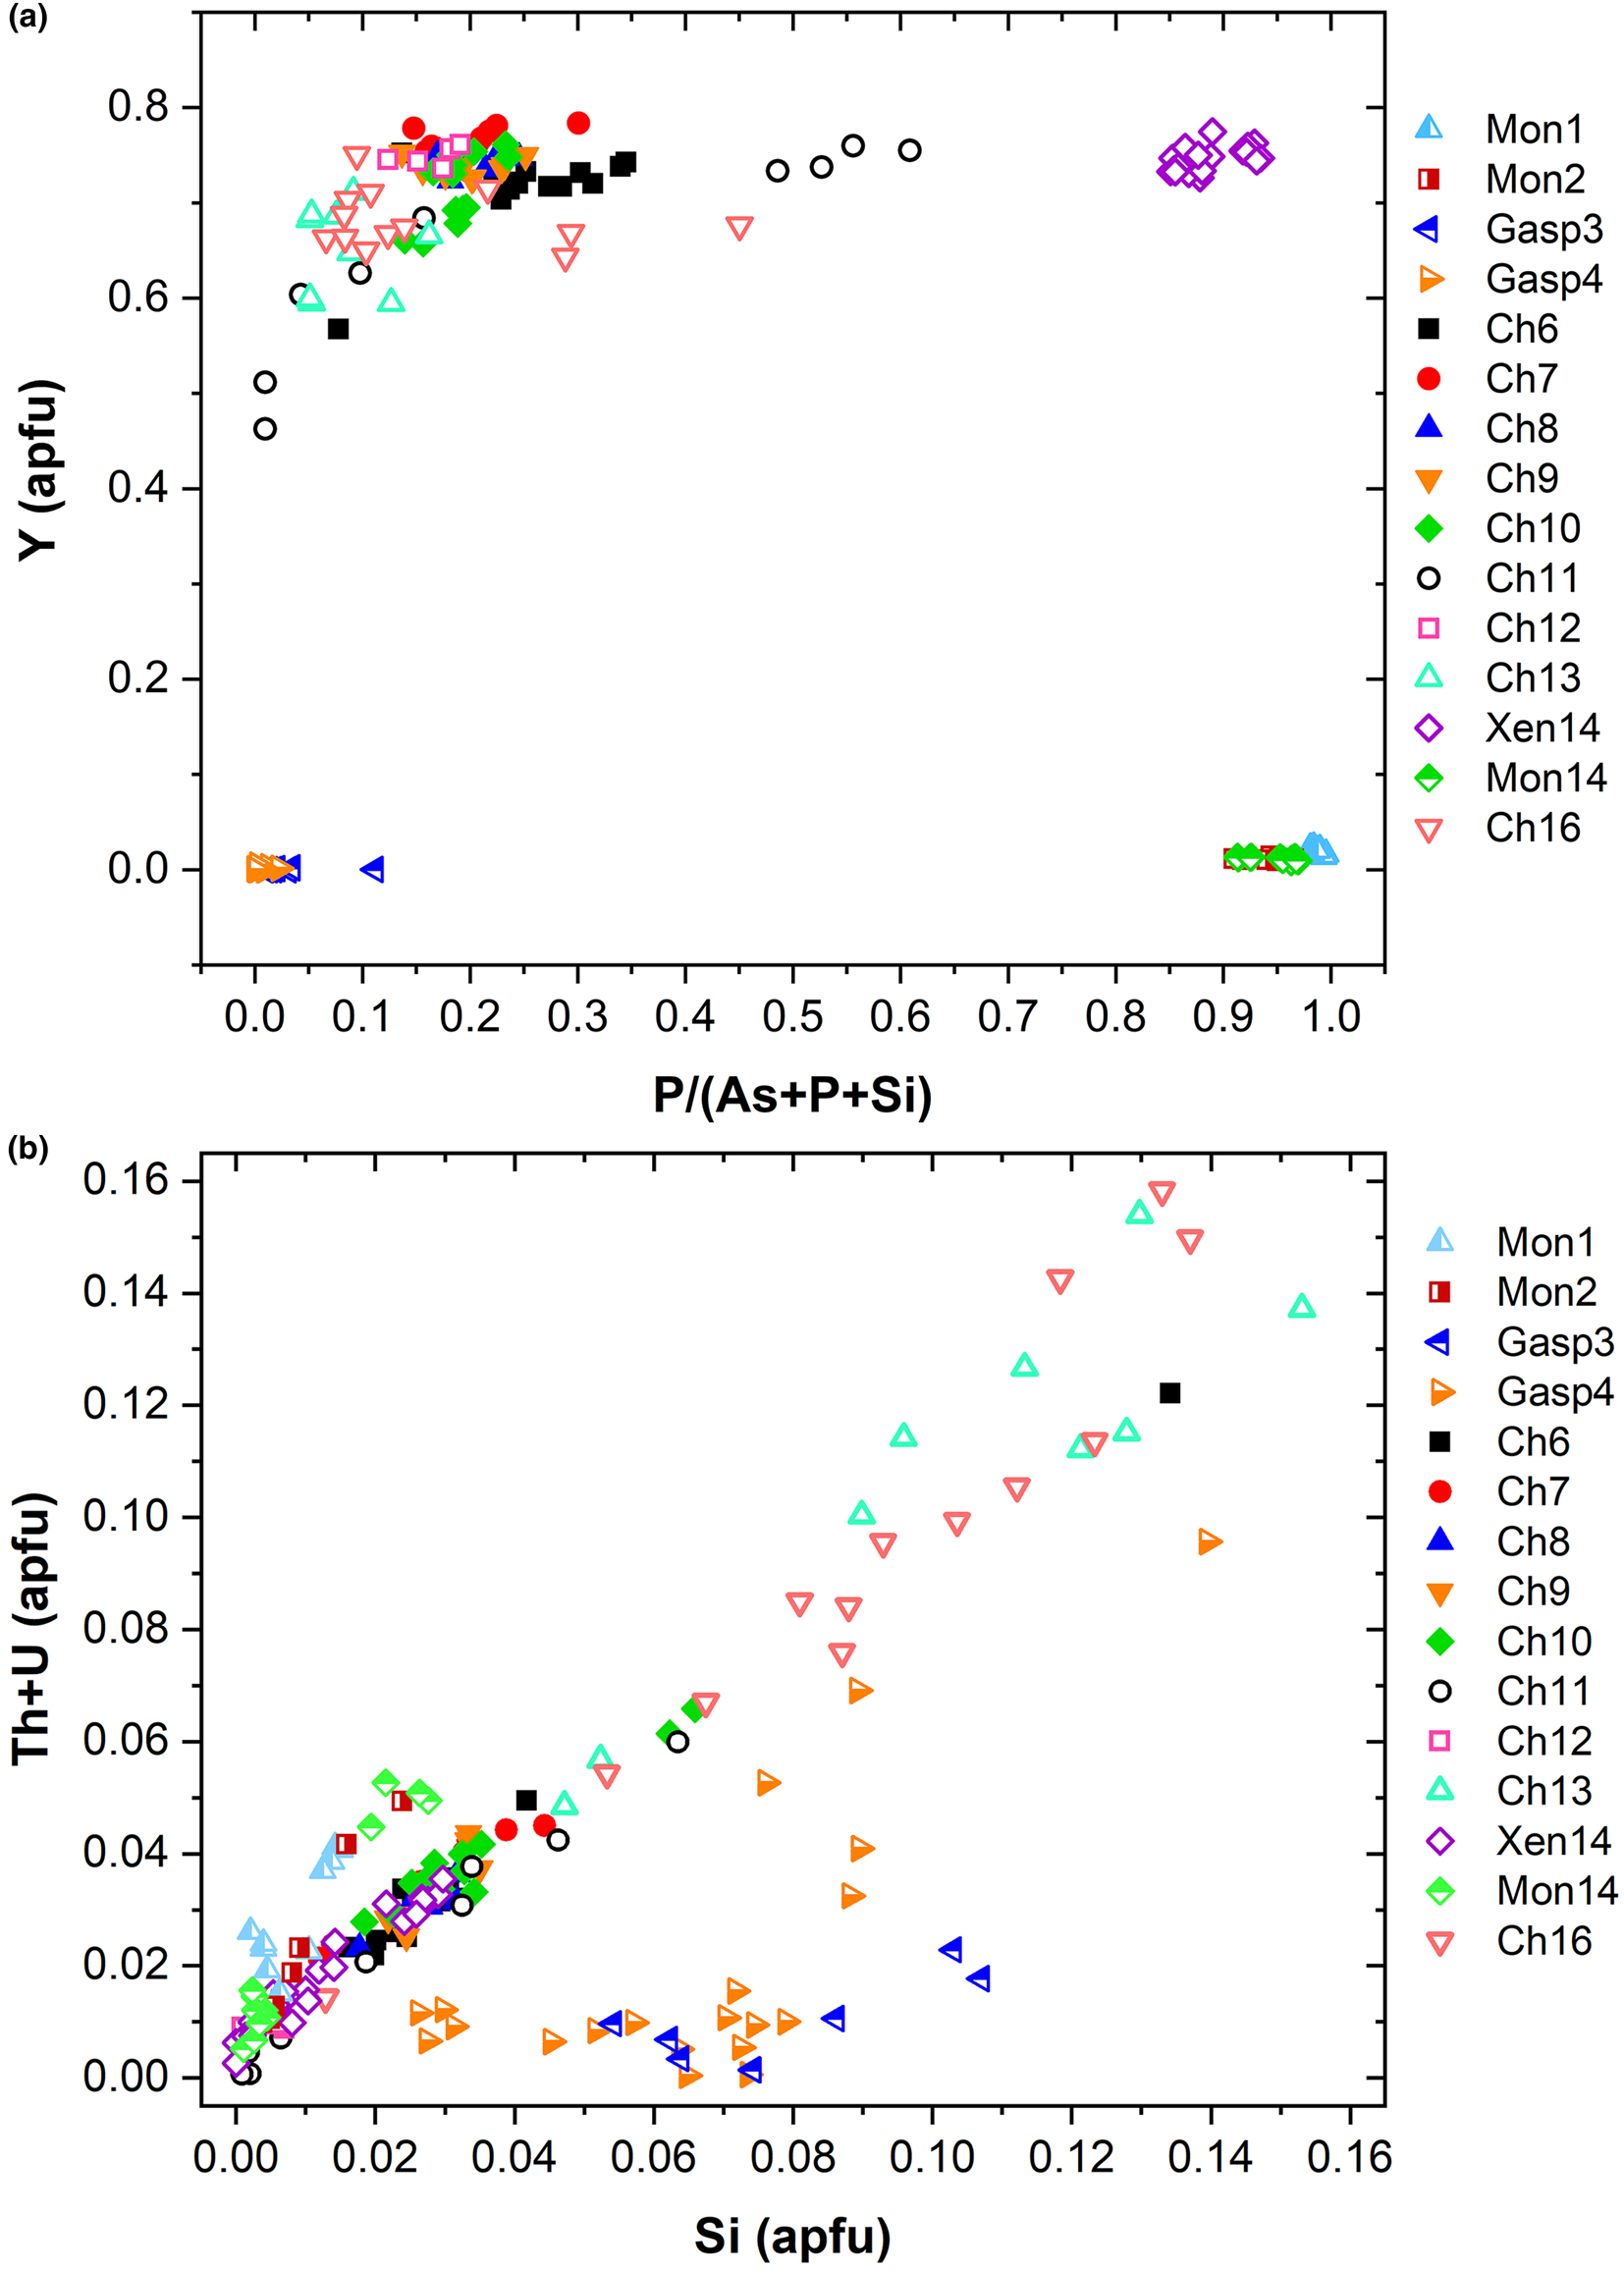
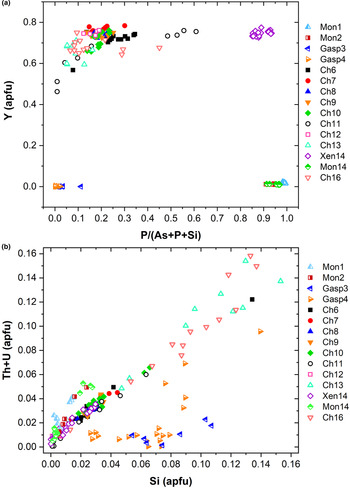
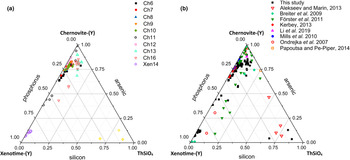
known as cheralite (equation 1) and thorite substitution mechanisms (equation 2). Plotting the data in a P/(P+As+Si) vs. Y diagram (Fig. 6a), clearly distinguishes the four minerals under investigation into four distinct domains. The Y-poor side of the diagram contains the chemical data from the monazite-(Ce) and gasparite-(Ce) crystals, enriched in P and As, respectively. Data from chernovite-(Y) and xenotime-(Y) lie on the Y-enriched side of the diagram, and are characterised by a highly variable P and As fraction, resulting in an almost complete solid solution along the join chernovite-(Y)−xenotime-(Y) (as also shown by the chemical compositions of samples Ch11 and Ch16, having equal fractions of As and P). On the contrary, the composition of gasparite-(Ce) and monazite-(Ce) crystals is closer to the ideal end-members, and only a partial solution is observed. Monazite-(Ce) and gasparite-(Ce) are characterised by a poor Y content, coupled with an enrichment in LREE elements, with Ce (on average, 0.46(2) apfu) as the most common cation, followed by La (0.20(2) apfu) and Nd (0.17(2) apfu).
(a) P/(P+As+Si) vs. Y diagram and (b) Si vs. Th+U (in apfu) for all the samples under investigation.
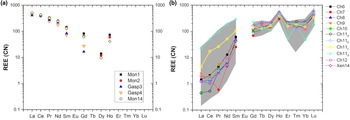
The A-site of the chernovite-(Y)–xenotime-(Y) series is characterised by a relatively constant composition, where Y is always the dominant cation (ranging from a maximum of 0.78 apfu to a minimum of 0.46 apfu), followed, on average, by Dy, Er, Gd, Yb and Ho. When the Y content is lower than ~0.6 apfu, Th or LREE become relevant A-site occupying cations. The fraction of LREE in chernovite-(Y) and xenotime-(Y) is generally low (see below for further details), reaching its maximal values in a few analytical data points for Ch11. The REE pattern for all the samples under investigation is reported in Fig. 7, normalised to the REE concentration of the Carbonaceous Chondrite CN-1, after Wasson and Kallemeyn (Reference Wasson and Kallemeyn1988). For all the points, the abundance of Eu is lower than the detection limit. As mentioned above, the tetragonal structure of chernovite-(Y) and xenotime-(Y) has a strong preference for Y and, in general, the smaller HREE: this pattern is reflected by the positive slope reported in Fig. 7b. Conversely, in the gasparite-(Ce)–monazite-(Ce) series, the LREE enrichment is responsible for the negative slope in Fig. 7a. It is worthwhile pointing out that the relatively high Gd content, shown by the three monazites under investigation, has been described already in alpine-fissure minerals related to the circulation of hydrothermal fluids, as in the case of Mt. Cervandone (Demartin et al., Reference Demartin, Pilati, Diella, Donzelli and Gramaccioli1991; Della Ventura et al., Reference Della Ventura, Mottana, Parodi, Raudsepp, Bellatreccia, Caprilli, Rossi and Fiori1996). Due to their low content (<0.002 apfu), Er–Lu elements are not reported in Fig. 7a. In addition, the Carbonaceous Chondrite CN-1 REE-normalised diagram reported in Fig. 7b shows that there is a positive anomaly in the Ho and Lu concentrations in chernovite-(Y) and xenotime-(Y) from Mt. Cervandone. Literature data (Ondrejka et al., Reference Ondrejka, Uher, Pršek and Ozdín2007; Förster et al., Reference Förster, Ondrejka and Uher2011; Papoutsa and Pe-Piper, Reference Papoutsa and Pe-Piper2014), reporting the Ho and Lu contents in chernovite-(Y) and xenotime-(Y) samples, reveal that the maximum Ho2O3 content detected in chernovite-(Y) is 2.44 wt.% (Papoutsa and Pe-Piper, Reference Papoutsa and Pe-Piper2014), slightly lower than the highest average content of the samples of this study (Table 2), whereas Förster et al. (Reference Förster, Ondrejka and Uher2011) reported the maximum content of Lu2O3 as 1.29 wt.%, very close to that of the samples of this study (Table 2). Although a correction protocol for REE interferences has been applied to the experimental chemical data of this study, we cannot unambiguously exclude that the observed anomalies may be slightly affected by the adopted experimental strategy. However, the previous findings reported in the literature (e.g. Ondrejka et al., Reference Ondrejka, Uher, Pršek and Ozdín2007; Förster et al., Reference Förster, Ondrejka and Uher2011; Papoutsa and Pe-Piper, Reference Papoutsa and Pe-Piper2014) corroborate the results of this study.
Average composition of REE (normalised to the CN-1 chondrite, after Wasson and Kallemeyn, Reference Wasson and Kallemeyn1988) of all the samples of (a) the gasparite-(Ce)–monazite-(Ce) series and (b) the chernovite-(Y)–xenotime-(Y) series. The grey belt in (b) represents the range of the lanthanides composition for all the points of analysis of the chernovite-(Y)-xenotime-(Y) series. Sample Ch11 in (b) is reported as four distinct chemical compositions referring to the core (Ch11a), the interface (Ch11b), the Th-rich rim zone (Ch11c) and the LREE-enriched outer rim zone (Ch11d) (see text, Table 2, Supplementary Table S10 and Figs 4–5 for further details). Elements with concentration < 0.002 apfu are not shown.

Chemical composition of the chernovite-(Y)–xenotime-(Y) series
Although the trivalent cations are always dominant within the A-site of the tetragonal series, some data points from samples Ch6, Ch10, Ch11, Ch13 and Ch16 show a relatively large amount of Th. The thorite substitution mechanism (equation 2) probably occurs in the chernovite-(Y)–xenotime-(Y) series under investigation, as suggested by the strong positive linear correlation between Si and the Th+U fraction (Fig. 6b). For a better representation of the crystal-chemistry of the mineral samples of this study, the (tetragonal) 2-component system chernovite-(Y)–xenotime-(Y) could be replaced by a 3-component solid solution between the end-members chernovite-(Y), xenotime-(Y) and ThSiO4 (Fig. 8). From Fig. 8, as well as in the P/(P+As+Si) vs. Y diagram (Fig. 6a), even in the more P-depleted samples (i.e. Ch6, Ch7, Ch8, Ch9, Ch10 and Ch12), the concentration of this element is relatively high, with an average of 20(3) mol.% of xenotime-(Y) component, coupled with a very small ThSiO4 fraction (on average 3(1) mol.%). Conversely, the xenotime-(Y) sample Xen14 shows a chemical composition (Table 2) much closer to the ideal end-member, with As usually low, corresponding to an average chernovite-(Y) component between 7.0 mol.% and 12.9 mol.%. Between the chernovite-(Y)–xenotime-(Y) edge and the ThSiO4 corner, the samples investigated show that a wide miscibility gap occurs (Fig. 8).
(a) Triangular chernovite-(Y)–xenotime-(Y)–ThSiO4 compositional diagram, based on the As–P–Si relative abundance, containing all the points of chemical analysis performed on the zircon-type tetragonal minerals. The three points (yellow) close to the ThSiO4 corner represent the ThSiO4 grains found within the Ch11 and Xen14 samples (see also Fig. 4). (b) The same diagram showing the chemical data from this and previously published studies on minerals of the chernovite-(Y)–xenotime-(Y) series.
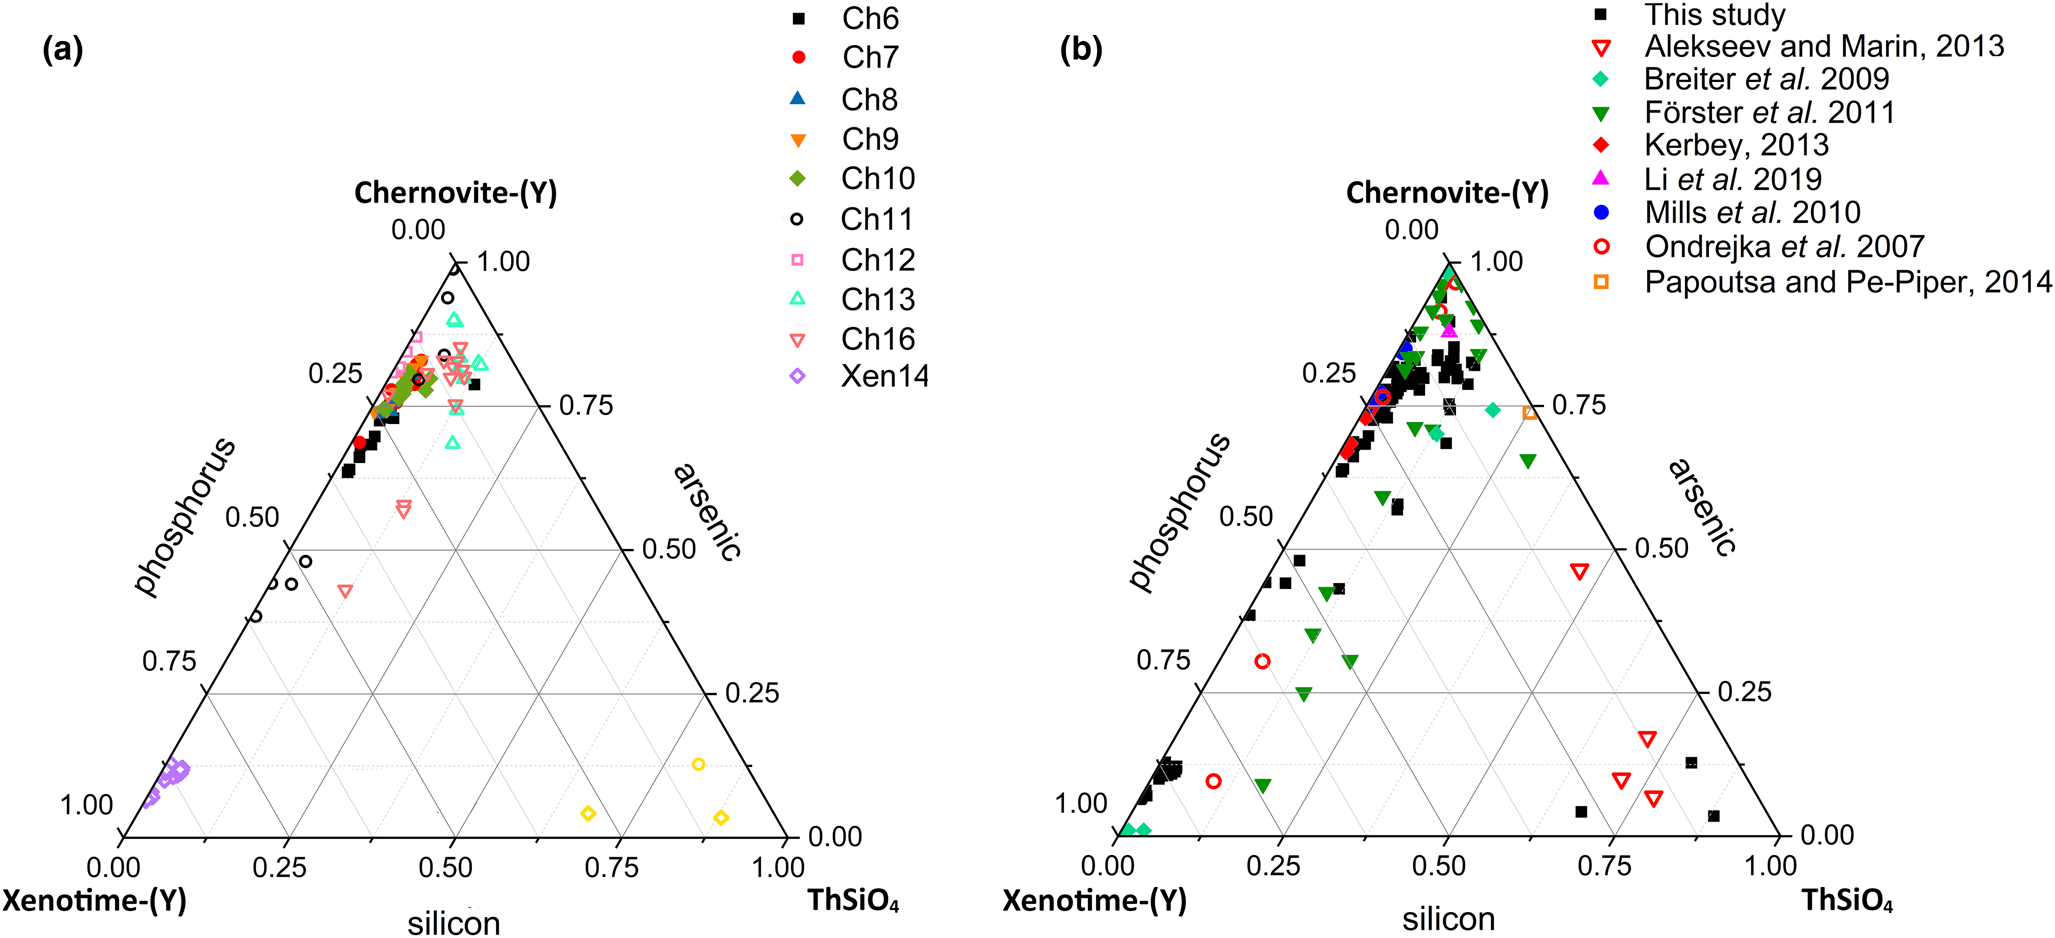
The most Th-enriched analyses on the chernovite-(Y)–xenotime-(Y) edge belong to Ch13 and Ch16 (Fig. 8), which are also characterised by a highly altered texture (Fig. 4f) and variable composition. In these cases, the major chemical variations concern a strong Th-enrichment, reflected by a ThSiO4 component ranging from 4.7 mol.% to 15.3 mol.% for Ch13, and between 1.3 mol.% and 12.3.% for Ch16. The relatively large fraction of the ThSiO4 component may be responsible for the greenish colour observed only in these samples (Fig. 2d,e). Moreover, these samples are also characterised by a larger fraction of CaO (up to 1.93 wt.%, in Ch16, compared to an average 0.1(3) wt.% for the other chernovite-(Y) samples), suggesting the occurrence of the cheralite substitution mechanism (equation 1). In addition, Ch16 reveals the presence of P-enriched domains, with a maximum xenotime-(Y) component of 45.10 mol.% (Fig. 8). The P- and the As-enriched domains are linked by an irregular lobate interface, as shown in Fig. 4f.
As mentioned above, the Ch11 sample (Fig. 4d and Fig. 5) shows a clear core-to-rim zonation, which is characterised by a P-enriched core and an As- and LREE-enriched rim (Fig. 7). EPMA X-ray compositional maps for the Ch11 sample (Fig. 5), showing the fraction of As (Fig. 5a), Ce (Fig. 5b), Sm (Fig. 5c) and Th (Fig. 5d), allow a subdivision into five domains: (1) a quasi-homogeneous core (Ch11a; the blue-coloured area of the insert of Fig. 4d), characterised by an intermediate composition between chernovite-(Y) and xenotime-(Y), with a slight predominance of the latter (up to 60.86 mol.% of xenotime-(Y) component) as reported in Table 2; (2) a segment enriched in ThSiO4 (thorite or huttonite) inclusions in the form of grains (~1–5 μm in size), clearly visible in Fig. 4d (black area within the insert) and Fig. 5d; (3) an interface zone (Ch11b; green area in the insert of Fig. 4d), characterised by an almost equal amount of P and As (xenotime-(Y) molar abundance reaches 52.68 mol.%, slightly lower than the inner, darker core), as well as an enrichment in Th; (4) a chernovite-(Y) domain (Ch11c; red area in the insert of Fig. 4d), with high HREE and Th; (5) a relatively Th-poor outer domain (Ch11d; the yellow area in the insert of Fig. 4d), characterised by an enrichment in LREE, as shown by the increase in the Ce and Sm fraction towards the rim (Fig. 5b and Fig. 5c), coupled with the highest As content (Fig. 5a). The contact between Ch11b and Ch11c, as well as between Ch11c and Ch11d, is marked by a discontinuous flame-like interface. The most As-enriched points of the EPMA–WDS data (up to 98.82 mol.% of the (REE)AsO4 component) refers to the Ch11d domain and also show the highest LREE and lowest Th concentration within the chernovite-(Y)–xenotime-(Y)–ThSiO4 solid solution: Y is still the most abundant A cation (0.487 apfu), but is depleted with respect to the inner portions and the other chernovite-(Y) samples (ca. 0.6–0.8 apfu; Table 2). Nd is the second most abundant A cation, and significant fractions of Sm, Ce and Pr are also present, up to 10.80 wt.% for Nd2O3 (0.167 apfu vs. <0.01 apfu in the other chernovites), 5.18 wt.% for Sm2O3 (0.077 apfu vs. <0.015 apfu), 3.87 wt.% for Ce2O3 (0.061 apfu vs. <0.003 apfu) and 1.23 wt.% for Pr2O3 (0.019 apfu vs. substantially absent in other chernovites). Overall, a comparative analysis of the A-site composition of the chernovite-(Y) and xenotime-(Y) crystals does not reveal a preferential partitioning of Y and the other HREE among the investigated zircon-type tetragonal arsenates and phosphates (Fig. 7a and Supplementary Tables S1–15). However, the chemical heterogeneity and altered texture of some samples (e.g. Ch11, Ch13 and Ch16) suggests a complex interplay with chemically variable hydrothermal fluids, which may have led to local chemical dissolutions of P-enriched chernovites-(Y) and precipitation of ThSiO4 crystals. The identification of these crystals as thorite (isostructural with zircon) or huttonite (isostructural with monazite) is not straightforward. The phase stability relationships between the two ThSiO4 polymorphs have been discussed widely by several authors (Harlov et al., Reference Harlov, Wirth and Hetherington2007; Mazeina et al., Reference Mazeina, Ushakov, Navrotsky and Boatner2005; Seydoux and Montel, Reference Seydoux and Montel1997), reporting that huttonite is stable at higher T and P with respect to thorite. However, the presence of REE at the A-site, according to Speer and Cooper (Reference Speer and Cooper1982), may enlarge the stability field of huttonite to lower temperatures. Harlov et al. (Reference Harlov, Wirth and Hetherington2007) found that the crystallisation of metastable huttonite at the expense of monazite-(Ce) crystals can take place at 400°C (and 500 MPa), in the thorite field, as also reported by Guastoni et al. (Reference Guastoni, Pozzi, Secco, Schiazza, Pennacchioni, Fioretti and Nestola2016) for pegmatitic monazites of the Central Alps. In this light, given the difficulty of differentiating between thorite and huttonite by means of EPMA (Harlov et al., Reference Harlov, Förster and Nijland2002; Harlov and Föster, Reference Harlov and Förster2002) and the lack of information on the (P,T) conditions of the hydrothermal fluids of Mt. Cervandone, it is impossible to identify unambiguously which polymorph of ThSiO4 is associated with the zircon-type and monazite-type REETO4 minerals of this study.
The sample Ch11 shows the presence of a reaction contact. In this case, a Th-rich layer, i.e. Ch11b (see Figs 4, 5), represents the reactional crown around the more chemically homogeneous Ch11a. The few ThSiO4 grain inclusions present show a chemical composition related closely to the surroundings: ThSiO4 shows an As-enrichment over P, when in contact with the chernovite-(Y)–xenotime-(Y) s.s. (Ch11) and an evident P-enrichment when included in the Xen14 grains (Supplementary Table S13). The three points of analysis falling into the ThSiO4 field (Fig. 8) are characterised by a REE-pattern (Supplementary Fig. S1) in which, considering only the lanthanides, the HREE slightly prevail over the LREE. This pattern probably reflects the chemical composition of the hydrothermal fluids, which may be affected and, in turn, modified in response to several processes. These may include, but are not limited to, the destabilisation of REE-enriched minerals as, for example, allanite and gadolinite, as well as a different partitioning of the different REE's as trace elements in nominally REE-free minerals. The paramount role of water in stabilising the actinides and Ln orthosilicates has been suggested by several authors (e.g. Johan and Johan, Reference Johan and Johan2005; Strzelecki et al., Reference Strzelecki, Barral, Estevenon, Mesbah, Goncharov, Baker, Bai, Clavier, Szenknect, Migdisov, Xu, Ewing, Dacheux and Guo2021) and the hydroxilised nature of the ThSiO4 grain inclusions could explain the poor closure of their EPMA data. Moreover, Mesbah et al. (Reference Mesbah, Clavier, Lozano-Rodriguez, Szenknect and Dacheux2016) identified a complete solid solution between the zircon-type ErPO4 and thorite, synthesised under hydrothermal conditions (250°C). However, in the natural samples investigated here a very sharp contact (Fig. 4c,d) has been observed between the ThSiO4 grains and the surrounding phosphates and arsenates.
Chemical features of the gasparite-(Ce)–monazite-(Ce) series
All the gasparite-(Ce) and monazite-(Ce) samples show a rather similar composition of the ninefold-coordinated A site and the main differences in particular concern the abundance of Y and Ca. A relatively high amount of Y (Y2O3 on average, 0.7(2) wt.%) is shown by the three monazite-(Ce) samples, especially by the Mon1 sample (Y2O3 up to 1.12 wt.%), whereas this element is almost absent in the two gasparite-(Ce) samples (Y2O3 < 0.13 wt.%). Unlike monazite-(Ce), gasparite-(Ce) shows a higher content and more uniform distribution of Ca [CaO 1.8(2) wt.%, vs 1.1(4) wt.% for monazite-(Ce)]. Also in the gasparite-(Ce)–monazite-(Ce) series, Th has been found as the most variable element and, in addition, gasparite-(Ce) incorporates the highest fraction of Si among the investigated REE minerals (see Table 2). In this case, a further charge-compensating mechanism should be involved, to fully explain the anomalous amount of Ca and Si, not compensated by Th+U, in gasparite-(Ce). The presence of monovalent anions, such as OH–, F– or Cl–, in place of O2–, may compensate for the presence of Si and Ca, according to the following equation:

According to equation 3, if just OH– is taken into account, the corresponding amount of H2O necessary to compensate the charge defect is, on average, ~0.45 wt.% for both Gasp3 and Gasp4. Instead, for all the samples of monazite-(Ce), a combination of equation 1 and equation 2 fully satisfies the pattern shown in Fig. 6b. The P and As contents in the arsenate and phosphate samples, respectively, are always low, as reflected by an average of 1.2(6) mol.% of the phosphate component in gasparite-(Ce) and a maximum 6.60 mol.% of the arsenate component in monazite-(Ce).
Comparison with chemical data reported in the literature
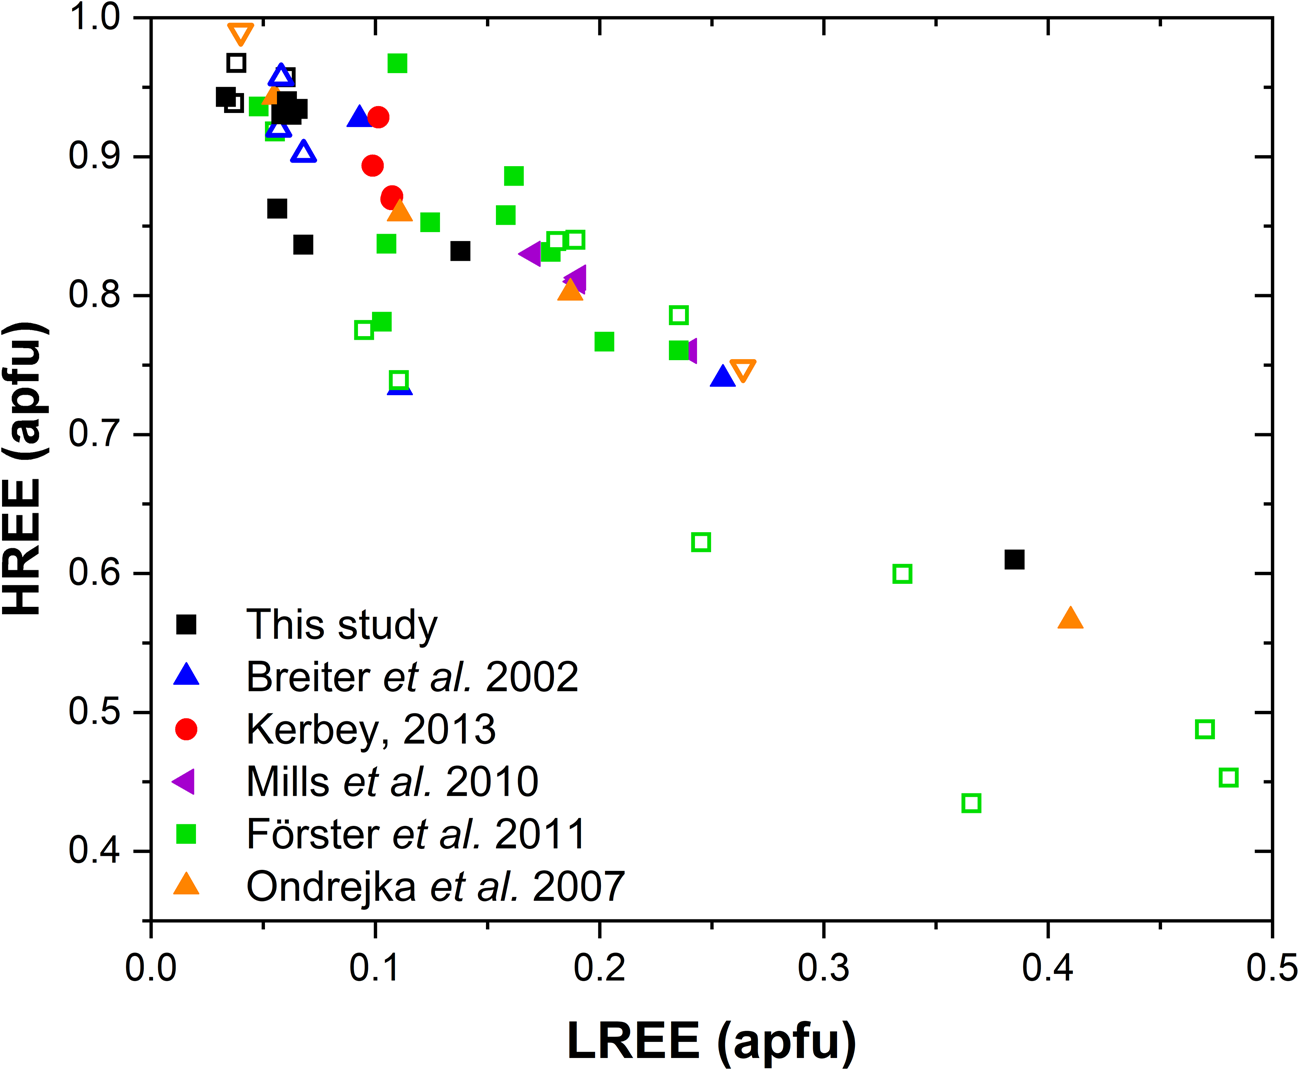
A comparison with the composition of chernovite-(Y) from Mt. Cervandone and that from the Binn Valley, reported by Graeser et al. (Reference Graeser, Schwander and Stalder1973), shows a P and As content very close to that reported in Table 2 for our samples, resulting in As/(As+P) = 0.76 and 0.84, respectively. A comparison with published chemical analyses of chernovite-(Y) and xenotime-(Y) occurring in different localities (Ondrejka et al., Reference Ondrejka, Uher, Pršek and Ozdín2007; Förster et al., Reference Förster, Ondrejka and Uher2011; Breiter et al., Reference Breiter, Čopjaková and Škoda2009; Li et al., Reference Li, Zhou and Williams-Jones2019; Alekseev and Marin, Reference Alekseev and Marin2013; Kerbey, Reference Kerbey2013; Mills et al., Reference Mills, Kartashov, Kampf and Raudsepp2010; Papoutsa and Pe-Piper, Reference Papoutsa and Pe-Piper2014) shows that the zircon-type phosphates and arsenates investigated here selectively host HREE, with a very low LREE content. In Fig. 9, the HREE vs. LREE content of several xenotime-(Y) and chernovite-(Y) samples from different geological environments is reported, including crystals from hydrothermally-altered A-type granites, rhyolites, pegmatites (Ondrejka et al., Reference Ondrejka, Uher, Pršek and Ozdín2007; Breiter et al., Reference Breiter, Čopjaková and Škoda2009; Li et al., Reference Li, Zhou and Williams-Jones2019; Papoutsa and Pe-Piper, Reference Papoutsa and Pe-Piper2014; Förster et al., Reference Förster, Ondrejka and Uher2011) and Mn nodules contained in metasedimentary rocks (Mills et al., Reference Mills, Kartashov, Kampf and Raudsepp2010). From Fig. 9, the majority of the chernovite-(Y)–xenotime-(Y) samples from Mt. Cervandone are mostly enriched in HREE, and only in the outer domains of Ch11 (Ch11c and Ch11d) is the fraction of LREE high (reaching a maximum of ~0.39 apfu in Ch11d); also shown by the compositional maps (Fig. 5c,d; Table 2). Thus, a few points of analysis from this study, and those reported by Ondrejka et al. (Reference Ondrejka, Uher, Pršek and Ozdín2007) and Förster et al. (Reference Förster, Ondrejka and Uher2011), confirm that, within the A-site of the series chernovite-(Y)–xenotime-(Y), a relatively large fraction of LREE (up to 0.48 apfu) may be hosted, despite being a fairly rare occurrence. As reported in Fig. 8b, evidence of a complex solid solution between the end-members chernovite-(Y), xenotime-(Y) and ThSiO4, according to equation 2, has been reported by several authors (Ondrejka and Uher, Reference Ondrejka and Uher2008; Breiter et al., Reference Breiter, Čopjaková and Škoda2009; Förster et al., Reference Förster, Ondrejka and Uher2011; Förster, Reference Förster2006; Alekseev and Marin, Reference Alekseev and Marin2013). Chemical data reported by Ondrejka et al. (Reference Ondrejka, Uher, Pršek and Ozdín2007) and Förster et al. (Reference Förster, Ondrejka and Uher2011), in particular, show a T-site range composition very close to that reported in the present study. In addition, the heavily altered crystals of Ch13 and Ch16 share similar features with the hydrated chernovite-(Y) and xenotime-(Y) crystals described by Förster (Reference Förster2006) and Förster et al. (Reference Förster, Ondrejka and Uher2011), including a similar Th-content (up to 18.4 wt.% of ThO2), as well as the variable composition, ranging between 9–84 mol.% of the chernovite-(Y) and 0–70 mol.% of xenotime-(Y) component.
LREE vs. HREE diagram for all the chernovite-(Y)–xenotime-(Y) samples of this study, and for chernovites-(Y), xenotime-(Y) and their solid solutions based on the data from Breiter et al. (Reference Breiter, Čopjaková and Škoda2009), Ondrejka et al. (Reference Ondrejka, Uher, Pršek and Ozdín2007), Mills et al. (Reference Mills, Kartashov, Kampf and Raudsepp2010), Förster et al. (Reference Förster, Ondrejka and Uher2011) and Kerbey (Reference Kerbey2013). Different colours refer to different studies; filled symbols refer to chernovites-(Y), whereas void symbols refer to xenotimes-(Y).
The barrel-shaped morphology of gasparite-(Ce), a pseudomorph after synchysite-(Ce), has been emphasised by Graeser and Schwander (Reference Graeser and Schwander1987), and can also be observed for the sample Gasp4 (Fig. 3b). As an alteration product of synchysite-(Ce), gasparite-(Ce) shows rather different chemical features with respect to the three other investigated species crystallised from the hydrothermal fluids. In particular, a comparison with the isostructural monazite-(Ce) highlights an enrichment in Ca and a depletion in Y, probably inherited from the parental REE-carbonate. This present study, similarly to the previous one conducted at Mt. Cervandone by Graeser and Schwander (Reference Graeser and Schwander1987), reports rather narrow compositions, very close to the ideal ones, resulting in a very limited solid solution along the join gasparite-(Ce)−monazite-(Ce). Solid solutions among gasparite-(Ce) and monazite-(Ce) have been described by Ondrejka et al. (Reference Ondrejka, Uher, Pršek and Ozdín2007) and Kolitsch and Holtsman (Reference Kolitsch and Holtstam2004a) with As/(As+P) = 0.57–0.64 and 0.89–0.93, respectively, so the wide miscibility gap observed in this study within the monazite-type series is a local feature of the Mt. Cervandone deposit, related possibly to the formation of gasparite-(Ce) after synchysite-(Ce). Conversely, the gasparite-(La), which occurs in the nearby Binn Valley (Vereshchagin et al., Reference Vereshchagin, Britvin, Perova, Brusnitsyn, Polekhovsky, Shilovskikh, Bocharov, van der Burgt, Cuchet and Meisser2019), the Swiss flank of Mt. Cervandone, is characterised by a more phosphatian composition with As/(As+P+Si+S) = 0.80.
Crystal structure of the REE phosphates and arsenates
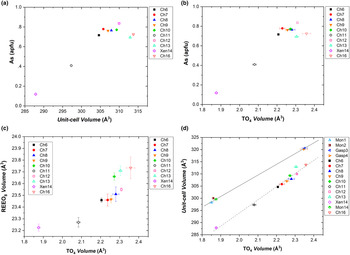
As discussed previously, the tetragonal minerals chernovite-(Y), xenotime-(Y) and thorite are isostructural. Considering the chernovite-(Y)–xenotime-(Y) side of the triangular compositional diagram, the unit-cell volume of the minerals investigated gradually decreases from chernovite-(Y) to xenotime-(Y), as shown by Fig. 10a, which reports the evolution of unit-cell volume (V) vs. the As fraction. Similarly, Fig. 10b shows the evolution as a function of As of the tetrahedron volume (calculated using the tools implemented in the software Vesta 3, Momma and Izumi, Reference Momma and Izumi2011). For the case of sample Ch11, the unit-cell and structural data, when compared to those of the other chernovite-(Y) samples (see Supplementary Table S16), suggest that the single-crystal investigated (20 μm ×20 μm ×15 μm) belongs to the P-enriched core portion (Ch11a). This assignment is also corroborated by the BSE map shown in Fig. 4d, which suggests that the core portion is the only part able to provide a sufficiently large single crystal. For these reasons, data pertaining to the sample Ch11 have been plotted in Fig. 10 assuming the average composition of the core portion reported in Table 2.
(a) Unit-cell volume vs. As fraction (in apfu), (b) volume of the TO4 tetrahedron vs. As fraction (in apfu) and (c) volume of the TO4 tetrahedron vs. volume of the (REE)-bearing A-polyhedron for the samples pertaining to the chernovite-(Y)–xenotime-(Y) series. (d) Volume of the TO4 tetrahedron vs. unit-cell volume for all the samples investigated.

Excluding the most Th-enriched samples, all the chernovite-(Y) and xenotime-(Y) samples investigated share an almost identical composition of the REE-bearing A-polyhedral site (Supplementary Tables S1–S15), dominated by HREE, which cannot be responsible for the observed variations in the unit-cell and A-polyhedron volumes (Fig. 10a; Table 4). Conversely, the cationic population of the T-site affects the volumes of the tetrahedra, with larger values almost linearly correlated with an increase in As and a decrease in P (Fig. 10b). Figures 10c and d show that a strong correlation exists between the tetrahedron volume and both the unit-cell and the A-polyhedron volumes, suggesting that the unit-cell volume within this series is controlled significantly by the tetrahedrally-coordinated cations. This is not surprising if we consider the bonding topology of the zircon-type structure, in which any (REE)-polyhedron is surrounded by six tetrahedra and, in turn, each tetrahedron share two edges with two adjacent (REE)-polyhedra. As a result, the volumes of the two building units (i.e. polyhedron and tetrahedron) are mutually interconnected. Thus, when the T-site is mostly occupied by the smaller phosphorous, the (REE)-bearing polyhedron adapts with a smaller volume which, in turn, also affects the unit-cell volume; conversely, the opposite trend is observed with an enrichment in arsenic.
A clear deviation from the previously described trends is represented by the Ch13 and Ch16 samples, which show appreciably larger unit-cell volumes, of 312.89(3) Å3 and 313.75(9) Å3, respectively (Fig. 10a). This misalignment is probably related to enrichment in Th and Ca at the A-site, these being elements characterised by larger ionic radii with respect to the HREE (Shannon, Reference Shannon1976), which induce an expansion of the A-polyhedron and, in turn, of the unit-cell volume. A similar behaviour to that described above for the (tetragonal) chernovite-(Y)–xenotime-(Y) series is also shown by the (monoclinic) gasparite-(Ce) and monazite-(Ce). However, in this case, the distribution of the chemical compositions in two clusters close to the ideal end-members prevents a robust extrapolation along the whole series (Fig. 10d).
A correlation among the volumes of (P,As)-tetrahedra and the A-site polyhedra is also shown by the synthetic REETO4 compounds, of which structural models are reported in the Inorganic Crystal Structure Database (Bergerhoff et al., Reference Bergerhoff, Brown and Allen1987). A comparative analysis of the structural parameters of synthetic REE-bearing phosphates (YPO4, LaPO4, CePO4, NdPO4, TbPO4, HoPO4, DyPO4, YbPO4 and LuPO4 – Ni et al., Reference Ni, Hughes and Mariano1995) and their As-dominant end-members (YAsO4 – Ledderboge et al., Reference Ledderboge, Nowak, Massonne, Förg, Höppe and Schleid2018; LaAsO4 – Kang and Schleid, Reference Kang and Schleid2005; CeAsO4 – Brahim et al., Reference Brahim, Mohamed Mongi and Amor2002; NdAsO4 – Schmidt et al., Reference Schmidt, Müller, Cardoso, Milke and Binnewies2005; TbAsO4 – Long and Stager, Reference Long and Stager1977; HoAsO4 – Schmidt et al., Reference Schmidt, Müller, Cardoso, Milke and Binnewies2005; DyAsO4 – Long and Stager, Reference Long and Stager1977; YbAsO4 –Kang et al., Reference Kang, Höss and Schleid2005; and LuAsO4 – Lohmüller et al., Reference Lohmüller, Schmidt, Deppisch, Gramlich and Scheringer1973) has been carried out. Given the same elemental composition of the REE-bearing A site, the volume of its coordination polyhedron is different in phosphates and arsenates, being always lower in phosphates, pointing out the dominant role played by the TO4 structural units (${\rm V}_{{\rm T}{\rm O}_ 4}$ ≈ 2.4 Å3 for AsO4 and ≈ 1.8 Å3 for PO4) in controlling most of the structural features of the REETO4 compounds. Selected structural parameters of synthetic REETO4 compounds are reported in Table S17.
In addition, based on all the structure refinements, the A-polyhedron distortion index (Baur, Reference Baur1974) has been calculated using the tools implemented in Vesta 3 (Momma and Izumi, Reference Momma and Izumi2011). The A-polyhedron distortion index (DI), following Baur (Reference Baur1974), is based on the measured A–O distances, i.e. DI(A–O), and is expressed as:

for the tetragonal series and

for the monoclinic series, reported in Table 4 (where AOav is the average A–O interatomic distance). The analysis of the calculated distortion index values (Table 4) shows that the increase in As (and decrease in P) leads to an increase in the distortion of the (REE)-site coordination polyhedra in both the tetragonal and monoclinic series.
Concluding remarks
The chemical composition and crystal structure of 15 REE-bearing phosphates and arsenates from the Mt. Cervandone mineral deposit, Western Alps, Italy, have been investigated, using a multi-methodological approach. The REE-pattern of all the analysed samples, shows, as expected, an enrichment in LREE for gasparite-(Ce) and monazite-(Ce), whereas chernovite-(Y) and xenotime-(Y) are characterised by HREE enrichment. Furthermore, a relative enrichment in Ho (when normalised to the CN-1 chondrite composition) has been observed for chernovite-(Y), xenotime-(Y) and monazite-(Ce). Conversely, the two samples of gasparite-(Ce) do not share the same REE-pattern, presumably as gasparite-(Ce) is an alteration product of the carbonate synchysite-(Ce) (Graeser and Schwander, Reference Graeser and Schwander1987). An almost complete solid solution has been found along the chernovite-(Y) and xenotime-(Y) join, whereas a wide miscibility gap occurs among the investigated end-members of gasparite-(Ce) and monazite-(Ce) series from Mt. Cervandone, probably ascribable to the aforementioned different formation conditions of gasparite-(Ce). On average, chernovite-(Y) and xenotime-(Y) from Mt. Cervandone are characterised by a very selective composition, resulting in a rather low LREE concentration, compared to chemical data available in the literature. Consequently, a limited solid solution occurs between the LREE-bearing monazite-(Ce) and gasparite-(Ce) and the HREE-bearing xenotime-(Y) and chernovite-(Y). However, the Ch11 sample, showing evidence of reaction, is characterised by a significant enrichment in LREE in its outer rim, suggesting a complex interplay with the circulating hydrothermal fluids. Furthermore, the analysis of the refined structural models reveals the principal role played by the tetrahedrally-coordinated cations in controlling the unit-cell volume and even the REE-polyhedral volume and distortion.
Acknowledgements
The Principal Editor, Dr Stuart Mills, the Structure Editor, Prof Peter Leverett, and three anonymous reviewers are gratefully thanked for their valuable comments and suggestions, which improved the manuscript quality. Andrea Risplendente is thanked for the EPMA–WDS. FP, PL, NR, TB and GDG acknowledge the Italian Ministry of Education and University (MIUR) for the support through the project “Dipartimenti di Eccellenza 2018–2022 – Le Geoscienze per la società: Risorse e loro evoluzione”. PL, NR and GDG acknowledge the University of Milano for the support through the projects “Piano di sostegno alla Ricerca 2019” and “Piano di sostegno alla Ricerca 2020”.
Supplementary material
To view supplementary material for this article, please visit https://doi.org/10.1180/mgm.2022.5


 Open access