


Introduction
Fluctuations in mountain glaciers are recognized as a key indicator of climate change, resulting in sea-level changes and regional glacier-related hazards (Oerlemans, Reference Oerlemans1994; Meier and others, Reference Meier2007; Bolch and others, Reference Bolch2012; Gardner and others, Reference Gardner2013; IPCC, 2019). High Mountain Asia (HMA), including the Tibetan Plateau and its surroundings, is home to the largest number of glaciers outside Earth's polar regions. Most of these glaciers have been in a sustained phase of recession during recent decades. The annual mass balance of glaciers in HMA was −0.18 ± 0.04 m w.e. a−1 from 2000 to 2016 (Brun and others, Reference Brun, Berthier, Wagnon, Kääb and Treichler2017), and in the Himalaya, the rate of ice loss almost doubled in 2000–16 (−0.43 ± 0.14 m w.e. a−1) when compared to 1975–2000 (−0.22 ± 0.13 m w.e. a−1) (Maurer and others, Reference Maurer, Schaefer, Rupper and Corley2019). In the western part of HMA, however, it is generally recognized that glaciers behave abnormally (Gardelle and others, Reference Gardelle, Berthier, Arnaud and Kääb2013; Kääb and others, Reference Kääb, Treichler, Nuth and Berthier2015; Farinotti and others, Reference Farinotti, Immerzeel, de Kok, Quincey and Dehecq2020). In particular, glaciers in the eastern Pamir, the Kunlun Shan and the central Tibetan Plateau showed thickening of 0.1–0.7 m a−1 during the early part of the 21st century (Treichler and others, Reference Treichler, Kääb, Salzmann and Xu2019). The Pamir has been highlighted in several studies as the zone of transition between negative (to the west) and positive (to the east) mass balances (Brun and others, Reference Brun, Berthier, Wagnon, Kääb and Treichler2017; Lin and others, Reference Lin, Li, Cuo, Hooper and Ye2017), differentiating the glaciers here from a worldwide thinning trend (Gardner and others, Reference Gardner2013; Zemp and others, Reference Zemp2017).
Most of the glacierized area in the eastern Pamir lies in the Kingata Mountains, the Kongur Tagh and the Muztag Ata (Fig. 1). Few detailed studies exist for these three ranges, but those that do are common in showing widespread glacier recession over the latter decades of the 20th century. Areal losses of 10.8 ± 1.1% were measured between 1963 and 2009 (Zhang and others, Reference Zhang2016b) and mass losses of −0.14 ± 0.24 m w.e. a−1 were recorded between 1971/76 and 1991 (Zhang and others, Reference Zhang2016a). However, since the 21st century, glaciers in the eastern Pamir began to gain mass again. From 2000 to 2014, the mass budget of the eastern Pamir was calculated as +0.12 ± 0.09 m w.e. a−1 (Lin and others, Reference Lin, Li, Cuo, Hooper and Ye2017) and a slight expansion in glacier area (+0.5 ± 0.1 km2) was detected from 2009 to 2014 (Zhang and others, Reference Zhang2016a). On a more local scale, and focusing on the Muztag Ata in particular, a mass balance of +0.04 ± 0.27 m w.e. a−1 was calculated by Holzer and others (Reference Holzer2015) for the period 1999–2013. Although these disparate data go some way toward characterizing mass changes in the region, the transition between mass gain and mass loss is not well studied and glacier-specific data are still lacking. The rate of change in mass balance is also poorly characterized since the 21st century.
The eastern Pamir, showing major mountain ranges, key rivers and the glaciers (labeled) assessed within this study. The background image was acquired by Landsat OLI (band combination of 6-5-4) on 9 September 2017. The DEM profile is shown in Figure 5.

Glacier-specific mass-balance data are particularly important for this region because many of the glaciers are surge-type (Lv and others, Reference Lv2016; Shangguan and others, Reference Shangguan2016; Lv and others, Reference Lv2019). The behavior of surge-type glaciers is known to depart significantly from climate-driven changes in mass balance that are conventionally associated with non-surge type (Bhambri and others, Reference Bhambri, Hewitt, Kawishwar and Pratap2017). Glaciers that surge build-up large volumes of ice at high-elevation (albeit often still within the ablation area) for many decades, before rapidly discharging the mass down-glacier during short-lived surge events. Previous studies have indicated that during the active surge phase, the geodetic mass balance can be strongly negative (Aðalgeirsdóttir and others, Reference Aðalgeirsdóttir, Björnsson, Pálsson and Magnússon2005; Kochtitzky and others, Reference Kochtitzky2019), but over longer (e.g. decadal) timescales, there appears to be little difference between the mass balances of surge-type and non-surge-type glaciers (Gardelle and others, Reference Gardelle, Berthier, Arnaud and Kääb2013; Brun and others, Reference Brun, Berthier, Wagnon, Kääb and Treichler2017; Berthier and others, Reference Berthier and Brun2019). There remains some uncertainty, therefore, as to whether surge-enhanced ablation may impact on regional mass-balance calculations.
In this study, we use three different digital elevation model (DEM) datasets to reconstruct the surface elevation changes in the eastern Pamir over two periods (2000–09, 2000–15/16), to assess spatial and temporal changes in mass balance during the early part of 21st century. We characterize the location of the transition boundary and how mass balances either side of the boundary have evolved since the start of 21st century. We present a comparison of surge-type and non-surge-type glacier mass balances, and evaluate the extent to which the presence of surge-type glaciers may impact on broad-region mass budget estimations.
Study area
The eastern Pamir (38°N–39°N, 73°E–75°E) is located in western China and is sometimes recognized as the tail of the West Kunlun Shan. The topography in the eastern Pamir ranges from 3000 m a.s.l. to >7600 m a.s.l.. Kongur Tagh, with an elevation of 7649 m a.s.l., is the highest summit in the eastern Pamir. Muztag Ata is 7509 m a.s.l. and Chakragil, the highest peak of the Kingata Mountains, is 6727 m a.s.l. (Fig. 1). As one of the coldest and driest regions around the world, glaciers in this area are acknowledged to be of continental type (Zhang, Reference Zhang1980; Shangguan and others, Reference Shangguan2006).
The eastern Pamir has a glacierized area of 2362.5 km2 (comprising 2106 glaciers) (Mölg and others, Reference Mölg, Bolch, Rastner, Strozzi and Paul2018). Nearly 68% (1602.3 km2) of this area is contained in the Kingata Mountains, the Kongur Tagh and the Muztag Ata. Large glaciers, often formed with multiple tributaries, are mostly located in the Kongur Tagh and Muztag Ata, while glaciers in the Kingata Mountains are smaller in size (Fig. 1). Many of the larger glacier tongues are covered by a continuous debris layer. Glacier meltwater in the eastern Pamir makes a substantial contribution to rivers such as the Muji, the Kangxiwa and the Gez, and is a critical natural resource for people living downstream (Liu and others, Reference Liu2006).
The eastern Pamir is climatologically controlled by mid-latitude westerlies (Seong and others, Reference Seong, Owen, Yi, Finkel and Schoenbohm2009). Based on records from the Taxkogan meteorological station (37°46′N, 75°14′E; 3090.9 m a.s.l.), which is ~50 km south to the Muztag Ata, annual precipitation does not exceed 70 mm and the mean air temperature can be as high as 15°C between June and August (Shangguan and others, Reference Shangguan2006). Since the 1950s, the mean summer temperature has increased by +0.7°C along with a slight increase in annual precipitation (Tian and others, Reference Tian2006; Yao and others, Reference Yao2012).
Data and methods
Digital elevation models
We calculated ice volume change with DEM differencing data in the study area and subsequently converted it to mass balance for each glacier. The Shuttle Radar Topography Mission (SRTM) 1 arc-second global DEM from 2000 provided the baseline dataset for the study. The NASA HMA 8 m DEM (Shean and others, Reference Shean2016; Shean, Reference Shean2017a, Reference Shean2017b) provided the most recent elevation dataset. For a midpoint analysis, we generated eight DEMs from the Advanced Land Observing Satellite (ALOS) PRISM sensor (Table S1), complemented where necessary by a composite DEM derived from the same source (Tadono and others, Reference Tadono2014). The majority of the HMA and ALOS PRISM DEMs we analyzed were acquired toward the end of the ablation season (May to September in the Eastern Pamir).
SRTM 1 arc-second global DEM
The SRTM mission collected near-global data (57°S to 60°N) at 30 m-resolution in February 2000, using a C-band radar. This SRTM 1 arc-second global DEM (version 3.0) is provided by the United States Geological Survey (USGS) at Earth Gravitational Model 1996 orthometric heights and non-void-filled in our study area. The horizontal and vertical accuracies can be better than 10 m (Farr and others, Reference Farr2007), although in areas of snow and ice, penetration of the radar signal has been shown to be problematic (Rignot and others, Reference Rignot, Echelmeyer and Krabill2001). We used the SRTM 1 arc-second DEM (38°N–39°N, 74°E–75°E) as our reference elevation dataset during co-registration with two other elevation datasets, and performed corrections in snow-covered areas to account for potential subsurface penetration (detailed below).
ALOS-PRISM DEM and ALOS world 3D-30 m
ALOS-PRISM comprises three optical sensors with a spatial resolution of 2.5 m looking in backward, nadir and forward directions in order to measure precise land elevation (Tadono and others, Reference Tadono, Shimada, Murakami and Takaku2009). We acquired eight sets of level-1B1 triplet mode scenes covering most of our study area captured between July and September 2009 (Table S1). We utilized the ERDAS IMAGINE Photogrammetry to extract the elevation data. We collected ground control points (GCPs) from fine-resolution imagery in Google Earth (provided by Digital Globe, NASA and Landsat/Copernicus), cross-checked against Landsat 8 images and SRTM DEM data to locate accurate horizontal and vertical positions. Tie-points were then automatically generated in IMAGINE Photogrammetry, and subsequently visually validated. Each scene was covered by at least 20 GCPs and between 30 and 40 tie points. ALOS PRISM DEMs were extracted at 30 m spatial resolution to match the SRTM DEM.
The ALOS World 3D-30 m (AW3D30) is a 30 m-resolution global digital elevation dataset released by the Japan Aerospace Exploration Agency in May 2015 using PRISM imagery acquired between 2006 and 2011. Though the AW3D30 presents an average elevation from all of the PRISM data acquired over this period, we used it to fill the gaps present in our self-generated PRISM DEMs, under the assumption that changes in elevation were consistent over this period. The metadata supporting the AW3D30 tiles indicate that up to five scenes were used to construct elevation values over the accumulation areas of the Muztag Ata, for example, yielding much better (and likely more robust) spatial coverage than a single image pair could provide in these zones of no-data.
HMA 8 m DEM
In 2017, the NASA National Snow and Ice Data Center (NSIDC) released the HMA 8 meter DEM datasets covering the eastern Pamir (Shean, Reference Shean2017a, Reference Shean2017b). These DEM datasets were extracted from along-track and cross-track stereoscopic imagery from DigitalGlobe satellites and were provided in strips. Each along-track DEM was acquired on a single date from two images acquired ~60 s apart and the cross-track DEMs were created from image pairs acquired <7 d apart with a spatial resolution of 8 m. In our study, we used 12 DEM strips with timestamps between 2015 and 2016 (Table S2). In order to have sufficient coverage over studied glaciers, some HMA DEMs acquired outside of the ablation season were also used. Before co-registration with SRTM, we resampled the HMA DEMs to 30 m as per the PRISM and SRTM DEMs.
DEM co-registration and biases omission
DEMs generated from different data sources may have inconsistent geolocations owing to sensor instabilities, method limitations, insufficient ground surveying conditions and different post-processing procedures (e.g. Nuth and Kääb, Reference Nuth and Kääb2011). In this study, we co-registered the PRISM and HMA DEMs to the baseline SRTM DEM using the three-step correction framework of Nuth and Kääb (Reference Nuth and Kääb2011). Firstly, horizontal mismatches between each DEM pair were found and removed by iteratively shifting the slave DEM according to terrain slope and aspect differences. Secondly, elevation-dependent biases were adjusted using the linear or polynomial relationship between DEM elevations and the elevation differences. Finally, higher-order biases relating to satellite geometry (along/cross track) were checked in both the PRISM DEM and the HMA DEM. Examples of this procedure are shown in the Supplementary Figures S1 to S4. Mean DEM differences and the std dev. over off-glacier areas before and after co-registration processes are shown in Table S2.
SRTM DEM correction
Given the known penetration of C-band radar waves over snow- and glacier-covered terrain (Gardelle and others, Reference Gardelle, Berthier and Arnaud2012), the SRTM DEM was modified based on the identification of different snow- and ice-facies. Ice, firn and snow-covered areas were extracted by applying a threshold of 2.2 to the Landsat TM3/TM5 ratio (Kääb and others, Reference Kääb, Berthier, Nuth, Gardelle and Arnaud2012). After stretching the ratio (TM4 × TM2)/TM5 to values from 0 to 255, a threshold of 200 was used to discriminate firn and snow from clean ice (Kääb and others, Reference Kääb, Berthier, Nuth, Gardelle and Arnaud2012; King and others, Reference King, Quincey, Carrivick and Rowan2017). Two Landsat ETM+ images acquired approximately coincident with the SRTM mission (Table S1) revealed little snow cover was present at this time, and the debris-covered glacier tongues were largely clear, unlike the heavy snow-cover conditions previously highlighted in Karakoram (Kääb and others, Reference Kääb, Berthier, Nuth, Gardelle and Arnaud2012). We therefore made no modification to the DEM for pixels corresponding with debris-covered ice. For all other areas, we adopted the penetration estimates of Zhang and others (Reference Zhang2016a), who compared SRTM X-band and SRTM C-band data in a study area directly overlapping ours in the eastern Pamir, and we applied adjustments of +2.41 m over firn and snow areas and +0.79 m over clean ice areas.
Outlier filtering and gap filling
We differenced each pair of co-registered DEMs to derive glacier-wide maps of surface elevation change for the two periods of study (2000–09 and 2000–15/16). We discarded changes exceeding ±150 m for both glacierized and non-glacierized terrain as processing blunders and removed values >3 std dev. in off-glacier areas considering the elevation changes should not vary over stable terrain within one decade (Ragettli and others, Reference Ragettli, Bolch and Pellicciotti2016). Further visual inspection revealed the persistence of outliers in some accumulation areas, especially in the PRISM DEMs, as a consequence of image saturation and thus poor feature matching in the photogrammetric DEM extraction. For the accumulation zones, we therefore applied a threshold of ±30 m to the PRISM DEM-SRTM DEM elevation changes and ±45 m to the HMA DEM-SRTM DEM elevation changes assuming that accumulation areas did not experience continuous mass gain or loss of more than 3 m a−1. It should be noted that the PRISM DEM-SRTM DEM generally has poor performance in snow-covered regions leading to bigger data gaps in glacier accumulation zones because of the low radiometric accuracy of the PRISM sensor (Saunier and others, Reference Saunier2010).
We filled the remaining data gaps over glacierized areas in order to calculate glacier-wide surface mass balances (Ragettli and others, Reference Ragettli, Bolch and Pellicciotti2016; King and others, Reference King, Quincey, Carrivick and Rowan2017). The gaps were mostly located at high elevation and over steep slopes. For gaps in the HMA DEM-SRTM DEM difference data, we binned elevation change values per 100 m elevation band and used the median value from each band to fill the remaining gaps (Ragettli and others, Reference Ragettli, Bolch and Pellicciotti2016). To fill the gaps in the PRISM DEM-SRTM DEM difference data, we first used AW3D30 DEM-SRTM DEM difference data. We considered this approach to be more robust than filling with data from adjacent regions given that most of the gaps were in high-elevation zones where abrupt changes over the 5-year period are unlikely to have occurred, and therefore accurately represented by the AW3D30 composite dataset. We then filled any remaining small gaps (<5 × 5 grid cells) using the mean difference changes from surrounding cells.
Glacier delineation and identification of surge-type glaciers
We downloaded unmodified Randolph Glacier Inventory (RGI) version 6.0 (RGI Consortium, 2017) outlines and manually adjusted them to delineate ice extents in 2000, as close to the HMA DEM acquisition dates as cloud and snow-free Landsat ETM+ and OLI images would allow (Table S1). Fine resolution Google Earth images were also used to support glacial boundary identification. Digitizing glacier outlines manually carries with it an element of uncertainty (Hall and others, Reference Hall, Bahr, Shoener, Bindschadler and Chien2003; Kutuzov and others, Reference Kutuzov, Lavrentiev, Smirnov, Nosenko and Petrakov2019). Therefore, we measured the associated uncertainty using the method suggested by Paul and others (Reference Paul2013). We repeatedly digitized four glaciers with different sizes (Kn1, Ks5, Guerdaoban and Kekesayi) in our study area and calculated the accuracy from their std dev. The final accuracy is 1.0% for each individual, as all glaciers in our study have an area larger than 5 km2 (Table S3).
We identified a glacier as surge-type if it underwent a sudden advance of its tongue within our study period, or exhibited specific and characteristic surface feature changes, such as looped or folded moraines or heavy surface crevassing (Meier and Post, Reference Meier and Post1969; Barrand and Murray, Reference Barrand and Murray2006). Landsat TM, ETM+ and OLI images from 1992 to 2020 were used to detect these changes (Table S1). DEM difference data were also used to identify surge events, characterized by a thinning of the upper part of a glacier coincident with a thickening of the lower part, suggesting a clear ice discharge from the reservoir zone to the receiving zone (Jiskoot, Reference Jiskoot, Singh, Singh and Haritashya2011; Bhambri and others, Reference Bhambri, Hewitt, Kawishwar and Pratap2017). Additionally, we also used the results of surge inventories from previous studies (Holzer and others, Reference Holzer2015; Shangguan and others, Reference Shangguan2016; Lv and others, Reference Lv2019).
Calculation of glacier mass changes
For the purposes of this study, we restricted our analysis to 55 glaciers of area >5 km2 with sufficient coverage of DEM difference data to ensure our remote-sensing analyses were robust (Table S3). Volume change (ΔV) for each glacier was calculated through Eqn (1):
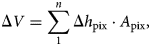
where n is the pixel number of elevation change map for each glacier, Δh pix is the elevation change in each pixel, and A pix is the area of each pixel given 900 m2, as our DEMs share a spatial resolution of 30 m.
To convert volume change to mass balance, we applied a glacier-ice density (f c) of 850 kg m−3 for calculating the water equivalent (w.e.) mass change and included an uncertainty (σ f) of 60 kg m−3 in the density conversion (Huss, Reference Huss2013; Zhang and others, Reference Zhang2016a). The mass-balance (MB) rate was defined by Eqn (2):
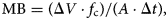
where A represents the glacier area (Table S3) and Δt is the period length between two DEMs used for co-registration.
Uncertainty assessment
Several sources of uncertainties contribute to the glacier mass-balance uncertainty including the elevation change uncertainty, the density uncertainty and the area uncertainty (Fischer and others, Reference Fischer, Huss and Hölzle2015; Kutuzov and others, Reference Kutuzov, Lavrentiev, Smirnov, Nosenko and Petrakov2019). We estimated the errors in elevation changes following the approach suggested by previous studies (Rolstad and others, Reference Rolstad, Haug and Denby2009; Magnússon and others, Reference Magnússon, Belart, Pálsson, Ágústsson and Crochet2016). Considering the influence of autocorrelation between DEMs, spatially correlated area (A corr) is required in this approach, defined by Eqn (3):

where L is the decorrelation length of 600 m for the PRISM DEMs and 400 m for the HMA DEMs (Bolch and others, Reference Bolch, Pieczonka and Benn2011; Brun and others, Reference Brun, Berthier, Wagnon, Kääb and Treichler2017). As studied glaciers are larger than 5 km2, A > A corr and the uncertainty of elevation change (σ Δh) can be quantified using Eqn (4):
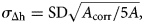
where SD represents the std dev. of the elevation changes over the stable terrain.
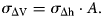
The volume change uncertainty (σ ΔV) was obtained by Eqn (5):
With the errors discussed above, the uncertainty of the annual mass balance (σ MB) was defined by Eqn (6):
where f c is the density conversion factor (0.85) with its uncertainty (σ f) of 0.06 and σ A is the area uncertainty which is 1.0% for each glacier.
Considering data voids can influence the error to some extent, we finally determined the total uncertainty through Eqn (7), as suggested by Zhou and others (Reference Zhou2019a).
where R av is the data coverage rate given in the Supplementary Tables S4 to S6.
We did not apply seasonality correction to glacier mass changes. As the eastern Pamir is considered to have relatively low annual precipitation (Shangguan and others, Reference Shangguan2006), we assumed the decade-scale seasonal change to be negligible.
Results
Combined, the 55 glaciers within our sample showed a slightly positive mean mass balance of 0.06 ± 0.04 m w.e. a−1 between 2000 and 2015/16. In contrast, the 42 glaciers we have data for across our study region showed a slightly negative mean mass balance of −0.06 ± 0.16 m w.e. a−1 over the period 2000–09 (Table 1).
Average mass balances for glaciers in the eastern Pamir during two study periods: 2000–09 and 2000–15/16
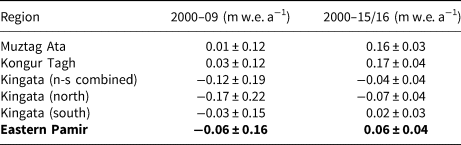
Eastern Pamir and its mass change values are bold type, as this row (the last row) represents the average mass balance condition of the entire region. The first five rows are only parts of the eastern Pamir.
Muztag Ata had a positive mass balance with a mean value of 0.16 ± 0.03 m w.e. a−1 between 2000–15/16 (eight glaciers). The mean mass balance between 2000 and 2009 was 0.01 ± 0.12 m w.e. a−1 (six glaciers) although individual glacier mass-balance estimates varied substantially (Fig. 2, Table S4). Only Kuosikulake Glacier was identified as being of surge-type in the Muztag Ata. Holzer and others (Reference Holzer2015) suggested this glacier was in an active surge phase until 2013.
Surface elevation change over Muztag Ata (a) between 2000 and 2009 and (b) between 2000 and 2015/16. The background is a Landsat OLI band 8 panchromatic image on 9 September 2017.

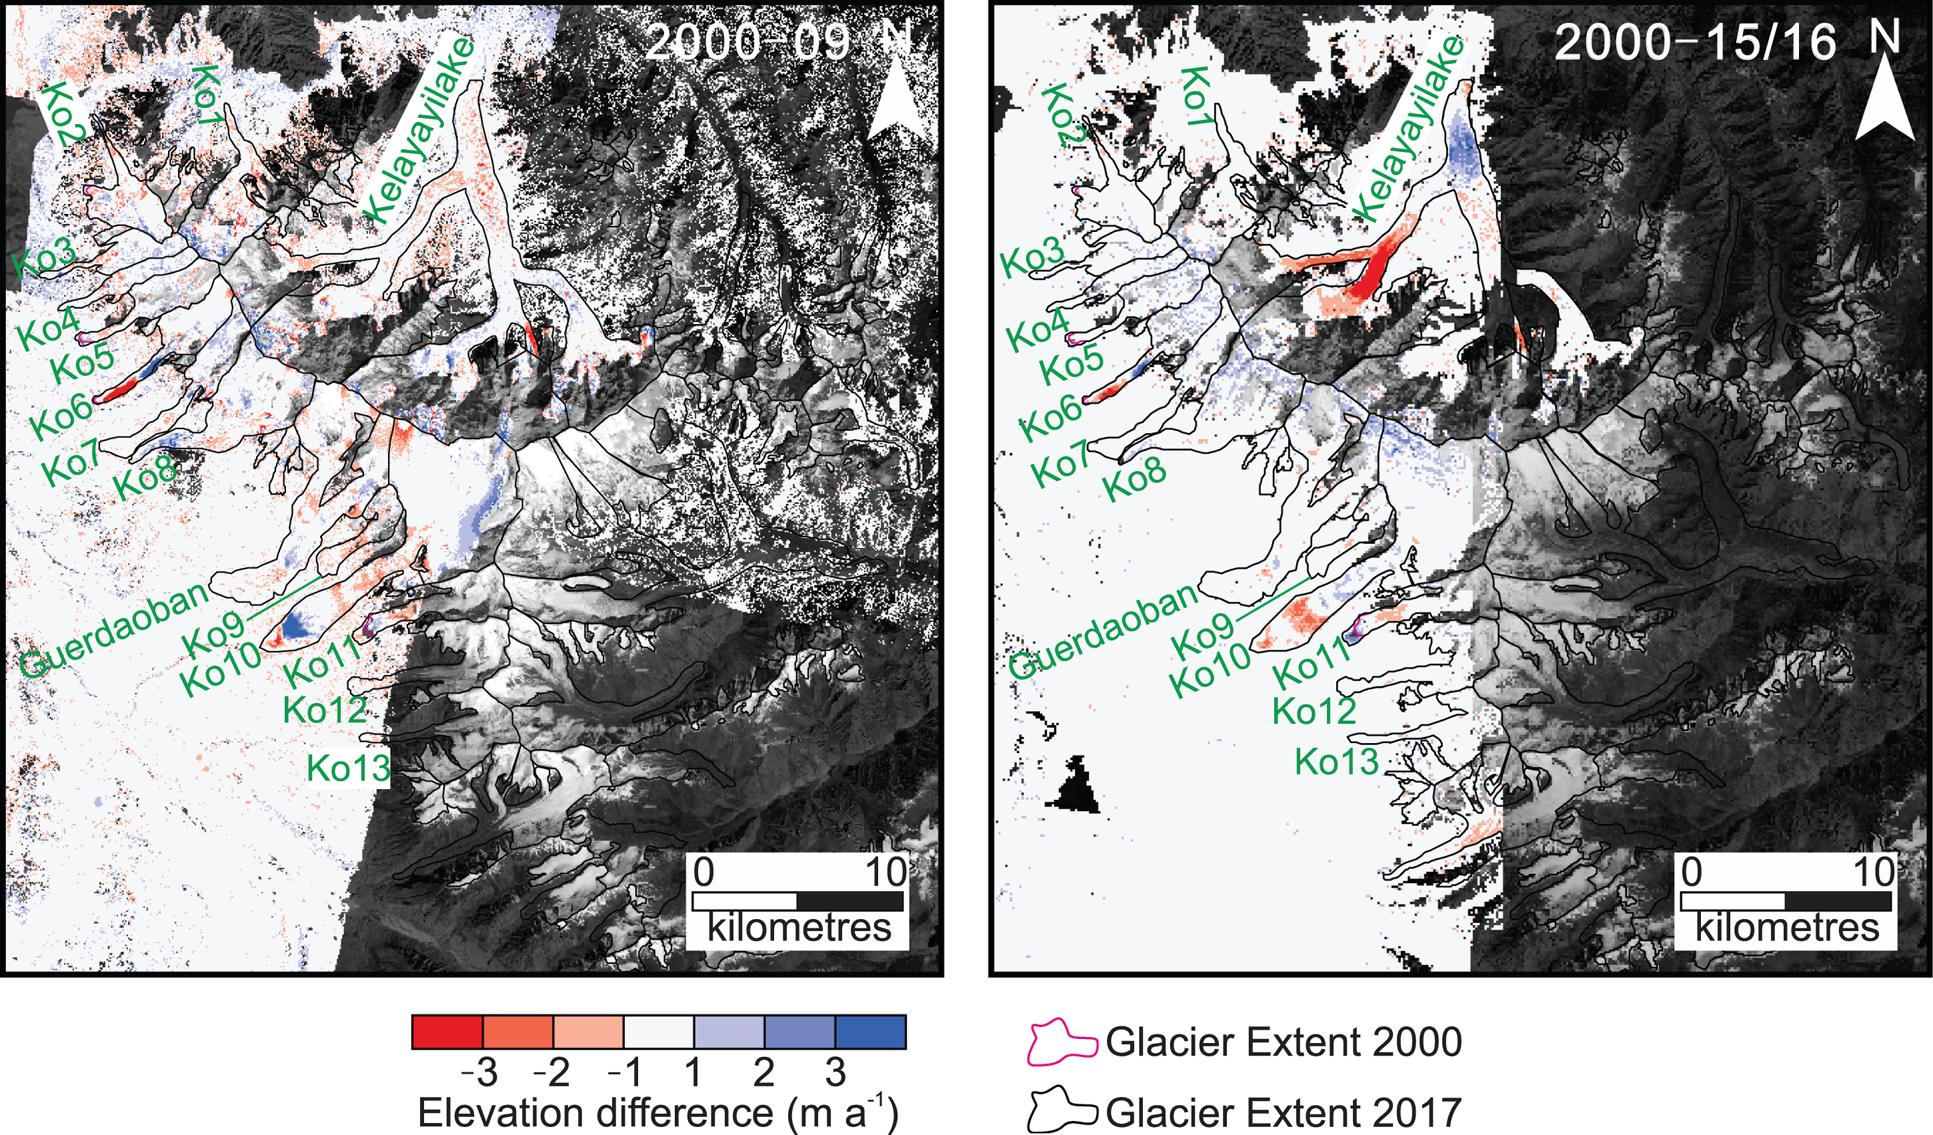
The mass balance of 15 glaciers in the Kongur Tagh had a mean value of 0.17 ± 0.04 m w.e. a−1 between 2000 and 2015/16 (Fig. 3, Table S5). Most glaciers we studied were located on the western-facing slope and showed a positive mass balance; Ko9, one of our smallest studied glaciers, was the only glacier in a state of negative mass balance (−0.09 ± 0.04 m w.e. a−1). Between 2000 and 2009, the ten glaciers we have data for were close to equilibrium (0.03 ± 0.12 m w.e. a−1). We identified four surge-type glaciers in the Kongur Tagh: Kelayayilake, Ko6, Ko10 and Ko11. The surge of Kelayayilake had previously been reported by Shangguan and others (Reference Shangguan2016). It was the only surge-type glacier in the eastern Pamir recorded in RGI version 6.0.
Surface elevation change over Kongur Tagh (a) between 2000 and 2009 and (b) between 2000 and 2015/16. The background is a Landsat OLI band 8 panchromatic image on 9 September 2017.
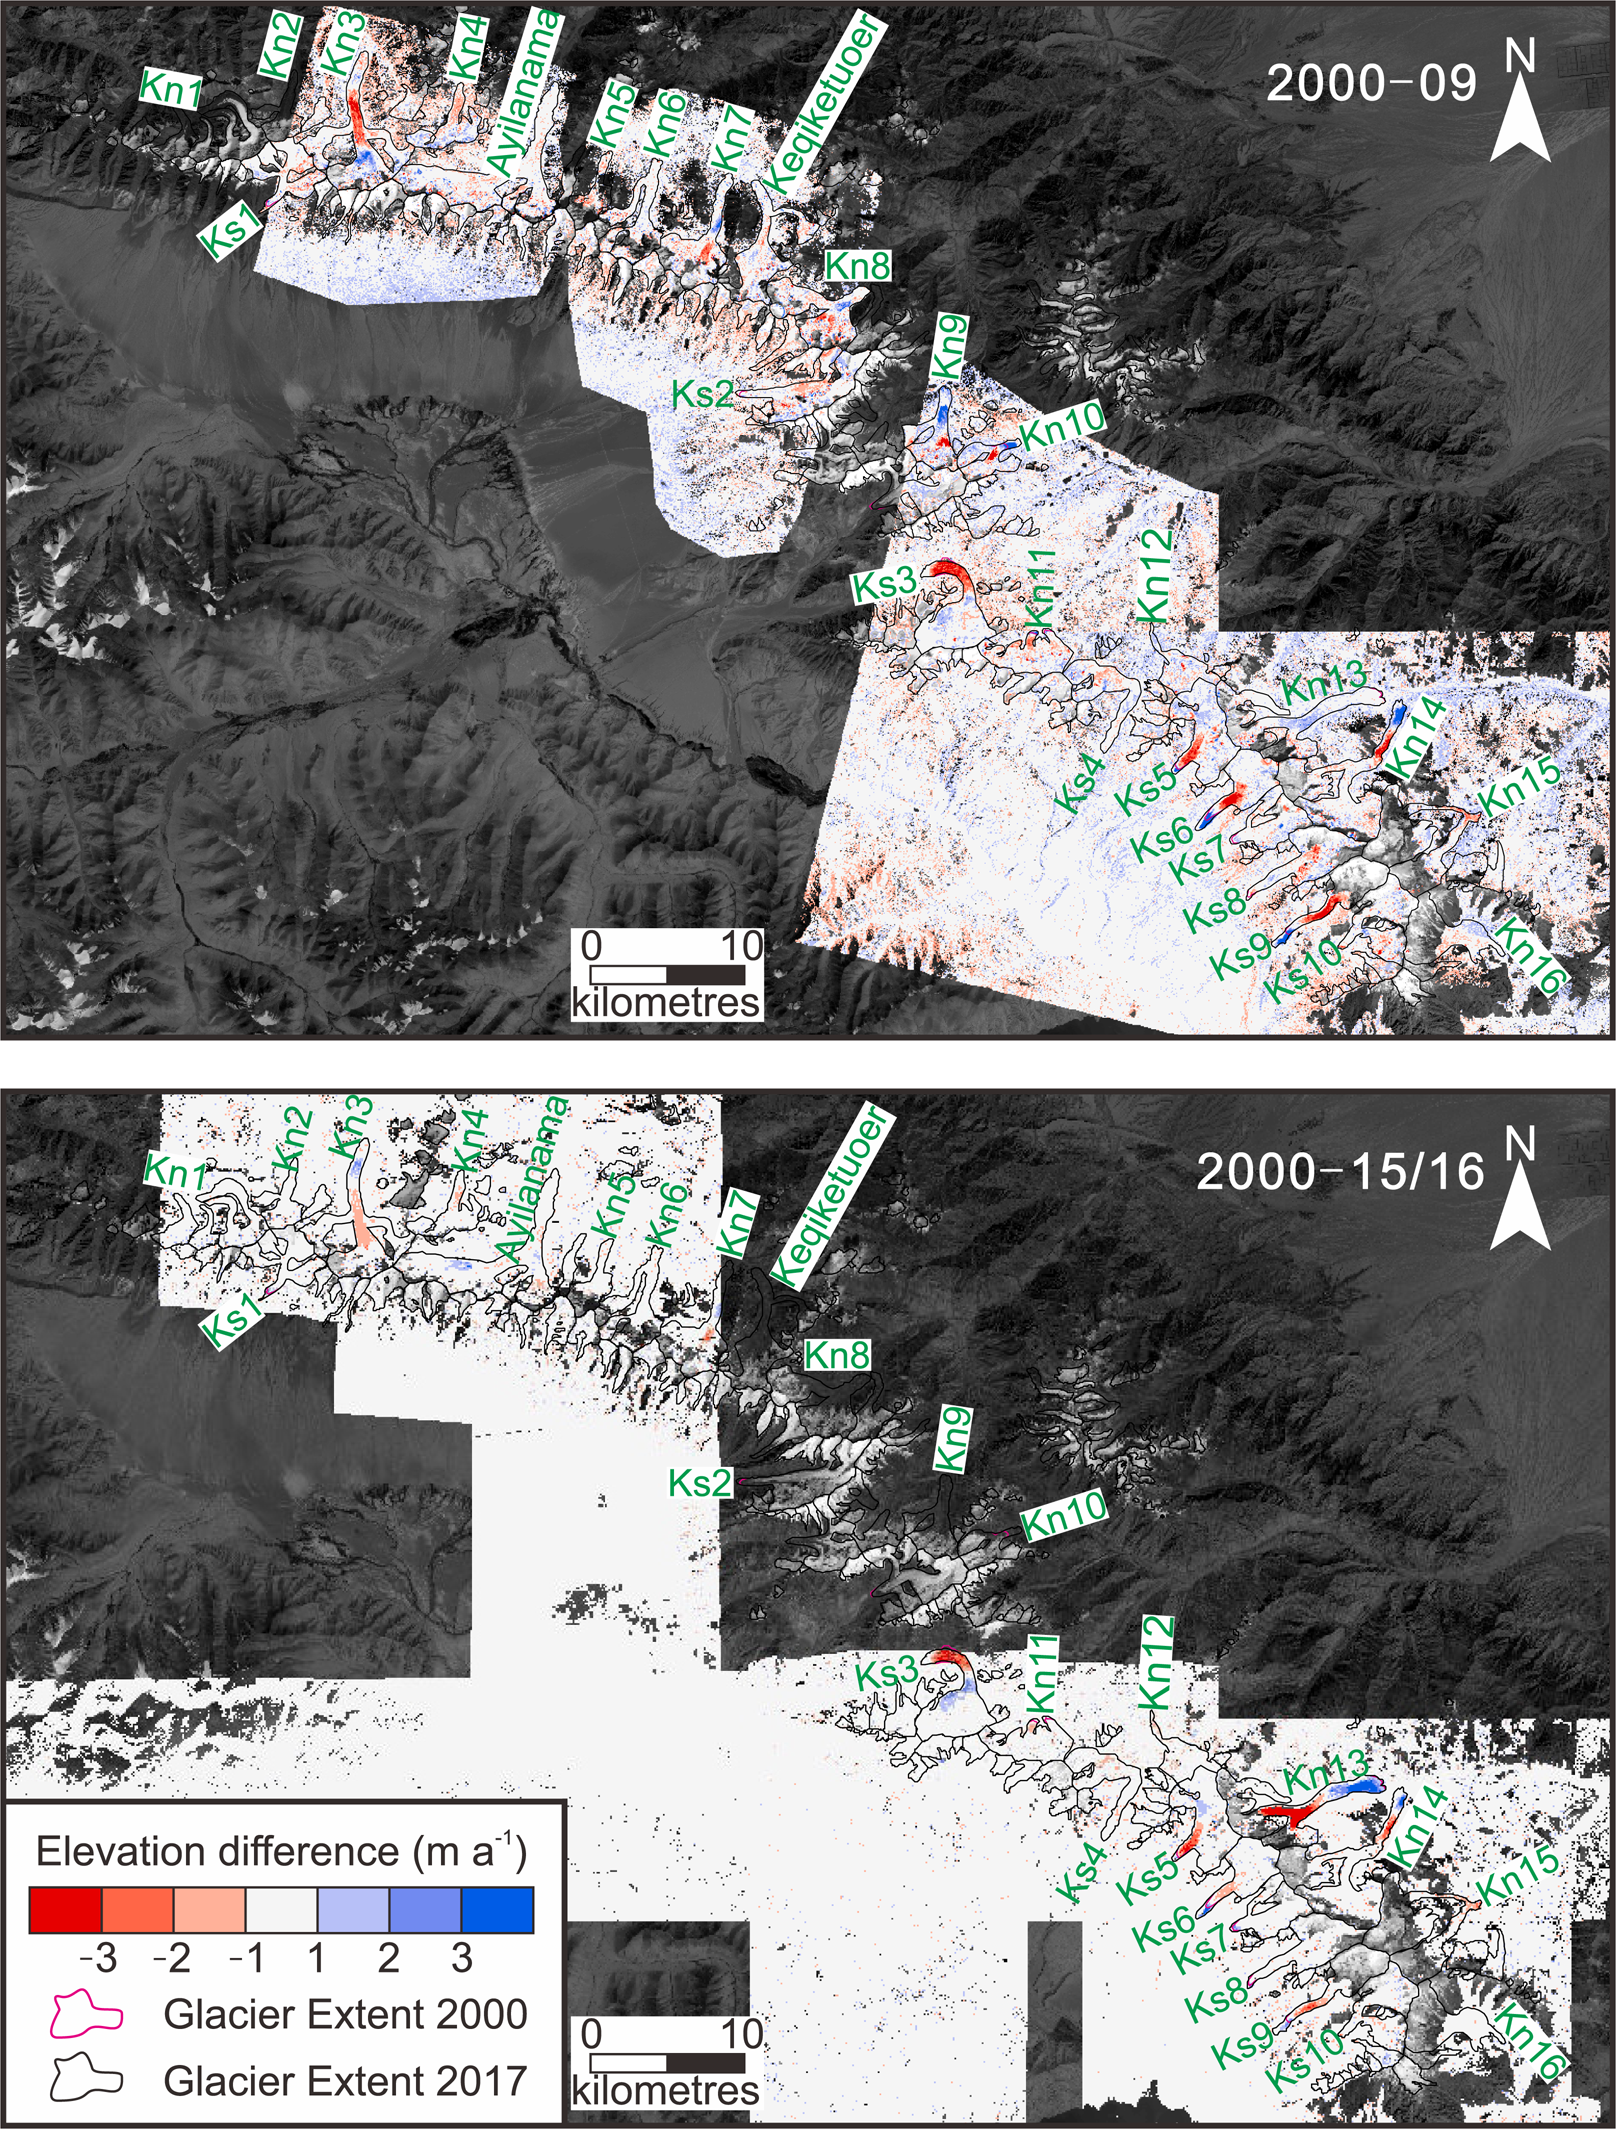
Glaciers in the Kingata Mountains underwent a slight mass loss of −0.04 ± 0.04 m w.e. a−1 (23 glaciers) between 2000 and 2015/16 (Fig. 4, Table S6). The mean mass balance of glaciers on the northern slopes was −0.07 ± 0.04 m w.e. a−1. However, glaciers on the southern slopes had a slight mass gain of 0.02 ± 0.03 m w.e. a−1. Glaciers in the Kingata Mountains experienced more negative mass changes between 2000 and 2009: the mean value of 26 glaciers was −0.12 ± 0.19 m w.e. a−1. North flowing glaciers had a mean mass balance of −0.17 ± 0.22 m w.e. a−1 and south flowing glaciers a mean mass balance of −0.03 ± 0.15 m w.e. a−1. The Kingata Mountains had the largest number (15) of surge-type glaciers in the eastern Pamir. We identified three further surge-type glaciers not captured in the inventory of Lv and others (Reference Lv2019).
Surface elevation change over Kingata Mountains (a) between 2000 and 2009 and (b) between 2000 and 2015/16. The background is a Landsat OLI band 8 panchromatic image on 9 September 2017.
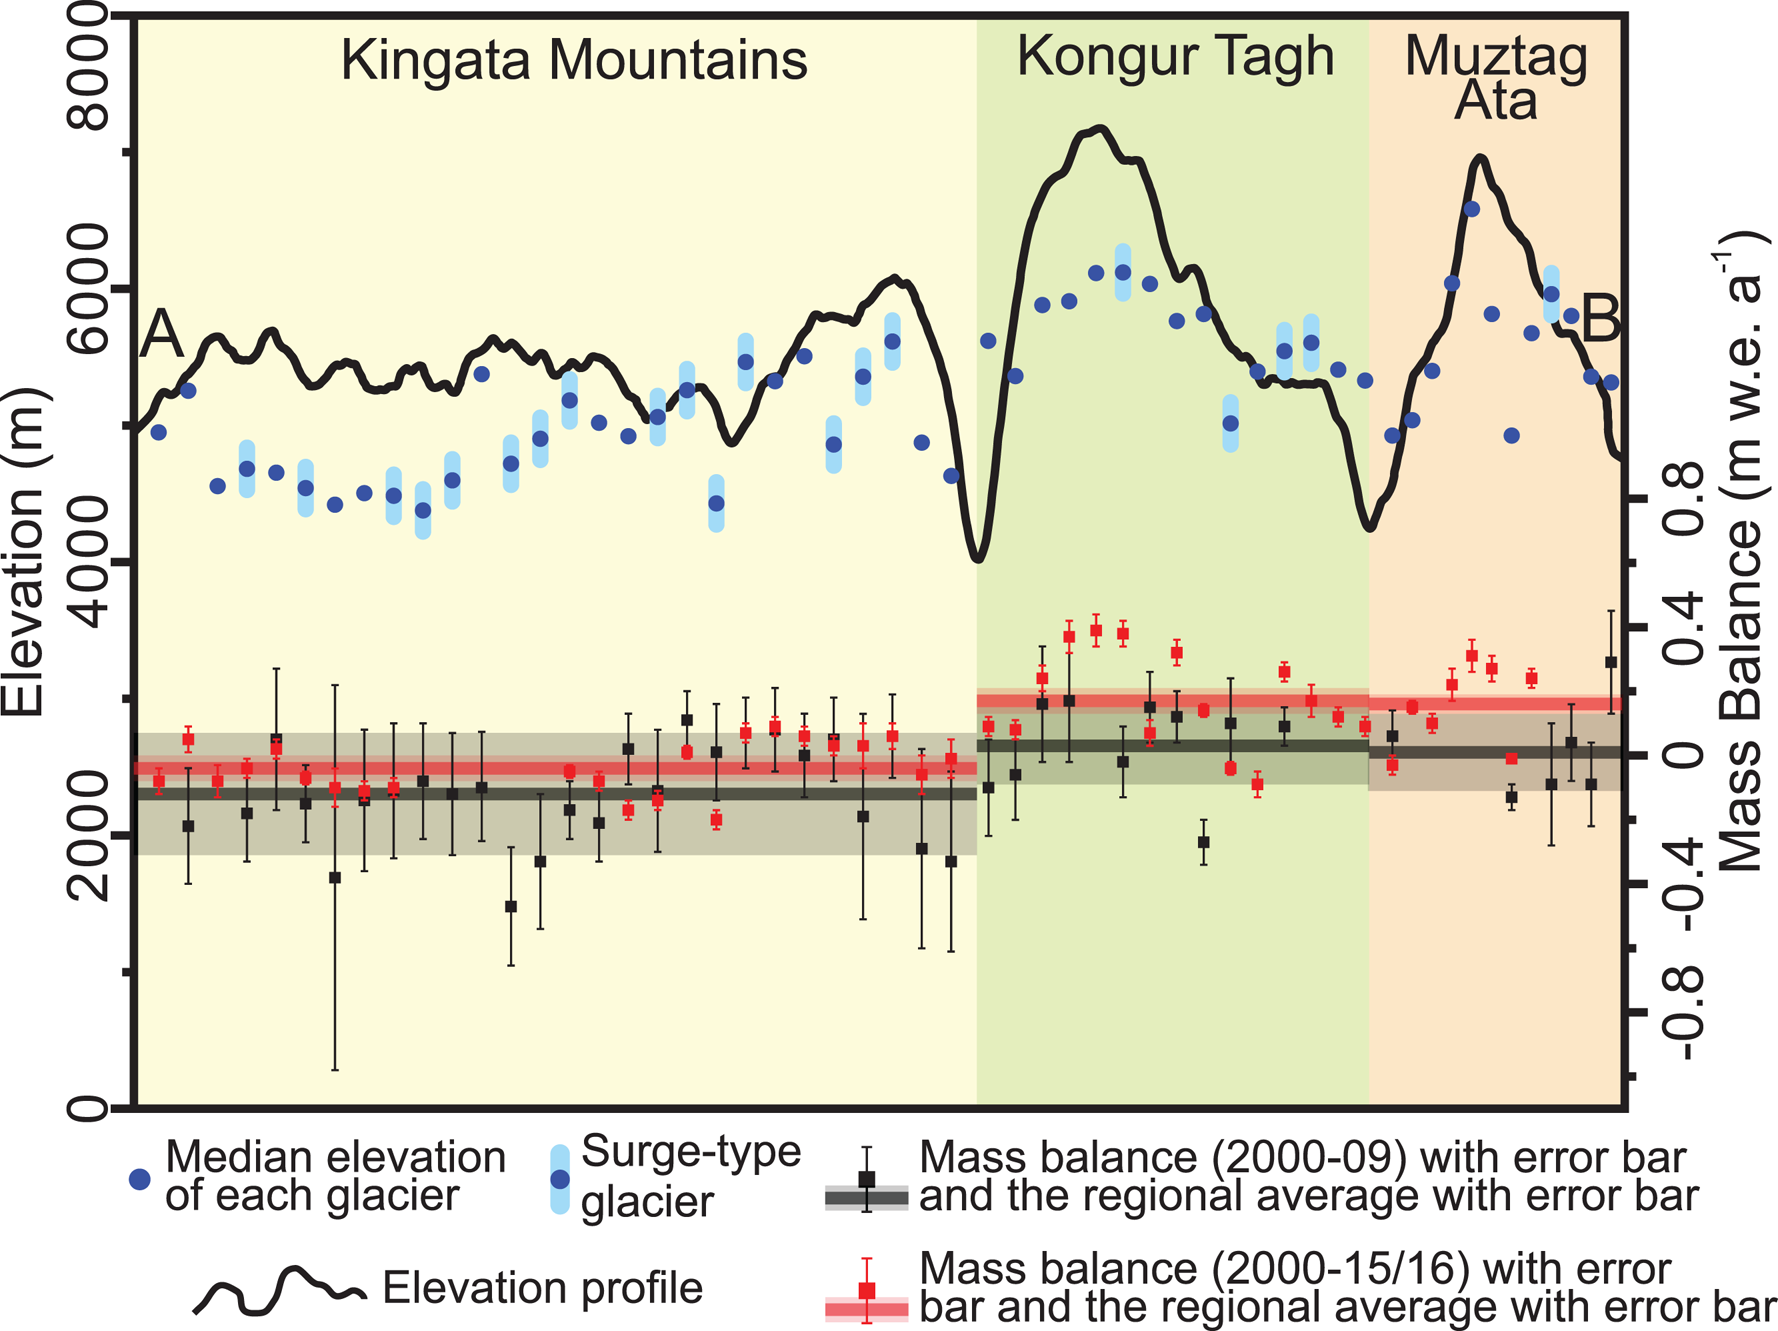
The subtly different mass balance of glaciers in different subregions of our study area indicates that the transition boundary from positive to negative mass balances lies at the northern end of Kongur Tagh (Fig. 1). Mass gains are dominant in the Kongur Tagh and Muztag Ata and mass losses prevail in the Kingata Mountains. However, the mass balances for all sub-regions are increasingly positive when comparing 2000–09 to 2000–15/16 (Fig. 5).
Elevation profile with median elevation and mass balance of each studied glacier along the profile. The orbit of the elevation profile A-B is shown in Figure 1.
Of the 20 surge-type glaciers we identified in the eastern Pamir, 14 have been previously identified (Holzer and others, Reference Holzer2015; Shangguan and others, Reference Shangguan2016; Lv and others, Reference Lv2019; Table S7). Six glaciers were classified as surge-type for the first time; three of these were located in the Kongur Tagh and three were located in the Kingata Mountains. These interpretations were made based on the geodetic data, which showed discrete zones of ice discharge or recharge over our study period (Figs 3, 4; Table S7). It is possible that other surge-type glaciers exist within our dataset, but did not show morphological or geodetic evidence of surging during our analysis.
The coverage of HMA DEMs allowed for the derivation of the geodetic mass balance of 15 surge-type glaciers (Tables S4 to S6). Between 2000 and 2015/16, these glaciers had a slightly lower average mass balance (0.02 ± 0.03 m w.e. a−1) than the remaining 31 non-surge type (0.08 ± 0.04 m w.e. a−1). In the Kingata Mountains, where 11 out of the 15 surging glaciers are located, the average mass balances of the surge- and non-surge-type glaciers were identical (−0.03 ± 0.03 and −0.03 ± 0.04 m w.e. a−1, respectively).
Discussion
Spatial and temporal variability in mass loss
Our data show that since the start of the 21st century, mass balance in the eastern Pamir has experienced a transition from a marginal signal of mass loss (−0.06 ± 0.16 m w.e. a−1) in 2000–09 to an equally marginal mass gain (0.06 ± 0.04 m w.e. a−1) in 2000–15/16, with sub-regions showing temporally homogeneous and spatially consistent behavior (Table 1). These results are closely in line with the regional mass balance of 0.04 ± 0.06 m w.e. a−1 found by Shean and others (Reference Shean2020) over a similar period (2000–2018). This signal of equilibrium (and in places positive mass balance) in the eastern Pamir was already confirmed to extend from the Karakoram (Brun and others, Reference Brun, Berthier, Wagnon, Kääb and Treichler2017; Treichler and others, Reference Treichler, Kääb, Salzmann and Xu2019). We find that mass changes in the Muztag Ata varied from 0.01 ± 0.12 m w.e. a−1 in 2000–09 to 0.16 ± 0.03 m w.e. a−1 in 2000–15/16 (Table 1). These results are largely in line with previous studies that observed mass gains of 0.04 ± 0.45 m w.e. a−1 (2000–09) and 0.04 ± 0.27 m w.e. a−1 (2000–13) (Holzer and others, Reference Holzer2015) and a positive elevation change of 0.17 ± 0.15 m a−1 (2003–2009) (Gardner and others, Reference Gardner2013). In-situ measurements of the Muztag Ata Glacier (a small glacier located between Mu5 and Kalaxiong in our study) also confirmed a 0.25 m w.e. a−1 mass gain from 2005/06 to 2009/10 (Yao and others, Reference Yao2012).
In our study, glaciers in the Kongur Tagh show slightly positive mass balances of 0.03 ± 0.12 m w.e. a−1 in 2000–09 and 0.17 ± 0.04 m w.e. a−1 in 2000–15/16 (Table 1). Zhang and others (Reference Zhang2016a) reported a slightly negative mass balance of −0.16 ± 0.25 m w.e. a−1 from 2000 to 2013/14 in this same region. However, it should be noted that most of the glaciers sampled in their study were eastern- and northern-facing. As most of our studied glaciers are located on the western slope, we suggest they may capture a disproportionate amount of the incoming westerly precipitation, accounting for this disparity in the results. Yao and others (Reference Yao2012) determined that increasing precipitation from the westerly wind resulted in the positive balance (0.25 m w.e. a−1) of the Muztag Ata Glacier during 2005/06–2009/10. Lv and others (Reference Lv2019) also suggested glaciers on the southern wind-facing slope of Kingata Mountains have the potential to capture more precipitation than those to the north.
Glaciers in the Kingata Mountains were in negative mass balance across both our study periods, but became more positive toward the present day (from −0.12 ± 0.19 m w.e. a−1 in 2000–09 to −0.04 ± 0.04 m w.e. a−1 in 2000–15/16). The mean mass balance of glaciers on southern-facing slopes displayed a slight mass gain of 0.02 ± 0.03 m w.e. a−1 between 2000 and 2015/16 (Table 1). These data correlate well with a previously reported acceleration in glacier velocity of glaciers located on the southern slopes of the Kingata Mountains (Lv and others, Reference Lv2019) detected over the periods 1999–2002 and 2013–16.
The spatial distribution of positive (Muztag Ata and Kongur Tagh) and negative (Kingata Mountains) mass-balance estimates we have derived suggests that the eastern Pamir may be the location of a transition zone of glacier fluctuations. The transition point appears to coincide with the Gez River (Fig. 1), which runs along a major fault separating two primary stratigraphic units in the region (Thiede and others, Reference Thiede2013). The topography and the relief differ notably between these two units (Fig. 5). Glaciers in the Kingata Mountains have a mean median elevation of 4913 m a.s.l., while glaciers in the Kongur Tagh and Muztag Ata share mean median elevations of 5662 and 5571 m a.s.l., respectively (Table S3). The distribution of precipitation is somewhat complicated by the extreme relief here and can vary considerably over small spatial scales (Anders and others, Reference Anders2006). However, there does appear to be a clear orographic control on mass balance across the region.
These observations indicate that catchment topography plays an important role in determining mass-balance characteristics. Basing on a relatively strong relationship (R 2 = 0.68), mass balances increased by 0.23 m w.e. a−1 for every 1000 m in median elevation over the period 2000–2015/16 (Fig. 6a). Although the relationship between mass balance and topography is complex, and certainly the availability of ice avalanche material will play a role on an individual glacier scale, we suggest that glaciers located at higher elevations have generally been able to capture more solid precipitation than those at lower elevations, and have subsequently lost less to sublimation and melt (Stigter and others, Reference Stigter2018).
The relationship between mass balance and median elevation of each non-surge-type glacier in the eastern Pamir. The lines of best fit for all sub-regions (a) and each region (b) during the two studied periods are shown. R 2 values for these lines are given in brackets.
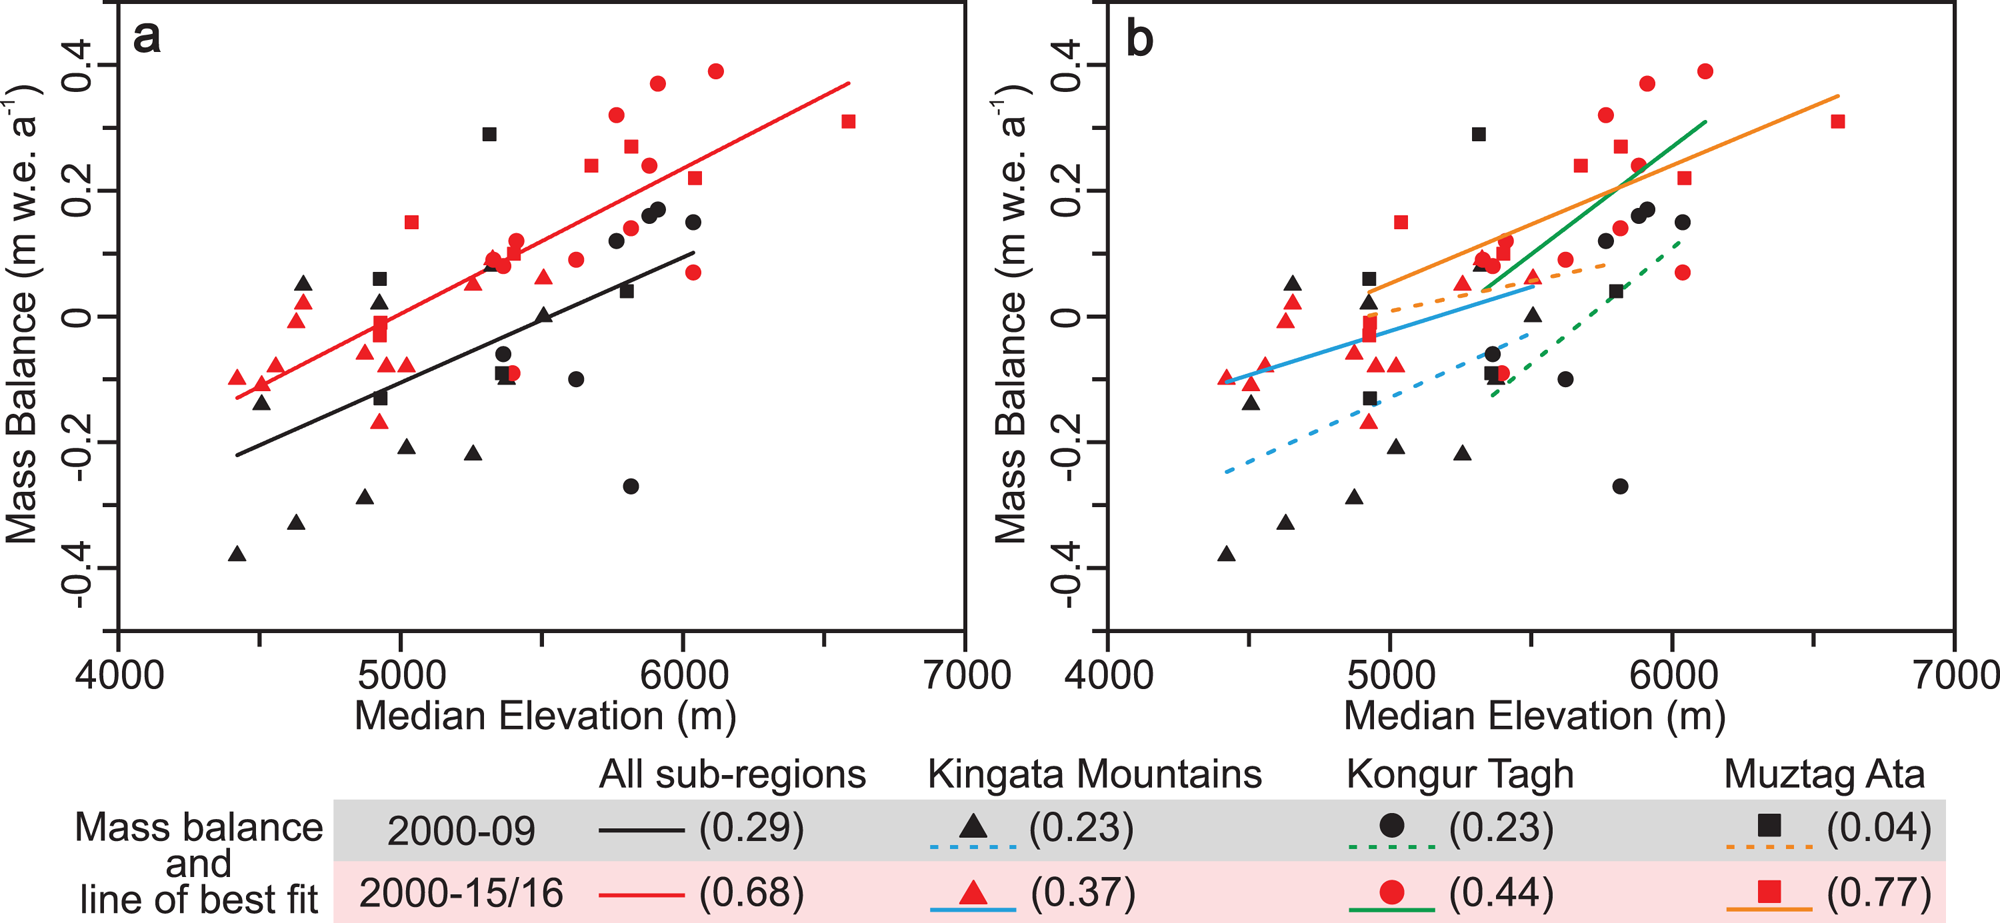
Similar patterns are replicated within individual ranges (Fig. 6b), but here local-scale controls on mass balance become more apparent. There is a noticeably steeper mass-balance gradient for the Kongur Tagh, but the elevation range for the glaciers is narrow, so variability induced by shading, slope and exposure, for example, is exaggerated (R 2 = 0.44 for 2000–2015/16). In the Kingata Mountains (R 2 = 0.37), there is a clear pattern of higher mass gain to the south, and lower mass gain to the north (Table 1), and the variability can be linked to the visibly more extensive accumulation areas feeding glaciers to the south when compared to those to the north (Fig. 1). The relationship between catchment topography and mass balance is in fact strongest in the Muztag Ata (R 2 = 0.77), where relief is extreme (Fig. 5), but most glaciers drain to the west of the divide and are largely consistent in size and surface characteristics (Fig. 1). Our conclusion then is that catchment topography, both on a regional and local scale, plays an important role in controlling these mass-balance patterns.
Mass balance of surge-type glaciers
Compared to more than 60 surging glaciers in the central Pamir (Kotlyakov and others, Reference Kotlyakov, Osipova and Tsvetkov2017), we found 20 surge-type glaciers in the eastern Pamir. Fifteen of these are located in the Kingata Mountains, four are in the Kongur Tagh, and one is located in the Muztag Ata (Table S7).
Despite key advances in recent years in characterizing surge dynamics (Quincey and others, Reference Quincey2011), identifying the climatic and geometric controls on surge-type glacier distribution (Sevestre and Benn, Reference Sevestre and Benn2015), and an increasing number of regional mass-balance estimates that incorporate both surge-type and non-surge-type glaciers (Berthier and others, Reference Berthier and Brun2019), the links between climate and surging are still relatively poorly understood (Kochtitzky and others, Reference Kochtitzky2020). There is clear consensus that surging is predominantly regulated by internal glacier dynamics rather than external climate forcing, yet there may be connections to mass balance, at least at a point if not glacier-wide (Eisen and others, Reference Eisen, Harrison and Raymond2001; Flowers and others, Reference Flowers, Roux, Pimentel and Schoof2011). Several studies have evidenced that during the active stage of surging, glaciers can undergo enhanced ablation, as large volumes of ice are transported to lower and warmer elevations (Aðalgeirsdóttir and others, Reference Aðalgeirsdóttir, Björnsson, Pálsson and Magnússon2005; Kochtitzky and others, Reference Kochtitzky2019), but over decadal timescales, these fluctuations are not captured (Gardelle and others, Reference Gardelle, Berthier, Arnaud and Kääb2013).
The mass balances of surge-type glaciers should therefore be analyzed carefully (Bhambri and others, Reference Bhambri, Hewitt, Kawishwar and Pratap2017). Those presented here show both spatial and temporal variability, but, consistent with other studies, there is evidence of a subtle pattern of fluctuation before, during and after the observed surge events. For example, both Kelayayilake and Ko10 glaciers surged in 2015 and showed positive mass balance before the surges, but entered a period of more negative mass balance during and after the surge events, contrasting with the pattern of mass gain for other glaciers on the southern slope of Kingata Mountains (e.g. Ks6 and Ks10). Glaciers Kn14 and Kn13 also experienced several years of markedly more negative mass balance following their surge events. Glacier Ko6 surged prior to 2000, and showed negative mass balance until 2009, but then transitioned to positive mass balance until 2016, coincident with a period of reservoir recharge after the surge event.
The mass-balance differences of surge-type (0.02 ± 0.03 m w.e. a−1) and non-surge-type glaciers (0.08 ± 0.04 m w.e. a−1) in 2000–15/16 highlighted in our results are within the uncertainty of our data and are not statistically significant, in line with previous studies (Gardelle and others, Reference Gardelle, Berthier, Arnaud and Kääb2013). The mean annual mass budget excluding surge-type glaciers was −0.06 ± 0.04 m w.e. a−1 (−0.07 ± 0.04 m w.e. a−1 with surge-type included) on the northern slopes of Kingata Mountains and 0.01 ± 0.03 m w.e. a−1 (0.02 ± 0.03 m w.e. a−1 with surge-type included) on the southern slopes. Kongur Tagh also showed very similar mass balances without (0.17 ± 0.04 m w.e. a−1) and with (0.17 ± 0.04 m w.e. a−1) surging glaciers included. In the central Pamir, the mean mass balances of surge-type glaciers (0.03 ± 0.14 m w.e. a−1) and non-surge-type glaciers (−0.05 ± 0.28 m w.e. a−1) between 1975 and 1999 were also not significantly different (Zhou and others, Reference Zhou, Li, Li, Zhao and Ding2019b). We therefore suggest that the inclusion of surge-type glaciers in regional assessments derived over a decadal timescale may not impact significantly on the calculated mass budget, but that when assessing geodetic mass balance on an individual glacier scale, due consideration should be given to where that glacier is within its own surge cycle (Kochtitzky and others, Reference Kochtitzky2019).
Glacier mass-balance uncertainty
Although we accounted for all possible methodological uncertainties in our data, there remain some elements that cannot be explicitly quantified. Common issues in studies of geodetic mass balance include the biases introduced by data voids (Tables S4 to S6) or anomalous glacier surface elevation data resulting from low image contrast, particularly in glacier accumulation zones (McNabb and others, Reference McNabb, Nuth, Kääb and Girod2019). Similarly, the penetration of C-band radar waves into snow and ice has been shown to cause the underestimation of glacier surface elevation change by as much as 20% at a regional scale if left uncorrected (Gardelle and others, Reference Gardelle, Berthier and Arnaud2012; Vijay and Braun, Reference Vijay and Braun2016). Large fluctuations in glacier reference areas between DEM acquisitions may also introduce systematic errors (Zemp and others, Reference Zemp2013), as can the spatial autocorrelation of elevation differences (Rolstad and others, Reference Rolstad, Haug and Denby2009) and the spatially variable density of ice and firn (Huss, Reference Huss2013).
Our use of the C-band SRTM DEM and ALOS PRISM images of relatively low radiometric resolution, and the inclusion of surge-type glaciers that have undergone dramatic morphological changes between one DEM acquisition and the next, makes biases relating to surface penetration, DEM blunders and spatially variable ice density most pertinent in our study.
The availability of Landsat ETM+ scenes close to the acquisition date of the SRTM over our study area allowed for the application of penetration corrections depending on glacier surface conditions. We were therefore able to account for the spatial (elevation-dependent) variability in penetration (Vijay and Braun, Reference Vijay and Braun2016) across our study area. We carefully selected the threshold to remove erroneous PRISM DEM-SRTM DEM difference data over glacier accumulation zones, where the magnitude of elevation change is expected to be low. Similar elevation-dependent filtering has been successfully applied in other studies using low radiometric resolution imagery (Pieczonka and Bolch, Reference Pieczonka and Bolch2015) where more typical, statistical filtering (e.g. Gardelle and others, Reference Gardelle, Berthier, Arnaud and Kääb2013) may not be sufficient.
Ice density conversion factors have been given specific attention in the literature in recent years (Huss, Reference Huss2013), but still require some element of estimation or assumption. In our study, the use of a single factor is further complicated by the fact that during and after a surge event, the glacier surface is completely reorganized such that with the development of deep crevassing, the ice surface is effectively more porous. It may be, therefore, that for surge-type glaciers in particular, our conversion factor represents an overestimate of ice density. Ultimately, however, the close agreement of our mass-balance estimates with those of other studies, in particular those not involving the SRTM (e.g. Shean and others, Reference Shean2020), suggests our results are robust.
Conclusions
Using three DEM datasets, the SRTM DEM, the NASA HMA DEM and individual DEMs extracted from ALOS PRISM optical imagery during the intervening period, we reconstructed the mass-balance conditions of glaciers in the eastern Pamir for two epochs: 2000–09 and 2000–15/16. Our data confirm that the eastern Pamir is a transition zone from positive to negative mass balance with the boundary located at the north end of Kongur Tagh, and coincident with the Gez River, which separates two major stratigraphic units of contrasting topography. Overall, glaciers in the Muztag Ata and Kongur Tagh experienced mass gain and glaciers in the Kingata Mountains experienced mass loss during the first part of the 21st century, while almost all glaciers gained more mass (or lost less mass) through time. Individual catchment topography plays a strong role in determining glacier mass-balance characteristics, with those glaciers located at higher elevations showing, on average, more positive mass balance than those situated at lower elevations. Finally, we find that over broad areas and decadal timescales, the impact of including surge-type glaciers on regional mass budget calculations is statistically insignificant, but that during and immediately after surge events, individual glaciers may enter periods of negative mass balance as a consequence of enhanced ablation.
Supplementary material
The supplementary material for this article can be found at https://doi.org/10.1017/jog.2020.54
Acknowledgements
This research was supported by the Key Research Program of Frontier Sciences CAS [QYZDY-SSW-DQC026] and the National Natural Science Foundation of China [41590853]. SRTM DEM and NASA HMA DEM data were sourced from NASA Earthdata (https://earthdata.nasa.gov/), and the ALOS Global Digital Surface Model (AW3D30) was sourced from JAXA (https://www.eorc.jaxa.jp/ALOS/en/aw3d30/index.htm). ALOS PRISM level-1B1 products were ordered from http://en.alos-pasco.com/alos/prism/ under a 4th ALOS RA data grant awarded to Quincey (PI No. 1008). Landsat-7 and Landsat-8 images can be freely downloaded from http://glovis.usgs.gov. Randolph Glacier Inventory data were acquired from Global Land Ice Measurements from Space (GLIMS) (RGI Consortium, 2017). Lv acknowledges program B for outstanding PhD candidates of Nanjing University and the support from the Chinese Scholarship Council (CSC) for studying at the University of Leeds. We also thank Rakesh Bhambri, Hester Jiskoot and three anonymous reviewers for their supportive comments on this paper.
Conflict of interest
The authors declare that they have no conflict of interest.


 Open access