





Introduction
Arthropods are the most abundant terrestrial organisms, comprising nearly 80% of all known animals, with an estimated 7 million species worldwide (Zhang Reference Zhang and Zhang2013; Stork Reference Stork2018). Traditionally, arthropods have seen limited use for biodiversity assessments (Margules and Austin Reference Margules and Austin1991; Oliver and Beattie Reference Oliver and Beattie1993) because of the difficulty in identifying large numbers of specimens and the presence of many undescribed species. As a result, studies often target low-diversity groups (e.g., Prendergast et al. Reference Prendergast, Quinn, Lawton, Eversham and Gibbons1993), such as vertebrates, plants, or a few indicator taxa (Howard et al. Reference Howard, Viskanic, Davenport, Kigenyi, Baltzer and Dickinson1998; Noss Reference Noss1999; Moore et al. Reference Moore, Balmford, Brooks, Burgess, Hansen and Rahbek2003), or are limited to a single collection method (Montgomery et al. Reference Montgomery, Belitz, Guralnick and Tingley2021). These practices undoubtedly overlook key segments of the ecological community (Lawton et al. Reference Lawton, Bignell, Bolton, Bloemers, Eggleton and Hammond1998; Ferrier et al. Reference Ferrier, Powell, Richardson, Manion, Overton and Allnutt2004; Krell Reference Krell2004). Considering the global decline in biodiversity (Pimm et al. Reference Pimm, Jenkins, Abell, Brooks, Gittleman and Joppa2014; Intergovernmental Science–Policy Platform on Biodiversity and Ecosystem Services Reference Díaz, Settele, Brondizio, Ngo, Guèze and Agard2019), including of insects (Hallmann et al. Reference Hallmann, Sorg, Jongejans, Siepel, Hofland and Schwan2017; Lister and Garcia Reference Lister and Garcia2018), understanding the factors responsible for these declines – especially the relative contributions of climate change, land-use change, natural resource exploitation, pollution, and invasive species – is imperative. Large-scale assessments are needed to monitor change through time and space, to gauge the impact of the various drivers of biodiversity loss, and to assess the impact of conservation and management efforts in reversing trends. The critical first step in this process is to complete comprehensive biodiversity inventories at regional and local scales.
The most effective way to perform rapid biodiversity assessments on terrestrial arthropods has attracted considerable debate (e.g., Noyes Reference Noyes1989; Marshall et al. Reference Marshall, Anderson, Roughley, Behan-Pelletier and Danks1994; Oliver and Beattie Reference Oliver and Beattie1993; Krell Reference Krell2004; Ward and Larivière Reference Ward and Larivière2004; Hyvarinen et al. Reference Hyvarinen, Kouki and Martikainen2006; Ashfaq et al. Reference Ashfaq, Sabir, El-Ansary, Perez, Levesque-Beaudin and Khan2018; Montgomery et al. Reference Montgomery, Belitz, Guralnick and Tingley2021). Many passive trapping and active collection methods exist, and most are inexpensive to perform, but they sample only subsets of local biodiversity (Epsky et al. Reference Epsky, Morrill, Mankin and Capinera2008; Zou et al. Reference Zou, Feng, Xue, Sang and Axmacher2012; Prado et al. Reference Prado, Ngo, Florez and Collazo2017). Even Malaise traps (Malaise Reference Malaise1937), which have been widely adopted because they collect large, diverse samples with little effort, are strongly biased towards flying insects (Karlsson et al. Reference Karlsson, Pape, Johanson, Liljeblad and Ronquist2005; Steinke et al. Reference Steinke, deWaard, Sones, Ivanova, Prosser and Perez2022). Owing to the high diversity of arthropods and their varied life histories, no single collection method can deliver a comprehensive inventory of these organisms (Zou et al. Reference Zou, Feng, Xue, Sang and Axmacher2012; Montgomery et al. Reference Montgomery, Belitz, Guralnick and Tingley2021). Many studies have compared different collection methods (Martin Reference Martin1977; Muirhead-Thompson Reference Muirhead-Thompson1991; Cannings Reference Cannings and Ramsay1992; Hoffmann and Stoll Reference Hoffmann and Stoll2025), but few have assessed overlap in species composition (Souto-Vilarós et al. Reference Souto-Vilarós, Navarro-Valenica, Zamora, Campusano, Lamarre and Perez2025). Although it is recognised that comprehensive inventories require the use of several sampling methods, which combination of methods maximises species richness and sampling efficiency remains unclear.
In this study, we assessed the efficiency and complementarity of a standardised combination of six sampling methods (Malaise trap, flight intercept trap, pan trap, pitfall trap, Berlese funnel, and sweep net) deployed at 13 different locations across Canada. We used DNA barcoding to determine species richness and community composition of the samples.
Methods
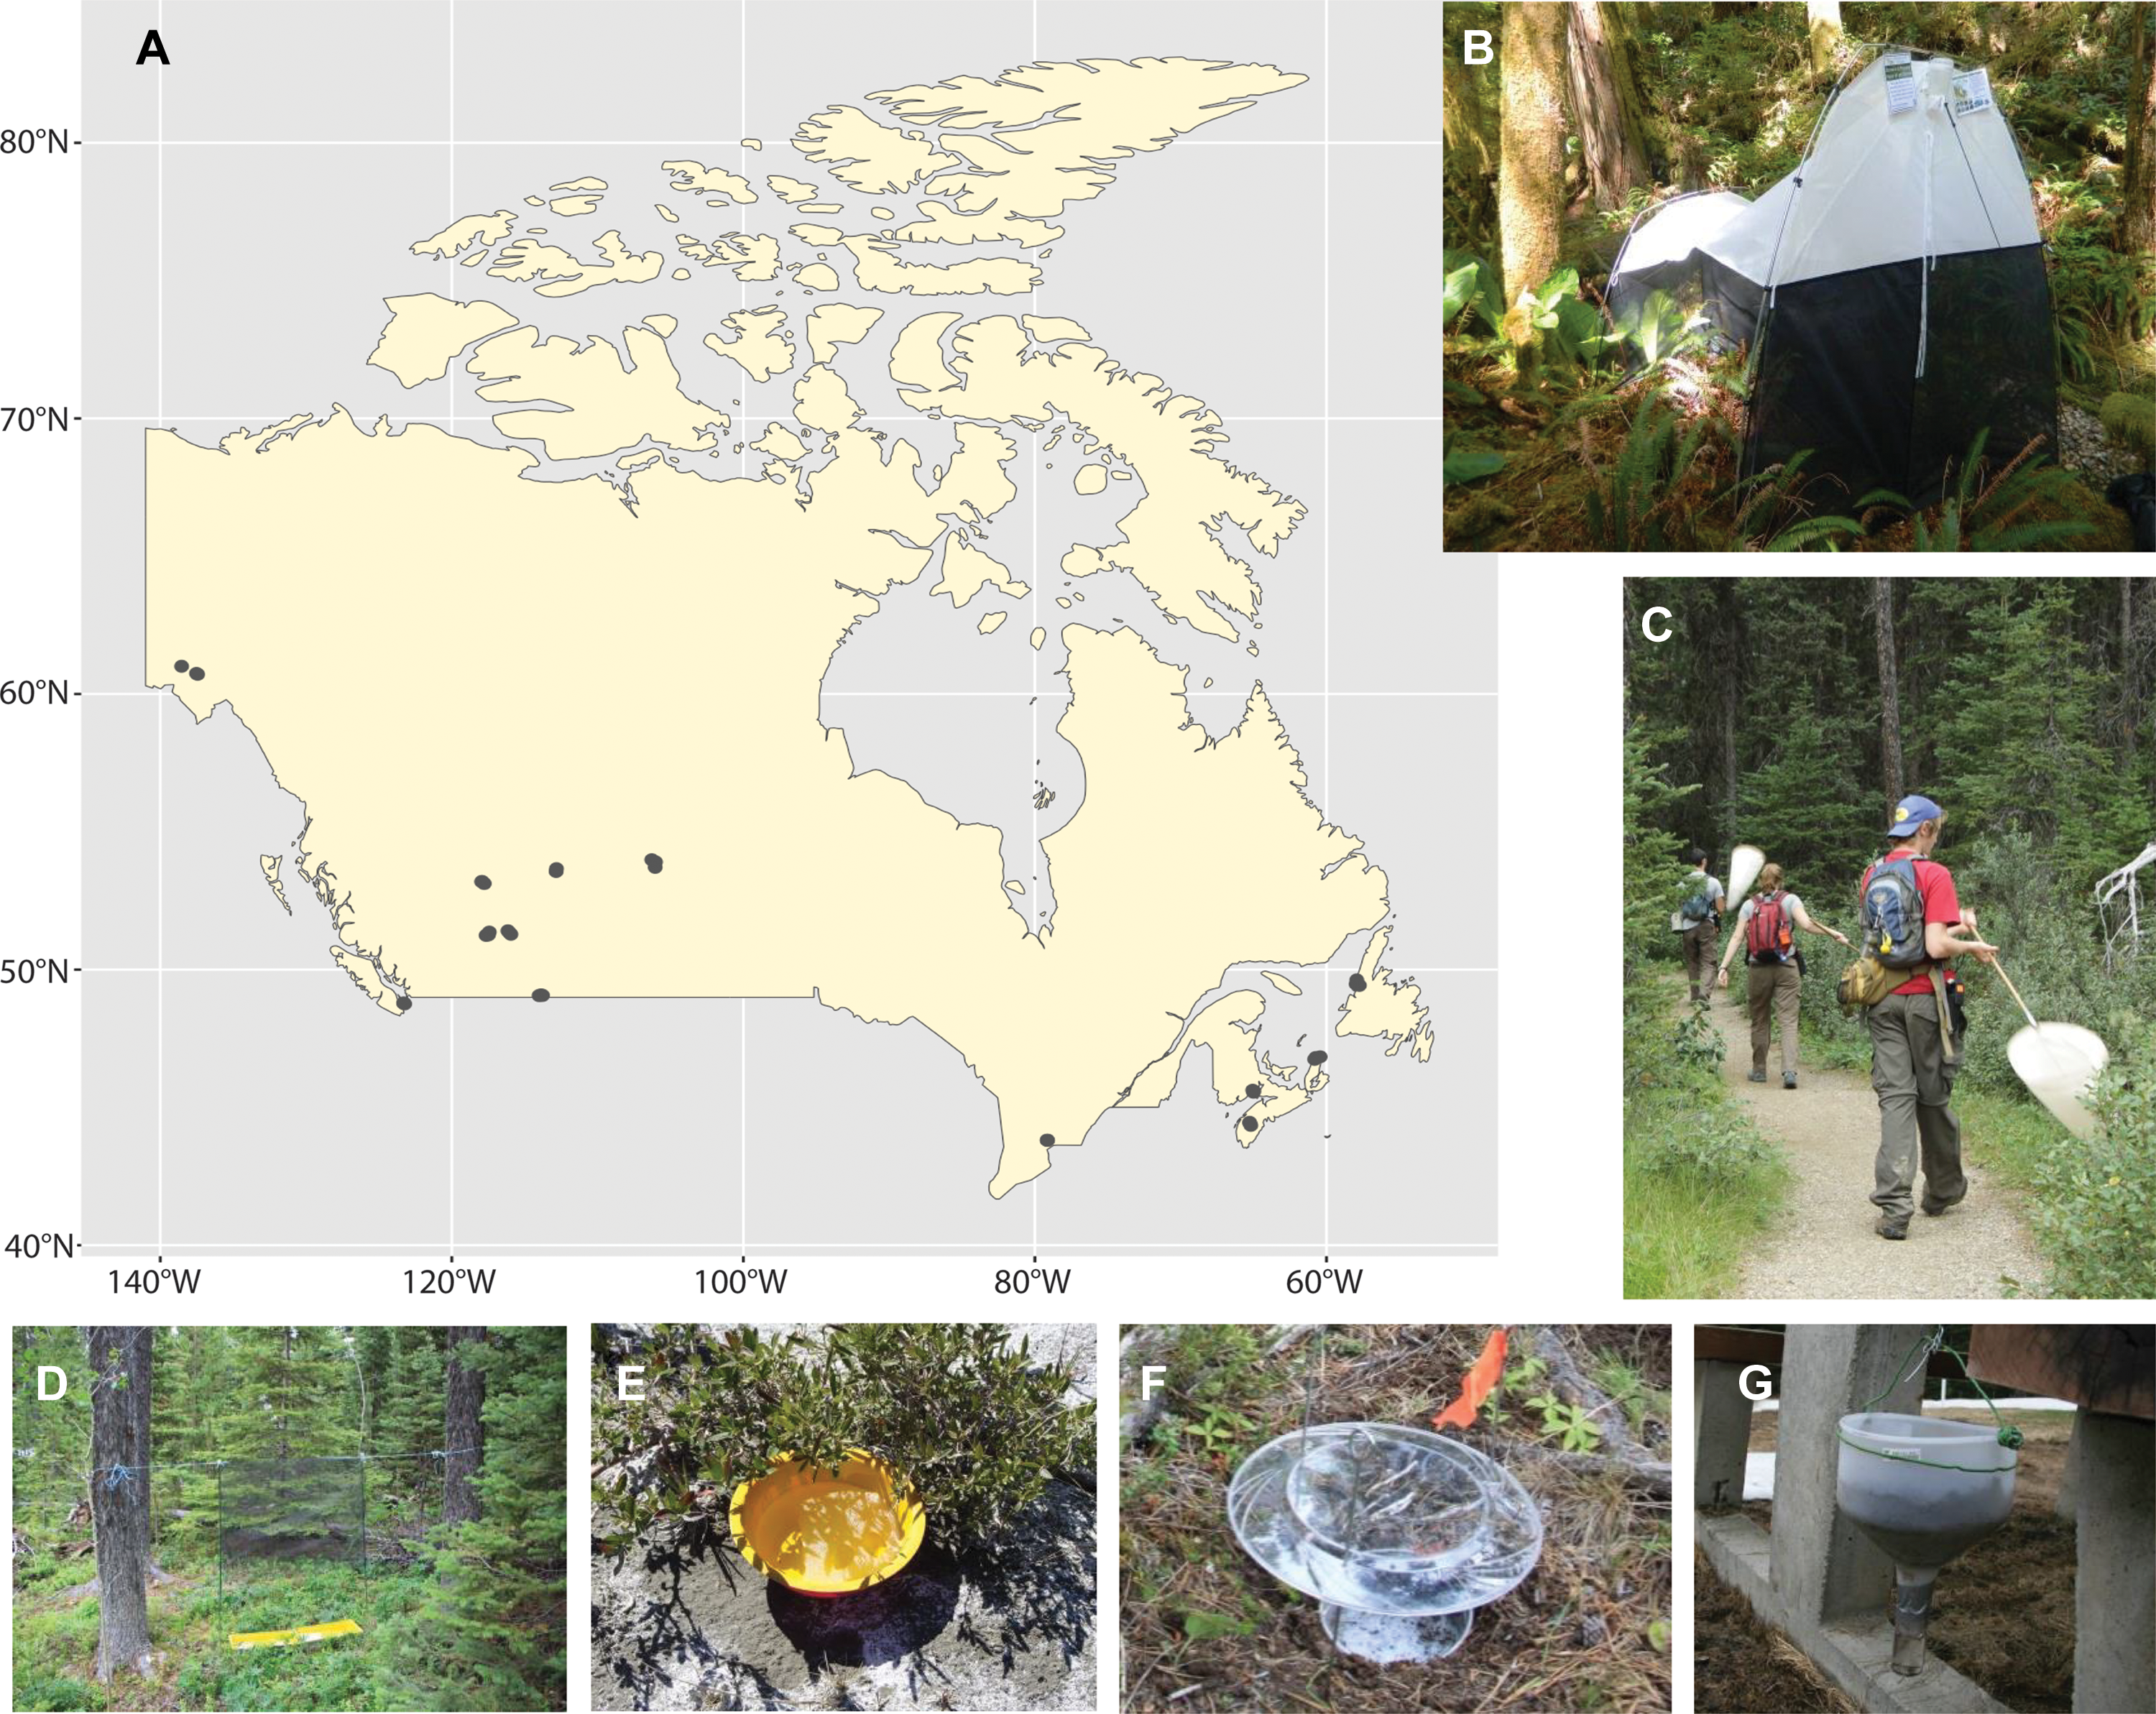
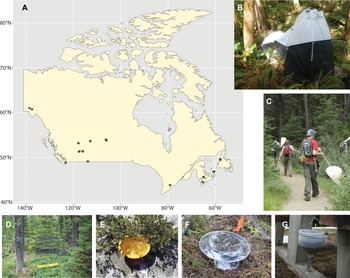
We deployed six sampling methods at 13 Canadian national parks situated in seven provinces (Alberta, British Columbia, New Brunswick, Newfoundland, Nova Scotia, Ontario, and Saskatchewan) and one territory (Yukon Territory) during 2013 and 2014 (Figure 1A). At each park, we selected three sites to represent its dominant habitats. At each site, two Townes-style Malaise traps (Figure 1B), one flight intercept trap (Figure 1D), 10 yellow pan traps (Figure 1E), and 10 pitfall traps were deployed for one week (Figure 1F). In addition, sweep netting was performed by four staff at each site for five consecutive minutes before all arthropods captured in the net were preserved (Figure 1C). This procedure was repeated three times during the sampling week. One leaf litter sample was also collected per site at the beginning of each sampling period and placed in a modified Berlese–Tullgren funnel (set up with no heat source at the top, an approach similar to a Winkler trap; Figure 1G) for the remainder of the week (∼144 hours). All sampling occurred within a 15-m radius of the nearest Malaise trap.
A, Map of sampling sites within Canada. The trap types used for this study: B, Malaise trap; C, sweep netting; D, intercept trap; E, pan trap; F, pitfall trap; and G, Berlese funnel.
Each Malaise trap sample was collected in a 500-mL Nalgene bottle filled with approximately 375 mL of 95% ethanol. Each bottle was removed from the trap after the week, and the ethanol was decanted. Samples from the two Malaise traps at each site were pooled, and the weekly sample was filled with 500 mL of fresh ethanol and stored at –20 °C. The flight intercept trap and pan traps (15 cm diameter) were half-filled with soapy water, whereas the pitfall traps (10.5 cm diameter) were half-filled with 95% ethanol. The pitfall traps were covered with chicken-wire mesh to prevent capture of small vertebrates. The flight intercept trap, pan traps, and pitfall traps were serviced every 48 hours, resulting in three samples for each method. The flight intercept and pan traps were filtered through 50-µm Nitex mesh. Fresh water was used to dilute the soap residue on the specimens before they were preserved in 95% ethanol. All traps were topped up with soapy water or ethanol, as necessary, during their week-long deployment.
Samples were accessioned and processed following a standard workflow (deWaard et al. Reference deWaard, Levesque-Beaudin, deWaard, Ivanova, McKeown and Miskie2019). All specimens from the samples, except very common species (Gastropoda: Stylommatophora: Helicidae: Cepaea nemoralis (Linnaeus); Insecta: Hymenoptera: Formicidae: Myrmica rubra (Linnaeus), Vespidae: Vespula maculifrons (Buysson), and a few collembolan species), were DNA barcoded. For these taxa, 1–12 specimens were analysed per sample, and the remainder were counted and archived. All specimen records and associated metadata were uploaded to the Barcode of Life Data Systems (BOLD; Ratnasingham and Hebert Reference Ratnasingham and Hebert2007; Ratnasingham et al. Reference Ratnasingham, Wei, Chan, Agda, Agda and Ballesteros-Mejia2024).
All sequence analyses employed a standard Sanger-based workflow (deWaard et al. Reference deWaard, Levesque-Beaudin, deWaard, Ivanova, McKeown and Miskie2019). Sequence information and trace files were uploaded to the associated specimen records on BOLD. All specimens and sequences are available through the public dataset, DS-CANSS, on BOLD (dx.doi.org/10.5883/DS-CANSS) and through an occurrence record file (https://doi.org/10.5281/zenodo.15427261), following the Barcode Core Data Model (BCDM; https://github.com/DNAdiversity/BCDM).
Specimens that were successfully sequenced were assigned to an existing or new barcode index number (BIN), a reliable proxy for species, following Ratnasingham and Hebert (Reference Ratnasingham and Hebert2013). Further taxonomic assignment was carried out using BOLD queries and BIN matches. Specimens where the BIN contained records identified only to a single family, genus, or species received that identification. When a new BIN was encountered, the sequence was queried through the BOLD Identification Engine (Ratnasingham et al. Reference Ratnasingham, Wei, Chan, Agda, Agda and Ballesteros-Mejia2024). Sequences with up to 10% divergence at the family level and up to 5% at the genus level and placed within a monophyletic cluster of BINs were assigned to that genus or family. Taxonomic assignments were further verified by reviewing a taxon ID tree and matching images to help detect possible contamination.
Datasets were downloaded from BOLD using the “bold.fetch” function of the BOLDconnectR package (Padhye et al. Reference Padhye, Ballesteros-Mejia and Ratnasingham2025). All further analyses were performed in R, version 4.1.1 (R Core Team 2020), using functions of the tidyverse library (Wickham et al. Reference Wickham, Averick, Bryan, Chang, McGowan and François2019). Chord diagrams depicting the extent of BIN sharing between collecting methods were generated using the circlize package (Gu et al. Reference Gu, Gu, Eils, Schlesner and Brors2014).
Results
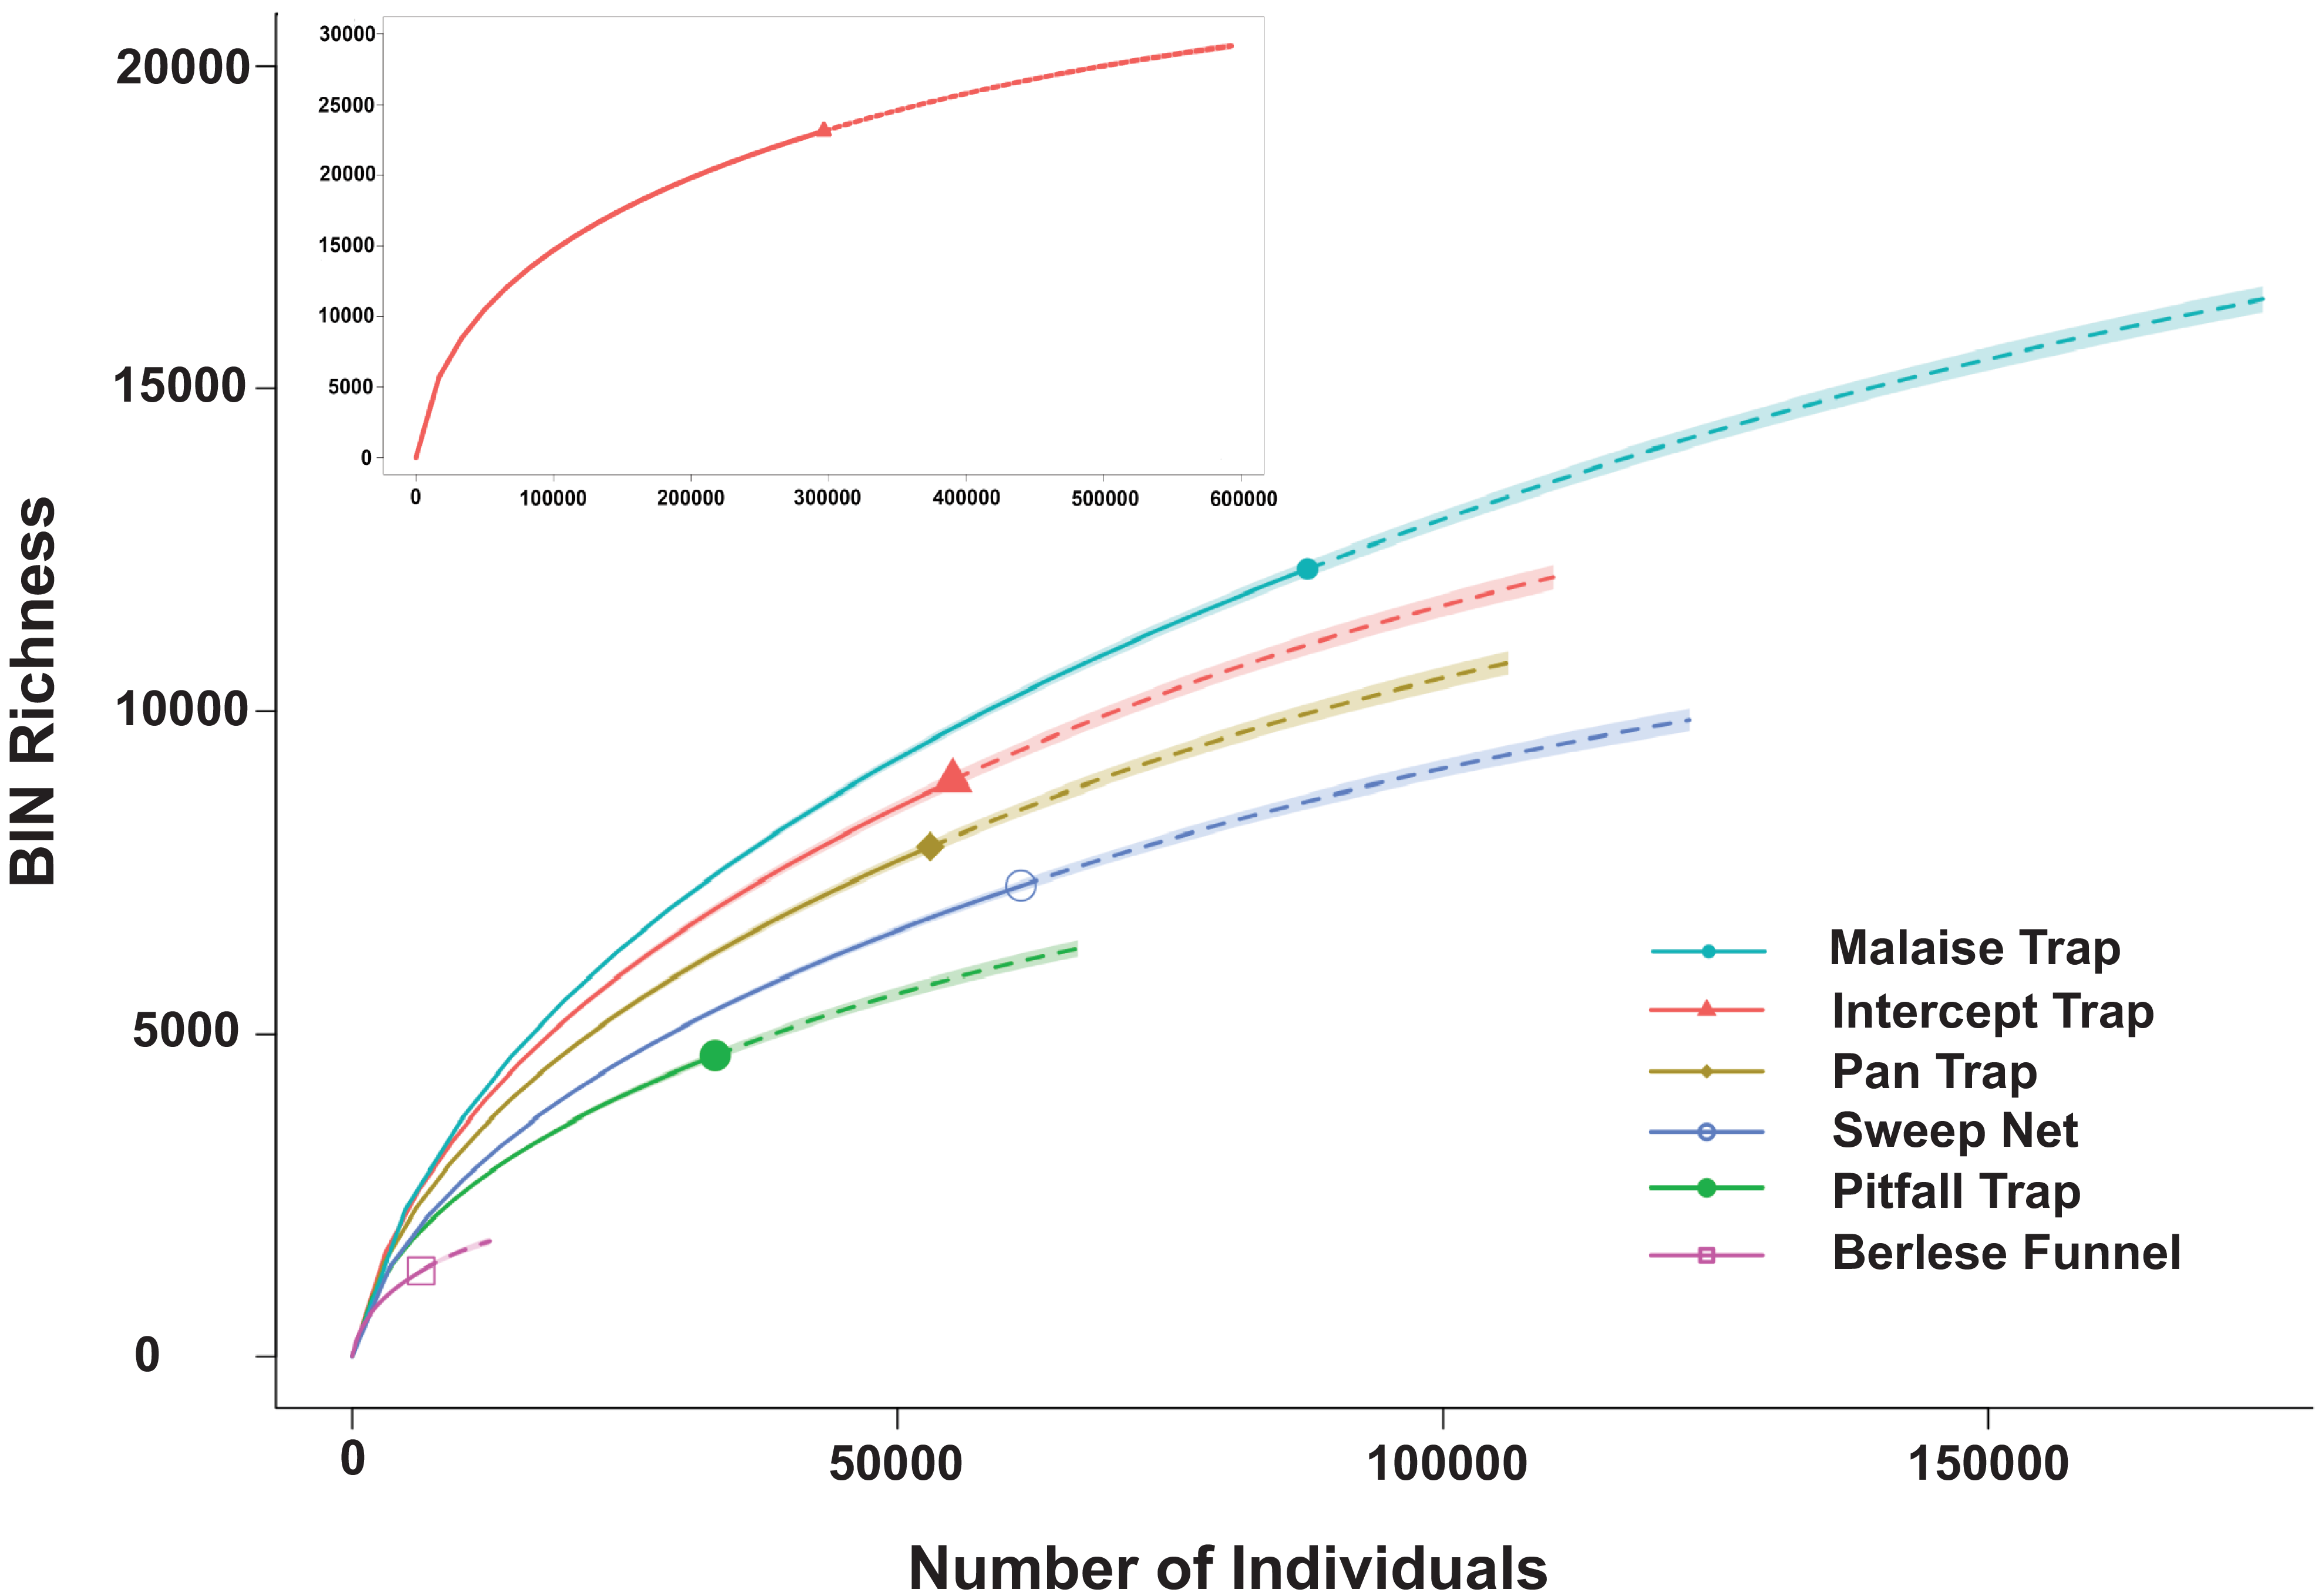
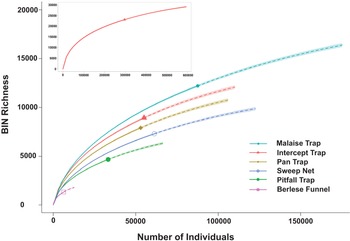
In total, 352 394 specimens gathered by the six collecting methods were analysed. The success in sequence recovery was 84.1% (296 262 specimens generated a sequence). Among them, 282 471 specimens had sequences long enough to receive a BIN assignment, and their analysis revealed 23 117 BINs with a Chao species estimate of 34 034 + 222 BINs (Figure 2). Thirty-two per cent of those BINs (7401) were associated with formally described species. Species accumulation curves varied among the collection methods. Those from Malaise traps had the steepest slope, followed in descending order by flight intercept traps, pan traps, sweep nets, pitfall traps, and Berlese funnels (Supplementary material, Table S1; Figure 2).
Barcode index number (BIN) accumulation curves by trap type for samples collected at 13 Canadian national parks from 2013 to 2014. The insert depicts the overall accumulation curve.
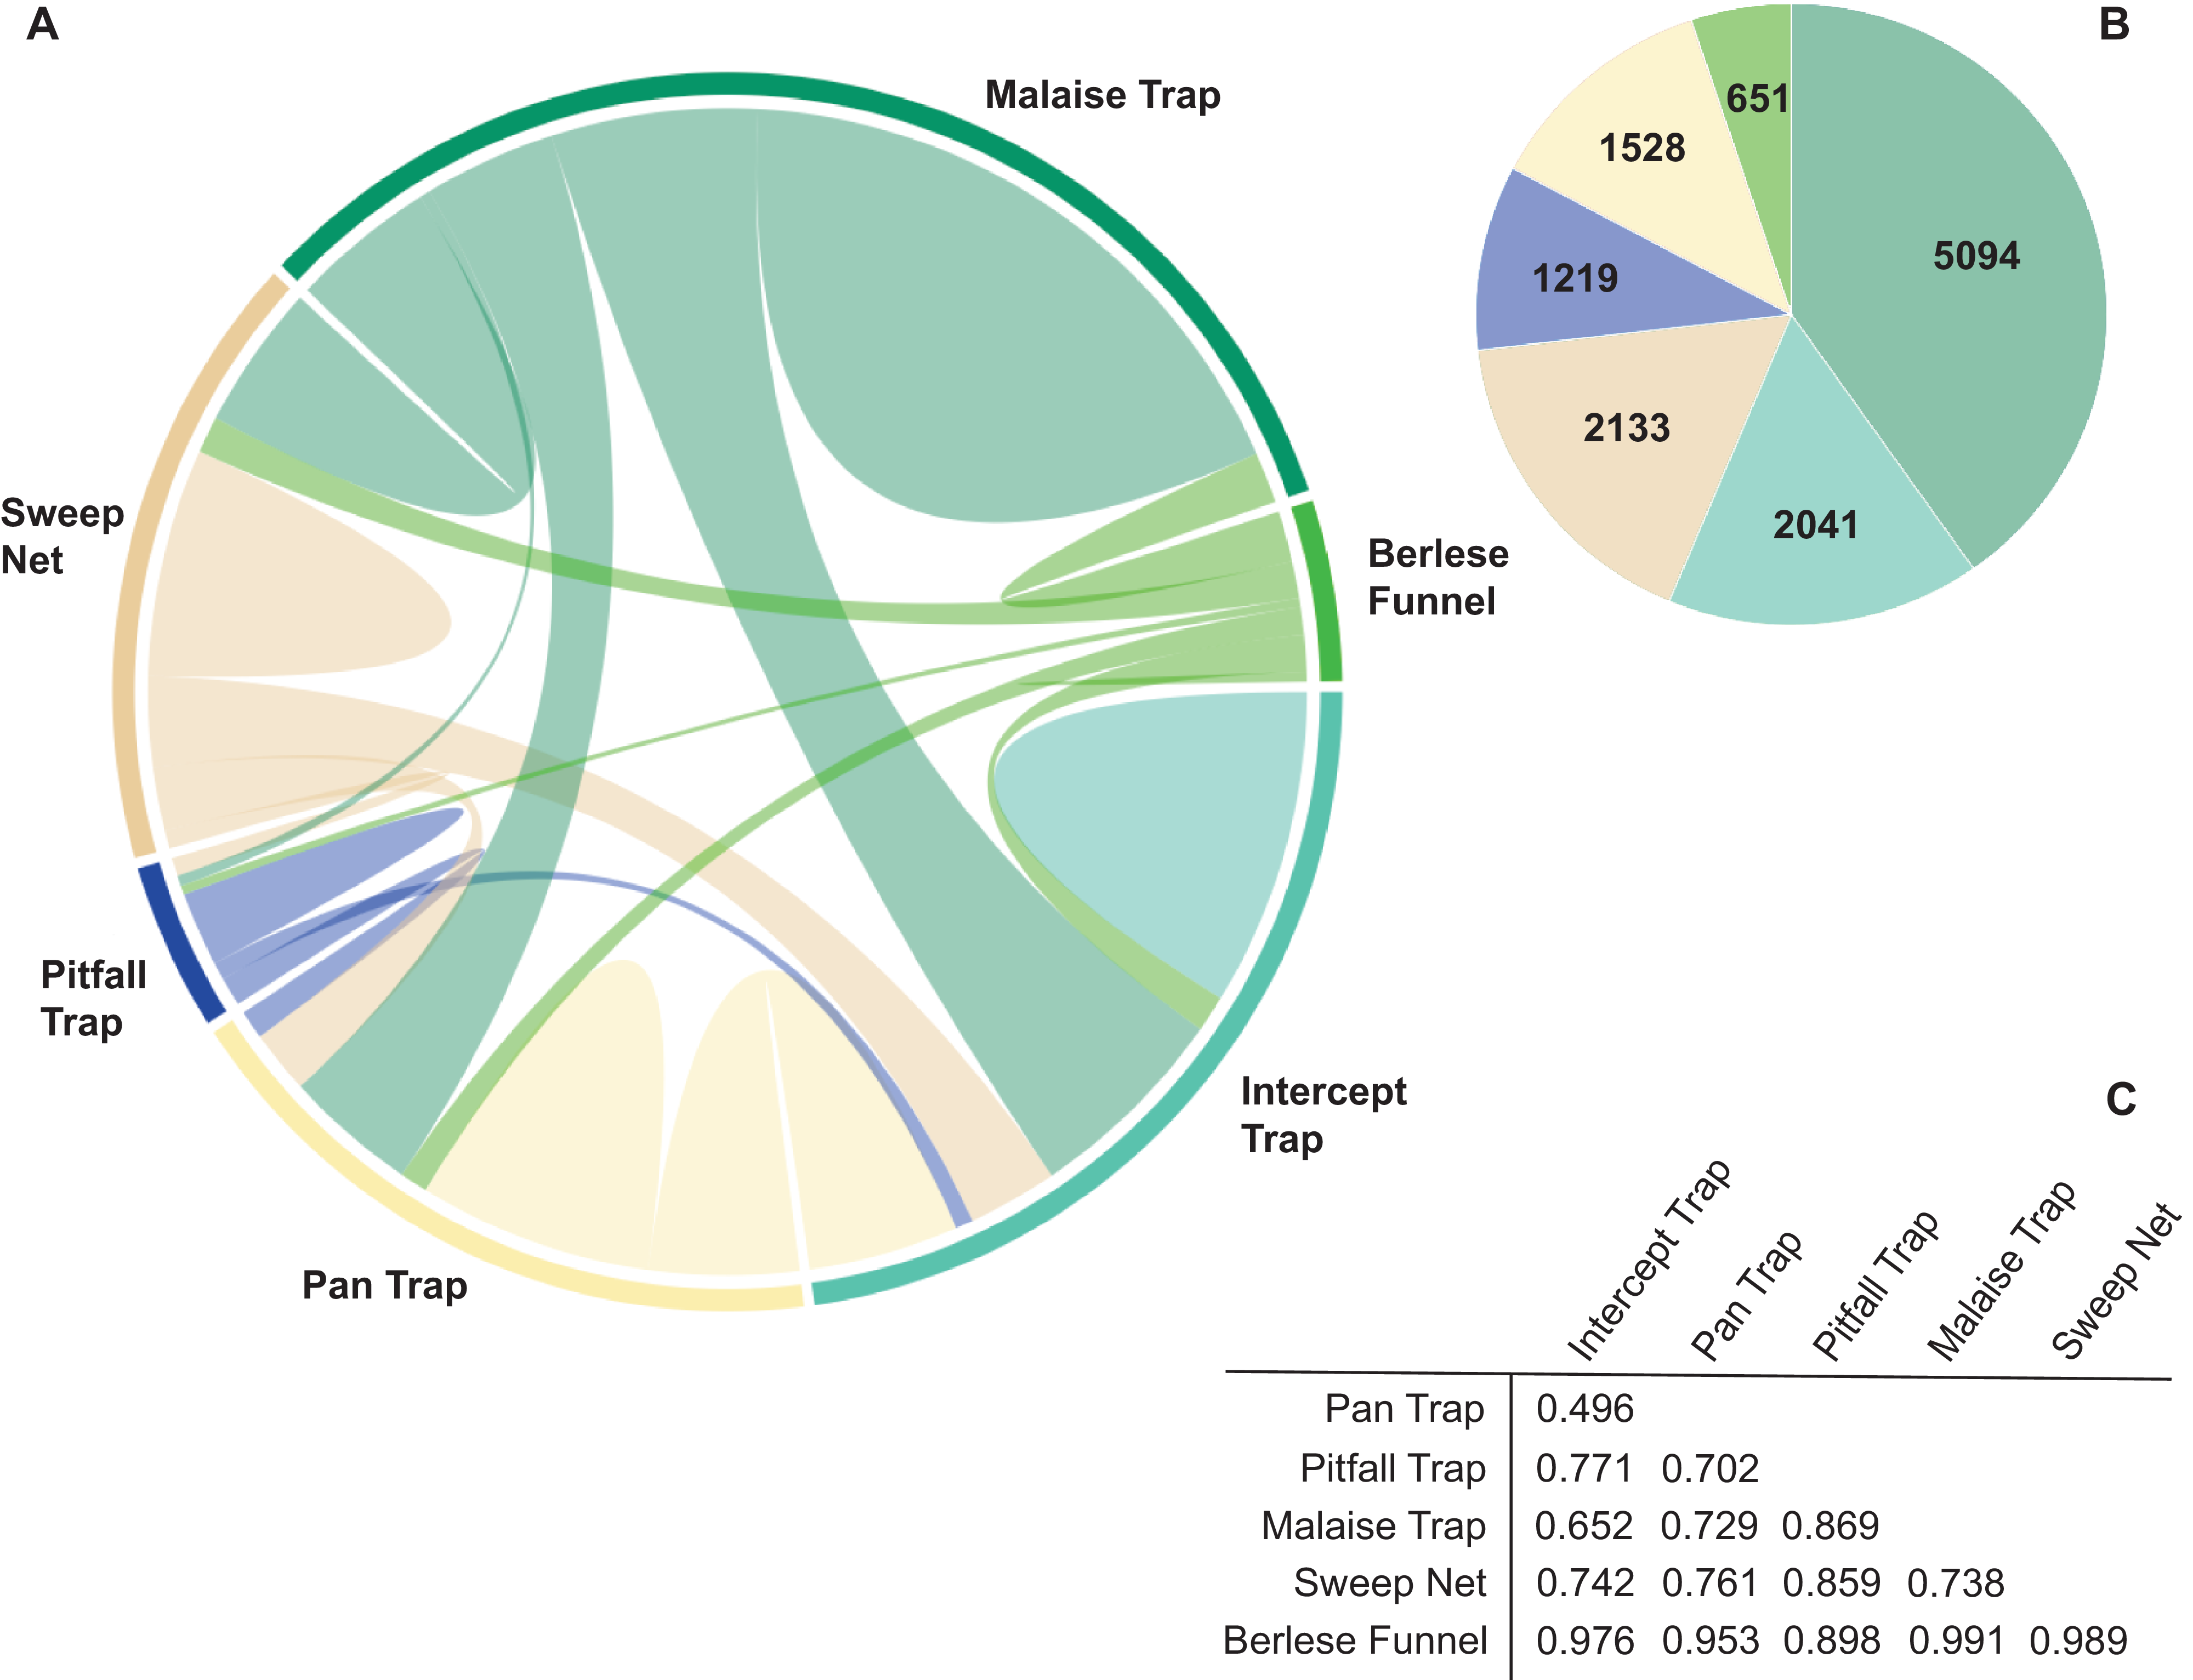
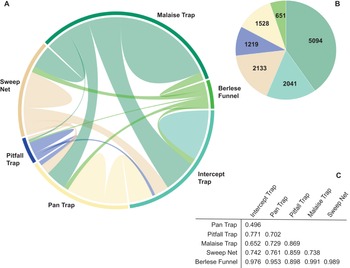
Among all BINs, 55% (n = 12 666) were collected with only one of the six collecting methods, and just 0.3% (n = 66) were caught by all six methods. Pairwise overlap varied among collecting methods (Figure 3A). Among the BINs collected with only one method, Malaise traps captured the highest number (40.2%), followed by sweep netting (16.8%) and flight intercept traps (16.1%), and the remaining 26.9% were captured with the other three methods (Figure 3B). The community composition of samples was dissimilar (pairwise Bray–Curtis values > 0.49), with the highest similarity between flight intercept and pan traps. Berlese funnel trap samples showed the greatest difference from other methods (Figure 3C).
A, Chord diagram showing barcode index number (BIN) overlap between different trap types; B, pie chart of the BINs collected with only one trapping method (colours correspond to trap type in A); and C, table of Bray–Curtis dissimilarity values for pairwise trap comparisons.
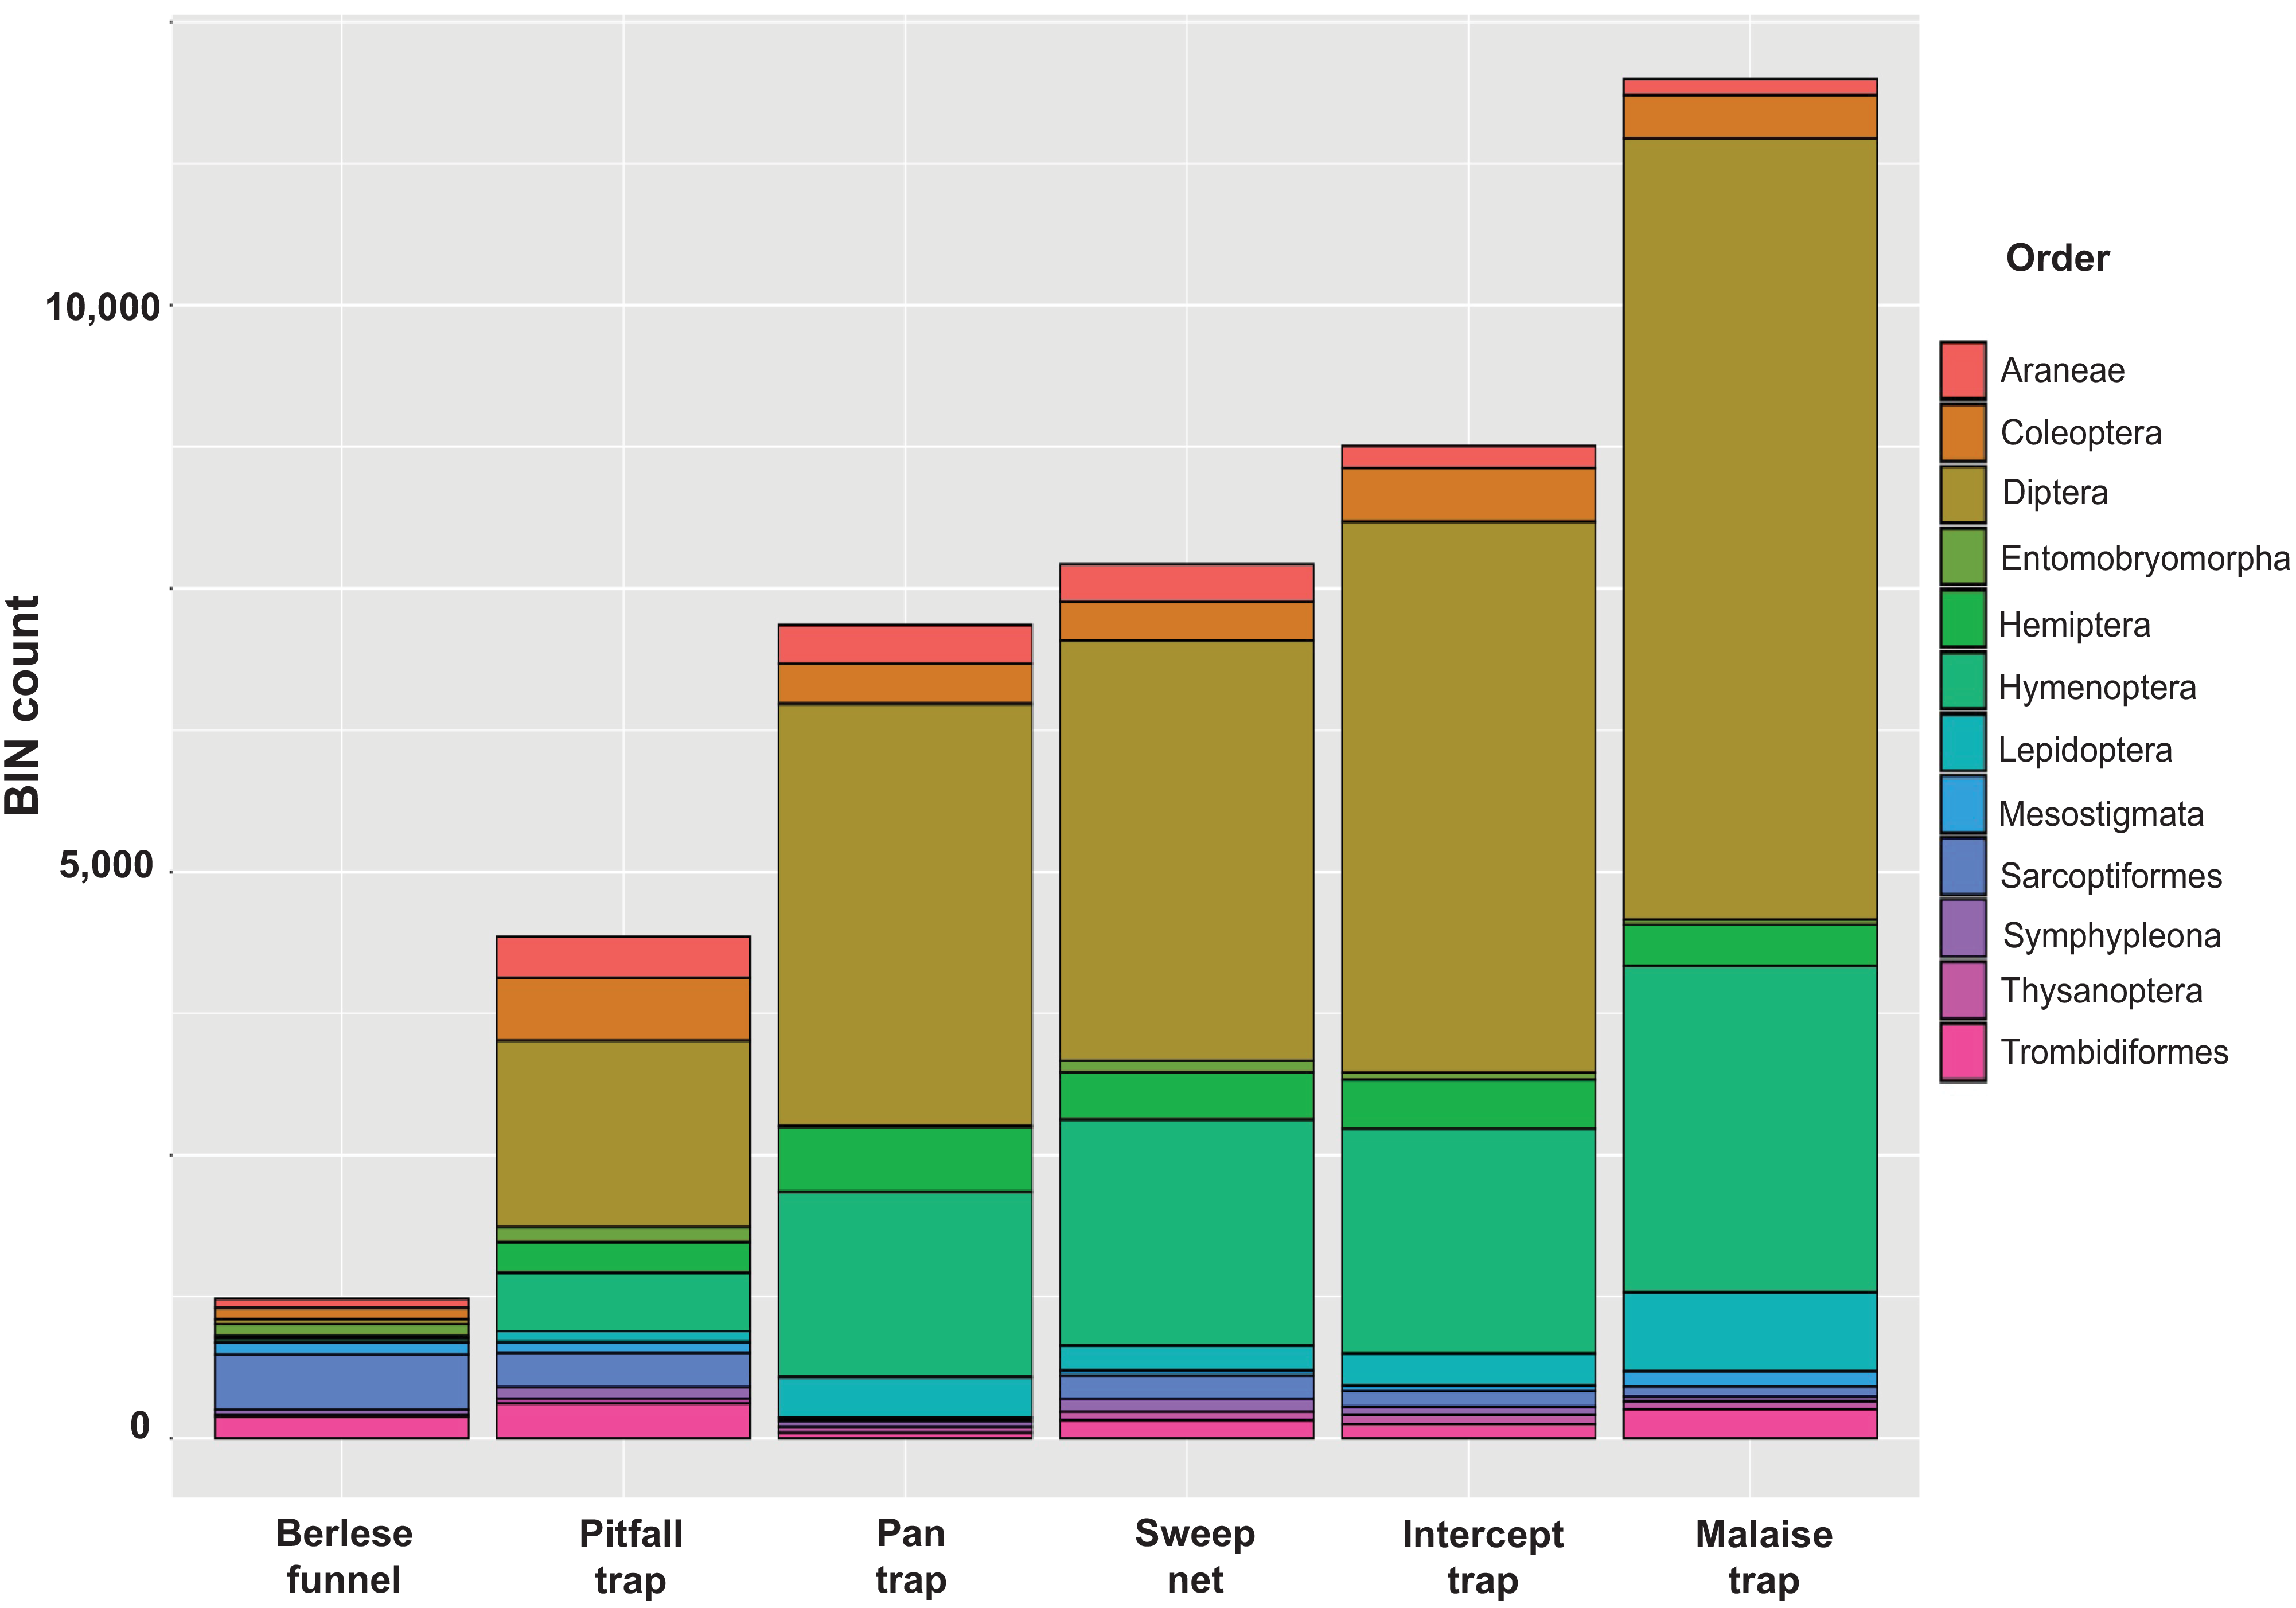
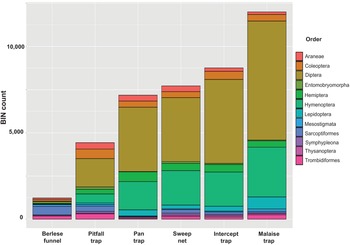
Taxonomic composition at an ordinal level was similar among the samples: more than half the BINs were Diptera, followed by Hymenoptera, Lepidoptera, Coleoptera, and Hemiptera (Figure 4). The Berlese funnels were the exception (Figure 4): two mite orders (Sarcoptiformes, Trombidiformes) dominated the taxonomic composition of the funnel trap-collected samples.
Barcode index number (BIN) count of the top 12 orders collected in each trap type.
Discussion
The DNA barcode analysis of specimens collected using six different collecting methods deployed at 13 sites across Canada revealed the high complementarity of these methods. About 55% of species were collected by only one method, and no method collected all BINs at the study sites (Figure 2). Overall, the number of detected species (n = 23 117) was considerably less than the Chao estimator (n = 34 034), likely for several reasons. First, our sampling effort involved collecting during a single week at each site and restricting sampling to a 15-m radius to standardise sampling across sites. Second, our sampling methods targeted litter and understorey habitats, excluding species living in the forest canopy at sites where larger trees were present. Third, sampling duration varied because Malaise, flight intercept, pan, and pitfall traps were deployed for the entire week, whereas sweep netting and Berlese sampling occurred at brief intervals.
Among the sampling methods employed in the present study, Malaise traps were most effective at capturing arthropods, reinforcing their broad use (e.g., deWaard et al. Reference deWaard, Levesque-Beaudin, deWaard, Ivanova, McKeown and Miskie2019; Welti et al. Reference Welti, Zajicek, Frenzel, Ayasse, Bornholdt and Buse2021; Steinke et al. Reference Steinke, deWaard, Sones, Ivanova, Prosser and Perez2022; Buchner et al. Reference Buchner, Sinclair, Ayasse, Beermann, Buse and Dziock2025). However, they still contributed less than half of the BINs encountered in this study. Sweep netting and flight intercept traps contributed significant diversity, and both methods are recognised as powerful tools for rapidly sampling arthropod taxa (Zou et al. Reference Zou, Feng, Xue, Sang and Axmacher2012; Spafford and Lortie Reference Spafford and Lortie2013). Pan traps, on the other hand, are often used for pollinators (Krahner et al. Reference Krahner, Dietzsch, Jütte, Pistorius and Everaars2024). They have, for example, been extensively employed in bee monitoring programmes (Droege et al. Reference Droege, Engler, Sellers and O’Brien2016; Kammerer et al. Reference Kammerer, Tooker and Grozinger2020; Potts et al. Reference Potts, Dauber, Hochkirch, Oteman, Roy and Ahnre2021) but do capture a more diverse fauna. In fact, in areas with frequent strong winds such as the Arctic tundra, pan traps can be more effective than Malaise traps (Pentinsaari et al. Reference Pentinsaari, Blagoev, Hogg, Levesque-Beaudin, Perez and Sobel2020). However, in the present study, they contributed only approximately 11% of species from various orders not captured by other methods. Gonzalez et al. (Reference Gonzalez, Osborn, Brown, Pavlick, Enriquez and Tscheulin2020) showed that larger-diameter traps (> 7 cm) do not increase the diversity of bees collected but do increase the bycatch collected. Our considerably larger traps (15 cm diameter) likely increased the capture of more non-hymenopteran insect groups. The pan traps may have collected some ground-dwelling species in addition to those collected by our pitfall traps. This is corroborated by the fact that the communities caught with pitfall and pan traps were more similar to each other than to the communities caught via other methods (e.g., pan versus Malaise traps). For pitfall traps, we chose a standard design (Brown and Matthews Reference Brown and Matthews2016) to ensure sampling of ground-active arthropods (e.g., Coleoptera, Araneae, Formicidae). Pitfall traps are, however, known to generate data that are biased by differences in insects’ locomotory activity, body size, and temperature (Engel et al. Reference Engel, Hertzog, Tiede, Wagg, Ebeling, Briesen and Weisser2017). This can lead to less-diverse collections than those by other methods, a pattern noted in our study. The use of a Berlese–Tullgren funnel trap for leaf litter samples revealed lower species richness than all other traps did and a marked divergence in taxonomic composition compared to collections via other methods, even at the order level. An earlier study suggested that intervals at the beginning (3–24 hours) and later in trials (60–144 hours) yield the most diversity (Owens and Carlton Reference Owens and Carlton2015). Although Berlese funnels excel at capturing small, light-avoiding invertebrates from leaf litter, they are less effective for larger, ground-dwelling, and flying arthropods captured by the other methods (Sabu et al. Reference Sabu, Shiju, Vinod and Nithya2011).
The dominance of Diptera, Hymenoptera, Lepidoptera, Hemiptera, and Coleoptera across all collecting methods (except the Berlese funnel traps) reflects these orders’ high diversity (Basset et al. Reference Basset, Cizek, Cuénoud, Didham, Guilhaumon and Missa2012; Hebert et al. Reference Hebert, Ratnasingham, Zakharov, Telfer, Levesque-Beaudin and Milton2016; Borkent et al. Reference Borkent, Brown, Adler, Amorim, Barber and Bickel2018; Stireman et al. Reference Stireman III, Cerretti, O’Hara and Moulton2021; Li and Wiens Reference Li and Wiens2023). The latter is confirmed by the high Bray–Curtis dissimilarity among the collecting methods. Each method provides a unique species composition within the same orders, with flight intercept and pan traps showing high similarity, which may be due to both using yellow pans for specimen collection, potentially attracting similar insect communities, particularly Hymenoptera (Prado et al. Reference Prado, Ngo, Florez and Collazo2017; Portman et al. Reference Portman, Bruninga-Socolar and Cariveau2020; Prendergast et al. Reference Prendergast, Menz, Dixon and Bateman2020). Although pitfall traps show a similar order composition, flying groups (e.g., Diptera, Hymenoptera, and Lepidoptera) were less dominant compared to ground-dwelling taxa (Araneae, Hemiptera, Coleoptera; Work et al. Reference Work, Buddle, Korinus and Spence2002). Earlier work has suggested that a combination of Malaise and pitfall traps is most effective for sampling Coleoptera (Skvarla and Dowling Reference Skvarla and Dowling2017). Our data corroborate this, with only 9.5% BIN overlap between the methods for Coleoptera and similarly low overlap for Araneae (17%) and Hemiptera (22%). Using a Berlese–Tullgren funnel for leaf litter samples might have limited the diversity we recovered. Another set of samples using soil would likely have revealed a different fauna. However, the samples collected with this method were very distinct from those with all other methods, being dominated by mites (Trombidiformes, Sarcoptiformes), Opiliones, and other typical inhabitants of leaf litter (Collembola, Araneae). Normally, Berlese–Tullgren samplers are used to obtain soil fauna (Bano and Roy Reference Bano and Roy2016), whereas more active leaf litter fauna is generally better sampled using Winkler extractors (Agosti et al. Reference Agosti, Majer, Alonso and Schultz2000).
Conclusion
We show that the combination of six collecting methods to capture terrestrial arthropods substantially increased species richness across sites. Although Malaise traps delivered higher richness and abundance than other methods, they did not permit comprehensive inventories. Studies that aim for broad surveys should consider using all six collecting methods that were employed in the present study, as well as possible use of other sampling approaches not tested here (e.g., light traps, Winkler extractors). However, the combined use of all possible methods can be unfeasible due to logistical constraints or limited funding. In such cases, selecting the smallest combination of collection methods that is most effective (= maximal combined richness) – for example, the combination of Malaise traps and sweep netting, which, in the present study, collected 57% of the overall richness – would make the most sense.
Supplementary material
To view supplementary material for this article, please visit https://doi.org/10.4039/tce.2026.10055.
Acknowledgements
The authors thank Agata Pawlowski and Crystal Sobel, who proposed the sampling regime and aided field sampling. They also thank Jeremy deWaard, who provided organisational support, and Joseph Addesi, Graham Ansell, Jill Bergstrome, Claudia Bertrand, Belen Bukowski, Forest Dussault, Carlene Gallant, Jennifer Gleason, Nathaniel Jones, Katelyn Lutes, Beverly McClenaghan, Renee Miskie, Jonathan Williams, Danielle Wright, Monica Young, as well as Martin Zlatkin, who helped with sampling. The authors are also grateful to the collections, sequencing, and informatics staff at the Centre for Biodiversity Genomics for processing the specimens analysed in this study.
Author contributions
Dirk Steinke: conceptualisation; formal analysis, methodology, visualisation, writing – original draft, writing – review and editing. Kate J.H. Perez: formal analysis; data management; writing – review and editing. Jayme E. Sones: conceptualisation; project administration; writing – review and editing. Valerie Levesque-Beaudin: methodology, writing – review and editing. Spencer Walker: data management; writing – review and editing. Paul D.N. Hebert: funding acquisition, project administration, writing – review and editing.
Funding information
Funding for research was provided by grants to P.D.N.H. from the Canada First Research Excellence Fund to the University of Guelph’s “Food From Thought” research program (Project 000054), as well as awards from the Ontario Ministry of Economic Development, Job Creation and Trade, the Ontario Ministry of Colleges and Universities, the Canada Foundation for Innovation (MSI 42450), Genome Canada and Ontario Genomics (OGI-208), and the New Frontiers in Research Fund (NFRFT-2020-00073).
Competing interests
The authors declare that they have no conflicts of interest.


 Open access

