


1. INTRODUCTION
The unabated shrinkage of Himalayan glaciers contributes to sea level rise (Gardner and others, Reference Gardner2013) and affects the regional water cycle (e.g. Bolch and others, Reference Bolch2012). Many glacier monitoring studies have employed modelling or remote-sensing approaches (e.g. Fujita and Nuimura, Reference Fujita and Nuimura2011; Brun and others, Reference Brun, Berthier, Wagnon, Kääb and Treichler2017; King and others, Reference King, Quincey, Carrivick and Rowan2017), whereas there have been comparatively few in situ observational studies owing to the difficulties in accessing these high-altitude glaciers (e.g. Azam and others, Reference Azam2016; Tshering and Fujita, Reference Tshering and Fujita2016; Vincent and others, Reference Vincent2016; Sherpa and others, Reference Sherpa2017). Furthermore, in situ observations are generally limited to lower elevations (e.g. Fujita and Nuimura, Reference Fujita and Nuimura2011; Baral and others, Reference Baral2014; Tshering and Fujita, Reference Tshering and Fujita2016; Sherpa and others, Reference Sherpa2017), with the observed mass balances being significantly more negative than remote-sensing estimates of regional-scale glacier mass balance (Gardner and others, Reference Gardner2013; Azam and others, Reference Azam2018). Wagnon and others (Reference Wagnon2013) have been conducting a ground-based monitoring study of debris-free Mera Glacier, which straddles the Hinku and Hunku valleys (27.7° N, 86.9° E) in the central Himalaya and extends from 4940 to 6420 m a.s.l., since 2007, with an observed glacier-wide mass balance of −0.03 ± 0.43 m w.e. during the 2007–2015 period (Sherpa and others, Reference Sherpa2017). However, there are concerns that the winter balance of Mera Glacier is significantly altered by wind erosion and redistribution due to its ice-cap-like topography (Wagnon and others, Reference Wagnon2013). Such a wind effect was heavily reduced on West Changri Nup Glacier in the Khumbu region, which extends from 5430 to 5690 m a.s.l., because of the high mountain ridges surrounding the glacier (Sherpa and others, Reference Sherpa2017). Therefore, in situ mass-balance measurements are still required at high elevations to better understand the accumulation trends that shape the fate of Himalayan glaciers.
Surface-energy and mass-balance models are commonly used to investigate the long-term mass balance, runoff and sensitivity of glaciers in High Mountain Asia (e.g. Fujita, Reference Fujita2008; Yang and others, Reference Yang2013; Azam and others, Reference Azam2014b; Fujita and Sakai, Reference Fujita and Sakai2014). Fujita and Sakai (Reference Fujita and Sakai2014) developed an energy-balance-based mass-balance and runoff model to investigate runoff from the Trakarding–Trambau Glacier system, Nepal Himalaya. Those authors utilised NCEP/NCAR reanalysis data (NCEP-1; Kalnay and others, Reference Kalnay1996) and gauge-based Aphrodite daily precipitation data (Yatagai and others, Reference Yatagai2012) for their model calculation, and estimated the best-fit precipitation ratio for calibrating Aphrodite precipitation and elevation gradient (−55% and +35% km−1, respectively). Although the model was validated with hydrological observations, the high-elevation precipitation and mass balance of the debris-free portion of the Trakarding–Trambau Glacier system remain unknown.
Many modelling studies have investigated the climatic sensitivity of glacier mass balance, with air temperature and precipitation being reported as the key variables that influence glacier mass balance in High Mountain Asia (e.g. Rupper and Roe, Reference Rupper and Roe2008; Yang and others, Reference Yang2013; Azam and others, Reference Azam2014a; Sakai and Fujita, Reference Sakai and Fujita2017). For example, Fujita and Ageta (Reference Fujita and Ageta2000) suggested that the air temperature and precipitation uncertainties were more important for calculating the energy balance than were the other variable uncertainties on a Tibetan glacier. Several studies have demonstrated that glaciers in wetter environments require warmer conditions to achieve an equilibrium mass balance and vice versa (e.g. Ohmura and others, Reference Ohmura, Kasser and Funk1992; Braithwaite, Reference Braithwaite2008; Sakai and others, Reference Sakai2015). However, the contribution of a given climatic condition to the mass balance of an individual glacier has not been reported in the Himalaya to date.
We conducted in situ mass-balance observations of the Trakarding–Trambau Glacier system, Nepal Himalaya, with mass-balance data acquired from the 2016 melt season until the end of 2018, to better understand the high-elevation mass-balance and precipitation trends of Himalayan glaciers. We compare the observed mass balance with modelled outputs for the debris-free area of the glacier system to evaluate the contribution of the altitudinal precipitation gradient to glacier mass balance and re-evaluate the mass-balance model. Debris-free Trambau Glacier is selected as the target area in this study because the sparse spatial distribution of stake measurements on debris-covered Trakarding Glacier makes it difficult to validate the mass-balance model. We reconstruct the long-term mass balance of debris-free Trambau Glacier (1980–2018) using calibrated reanalysis meteorological data and test the calibrated model's application to Mera Glacier to contrast the mass-balance conditions at the two sites. Furthermore, we discuss the mass-balance condition and sensitivity under the recent climatic regime.
2. STUDY SITE
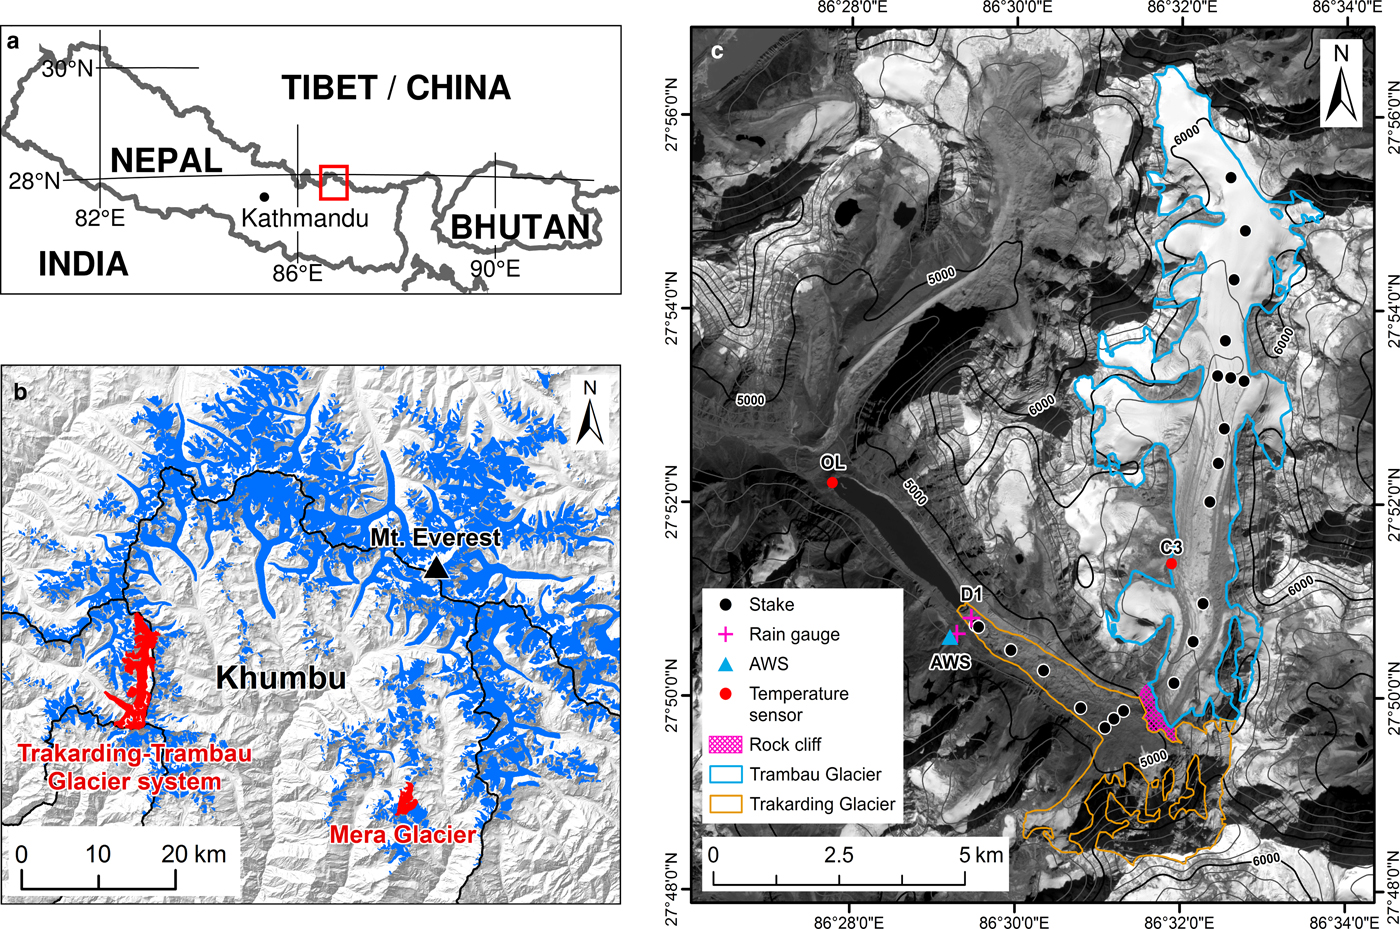
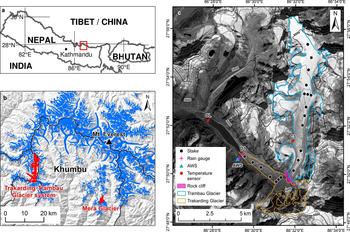
The Trakarding–Trambau Glacier system (27.9° N, 86.5° E) is located in Rolwaling Valley, eastern Nepal Himalaya, extending from 4550 to 6690 m a.s.l. and covering an area of 31.70 km2 (Nuimura and others, Reference Nuimura2015; Ojha and others, Reference Ojha2016). The lower debris-covered Trakarding Glacier is detached from upper debris-free Trambau Glacier at ~4900–5200 m a.s.l. (Podolskiy and others, Reference Podolskiy, Fujita, Sunako, Tsushima and Kayastha2018) (Fig. 1). Trakarding Glacier, however, is still fed by avalanches from the surrounding headwalls. Trakarding Glacier terminates at Tsho Rolpa Glacial Lake, the largest proglacial lake in Nepal (Fujita and others, Reference Fujita2013). The lake has expanded since 1957 (Sakai and others, Reference Sakai, Chikita and Yamada2000), but its expansion rate gradually decreased between 1990 and 2009 (King and others, Reference King, Dehecq, Quincey and Carrivick2018). The upper debris-free Trambau Glacier covers 23.34 km2 and has a predominantly southern aspect, with its surface consisting primarily of bare ice and snow, as well as patchy debris cover around the lower bound of the glacier and medial moraines. The valley climate is dominated by the Indian Summer Monsoon, with most of its annual precipitation occurring between June and September (Salerno and others, Reference Salerno2015).
(a) The Rolwaling and Khumbu regions in Nepal (red box), (b) locations of the Trakarding–Trambau Glacier system and Mera Glacier, and (c) map of debris-covered Trakarding (orange polygon) and debris-free Trambau (blue polygon) glaciers, where a stake network (black dots), AWS (blue triangle) and rain gauges (pink crosses) were installed for the mass-balance study. Additional temperature sensors (red dots) were also installed at the outlet of Tsho Rolpa Glacial Lake (OL), the lowest stake on debris-covered Trakarding Glacier (D1), and beside the Trambau Glacier (near our camp site, C3), respectively. Rock cliff separates the two glaciers (pink shading). The background image of (c) is Sentinel-2 satellite image acquired on 30 October 2016.
3. METHOD
3.1 Field campaigns
We conducted four in situ measurement campaigns along both Trakarding and Trambau glaciers since May 2016. An automatic weather station (AWS) was installed at 4806 m a.s.l. on a lateral moraine beside Trakarding Glacier (Fig. 1), and has been recording meteorological variables, such as air and surface temperatures, related humidity, downward and upward short-wave radiation, net radiation and wind speed and direction (Table 1), since May 2016. A rain gauge was installed on the debris-covered area, near the lowest stake position (D1 in Fig. 1), and then moved to the AWS site in October 2016. We also installed air temperature sensors near the outlet of Tsho Rolpa (OL in Fig. 1; 4518 m a.s.l.) in May 2016 and beside debris-free Trambau Glacier (C3 in Fig. 1; 5390 m a.s.l.) in October 2016 to measure the temperature lapse rates (Fig. 1). Details of the instruments used for the meteorological observations are listed in Table 1.
Meteorological instruments of the Trakarding–Trambau Glacier system observation network. The site locations are shown in Figure 1

We installed 15 stakes along Trambau and Trakarding glaciers in May 2016 for the mass-balance measurements, with six additional stakes installed on the debris-free area in October 2016 to fill spatial gaps. We measured the stake heights, reinstalled the stakes (where necessary) and measured the snow thickness in the debris-free area from October 2016 to October 2018 (Fig. 1). We dug through the 0.12–0.64-m-thick debris layer across the debris-covered area to install the stakes, and then refilled the holes with debris. The stake positions were measured using a dual-frequency carrier-phase differential GPS to obtain the flow velocity (not shown in this study). Snow density measurements were obtained at each stake across the debris-free area in October 2016, with densities in the 310–600 kg m−3 range at 5280–5850 m a.s.l. Here we used an average density of 460 kg m−3 for converting the stake measurements to m w.e., and the point mass balance was then calculated for the 2016 melt season (May–October 2016; hereafter 2016), and the 2016/17 and 2017/18 year-long observation periods (November–October; hereafter 2016/17 and 2017/18, respectively) using an assumed ice density of 880 kg m−3 (Tshering and Fujita, Reference Tshering and Fujita2016). The glacier-wide mass balance (B, m w.e. a−1) was calculated as follows:
 $$B\; {\rm}={\rm \;} \displaystyle{{\mathop \sum \nolimits_z A_zb_z} \over {\mathop \sum \nolimits_z A_z}},$$
where A z and b z are the glacier area and mass balance at a 50-m elevation band, respectively. The hypsometry A z was obtained from the glacier outline in the GAMDAM glacier inventory (Nuimura and others, Reference Nuimura2015) and ASTER-GDEM2 (Tachikawa and others, Reference Tachikawa, Hato, Kaku and Iwasaki2011), and assumed to be constant for the analysis period in this study. The mass-balance profile b z was calculated via different methods below and above the highest stake at 5850 m a.s.l. Linear regression lines were applied for interpolation below the highest stake by fitting the stake-derived point mass balances. Since the observed point mass balance did not cover the entire glacier, particularly in the high-elevation accumulation area, we estimated the mass-balance profile above the highest stake using the model calculation presented in Section 3.2. We also evaluated the uncertainty in the glacier-wide mass balance as a quadratic sum of root mean square error (RMSE) from the stake-derived point mass balances and modelled profiles by varying the precipitation gradient (see Section 3.2).
3.2 Mass-balance model
The mass-balance model used in this study calculates the surface energy and mass balance as a function of snow accumulation, melt, refreezing of liquid water and evaporation at daily time step with a hydrological year cycle from 1 October to 30 September of the next year. Here we describe a brief summary of the model since the full details have been described previously (Fujita and Ageta, Reference Fujita and Ageta2000; Fujita and Sakai, Reference Fujita and Sakai2014). The energy balance is defined as follows:
 $${\rm max}[ {Q_{\rm M};0}] {\rm \;}={\rm \;(1\;} -{\rm \;} \alpha {\rm )\;} H_{{\rm SR}}{\rm}+{\rm } H_{{\rm LR}}-\varepsilon \sigma {\rm (}T_{\rm S}{\rm}+{\rm 273}{\rm. 15)}^{\rm 4}{\rm \;}+{\rm \;} H_{\rm S}{\rm}+{\rm } H_{\rm L}-H_{\rm G},$$
where the heat for melting in the glacier surface (Q M, W m−2) is a function of the albedo (α, dimensionless), downward short-wave (H SR, W m−2) and long-wave radiation (H LR, W m−2), emissivity (ε, dimensionless), Stefan–Boltzmann constant (σ, 5.67 × 10⁻⁸ W m−2 K−4), surface temperature (T S, °C), sensible heat flux (H S, W m−2), latent heat flux (H L, W m−2) and conductive heat flux into the glacier ice (H G, W m−2). Each component is positive when the flux or radiation is directed downwards. H LR is obtained from air temperature, relative humidity and ratio of H SR to that at the top of the atmosphere as a parameter of cloud amount, which is calculated using an empirical scheme, and the turbulent heat fluxes (H S and H L) are obtained via the bulk method (Fujita and Ageta, Reference Fujita and Ageta2000). H G is derived from the temperature profile of the snow and glacier ice, which are calculated in the model, with the surface temperature used in the iterative calculation to satisfy the heat balance equation. The mass balance (b z, m w.e.) is then calculated as follows:
 $$b_z{\rm \;}={\rm \;} \left( {P_{\rm s}{\rm \;} -{\rm \;} \displaystyle{{Q_{{\rm M\;}}} \over {l_{\rm m}}}{\rm \;}+{\rm } E_{\rm v}{\rm}+{\rm } R_{\rm F}} \right)/\rho _{\rm w},$$
where P s is the solid precipitation rate (mm w.e. d−1), l m is the latent heat of fusion of ice (3.33 × 10⁵ J kg−1), E v is the evaporation rate (mm w.e. d−1) in which sublimation and condensation are taken into account, R F is the refreeze rate (mm w.e. d−1) and ρ w is the density of water (1000 kg m−2), which is used to convert the mass-balance calculation to m w.e. P s, E v and R F are calculated in the model using the meteorological data and the respective equations presented by Fujita and Ageta (Reference Fujita and Ageta2000) and Fujita and others (Reference Fujita, Ohta and Ageta2007). The AWS data are used to calculate the mass balance for the observation period and calibrate the ERA-Interim reanalysis data for the longer time period (1980–2018) (Dee and others, Reference Dee2011). The energy and mass balance over the debris-free surface is calculated at a 50-m elevation interval. Although a small area of patchy debris cover is present on Trambau Glacier, we assume that the glacier surface is entirely debris free in the model calculation. The required input data are daily air temperature, precipitation, wind speed, downward short-wave radiation and relative humidity observations.
We first ran the same model configuration employed by Fujita and Sakai (Reference Fujita and Sakai2014). We then systematically varied the air temperature lapse rate and precipitation gradient (P GV, % km−1), and compared the model results with the observed mass-balance profiles to obtain the best-fit lapse rate and P GV values. The time series of the input lapse rate was calculated from the pressure level air temperatures at the 500 and 600 hPa geopotential heights in the ERA-Interim reanalysis (L R,ERA, °C km−1). Previous studies have identified the temperature lapse rate as one of the key parameters for calculating glacier mass balance and have noted that the lapse rate exhibits strong local and seasonal variations in mountainous regions (e.g. Kattel and others, Reference Kattel2013; Petersen and others, Reference Petersen, Pellicciotti, Juszak, Carenzo and Brock2013; Heynen and others, Reference Heynen2016). These studies have also indicated that a constant lapse rate should not be used or lapse rate should be corrected for specific season in mass-balance modelling because smaller lapse rate values are often observed during the ablation season (Petersen and others, Reference Petersen, Pellicciotti, Juszak, Carenzo and Brock2013; Heynen and others, Reference Heynen2016). Previous studies have also identified P GV as an important parameter, as extreme topography and precipitation patterns under a monsoon climate induce regional and altitudinal precipitation differences (e.g. Seko, Reference Seko1987; Immerzeel and others, Reference Immerzeel, Petersen, Ragettli and Pellicciotti2014). We therefore varied L R,ERA and P GV by 0.20 °C km−1 and 2% km−1 steps, respectively, to determine the best-fit parameters that obtain the minimum RMSE between the observed (stake-derived point mass balance) and modelled mass-balance profiles during the three observation periods. We also calculated an alternative mass-balance profile using P GV = ±20% km−1 from the determined value for the upper accumulation part where no stake data were available to estimate B and its uncertainty. Furthermore, we conducted sensitivity tests of the modelled mass balance by varying the following meteorological inputs: ±0.1 °C km−1 for lapse rate (L R), ±10% km−1 for P GV, and warmer (dT a, +0.1 °C) and wetter (dP p, +10%) conditions.
3.3 Long-term mass balance
We reconstructed the long-term B for the 1980–2018 period (39 years) to better understand the current state of Trambau Glacier. We used the same configuration that we employed for the observed mass balance. The ERA-Interim input variables were calibrated via a simple linear regression of the observed meteorological variables for the 2016–2018 observation period (2.5 years) (Fig. S1). Previous study reported that the ERA-Interim precipitation has large biases and thus limitation to reproduce the observed mass balances (Immerzeel and others, Reference Immerzeel, Wanders, Lutz, Shea and Bierkens2015). It should also be noted that the limited observation period would yield large errors. However, Sakai and others (Reference Sakai2015) compared the observed and ERA-Interim summer mean air temperatures at multiple sites across high mountain Asia and reported an RMSE of 0.9 °C between the ERA-Interim and observational data, which supports our calibration approach in this study. There are strong correlations between the air temperature and relative humidity datasets, and poor correlations between the downward short-wave radiation and wind speed datasets. The pentad (5-day average) precipitation dataset shows a weak but significant correlation between the observed and ERA-Interim precipitations. We used the calibrated ERA-Interim dataset for reconstructing the long-term B, with the exception of the precipitation record, which was calibrated by varying the precipitation ratio for the ERA-Interim precipitation to minimise the RMSE between the observed and modelled B. We further analysed uncertainties due to the assumption of a constant glacier geometry for the 1980–2018 period. We assumed two alternative hypsometries; one extended below the rock cliff area (Fig. 1; 0.32 km2) and another considering higher surface elevation in the four decades ago. We then calculated alternative long-term glacier-wide mass balances for the extended terminus (B ext) and higher surface (B hgh), and estimated the uncertainty by a quadratic sum of the differences against B.
3.4 Climatic regime
We estimated the climatic regime, which exhibits not only the recent state of the glacier but also the preferred condition for maintaining equilibrium, by varying air temperature and precipitation (Fujita and others, Reference Fujita2011). Air temperature (T dy,yr, °C) and precipitation (P dy,yr, mm w.e.) at the AWS elevation were estimated as follows:
 $$T_{{\rm dy},{\rm yr}}{\rm \;} = T_{{\rm ERA},{\rm dy},{\rm yr}}{\rm \;} -{\rm \;} \overline {T_{{\rm JJAS},{\rm yr}}} {\rm \;} + {\rm \;} \overline {T_{{\rm JJAS}}} $$
and
 $$P_{{\rm dy},{\rm yr}}{\rm \;} = {\rm \;} \displaystyle{{P_{{\rm ERA},{\rm dy},{\rm yr}\;}} \over {\sum\nolimits_{{\rm dy} = 1}^{{\rm dy} = 365} {P_{{\rm ERA},{\rm dy},{\rm yr}\;}}}} \; \overline {P_{{\rm AN}}}, $$
where T ERA,dy,yr and P ERA,dy,yr are the ERA-derived daily air temperature and precipitation for a given year (yr), respectively,  $\overline {T_{{\rm JJAS},{\rm yr}}} $ is the summer mean (June, July, August and September: JJAS) air temperature of the corresponding year and $\overline {T_{{\rm JJAS}}} $ and $\overline {P_{{\rm AN}}} $ are the controlled summer mean air temperature and annual precipitation, respectively. These two equations preserve the seasonal air temperature and precipitation cycles for a given year based on the controlled summer mean air temperature and annual precipitation values, which are varied at 1 °C and 100 mm steps, respectively, and the B for debris-free Trambau Glacier is then simulated. The resultant climatic regimes under the different temperature and precipitation conditions for the 39-year patterns are then averaged.
4. RESULTS
4.1 Meteorological variables
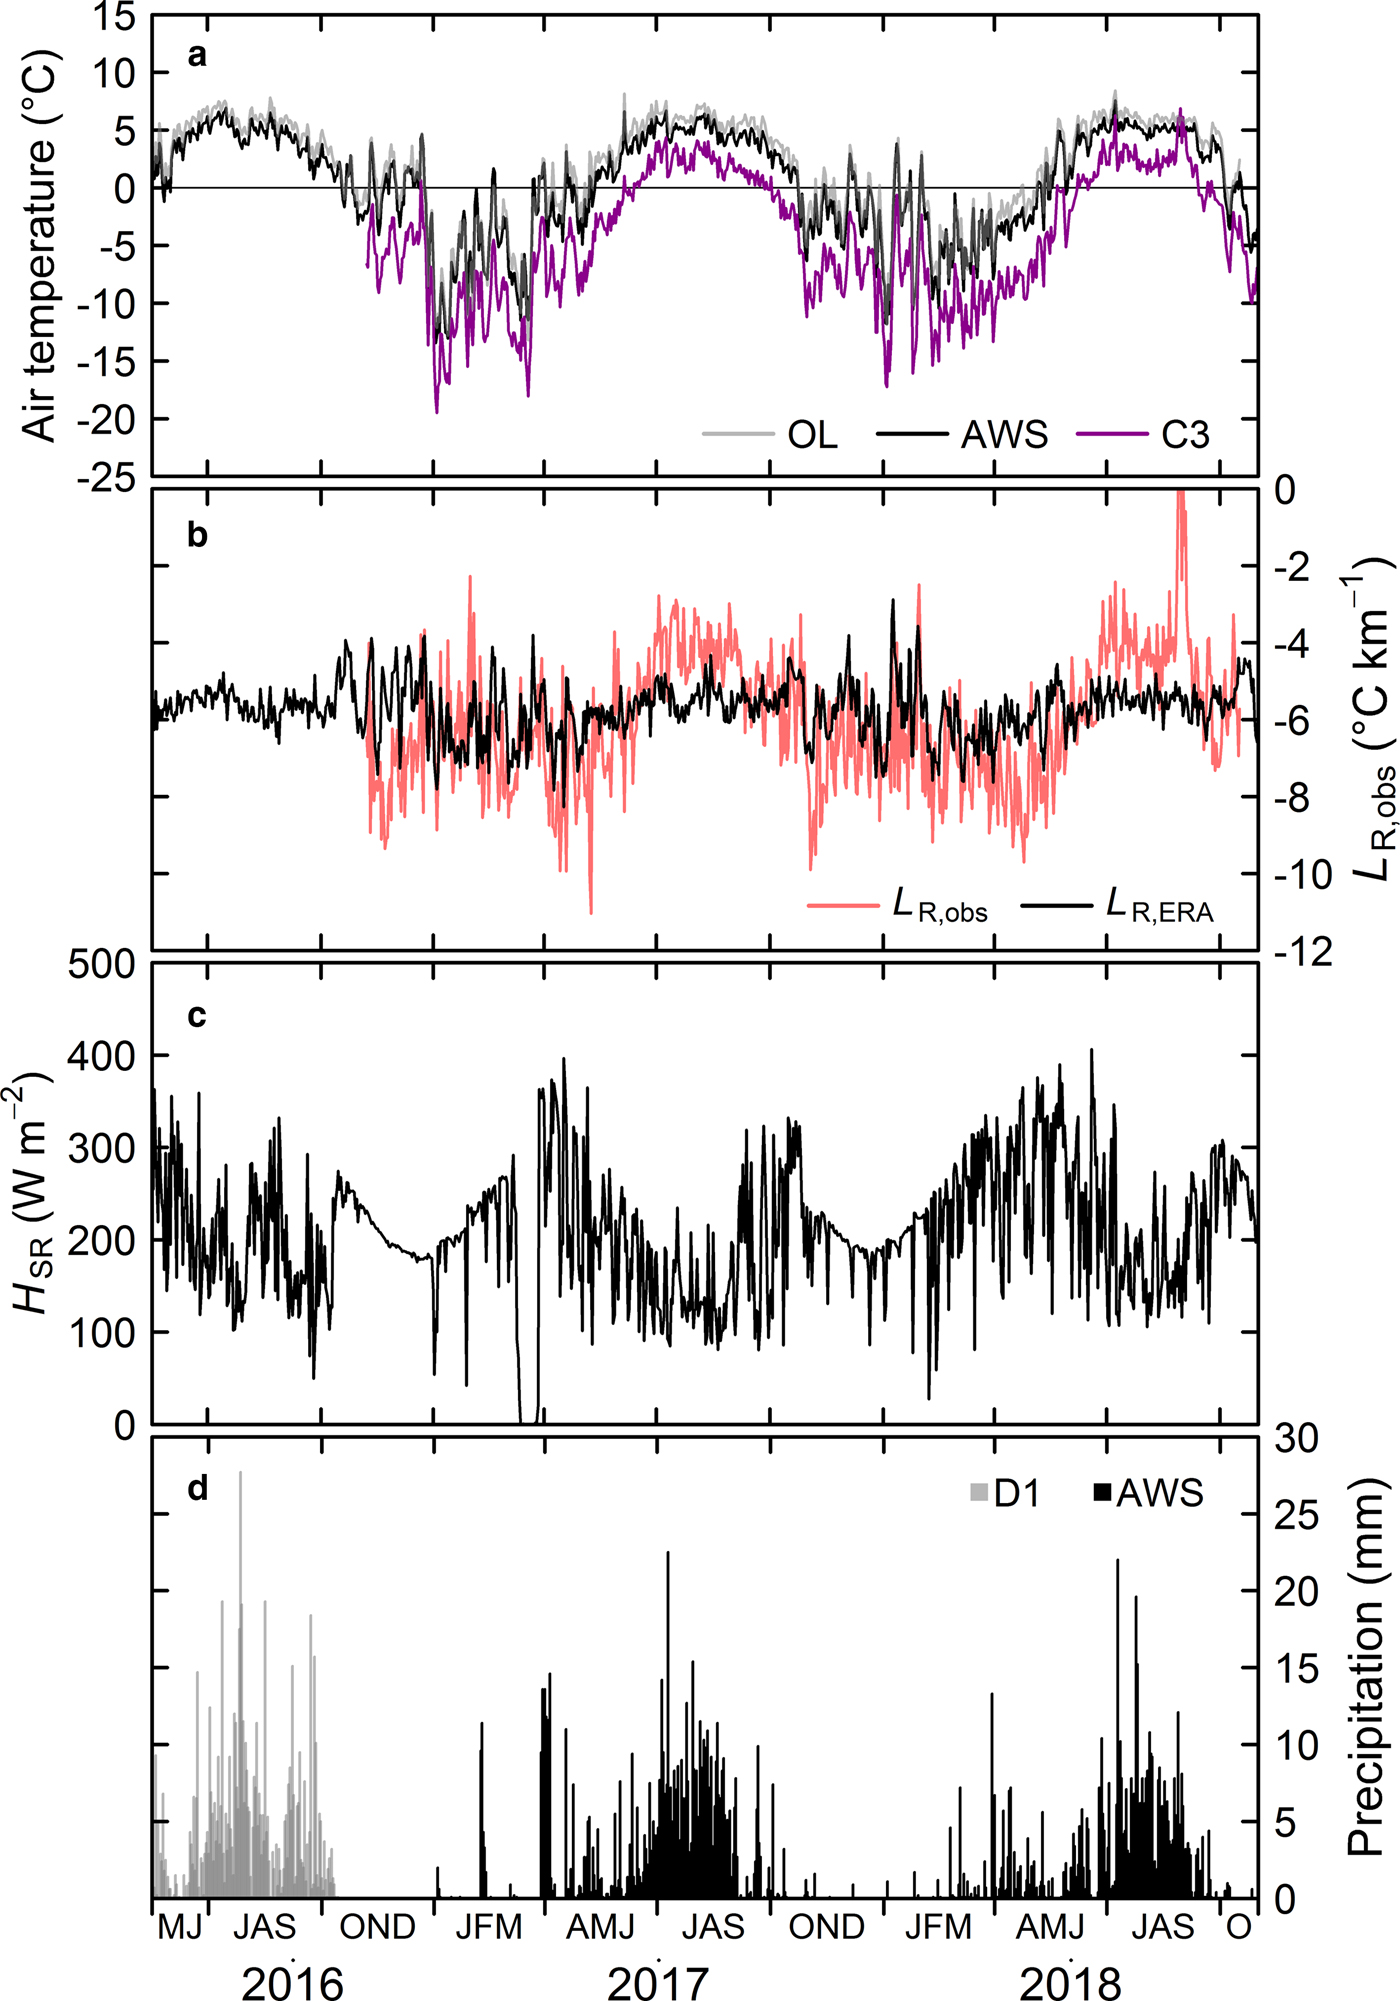
Continuous meteorological data were acquired at 1 hour intervals from May 2016 to October 2018 (the C3 air temperature data were acquired from October 2016). Figure 2 shows the daily averaged air temperature (T a), temperature lapse rate, H SR and precipitation (P p) at AWS, OL, D1 and C3. We defined the four seasons, which represent the pre-monsoon (April–May), monsoon (June–September), post-monsoon (October–November) and winter (December–March) seasons, mainly based on Heynen and others (Reference Heynen2016) and observed meteorological variables. The annual ranges in mean monthly air temperature at OL, AWS and C3 were between 13.8 and 15.7 °C, in agreement with Sakai and Fujita (Reference Sakai and Fujita2017). The seasonal mean air temperatures at the three sites are listed in Table 2.
Daily meteorological variables for the Trakarding–Trambau Glacier system from May 2016 to October 2018, showing (a) air temperature, (b) air temperature lapse rate (L R,obs), (c) downward short-wave radiation (H SR) and (d) precipitation. Locations of OL, AWS, C3 and D1 are shown in Figure 1.
Seasonal mean air temperature, temperature lapse rate and precipitation during the observation period

a Calculated from regression of the air temperature values and elevations at three sites (OL, AWS and C3).
We calculated the daily mean observed temperature lapse rate (L R,obs) values via linear regression of the daily air temperatures at OL, AWS and C3 and their elevations (Fig. 2b). A large L R,obs fluctuation is found during the post-monsoon and winter seasons, whereas it is relatively stable during the monsoon season. Nevertheless, there is still a ±1.5 °C km−1 variability. The seasonal mean L R,obs values are also listed in Table 2, with less negative L R,obs values during the monsoon season than in the pre-monsoon season, in agreement with previous studies (Kattel and others, Reference Kattel2013; Salerno and others, Reference Salerno2015; Heynen and others, Reference Heynen2016). We have also shown the L R,ERA (Fig. 2b) and seasonal mean values (Table 2). Although the seasonal variability is similar to that observed in the field data, the L R,ERA values during the monsoon season are ~1 °C km−1 more negative than the observations.
The seasonal amount of precipitation for the observation periods are also listed in Table 2, with the most recorded during the monsoon season. As the horizontal distance between D1 and AWS is only ~600 m (Fig. 1), with an elevation difference of ~200 m, we assume that there should only be a small precipitation difference between the two sites. The 2016–2018 monsoon precipitation (June–September) observations, which were recorded during continuous positive air temperatures, are comparable with those observed at similar elevations in the neighbouring Khumbu region (Salerno and others, Reference Salerno2015). We note that the total amount of precipitation during the observation period may have been underestimated because the tipping-bucket-type rain gauge used in this study would not have captured snowfall. Furthermore, the precipitation observations from early January to April 2017 were recorded after a significant H SR decrease and recovery (Figs 2c, d). This may have been caused by snowfall that covered the radiation sensor and rain gauge, with the resultant meltwater being recorded when the air temperature increased (Fig. 2a). We therefore excluded such events from the ERA comparison (Fig. S1).
4.2 Observed point mass balance and model validation
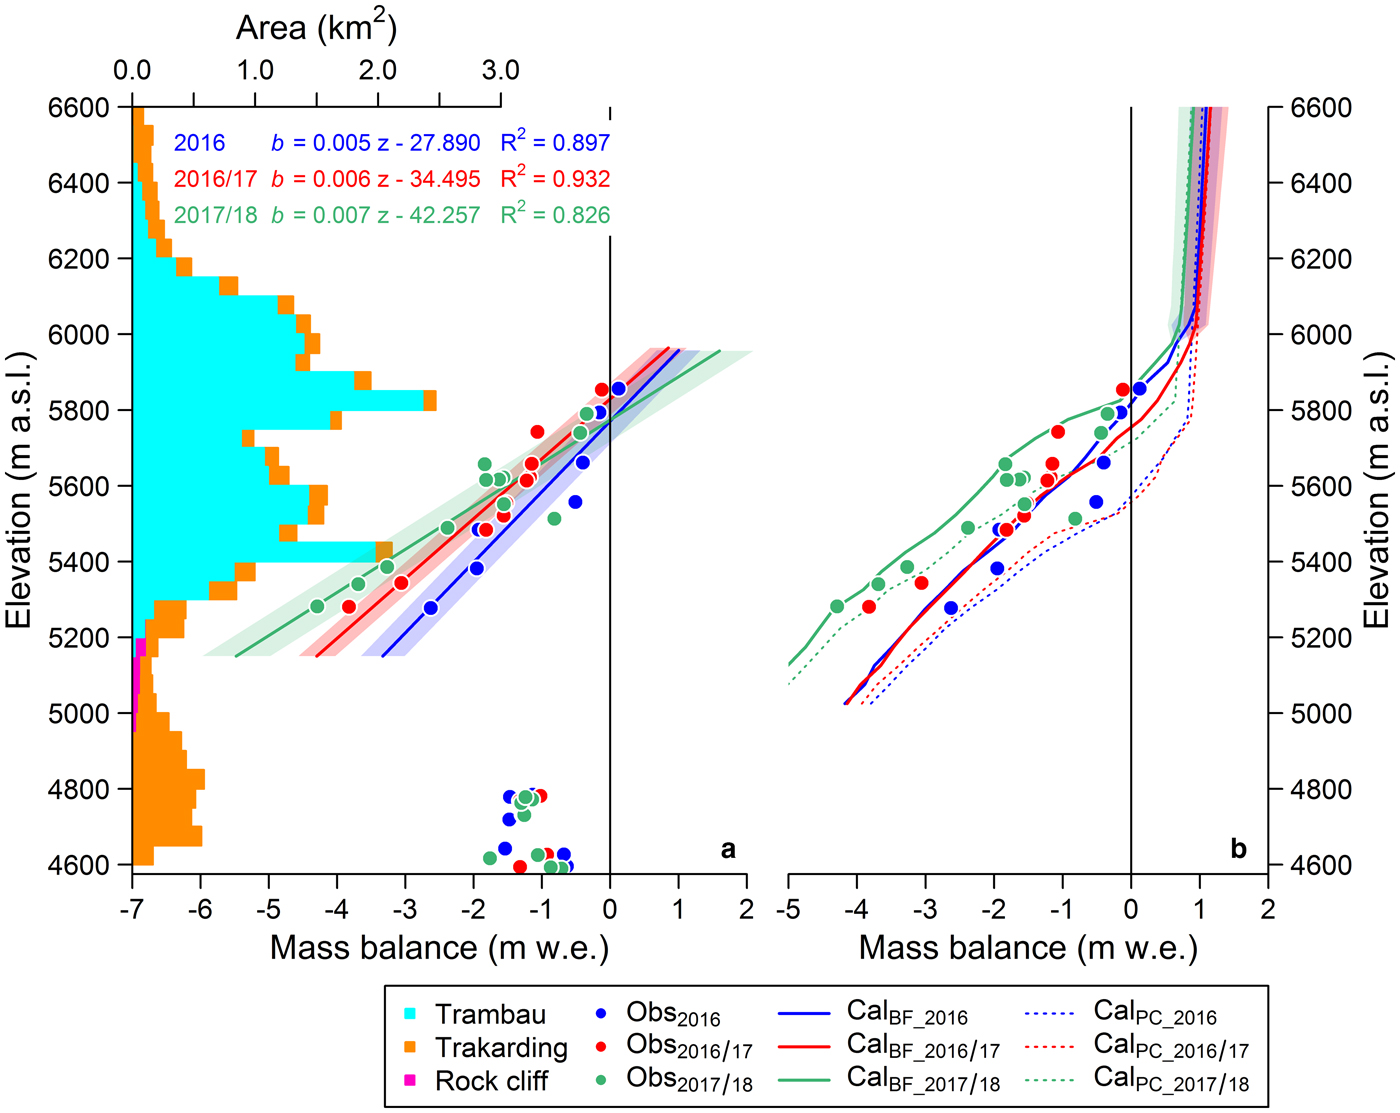
The observed stake-derived point mass balance of the Trakarding–Trambau Glacier system varied from −2.63 to +0.12 m w.e., −3.83 to −0.12 m w.e. and −4.29 to −0.34 m w.e. for the 2016, 2016/17 and 2017/18 periods, respectively (Fig. 3a). Even though the highest stake was set at 5850 m a.s.l., the 2016/17 point mass balance was negative. The most negative point mass balances were recorded at ~5280 m a.s.l., which is the lower bound of debris-free Trambau Glacier, with linear relationships being found between the point mass balances and elevation (R 2 = 0.90, 0.93 and 0.83 in 2016, 2016/17 and 2017/18, respectively). The RMSEs between the observed point mass balances and linear regression lines of all observed point mass balances were 0.32, 0.27 and 0.50 m w.e. in 2016, 2016/17 and 2017/18, respectively (Table 3). Conversely, the point mass balances on the debris-covered Trakarding Glacier were less negative, even at lower elevations, than those on the debris-free surface, with no correlation between the point mass balances and elevation (Fig. 3a), indicating that the debris mantle suppressed ice melting (e.g. Østrem, Reference Østrem1959; Mattson and others, Reference Mattson, Gardner and Young1993).
(a) Hypsometry of the Trakarding–Trambau Glacier system at a 50 m elevation interval, and stake-derived mass balance during the 2016 (blue dots), 2016/17 (red dots) and 2017/18 (green dots) periods with their respective linear regressions, and (b) calculated 2016 (blue), 2016/17 (red) and 2017/18 (green) mass-balance profiles using parameters producing the best estimate (solid lines) and those of a previous study (dashed lines; Fujita and Sakai, Reference Fujita and Sakai2014). Shadings in (a) and (b) indicate RMSEs of the linear regressions against the stake-derived mass balance, and uncertainty estimated by varying the precipitation gradient (P GV, ±20% km−1) for the accumulation area, respectively.

Summary of the glacier-wide mass balance (B), ELA, mass-balance gradients (db/dz), RMSE of the stake-derived point mass balances in 2016, 2016/17 and 2017/18, as obtained from linear regression fitting to the point mass balances, a model run with the same configuration as used by Fujita and Sakai (Reference Fujita and Sakai2014) (CalPC) and the best fit to the data observations (CalBF) and the mean difference of mass-balance profiles between the averaged mass-balance profiles based on those obtained using P GV values of +20 and +60% km−1 and each alternative profile above 6000 m a.s.l., with the uncertainty being estimated by the quadratic sum of RMSE from point mass balances and the mean mass-balance differences by varying the precipitation gradient over the 20–60% km−1 range in the accumulation area

a Calculated using a combination of observed and modelled mass-balance results below and above the highest stake, as described in Sections 3.1, 3.2 and 4.2.
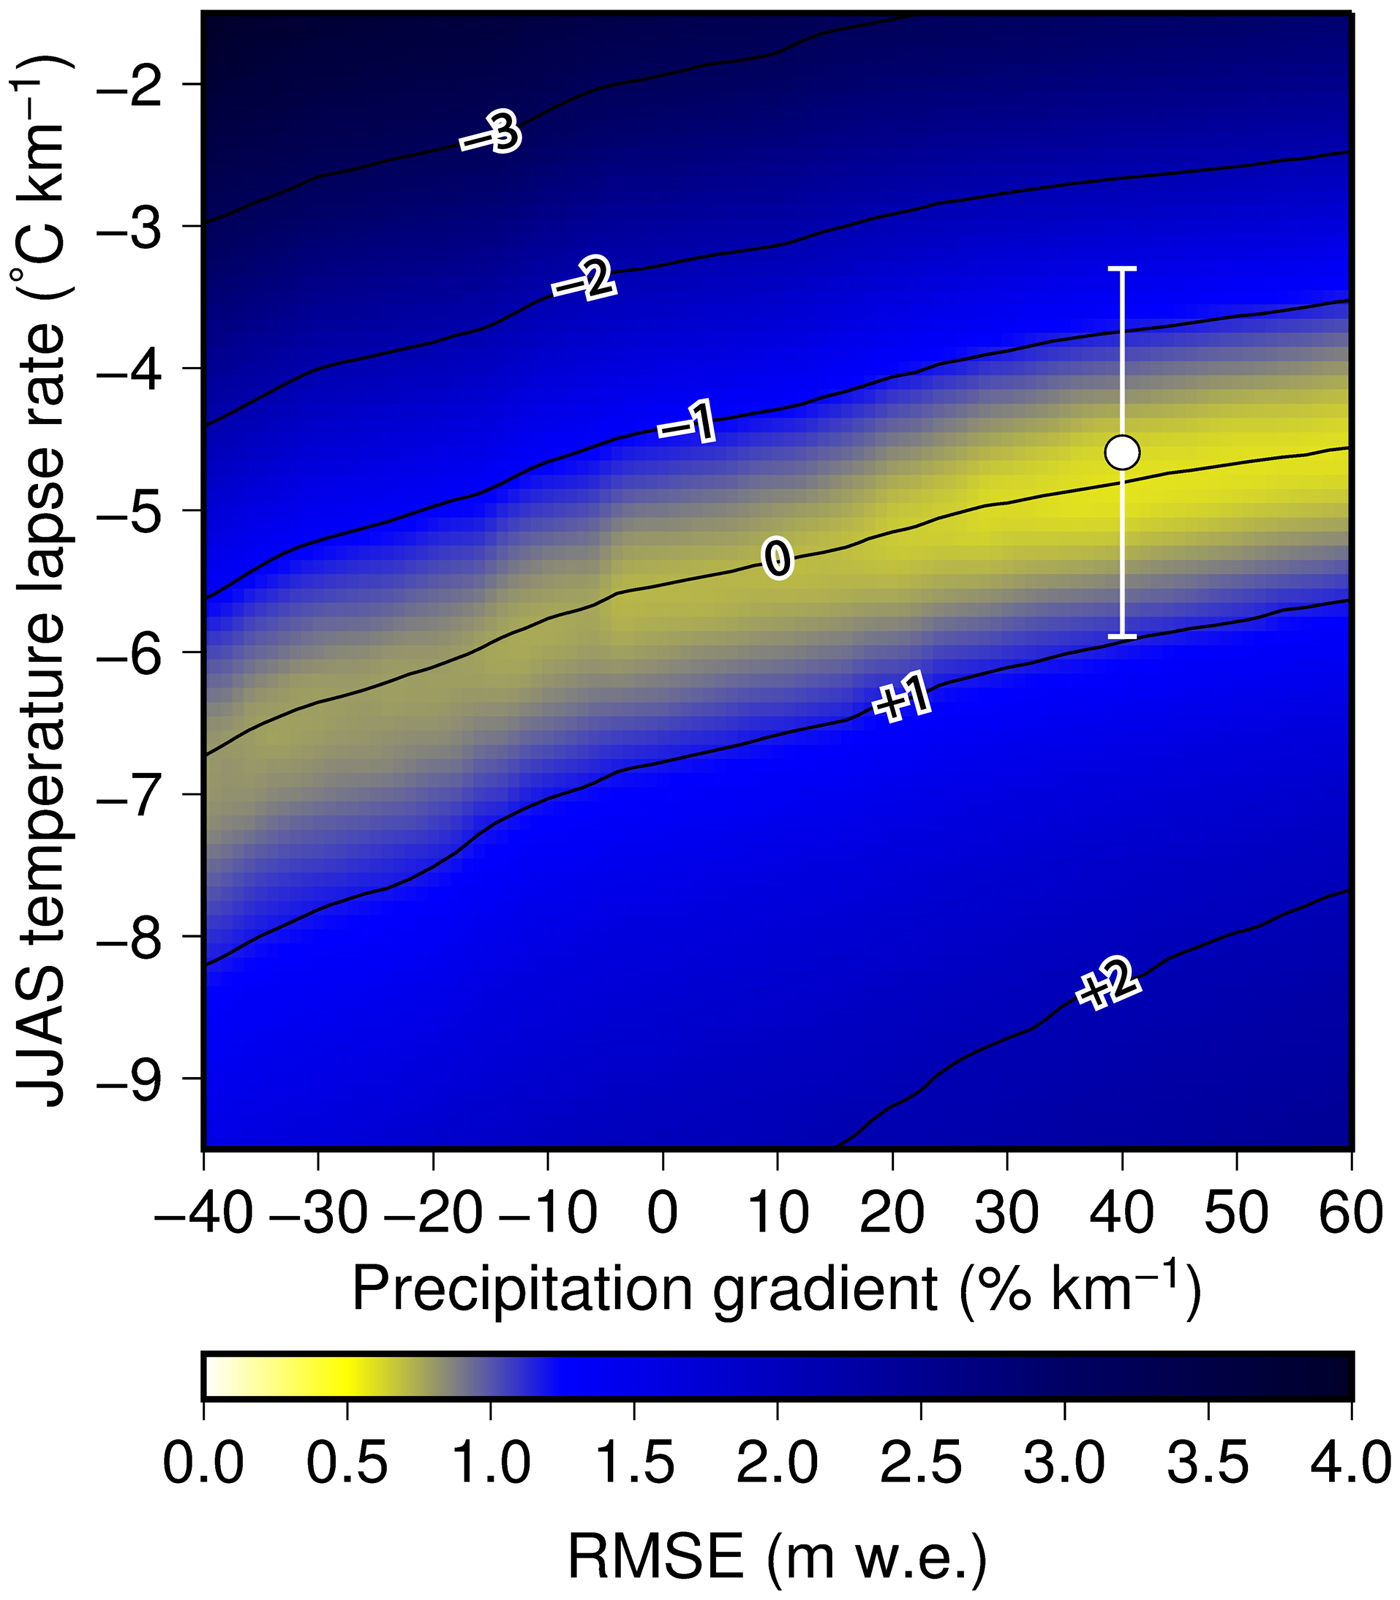
We first examined a model run using the same configuration as that employed in Fujita and Sakai (Reference Fujita and Sakai2014), with P GV set to 35% km−1, to evaluate the goodness-of-fit between the modelled and observed point mass balances, which yielded significantly positive biases (dashed lines in Fig. 3b). We determined the best mass-balance estimate based on the observed point mass balance by varying P GV and L R,ERA, with the best-fit mass-balance profiles being calculated for a P GV of +40% km−1 and JJAS L R,ERA of −4.76 °C km−1, which yielded an RMSE of 0.58 m w.e. for the point mass balance (Fig. 4 and Table 3). The simulated JJAS L R,ERA values are consistent with the L R,obs values during the monsoon season (Table 2), with all L R,ERA values being shifted by −0.90 °C km−1 to align with the simulated JJAS L R,ERA values. In addition, P GV values are similar to those observed in previous study (Immerzeel and others, Reference Immerzeel, Petersen, Ragettli and Pellicciotti2014), which ranged from +31 to +51% km−1 in Langtang Valley, Nepal. The calibrated mass-balance profiles are also consistent with the observations (solid lines in Fig. 3b). As the P GV in the high-elevation accumulation area (where there were no stake measurements) should affect the glacier-wide mass balance, we employed the average mass-balance profile based on those obtained using P GV values of 20 and 60% km−1 above 6000 m a.s.l. (shaded regions in Fig. 3b). The seasonal B for the 2016 period and annual B for the 2016/17 and 2017/18 periods were then calculated from a combination of the linear fits to the observed point mass balance below the highest stake and the modelled mass balance above the highest stake, yielding −0.34 ± 0.38, −0.66 ± 0.35 and −0.82 ± 0.53 m w.e. for the 2016, 2016/17 and 2017/18 periods, respectively (Table 3).
RMSE (coloured shading) and mean error (contour) of modelled mass balance for the upper debris-free Trambau Glacier against the stake measurements (2016–18) in combination of summer (JJAS) temperature lapse rate and precipitation gradient. White dot with error bar denotes the observed summer temperature lapse rates in 2017 and 2018.
4.3 Mass-balance sensitivity
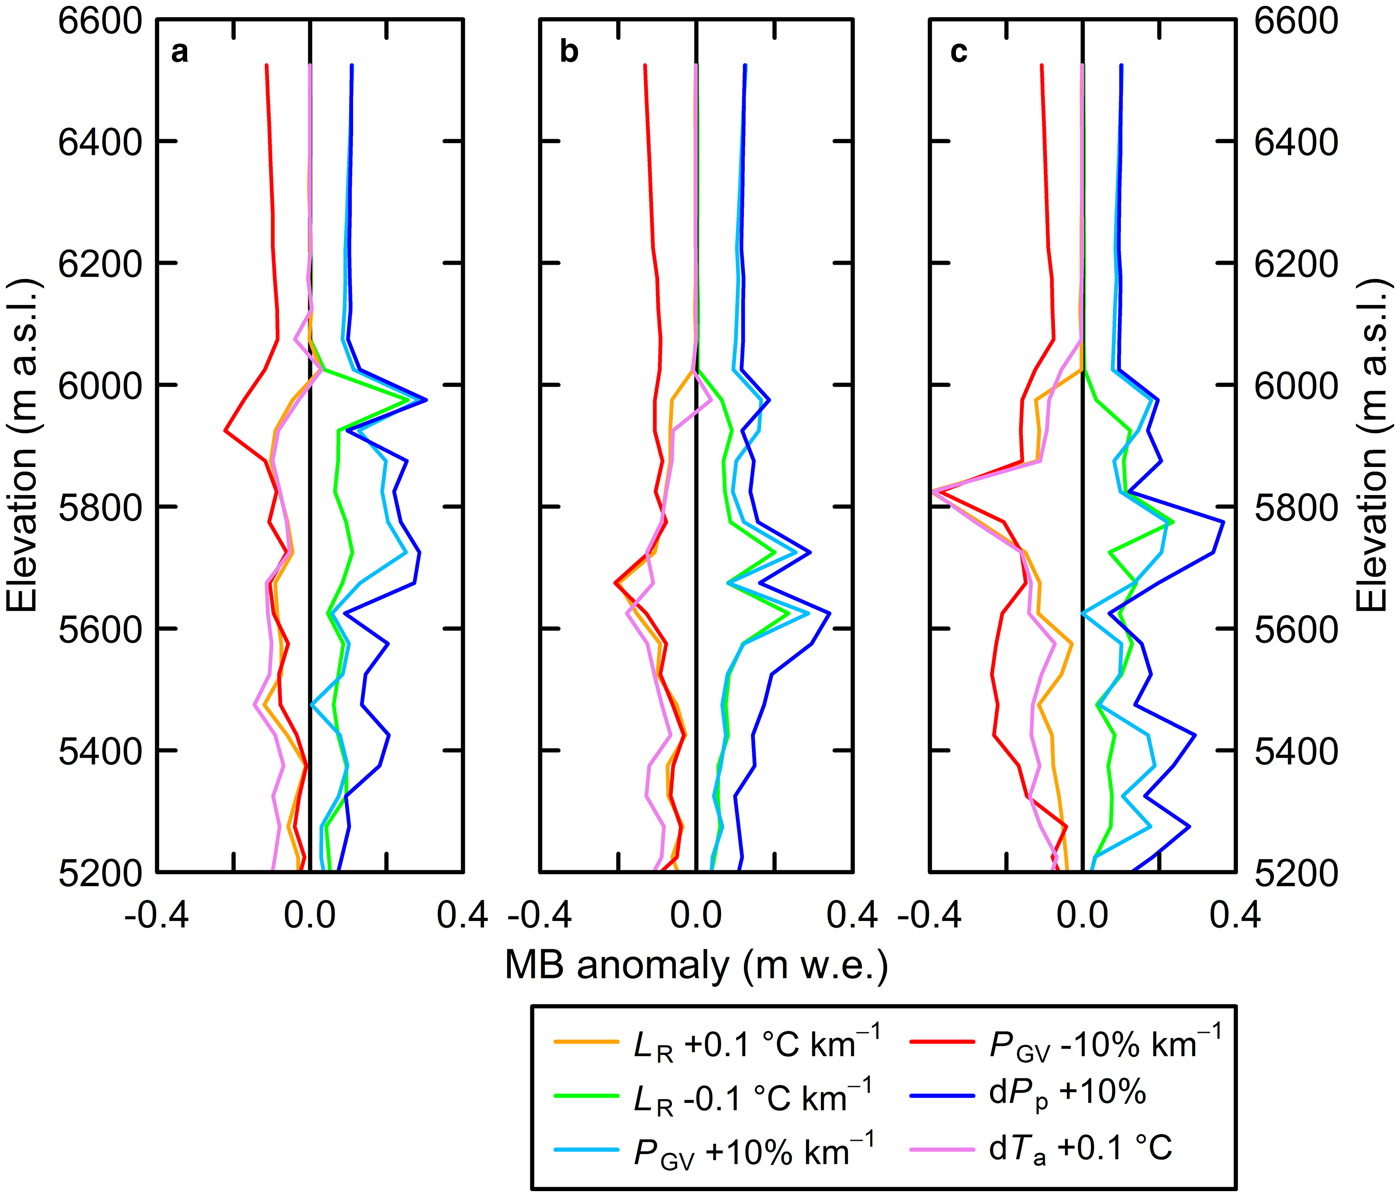
Table 4 and Figure 5 summarise the glacier-wide mass-balance and mass-balance profile anomalies. The mass balance exhibits more negative response to increasing lapse rate (−0.12 to −0.06 m w.e. per 0.1 °C per km) than to those to decreasing lapse rate (+0.08 to +0.09 m w.e. per 0.1 °C per km), with a similar negative response yielded by the warming condition (−0.14 to −0.07 m w.e. per 0.1 °C). Although the P GV changes result in an overall positive mass-balance response, the mass balance is more sensitive to decreasing P GV (−0.19 to −0.09 m w.e. a−1 per 10% per km) than to increasing P GV (+0.11 to +0.13 m w.e. per 10% per km) for the 2016, 2016/17 and 2017/18 periods. Furthermore, the mass balance exhibits positive response to increasing precipitation (0.17 to 0.18 m w.e. per 10%), which is of the same magnitude as the change in P GV.
Sensitivity of the glacier-wide mass balance (m w.e.) to changes in the temperature lapse rate (L R, ±0.1 °C km−1) and precipitation gradient (P GV, ±10% km−1), and to warmer (dT a, +0.1 °C) and wetter (dP p, +10%) conditions

Elevation profiles of mass-balance anomalies resulted from changes in air temperature lapse rate (L R, ±0.1 °C km−1) and precipitation gradient (P GV, ±10% km−1), and from warmer (dT a, + 0.1 °C) and wetter (dP p, +10%) conditions for (a) 2016, (b) 2016/17 and (c) 2017/18.
4.4 Long-term mass balance
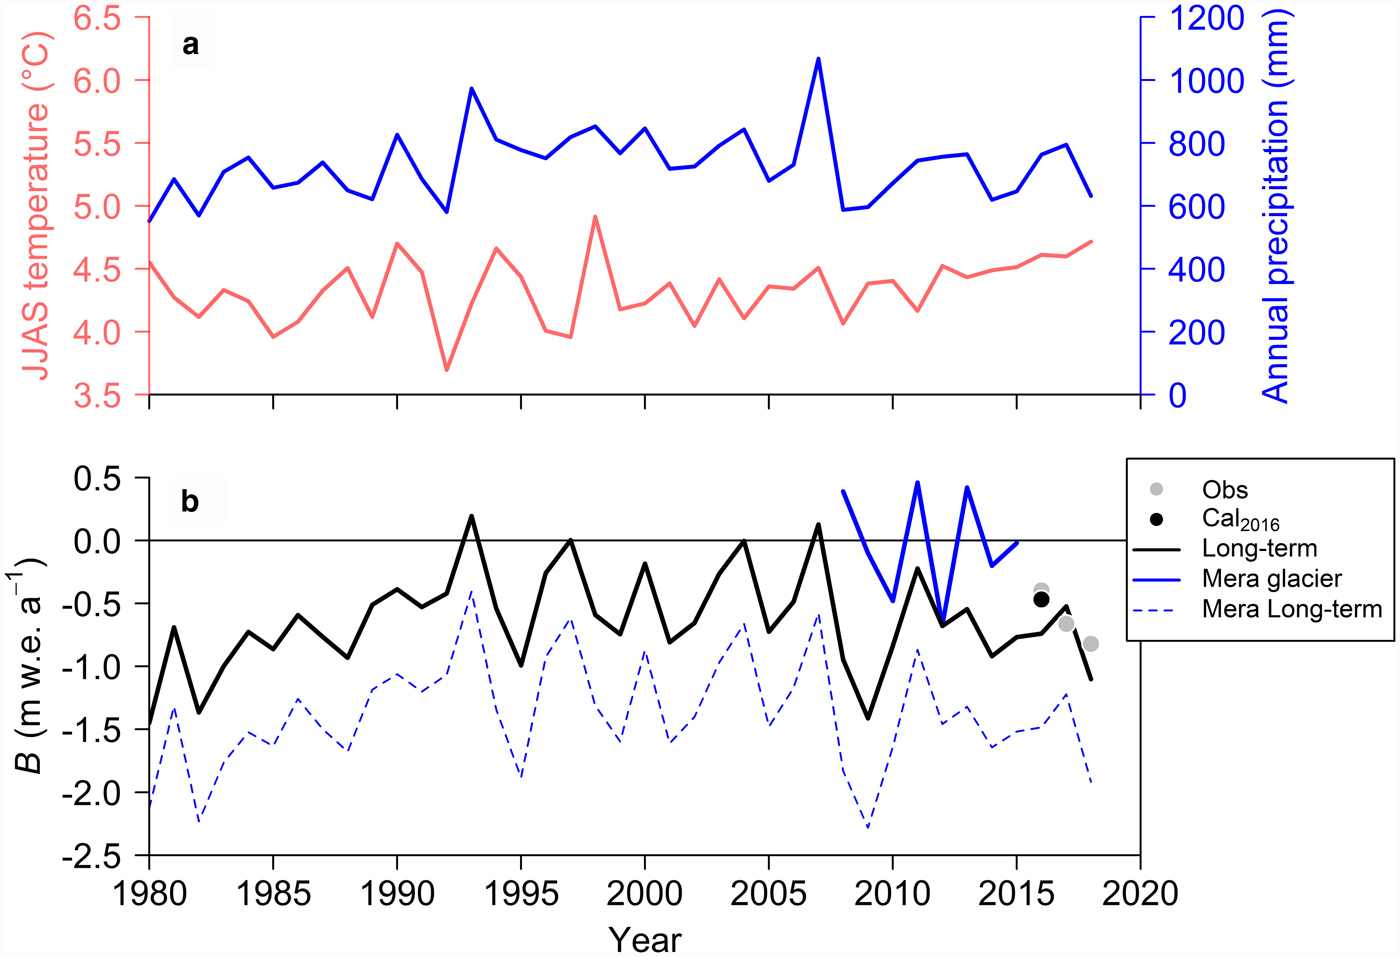
We first calculated the long-term B for the 1980–2018 (39 hydrological years) period. We then explored the precipitation ratio to determine the ERA-Interim precipitation that yields the best-fit B for the 2016, 2016/17 and 2017/18 periods (34%; RMSE = 0.19 m w.e.). Figure 6 shows the estimated JJAS temperature and annual precipitation for the AWS site, along with the calculated long-term B for Trambau Glacier. The observed B for Mera glacier during the 2008–2015 period is also shown (Sherpa and others, Reference Sherpa2017). The mean long-term B of Trambau Glacier is −0.65 ± 0.39 m w.e. a−1, which suggests that debris-free Trambau Glacier was under a negative mass-balance condition for the calculated period, with a slightly positive mass-balance condition calculated for 4 years (Fig. 6b). The long-term B and JJAS temperature values show no correlation (r = −0.21), whereas a significant positive correlation is found between the long-term B and annual precipitation (r = 0.77, p < 0.001). Sherpa and others (Reference Sherpa2017) reported that the observed B for Mera Glacier fluctuated around a net zero balance (−0.03 ± 0.43 m w.e. a−1) for the 2008–2015 period (Fig. 6b), whereas our modelled B for Trambau Glacier is negative during the same period (−0.79 ± 0.34 m w.e. a−1).
Time series of (a) summer mean (June, July, August and September: JJAS) temperature (red line) and annual precipitation (blue line) calibrated for the AWS site, and (b) calculated glacier-wide mass balance (B) of debris-free Trambau Glacier for the 1980–2018 period (black line) with the observed B (grey dots), calculated seasonal B of 2016 (May–October, black dot), observed B for Mera Glacier (thick blue line; Sherpa and others, Reference Sherpa2017) and calculated B using the Trambau Glacier mass-balance profile and Mera Glacier hypsometry (dashed blue line).
We further estimated the long-term B ext and B hgh by applying the two alternative hypsometries. As surface lowering rate was considered to be the mean long-term B for the Trambau Glacier (−0.65 m w.e. a−1), we assumed that the surface of Trambau Glacier in 1980 was 25 m w.e. higher than present and then we reconstructed its hypsometry. The differences of the mean long-term B ext and B hgh against B show −0.06 and 0.14 m w.e. a−1, respectively. The uncertainty in the constant hypsometry to long-term change is then estimated as ±0.15 m w.e. a−1. This result also implies that surface lowering of the Glacier could induce warmer environment and thus enhanced positive feedback on the glacier melt.
4.5 Climatic regime
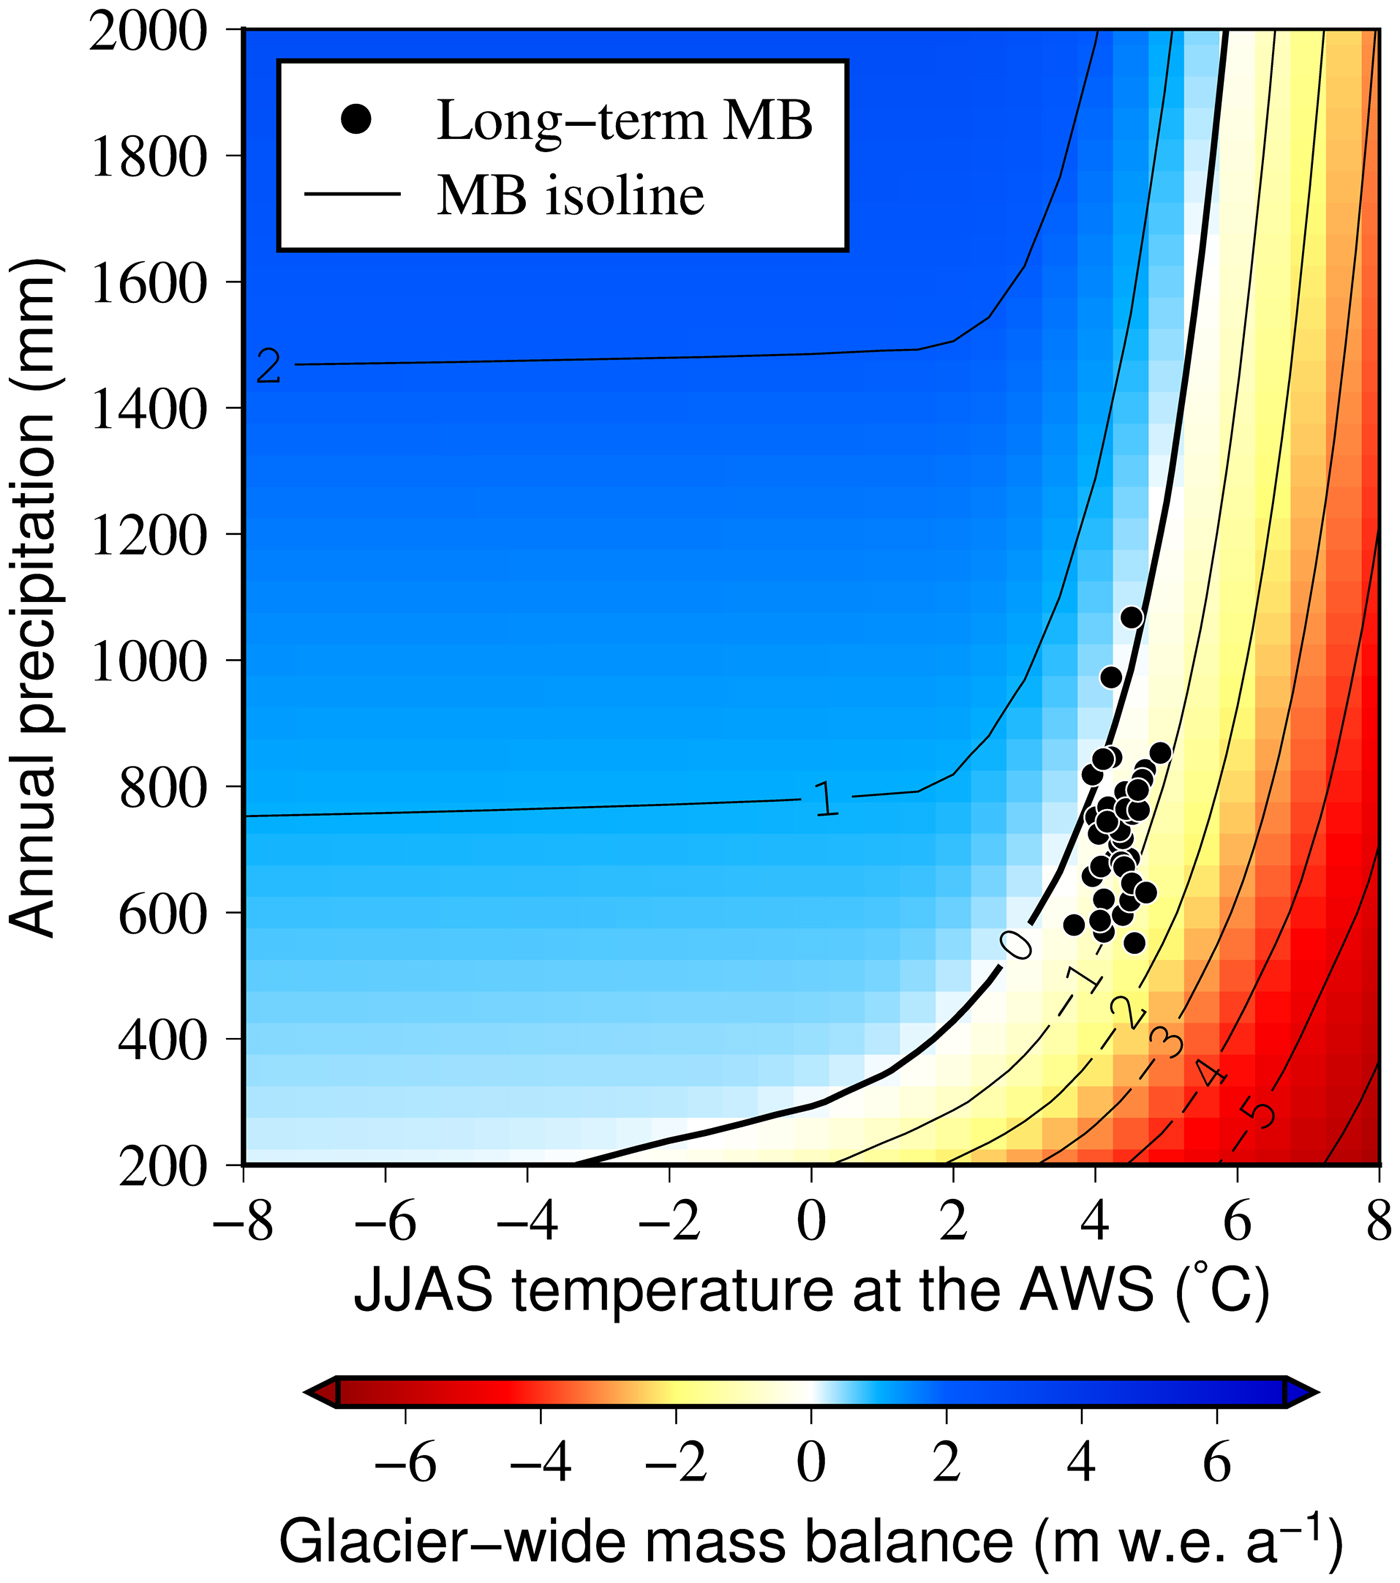
The climatic regime for the current geometry of Trambau Glacier, taken as the 1980–2018 average, is shown in Figure 7 as a function of the calibrated summer mean temperature and annual precipitation. The isoline for the equilibrium mass balance (thick black line) indicates that the annual precipitation required for the steady-state glacier increases exponentially with JJAS temperature. The JJAS temperature and annual precipitation calibrated for the AWS site (4806 m a.s.l.) plot primarily along the −1 m w.e. a−1 isoline, with mean values of 4.33 ± 0.25 °C and 729 ± 107 mm, respectively.
Climatic regime for the present-day geometry of debris-free Trambau Glacier for different combinations of summer mean (JJAS) air temperature and annual precipitation. Black dots denote the long-term regime derived from the calibrated ERA-Interim data for the 1980–2018 period.
5. DISCUSSION
5.1 Seasonality of the temperature lapse rate
According to Kattel and others (Reference Kattel2013), the smaller lapse values during the monsoon season are due to a higher relative humidity, which tends to release more latent heat through water vapour condensation and warm air at high elevations. Furthermore, thick cloud cover during the monsoon season could also contribute to a decrease in daytime H SR and an increase in night-time net H LR, resulting in reduced lapse rate fluctuations (Kattel and others, Reference Kattel2013). However, the drier atmosphere during the winter and pre-monsoon seasons should result in more negative lapse rate values, whereas occasional snowfall could reduce the differences in surface albedo with elevation and enhance lower-elevation radiative cooling, resulting in smaller lapse rate values or even temperature inversions. Heynen and others (Reference Heynen2016) also reported large lapse rate variations in the Langtang River catchment of central Nepal, which is affected by snow cover and drier conditions in winter.
5.2 Representativeness of observed point mass balance in 2016
The modelled B in 2015/16 (−0.74 m w.e. a−1) was more negative than the observed B in 2016 (−0.34 m w.e.), suggesting that the observed B in 2016 is not representative of the 2015/16 year-long mass balance. The estimated precipitation from the calibrated ERA-Interim was 70 mm during the October 2015–April 2016 period, which is only 10% of that estimated during the May–October 2016 period (710 mm). Ice melting would have occurred during the early pre- and post-monsoon seasons because the monthly mean air temperatures in October 2015 and April 2016 were near the melting point (−0.38 and −0.64 °C, respectively). Therefore, reduced precipitation and warmer months may have induced this difference. However, the modelled B using the calibrated ERA-Interim input for the same observation period in 2016 (−0.46 m w.e., black dot in Fig. 6b) is reasonably consistent with the observed B (−0.34 m w.e.), which supports the model performance for the long-term glacier-wide mass-balance reconstruction.
5.3 Mass-balance sensitivity
Figure 5 depicts the mass-balance anomalies from the sensitivity tests. The changes in L R and air temperature (dT a) have a limited effect on the mass balance above 6000 m a.s.l., possibly because of the colder environment. Warmer and drier (P GV = −10% km−1) conditions reduce solid precipitation and enhance ice melting, especially between 5600 and 5900 m a.s.l., where the glacier surface likely transitions from high-albedo snow to lower-albedo ice and vice versa. The decreased P GV value in 2018 yields a more negative profile than those in 2016 and 2016/17. As the observed summer precipitation was 603, 513 and 468 mm in 2016, 2017 and 2018, respectively, the reduced precipitation could have lowered the albedo and then enhanced ice melting between 5400 and 5800 m a.s.l. during the 2018 ablation season.
The reconstructed long-term glacier-wide mass balance shows a significant correlation with annual precipitation, whereas no correlation is found with summer mean temperature. Furthermore, using the same model for the same glaciarised catchment, Fujita and Sakai (Reference Fujita and Sakai2014) demonstrated that the entire runoff is less sensitive to precipitation changes than to air temperature changes because the responses of glacier ice melting and runoff from the ice-free terrain compensate each other. We calculated the contributions of JJAS temperature and annual precipitation variabilities (0.25 °C and 107 mm, respectively) for the 1980–2018 period to the glacier-wide mass-balance variability by multiplying the parameter variabilities by their respective sensitivities. The glacier-wide mass-balance variability induced by the precipitation variability (0.29 m w.e.) is comparable with that induced by the JJAS temperature variability (−0.23 m w.e.). It is still unclear why the only precipitation correlated with the mass balance though the combined effects of variability and sensitivity are comparable. Further research is required to better understand the influences of these key variables.
5.4 Mass-balance difference between Trambau and Mera glaciers
The B differences between Trambau and Mera glaciers may be caused by their different geometries (area–elevation distribution) and/or meteorological conditions. We therefore applied the mass-balance profile of Trambau Glacier to the Mera Glacier hypsometry (Wagnon and others, Reference Wagnon2013) to calculate an alternative B for Mera Glacier, assuming the same climatic conditions for the two glaciers. The modelled result (dashed blue line in Fig. 6b) yields a more negative B (−1.37 ± 0.44 m w.e. a−1 for the 1980–2018 period) than the observed B for Mera Glacier and the calculated B for Trambau Glacier. This implies that the meteorological conditions over Trambau and Mera glaciers are significantly different even though they are neighbouring glaciers (only ~40 km apart). In addition, the estimated equilibrium line altitude (ELAs) of Trambau Glacier (~5800 m a.s.l.) are 250–300 m higher than the mean ELA of Mera Glacier (5534 m a.s.l. during the 2007–2015 period; Sherpa and others, Reference Sherpa2017), although no direct comparisons are possible in this study because of the different observation periods. These results suggest that the climatic conditions governing the two glaciers are different. Sherpa and others (Reference Sherpa2017) reconstructed a 3-year precipitation record (2012–2015) from in situ point mass-balance data observed near the top of Mera Glacier (6350 m a.s.l.) under the assumption of no ablation and compared this reconstructed record with the precipitation record at Pyramid Station along Khumbu Glacier (5035 m a.s.l.). They suggested that at least 1000–1300 mm of annual precipitation occurred at Mera Glacier during the 3-year period, whereas only ~600 mm was recorded at Pyramid Station. The adjusted annual precipitation at the Trambau Glacier AWS site (4806 m a.s.l.) was 620–760 mm for the corresponding years (Fig. 6a), whereas the observed annual precipitation in 2016/17 and 2017/18 was 730 and 600 mm, respectively. This suggests that the annual precipitation at Mera Glacier is ~1.7 times greater than that at Trambau Glacier. Furthermore, the estimated precipitation at Mera Glacier was reconstructed from the highest stake, which is likely to be affected by wind erosion (Wagnon and others, Reference Wagnon2013), such that higher precipitation would be expected for Mera Glacier. Therefore, the precipitation difference is likely the primary factor influencing the contrasting mass balances between Trambau and Mera glaciers. We also estimated that the annual precipitation at Mera Glacier should be almost twice that observed at Trambau Glacier to yield an equilibrium B during the 2008–2015 period by increasing the ERA-Interim precipitation.
We calculated the average slope and aspect of both glaciers from ASTER-GDEM2 data owing to the limited available data from Mera Glacier. Despite the similar surface slopes of both glaciers (19° on Trambau Glacier and 21° on Mera Glacier), Trambau Glacier has a southwesterly aspect (223°), whereas Mera Glacier has a northeasterly aspect (44°). The radiative condition should therefore be more preferable for suppressing snow/ice melting at Mera Glacier than at Trambau Glacier. A direct comparison of ground-based meteorological and glaciological data from both glaciers would be helpful to better understand the significant mass-balance difference between these neighbouring glaciers.
6. CONCLUSIONS
We conducted in situ mass-balance measurements at the Trakarding–Trambau Glacier system in Rolwaling Valley, Nepal, from May 2016 to October 2018, and re-evaluated the model parameters affecting temperature and precipitation to determine their impacts on the observed point mass balance. Linear relationships are found between the observed point mass balances and surface elevations of debris-free Trambau Glacier. The modelled mass balance is consistent with the observed profiles after tuning the temperature lapse rate and precipitation gradient. Glacier-wide mass balances, which are estimated from a combination of linear regression lines along the available stake measurements and modelled mass balances above the highest stake, are −0.34 ± 0.38 m w.e. in 2016, −0.66 ± 0.35 m w.e. in 2016/17 and −0.82 ± 0.53 m w.e. in 2017/18.
We also reconstructed the long-term mass balance of Trambau Glacier over the past 39 years (1980–2018) using calibrated ERA-Interim reanalysis data, which indicates that the glacier has undergone net mass loss throughout this period (−0.65 ± 0.39 m w.e. a−1). The calculated climatic regime for the current glacier geometry also indicates the recent negative state of the glacier. The long-term glacier-wide mass balance is significantly correlated with precipitation variations. Our sensitivity analysis suggests that the contribution of precipitation variability to inter-annual variability of glacier mass balance is comparable with that of JJAS temperature variability. Furthermore, the more negative mass balance of Trambau Glacier compared with neighbouring Mera Glacier may be attributed to precipitation differences between the two glaciers.
Continuous glacier measurements are necessary to better understand the regional-scale behaviour of Himalayan glaciers in response to ongoing climate change. It would therefore be worthwhile to deploy more stakes above 5850 m a.s.l. to constrain the glacier mass balance in the high-elevation accumulation area. However, it is noted that there are inherent difficulties in obtaining these high-elevation observations because of logistics and safety. Continuous AWS observations would also capture different climatic conditions among the benchmark glaciers in neighbouring regions. Furthermore, as we focused only on debris-free Trambau Glacier in this study, the importance of debris-covered Trakarding Glacier to the catchment water cycle remains unclear. Therefore, further research is required to better understand the mass-balance processes of debris-covered glaciers based on observational data.
SUPPLEMENTARY MATERIAL
The supplementary material for this article can be found at https://doi.org/10.1017/jog.2019.37
AUTHORS CONTRIBUTION
K. F. designed the study. S. S., K. F. and A. S. conducted the field observations with the support of R. B. K., and S. S. analysed the data. S. S. and K. F. performed the model calculations. S. S. and K. F. wrote the manuscript with the help of A. S.
ACKNOWLEDGEMENTS
We are indebted to Guide For All Seasons for logistical support during the field observations. We thank S. Sugiyama, N. Morimoto, M. Rai, S. Takenaka, A. Acharya, A. Tsushima, E. A. Podolskiy, H. Inoue, Y. Sato and R. Hazuki for their support during field observations. This study was supported financially by JSPS-KAKENHI grant numbers 26257202, 17H01621 and 18KK0098.


 Open access