

Introduction
Kopernikite, K(Ti7Cr3+)O16, is the fourth new mineral that was discovered in the Morasko iron meteorite from the Poznań district in Poland. The first three minerals are phosphates: moraskoite, Na2Mg(PO4)F (Karwowski et al., Reference Karwowski, Kusz, Muszyński, Kryza, Sitarz and Galuskin2015), czochralskiite, Na4Ca3Mg(PO4)4 (Karwowski et al., Reference Karwowski, Kryza, Muszyński, Kusz, Helios, Drożdżewski and Galuskin2016) and kryzaite, Na4(MgCr)(PO4)3 (Galuskin et al., Reference Galuskin, Muszyński, Panikorovskii, Kusz, Książek, Galuskina, Zieliński and Prusik2026). Kopernikite is an oxide with a tunnel structure of the hollandite type AM 8O16 and belongs to the priderite group formed by four titanates (Supplementary Table S1): priderite, K(Ti7Fe3+)O16 (Norrish, Reference Norrish1951), redledgeite, Ba(Ti6Cr3+2)O16 (Strunz, Reference Strunz1963), mannardite, Ba(Ti6V3+2)O16 (Scott and Peatfield, Reference Scott and Peatfield1986) and henrymeyerite, Ba(Ti7Fe2+)O16 (Mitchell et al., Reference Mitchell, Yakovenchuk, Chakhmouradian, Burns and Pakhomovsky2000). Recently, a potentially new mineral of the priderite group was discovered: an Fe3+ analogue of redledgeite with the formulae Ba(Ti6Fe3+2)O16 (Lazareva et al., Reference Lazareva, Sharygin, Rashchenko, Tolstov and Zhmodik2025).
‘Cr-priderite’, which is similar in composition to kopernikite, has been found in peridotite xenoliths in Bultfontein, South Africa (Jones et al., Reference Jones, Smith and Dawson1982), in the Argyle lamproite, Western Australia (Jacques et al.,Reference Jaques, Boxer, Lucas and Haggerty1986), in the Mengying kimberlite, Shandong Province, China (Zhou, Reference Zhou1986; Zhou and Lu, Reference Zhou and Lu1994), in the Francis lamproite, Utah, USA (Mitchell, Reference Mitchell1995), in metasomatically altered harzburgites, Kaapvaal Craton, South Africa (Konzett et al., Reference Konzett, Wirth, Hauzenberger and Whitehouse2013), and in the garnet peridotites of the Bohemian Massif, Czech Republic (Naemura et al., Reference Naemura, Shimizu, Svojtka and Hirajima2015). It is very likely that because of the small grain size of ‘Cr-priderite’ it has not been investigated and described as a new mineral species.
Around 500 minerals have been identified in meteorites, a tenth of which contain Ti as a main component (Rubin and Ma, Reference Rubin and Ma2021). Unlike most minerals of terrestrial origin which contain Ti4+, meteorites also contain Ti3+-bearing minerals indicating super-reduced conditions. Rutile, TiO2 (tetragonal, a = 4.69 Å, c = 2.96 Å) is a mineral that is often found in meteorites. The rutile structure is considered a 1×1 tunnel with walls formed by single columns of octahedra (Pasero, Reference Pasero2005). Minerals of the priderite group have a 2×2 tunnel structure derived from rutile, which allows large cations such as Вa, K, Pb, and also H2O to enter the channels (Byström and Byström, Reference Byström and Byström1950; Pasero, Reference Pasero2005; Biagioni et al., Reference Biagioni, Capalbo and Pasero2013). In meteorites and impact rocks, there are known to be high-pressure silicates with feldspar composition and a hollandite structure such as lingunite, NaAlSi3O8 (Gillet, Reference Gillet, Chen, Dubrovinsky and El Goresy2000), liebermannite, KAlSi3O8 (Ma et al., Reference Ma, Tschauner, Beckett, Rossman, Prescher, Prakapenka, Bechtel and MacDowell2018), and stöfflerite, CaAl2Si2O8 (Tschauner et al., Reference Tschauner, Ma, Spray, Greenberg and Prakapenka2021).
‘Cr-priderite’ with the composition K1.63–1.74(Ti4+6.13–6.23Cr3+1.47–1.75Al0.10–0.13Mg0.05-0.07Fe3+0.04–0.07Mn2+0–0.04Nb5+0–0.01)O16 was synthesised at high temperature (1200°C) and pressure (5 GPa) (Butvina et al., Reference Butvina, Vorobey, Safonov, Varlamov, Bondarenko and Shapovalov2019). Its composition is similar to that of the end-member K2(Ti4+6Cr3+2)O16, but not to K(Ti4+7Cr3+)O16 also known as kopernikite. This is not unexpected, given that synthetic phases K2Cr8O16, K2V8O16 and K2Ti8O16 with a hollandite structure and a mixed valence of the octahedral cations were synthesised at high temperatures and pressures with full channel sites occupation (Tamada et al., Reference Tamada, Yamamoto, Mori and Endo1996; Komarek et al., Reference Komarek, Isobe, Hemberger, Meier, Lorenz, Trots, Cervellino, Fernández-Díaz, Ueda and Braden2011)
The mineral kopernikite (symbol Kop), has been approved by the Commission on New Minerals, Nomenclature and Classification (CNMNC) of the International Mineralogical Association (IMA) under the number IMA2025-082. The type specimen of kopernikite is deposited in the collections of the Mineralogical Museum at the University of Wrocław (Cybulskiego 30, 50-205 Wrocław, Poland). Its catalogue number is MMUWr-IV-8223.
The name ‘kopernikite’ comes from the surname of Mikołaj Kopernik (also known as Nicolaus Copernicus, 1473–1543), a Renaissance polymath who proposed a heliocentric model of the universe. Kopernik probably developed his model independently of Aristarchus of Samos, an ancient Greek astronomer who had formulated a similar model some eighteen centuries earlier. The publication of Kopernik’s model in his book “De revolutionibus orbium coelestium” (On the Revolutions of the Celestial Spheres), shortly before his death in 1543, was a significant event in the history of science. It triggered the ‘Copernican Revolution’ and made a pioneering contribution to the Scientific Revolution. Kopernik was born and died in Royal Prussia, a semi-autonomous and multilingual region created within the Crown of the Kingdom of Poland from lands regained from the Teutonic Order after the Thirteen Years’ War.
In this paper, we present the results of our investigations of the new mineral, kopernikite, and address issues related to the character of the occupation at the channel sites within its structure, as well as the genesis of the mineral itself.
Methods of investigation
During a systematic investigation of 60 polished mounts made from the Morasko meteorite, which is characterised by graphite–troilite nodules in a metallic matrix, one specimen of kopernikite was discovered using optical and electron microscopes. The morphology and composition of kopernikite and associated minerals were studied using an electron microscope (Quanta 250, Institute of Earth Sciences, Faculty of Natural Sciences, University of Silesia, Sosnowiec, Poland) and an electron microprobe analyser (Cameca SX100, Micro-Area Analysis Laboratory, Polish Geological Institute – National Research Institute, Warsaw, Poland). The chemical analyses of kopernikite was conducted in WDS mode (wavelength-dispersive spectroscopy, settings: 15 kV, 20 nA, beam diameter 3 μm) using the following lines and standards: NaKα – sanidine, KKα, AlKα – orthoclase, CaKα – wollastonite, TiKα – rutile, FeKα – hematite, CrKα – Cr2O3, BaLβ – baryte. The concentration of other chemical elements was below the detection limit.
Raman spectra of kopernikite were recorded using a WITec alpha 300R confocal Raman microscope (Department of Earth Sciences, University of Silesia, Poland). This microscope is equipped with an air-cooled, solid-state laser (532 nm) and a CCD camera that is cooled to –61°C. An air Zeiss LD EC Epiplan-Neofluar DIC-100/0.75NA objective was used. The Raman scattered light was focused onto a multi-mode fibre and monochromators with a 1800 mm–1 grating. The laser power at the sample position was 15–20 mW. Fifteen scans were collected and averaged with an integration time of 3 s and a resolution of 2 cm–1.
Single-crystal X-ray studies of kopernikite were carried out using a SuperNova diffractometer equipped with a mirror monochromator (MoKα, λ = 0.71073Å) and an Atlas CCD detector (formerly manufactured by Agilent Technologies and currently by Rigaku Oxford Diffraction) at the Institute of Physics, University of Silesia, Poland. The kopernikite structure was refined using the SHELX-2019/2 programme (Sheldrick, Reference Sheldrick2015) starting from the atomic coordinates of priderite (Post et al., Reference Post, Von Dreele and Buseck1982).
Occurrence and description
Kopernikite was discovered in the Morasko iron meteorite, the existence of which was first reported in 1914 (Muszyński et al., Reference Muszyński, Kryza, Karwowski, Pilski and Muszyńska2012). The meteorite fell around 5000 years ago (Stankowski and Muszyński, Reference Stankowski and Muszyński2008). The Morasko meteorite has been classified as belonging to the IAB main group (IAB-MG). It contains a large number of graphite–troilite nodules with inclusions of silicates, phosphates and oxides. The majority of finds have been made in the Morasko meteorite nature reserve, which is located on the northern outskirts of Poznan in central-western Poland at the coordinates 52°29’25.2”N 16°53’25.9”E. Many new finds have been reported since the 1990s, including the 261.2 kg main mass that was found on 8 October 2012 (Pilski et al., Reference Pilski, Wasson, Muszyński, Kryza, Karwowski and Nowak2013). It is estimated that the total weight of all the finds exceeds 2000 kg and that they all originate from a single meteorite shower (Muszyński et al., Reference Muszyński, Kryza, Karwowski, Pilski and Muszyńska2012).
The Morasko iron matrix mainly consists of α-iron (kamacite), taenite γ-(Ni,Fe) and γ-iron (Fe,Ni) as well as subordinate tetrataenite, Ni-bearing schreibersite, nickelphosphide and cohenite (Muszyński et al., Reference Muszyński, Stankowski, Dzierżanowski and Karwowski2001, Reference Muszyński, Kryza, Karwowski, Pilski and Muszyńska2012). The metal matrix of the Morasko meteorite contains oval inclusions (nodules), some of which are a few centimetres in size. These nodules are typically dominated by graphite and troilite. They are usually rimmed by a schreibersite (± cohenite) halo. Apart from the two main components (graphite and troilite in various proportions), various nodules have been found to contain several silicates and other accessory minerals: kamacite, taenite, pyrrhotite, schreibersite, cohenite, native copper, sphalerite, daubréelite, djerfisherite, altaite, chromite–magnesiochromite, krinovite, kosmochlor, enstatite, forsterite, albite, orthoclase, quartz, and phosphates such as fluorapatite, buchwaldite, brianite, merrillite, moraskoite, czochralskiite and kryzaite (Dominik, Reference Dominik1976; Muszyński et al., Reference Muszyński, Stankowski, Dzierżanowski and Karwowski2001, Reference Muszyński, Kryza, Karwowski, Pilski and Muszyńska2012; Karwowski and Muszyński, Reference Karwowski and Muszyński2006; Dziel et al., Reference Dziel, Gałązka-Friedman and Karwowski2007; Karwowski et al., Reference Karwowski, Muszyński, Kryza and Helios2009a, Reference Karwowski, Muszyński, Kryza and Pilski2009b, Reference Karwowski, Helios, Kryza, Muszyński and Drożdżewski2013, Reference Karwowski, Kusz, Muszyński, Kryza, Sitarz and Galuskin2015, Reference Karwowski, Kryza, Muszyński, Kusz, Helios, Drożdżewski and Galuskin2016; Galuskin et al., Reference Galuskin, Muszyński, Panikorovskii, Kusz, Książek, Galuskina, Zieliński and Prusik2026).
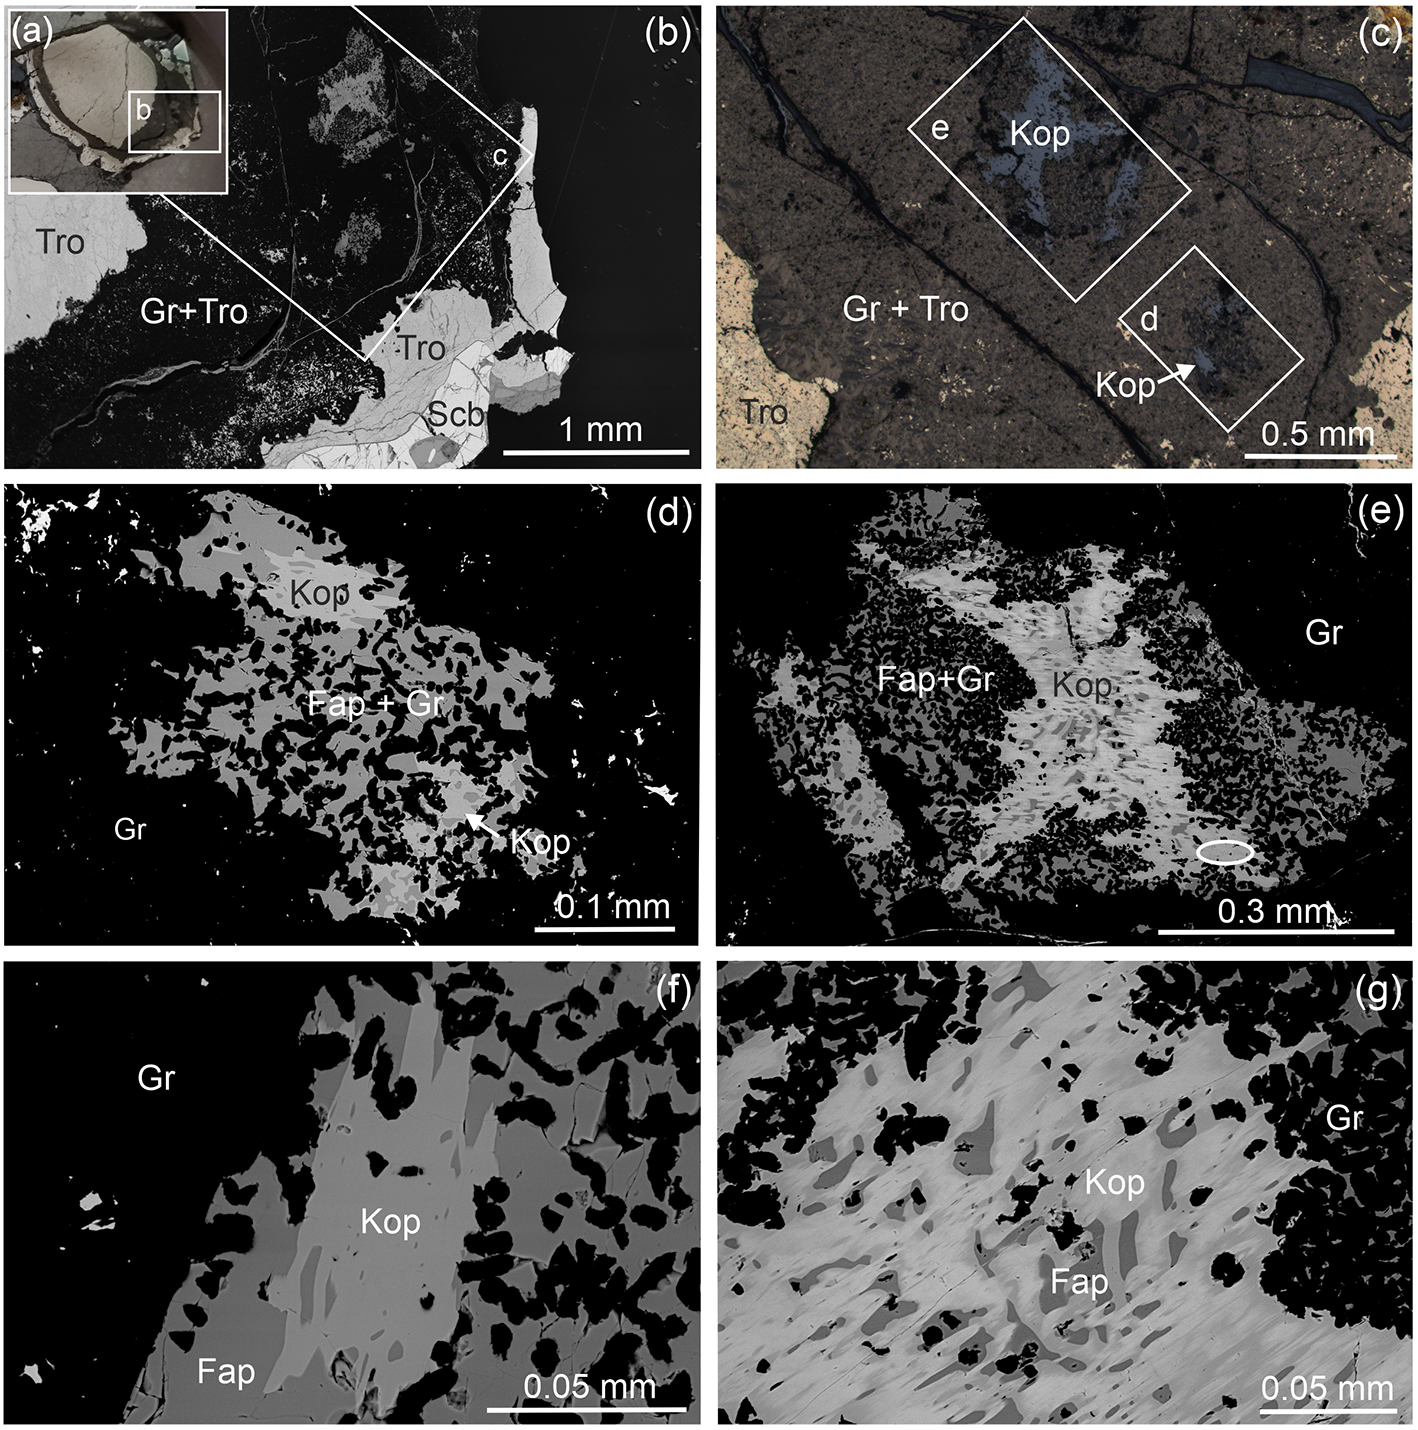
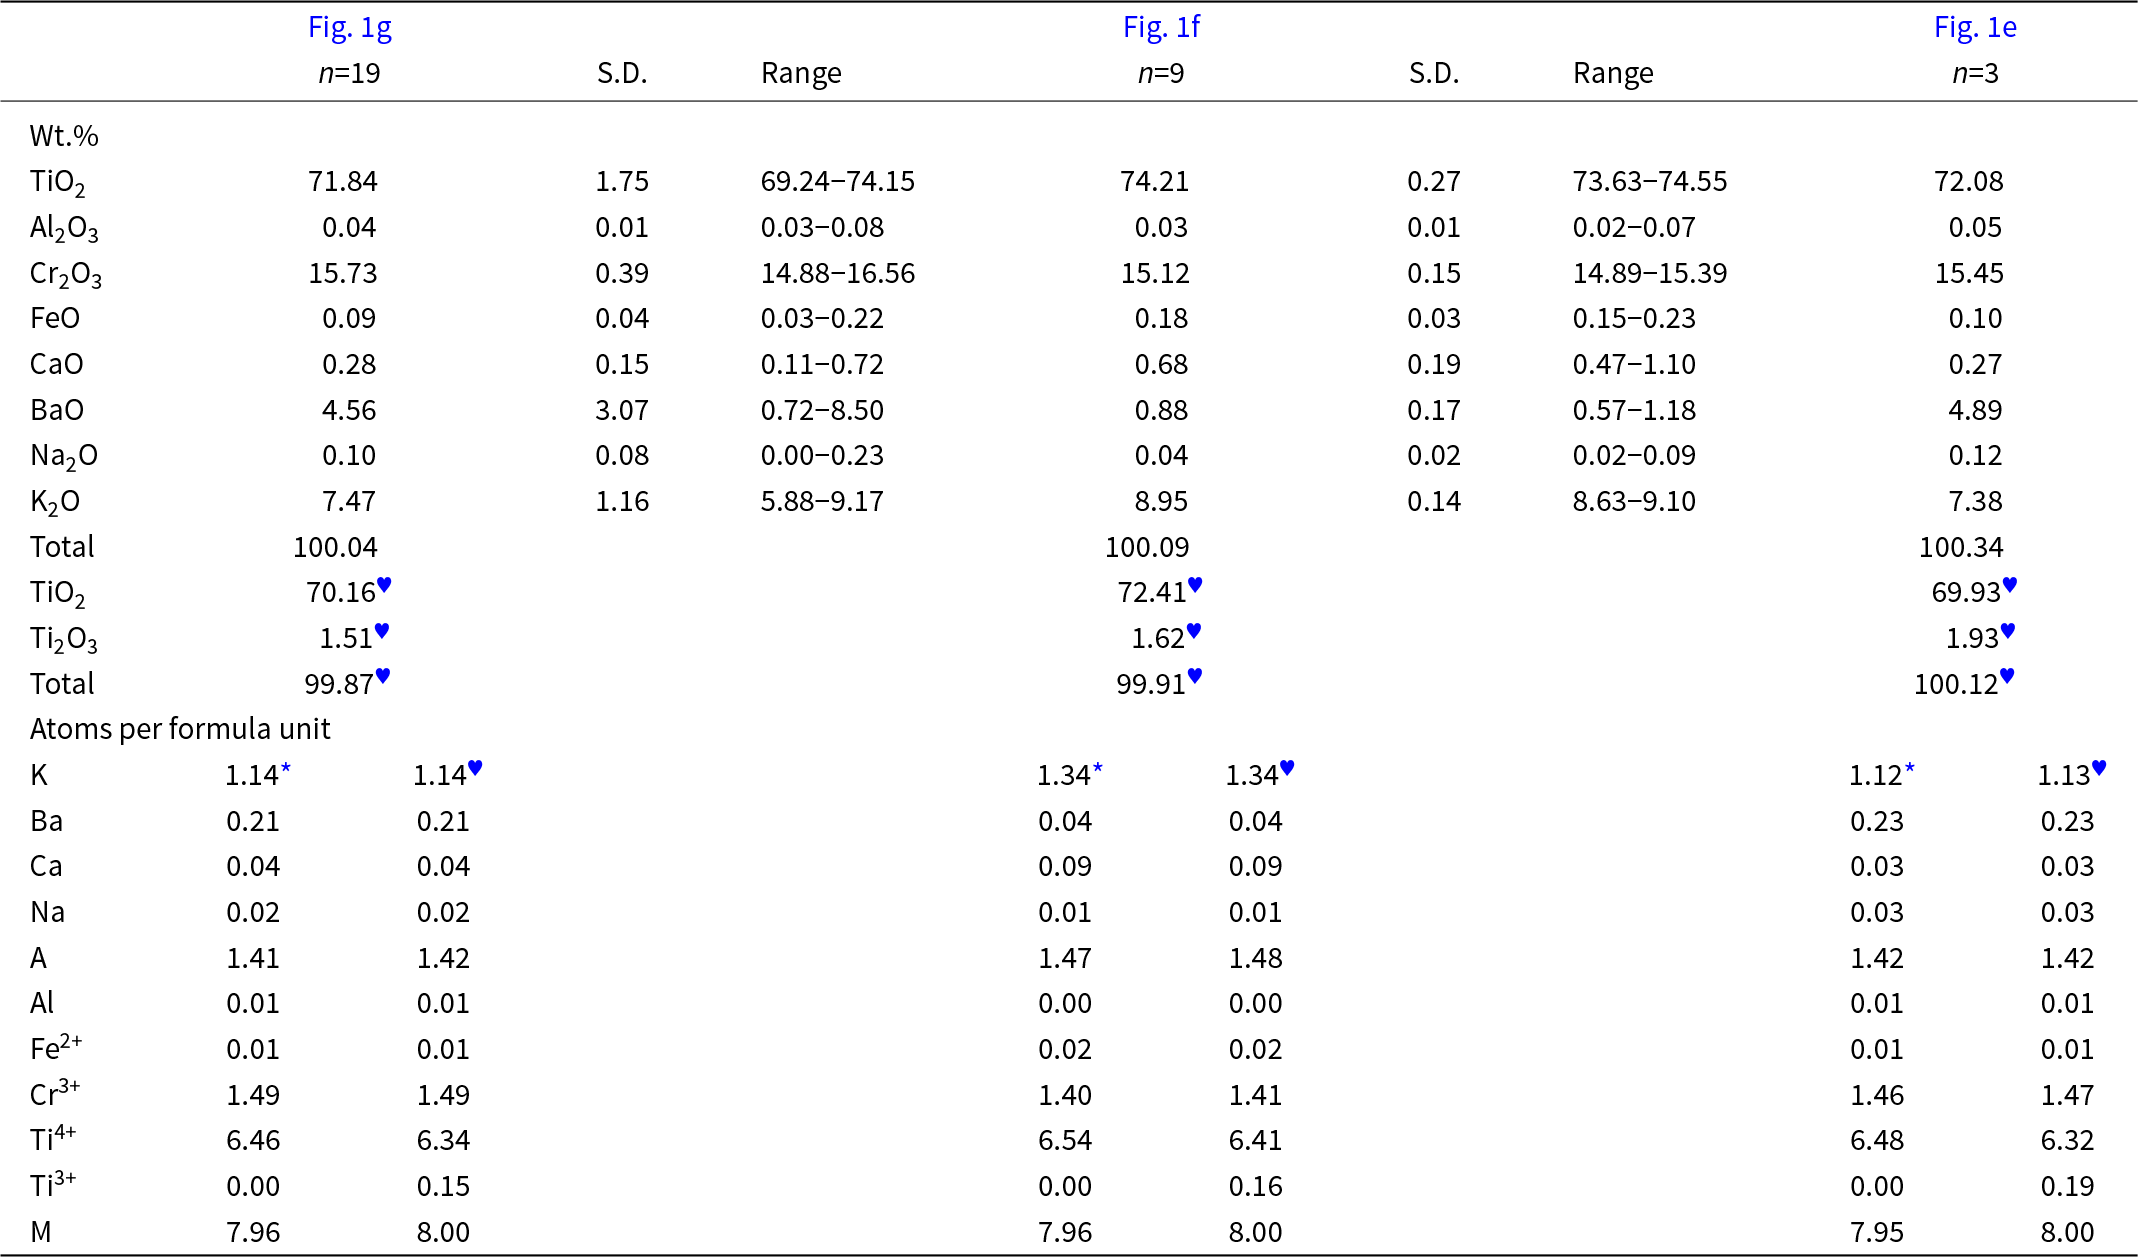
Kopernikite has only ever been found in one oval nodule, measuring 0.6×0.7 cm. The central part of the nodule consists of troilite. The outer part of the nodule consists of graphite containing a small amount of troilite, and a schreibersite zone is present at the interface with the iron matrix (Fig. 1a). Xenomorphic fluorapatite segregations are observed in the graphite zone, within which kopernikite was discovered. Two areas of fluorapatite containing kopernikite were found (Fig. 1b, c). In the first area, kopernikite was found as homogeneous xenomorphic grains within fluorapatite. The largest grain, measuring 100×50 μm, exhibits a low barium content: (K1.34Ba0.04Ca0.09Na0.01)Σ1.48(Ti4+6.54Cr3+1.40Fe2+0.02Al0.01)Σ7.97O16 (Fig. 1d,f; Table 1, analysis 1). Within a relatively large fluorapatite aggregate, the second grain, a poikilitic kopernikite measuring 300 μm, exhibits an inhomogeneous distribution of barium that is clearly visible in the BSE (back-scattered electron) image (Fig. 1c, e, g). The barium content in the grain varies from 0.72 to 8.5 wt.% BaO, with a mean composition of (K1.14Ba0.21Ca0.04Na0.02)Σ1.41(Ti4+6.46Cr3+1.49Al0.01Fe2+0.01)Σ7.97O16 (Table 1, analysis 2). For the structural study, a fragment of the grain shown in Fig. 1e, with a mean composition determined by three measurement points, was separated and found to correspond to the empirical formula: (K1.12Ba0.23Ca0.03Na0.03)Σ1.42 (Ti4+6.48Cr3+1.46Fe2+0.01Al0.01)Σ7.96O16 (Table 1, analysis 3).
(a) An oval nodule of troilite with a thin rim of graphite, macrophoto. The frame shows a fragment of this area magnified in Fig. 1b. (b) A fragment of the graphite zone in which xenomorphic fluorapatite aggregate contains kopernikite inclusions (BSE image). The frame shows a fragment magnified in Fig. 1c. (c) Kopernikite grains appear grey in reflected light. The frames show fragments magnified in Figs 1d, e. (d, e) Xenomorphic poikilitic grains of kopernikite containing fluorapatite and graphite inclusions (BSE image). The oval in (e) indicates the fragment of kopernikite selected for the SC-XRD study. (f) A homogeneous grain of low-barium kopernikite, a magnified fragment of (d) (BSE image). (g) An inhomogeneous kopernikite grain with light zones enriched with Ba (BSE image). Tro = troilite, Gr = graphite, Scb = schreibersite, Kop = kopernikite, Fap = fluorapatite (Warr, Reference Warr2021).

Figure 1 Long description
The image A shows an oval nodule of troilite with a rim of graphite. Image B is a low-magnification BSE image of a graphite zone with a square box showing an area in more detail in image C. Image C is under reflected light and highlights two patchy kopernikites as it stands out in grey among the brown of the Gr+Tro. It is maximum around 0.5 mm in length and width. Two white rectangles surrounding the two kopernikite occurrences are in image d and e. Images D and E show in detail the xenomorphic poikilitic textures of kopernikite in brighter grey than the surrounding fluorapatite and with dark small graphite inclusions. A small oval in e shows the area selected for SCXRD. It is a grey, mostly uniform area. Image F shows in detail a pale grey homogeneous grain of low-barium kopernikite surrounded by darker grey fluorapatite which has many inclusions of small dark graphite. Image G depicts an inhomogeneous kopernikite grain in grey with lighter barium-rich zones.
Chemical composition of kopernikite from the Morasko meteorite: 1 – grain in Fig. 1g, 2 – grain in Fig. 1f, 3 – fragment of grain shown by ellipse in Fig. 1e

Table 1 Long description
The table presents the chemical composition of kopernikite grains from the Morasko meteorite, for grains 1, 2 and 3. Constituents are TiO2, Al2O3, Cr2O3, FeO, CaO, BaO, Na2O and K2O. The main difference between the three sampes is the amount of barium. See text for a full description and calculated formula from the apfu.
Notes: * – calculated on 16O, ♥ – calculated on 8(Ti+Cr+Fe+Al) and 16O. S.D. – standard deviation
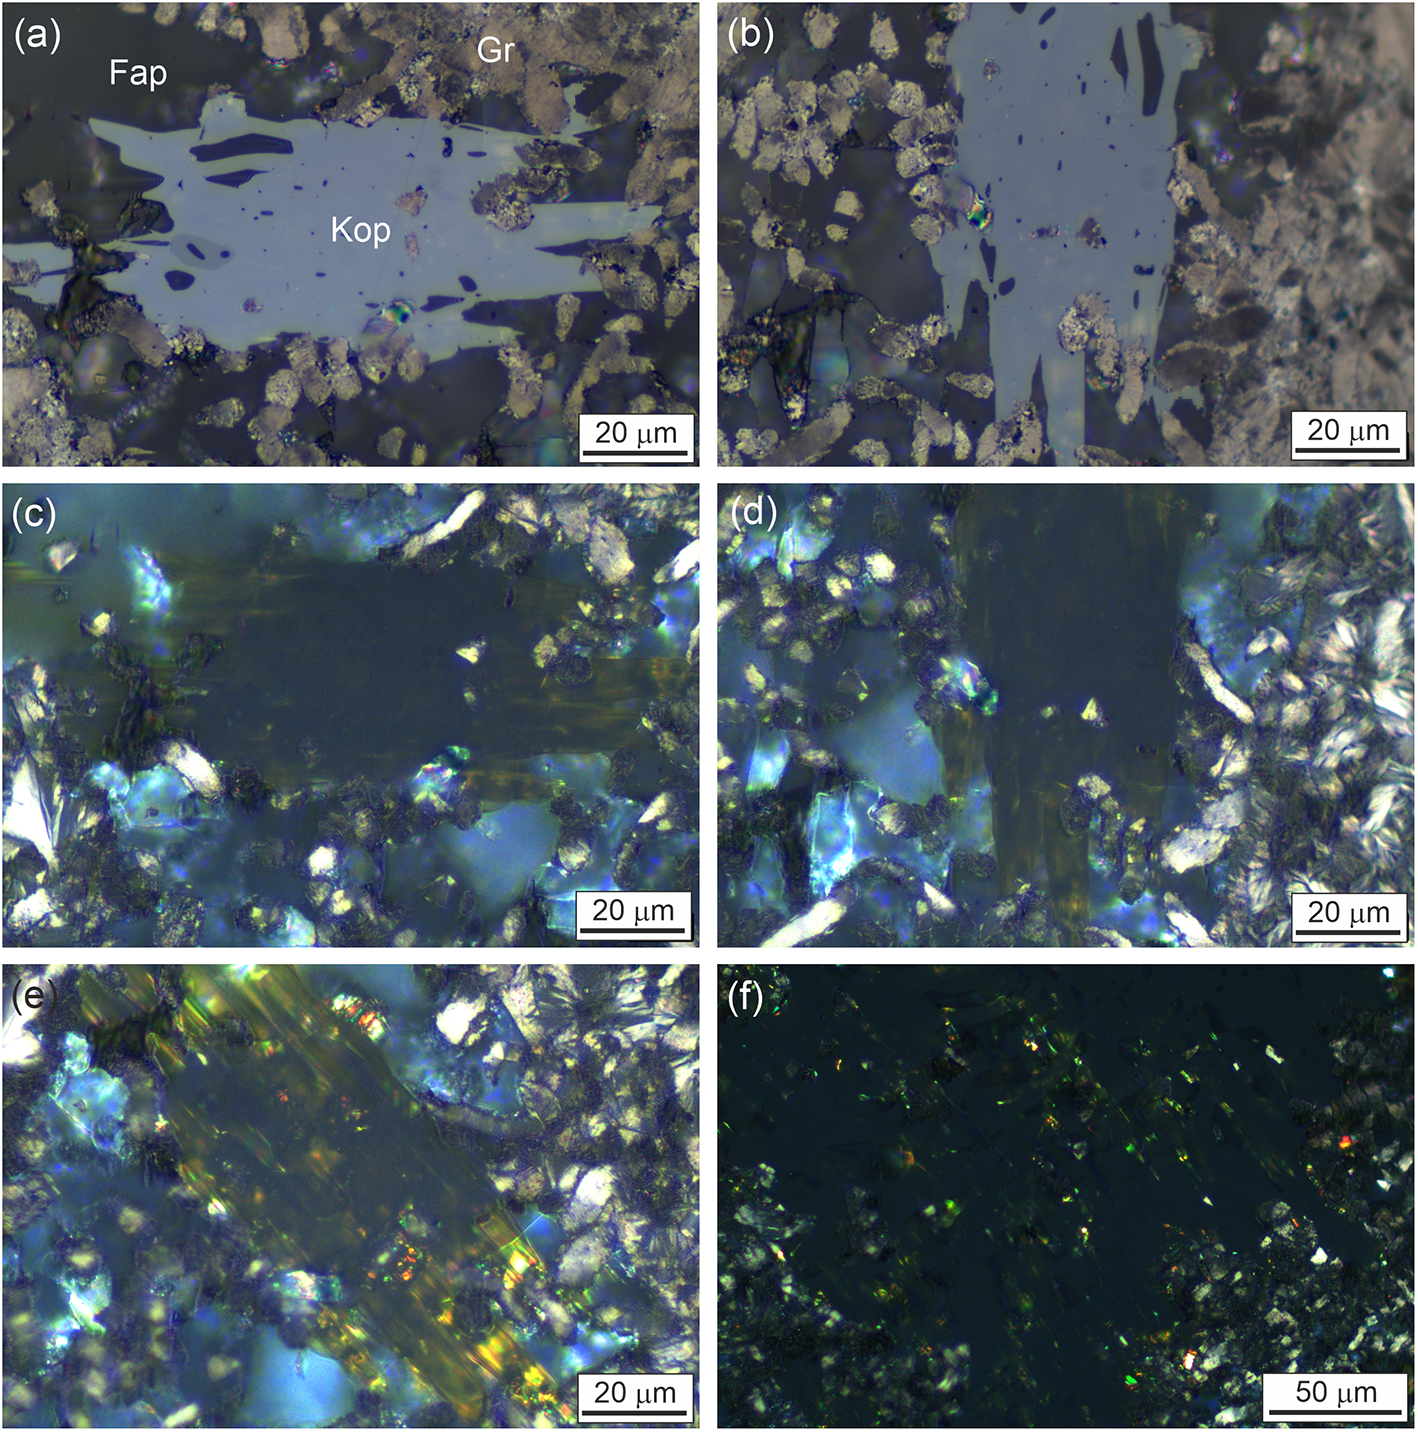
The colour of kopernikite changes from dark green in grain aggregates to yellow–green in thin grains, and the streak is light green (Fig. 2). The mineral has vitreous lustre and a hardness of ∼5.5 on the Mohs scale, as calculated from the microhardness VHN25 = 646(17) (mean 16), which equates to 609–693 kg/mm2. In reflected light, it appears grey. It is weakly anisotropic; a bluish tint is observed in some grains (Fig. 3). Kopernikite exhibits green internal reflections (Fig. 2f). Reflectivity varies between 13.75% and 20.7% (Table S2; Fig. S1). Due to the limited amount of material and the large number of fluorapatite inclusions, the density of kopernikite could not be determined experimentally and was calculated from the empirical formula and single-crystal X-ray diffraction (SC-XRD) data: d calc = 3.92 g·cm–3.
(a–e) Kopernikite grain shown in Fig. 1f, with a thickness of less than 10 μm. (a, b) In reflected light, kopernikite appears light grey perpendicular to Z and dark grey parallel to Z. (c–e) Images of kopernikite in cross-polarised and reflected light: parallel to Z (c), perpendicular to Z (d) and at 45° to Z (e). (f) A fragment of the thick grain shown in Fig. 1f in reflected and cross-polarised light is characterised by green reflections. Kop = kopernikite, Gr = graphite, Fap = fluorapatite (Warr, Reference Warr2021).
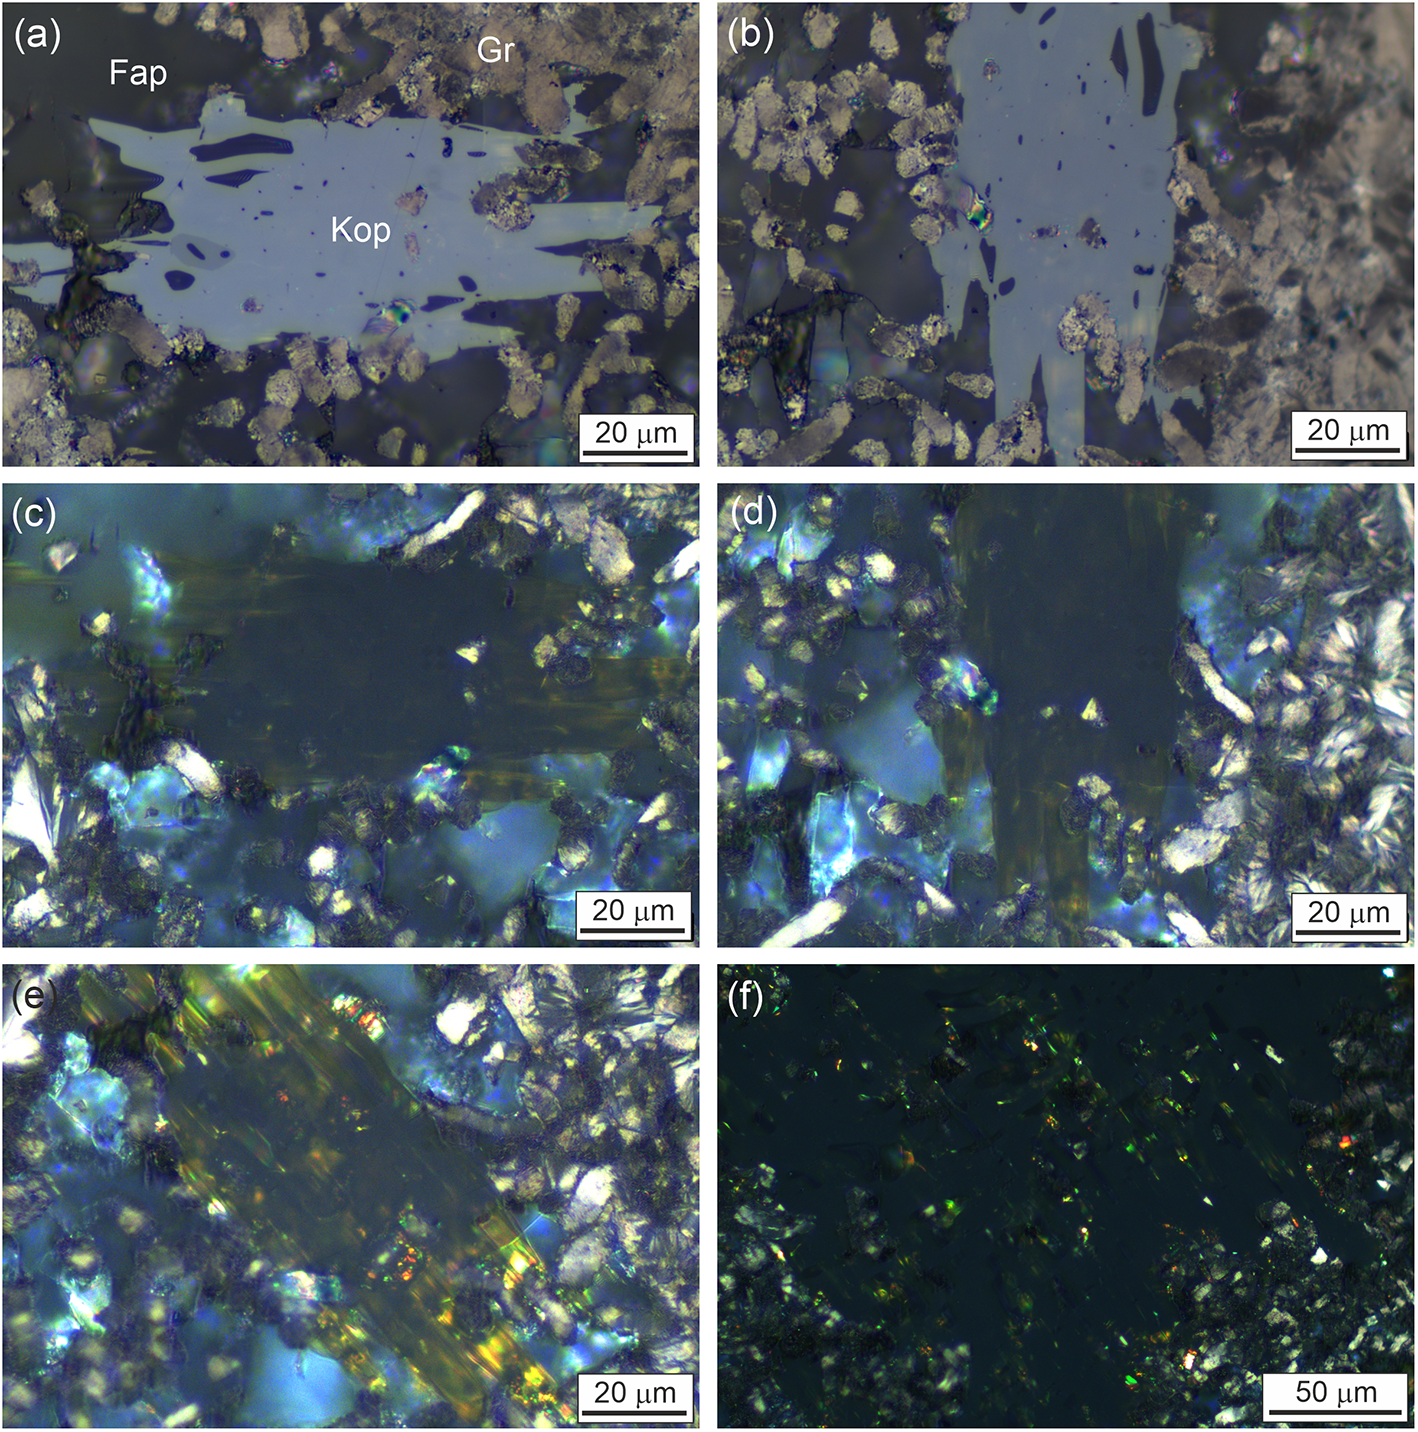
Figure 2 Long description
The image A shows a grey kopernikite grain in reflected light labelled 'Kop' alongside fluorapatite 'Fap' and graphite 'Gr'; the grain is about 120 micrometres in length. The image B shows a similar view of the kopernikite grain rotated parallel to Z and it is slightly darker grey. The image C shows the grain in cross-polarised light parallel to Z and image D shows the grain perpendicular to Z; both appearing similar in colour.. The image E shows the grain at 45 degrees to Z in reflected light where it has yellow reflections. The image F shows it in cross-polarised reflected light with green reflections just visible.
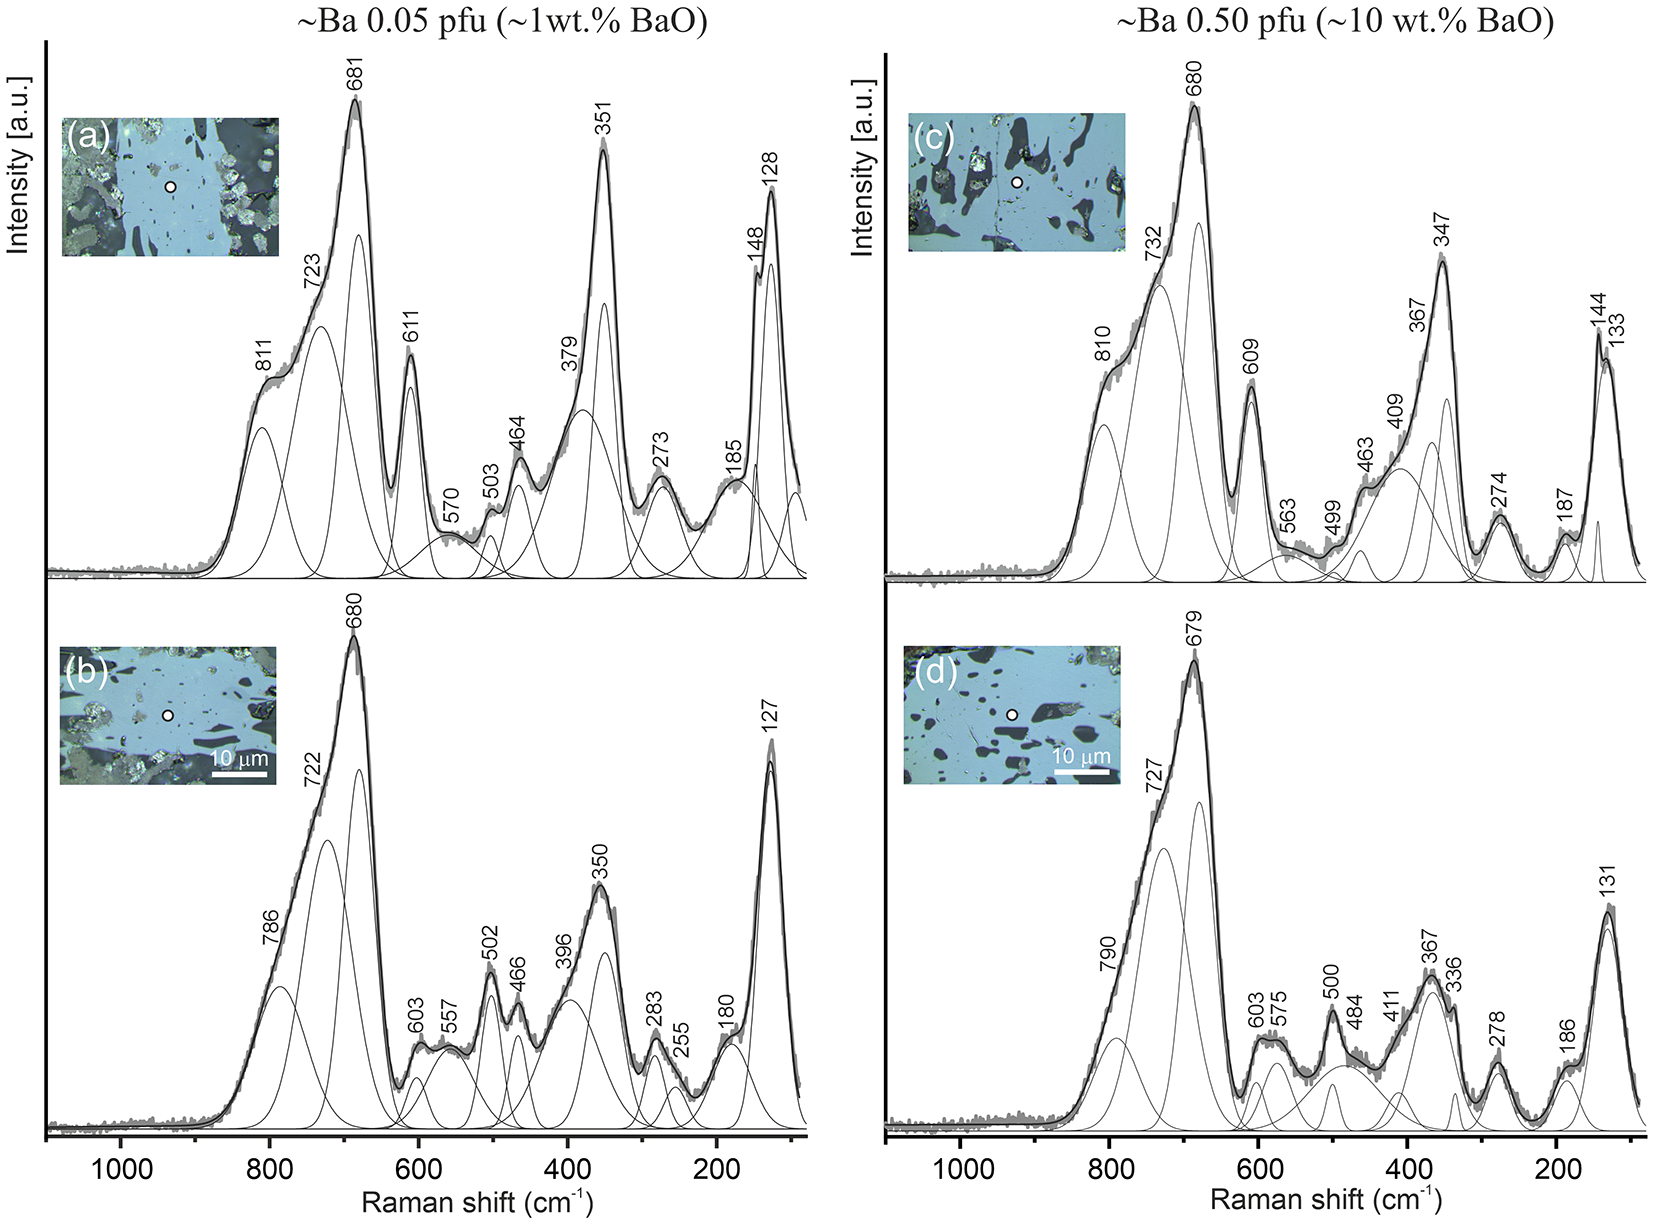
Raman spectra of low-Ba (a,b) and high-Ba kopernikite (c,d) in a cross-section sub-parallel to (001), showing two crystal positions. The insets show optical images with the measurement points. The laser beam is horizontally polarised.

Figure 3 Long description
The image shows four Raman spectra graphs of kopernikite with varying barium content. the optical image shows the crystal orientation. For the lower graphs it is rotated 90 degrees. The low Ba spectra and high Ba spectra are very similar for the same crystal orientation. In the upper images there is a shoulder at 811. When rotated 90 degrees the shoulder disappears for both high and low Ba. Other peaks also vary. See text for the full description and assignment of bands.
Raman spectroscopy
The Raman spectrum of kopernikite (Fig. 3) is similar to those of priderite, Cr-bearing priderite and its synthetic analogue (Ohsaka and Fujiki, Reference Ohsaka and Fujiki1982; Naemura et al., Reference Naemura, Shimizu, Svojtka and Hirajima2015; Butvina et al., Reference Butvina, Vorobey, Safonov, Varlamov, Bondarenko and Shapovalov2019; Konzett et al., Reference Konzett, Wirth, Hauzenberger and Whitehouse2013). The following main bands are evident in kopernikite spectra obtained from grains with variable Ba content (cm–1): 786–811 ν3(TiO6)8– and ν(O–Ti–O); 722–732 ν3(TiO6)8–; 679–681 ν1(TiO6)8–; 603–611 ν(Ti–O–Ti); 500–503 ν4(TiO6)8–; 350–357 ν2(TiO6)8–; 273–283 two-phonon mode; 180–187 ν(K–O) and 127–133 ν(Ba–O) (Ohsaka and Fujiki, Reference Ohsaka and Fujiki1982).
Structure of kopernikite
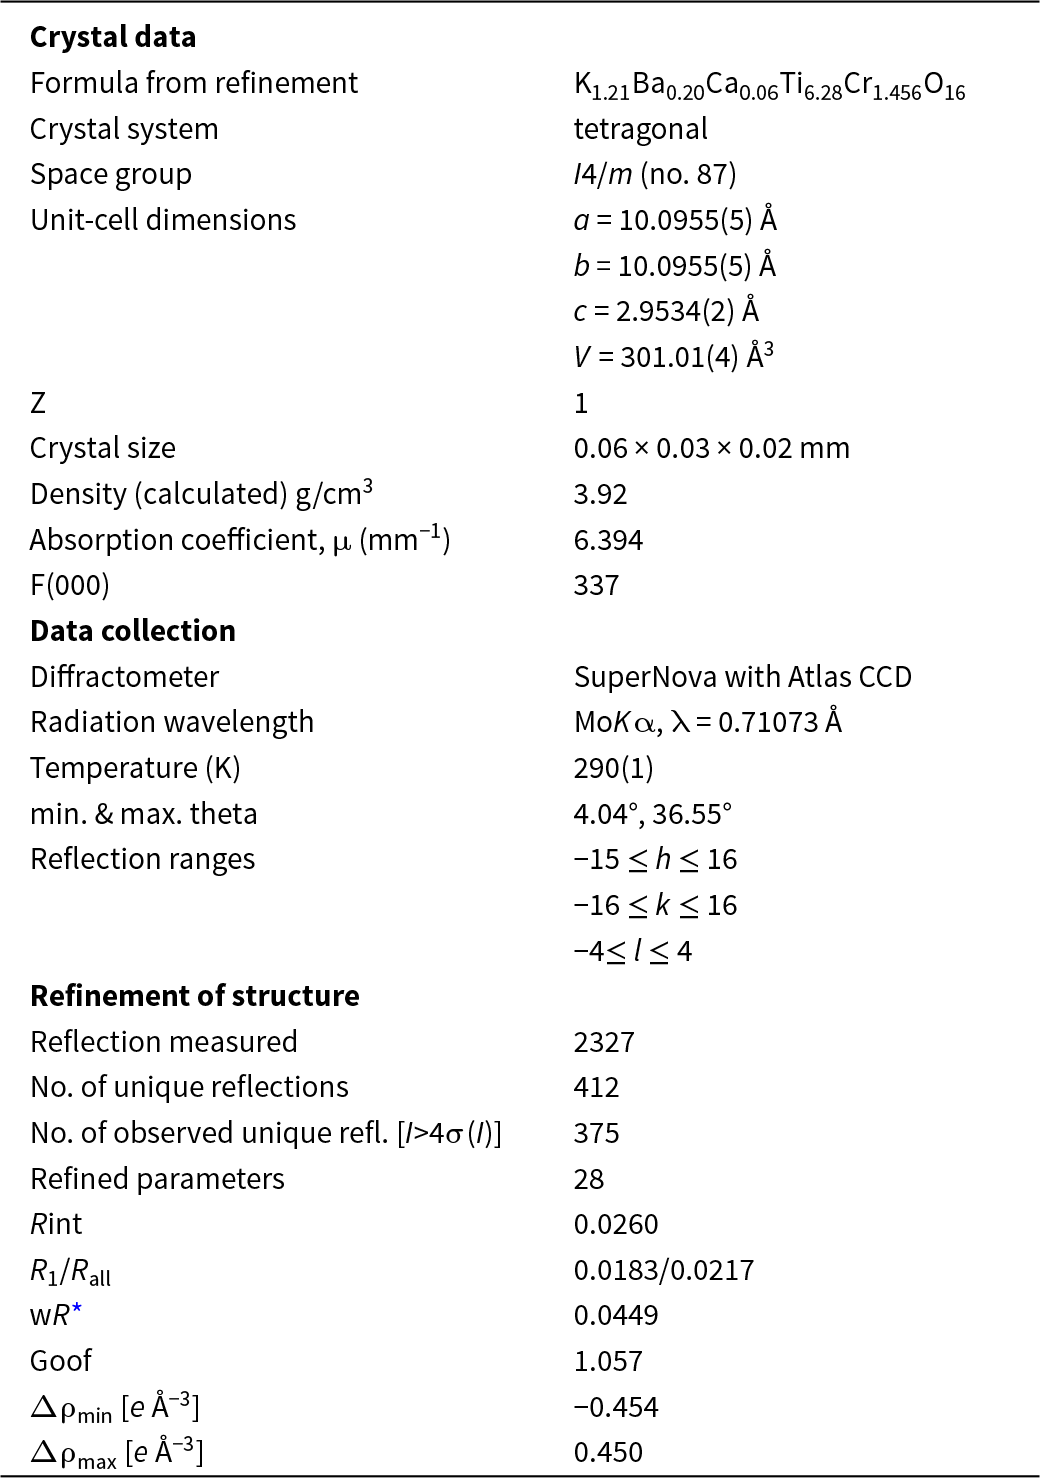
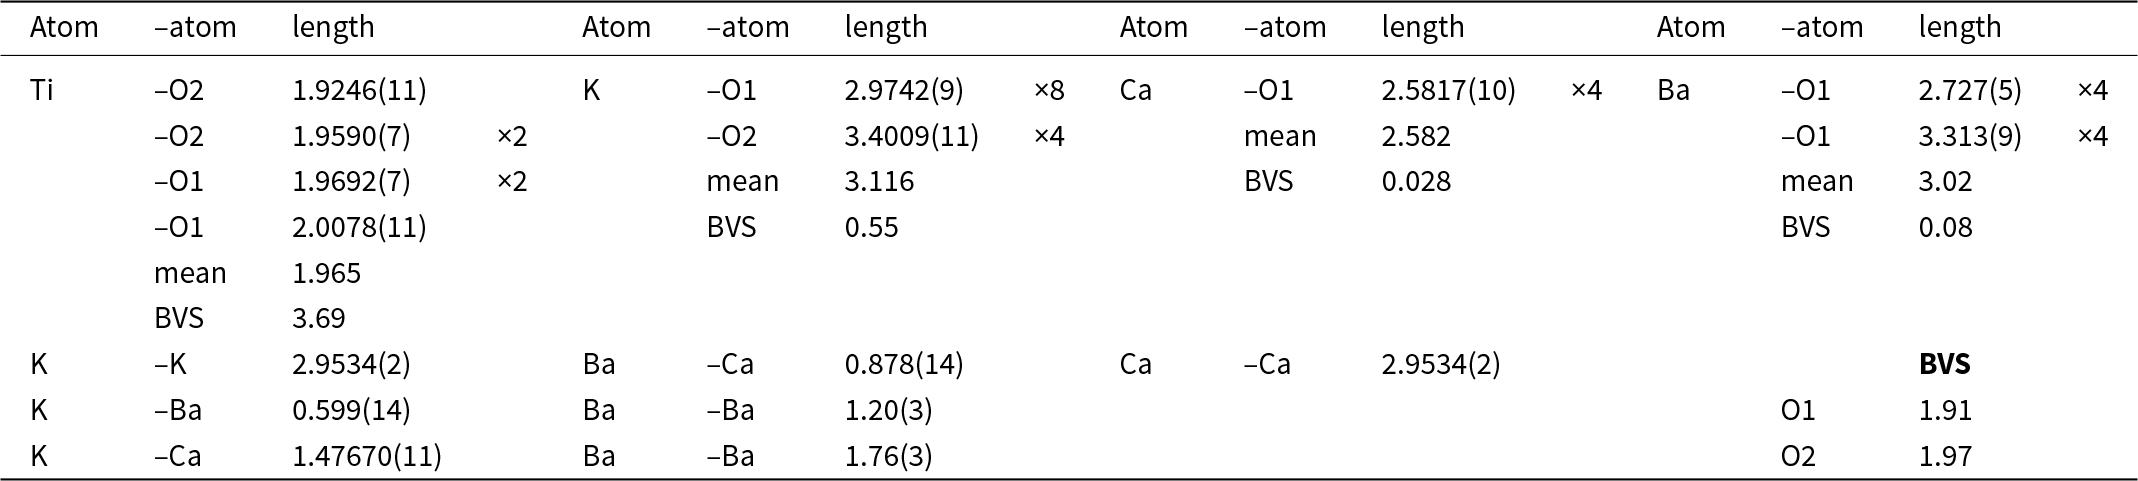
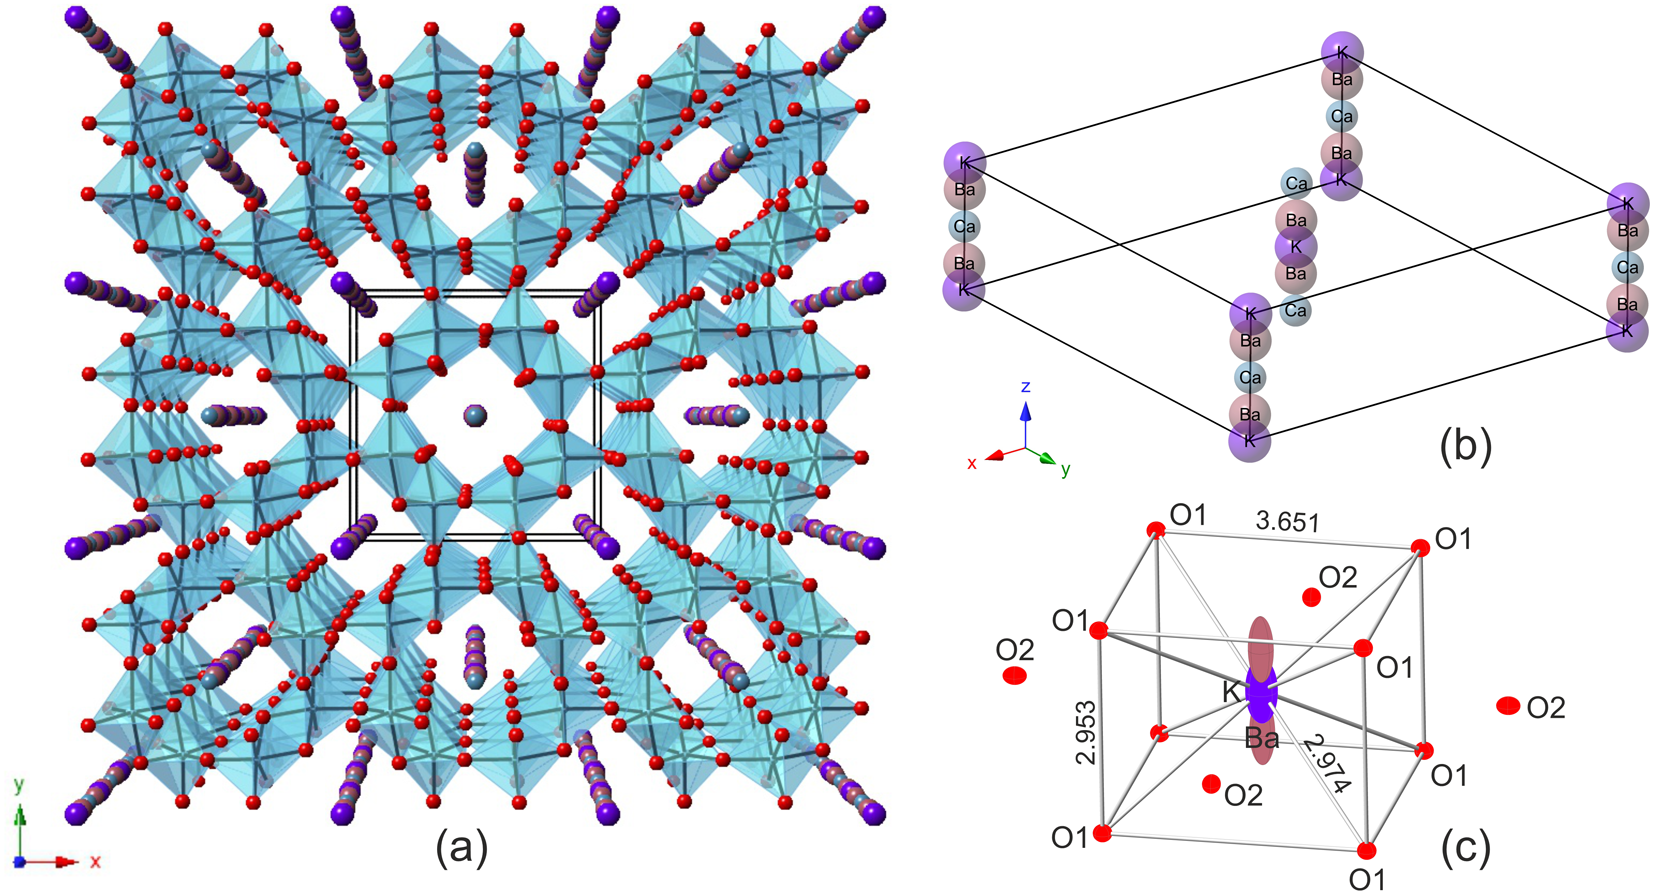
A fragment of grain (0.06 × 0.03 × 0.02 mm), shown in Fig. 1c, was used for the structural study. Its chemical composition is (K1.12Ba0.23Ca0.03Na0.03)Σ1.42(Ti4+6.48Cr3+1.46Fe2+0.01Al0.01)Σ7.96O16 (Table 1, analysis 3). The kopernikite structure (tetragonal, I4/m (# 87), a = 10.0955(5) Å, c = 2.9534(2) Å, V = 301.01(4) Å3) was refined to R 1 = 0.018 for 375 unique reflections with F > 4σF using SHELX-2019 (Sheldrick Reference Sheldrick2015). The crystal data, data collection information, and structure refinement details are given in Table 2. The atom coordinates, anisotropic displacement parameters and selected interatomic distances and bond valence sum (BVS) are provided in Tables 3, 4 and 5, respectively. The crystallographic information files have been deposited and are available as Supplementary material (see below). The SREF (Single Crystal Structure Refinement) formula derived from the refinement K1.21Ba0.20Ca0.06Ti6.28Cr1.456O16 (Table 2) is close to the chemical formula. The kopernikite structure is shown in Fig. 4a. The mean charge of the cations and the mean electronic density of the channel positions for the empirical formula are 0.84 and 17.64, respectively. For the SREF formula, these values are 0.86 and 17.70, respectively. At the octahedral site, Ti and Cr have very similar scattering factors. According to the microprobe data, the value of Cr is fixed at 0.182 (1.456 atoms per formula unit) and the Ti content was refined. The electron density of the octahedral position, calculated based on the of the empirical formula, is 22.25, which is in good agreement with the electron density obtained for this position by solving the structure, which is 21.64. The channel is occupied by K (0.605 apfu) and two additional positions with low occupancy: Ba (0.05) and Ca(0.03) (Fig. 4b). The Ba position was refined at the first stage as 0.047(19)Ba and then fixed. It is possible that there could be a small amount of K present at the Ba and Ca positions, and vice versa. Like other minerals in the priderite group, kopernikite has a 2×2 tunnel structure formed by columns of TiO6 octahedra linked by faces (Fig. 4a; Post et al., Reference Post, Von Dreele and Buseck1982). These octahedral columns are connected via corner-sharing to form channels with a square cross-section. This structure is similar to the rutile structure, which can be considered a 1×1 tunnel structure (columns of single octahedra) with a tunnel diameter of ∼2.8 Å (Pasero, Reference Pasero2005). In priderite, the tunnel walls are formed by columns of two octahedra (TiO6)8–, which define a tunnel diameter of ∼5 Å and allow large cations to enter.
Crystal data and structure refinement details for kopernikite
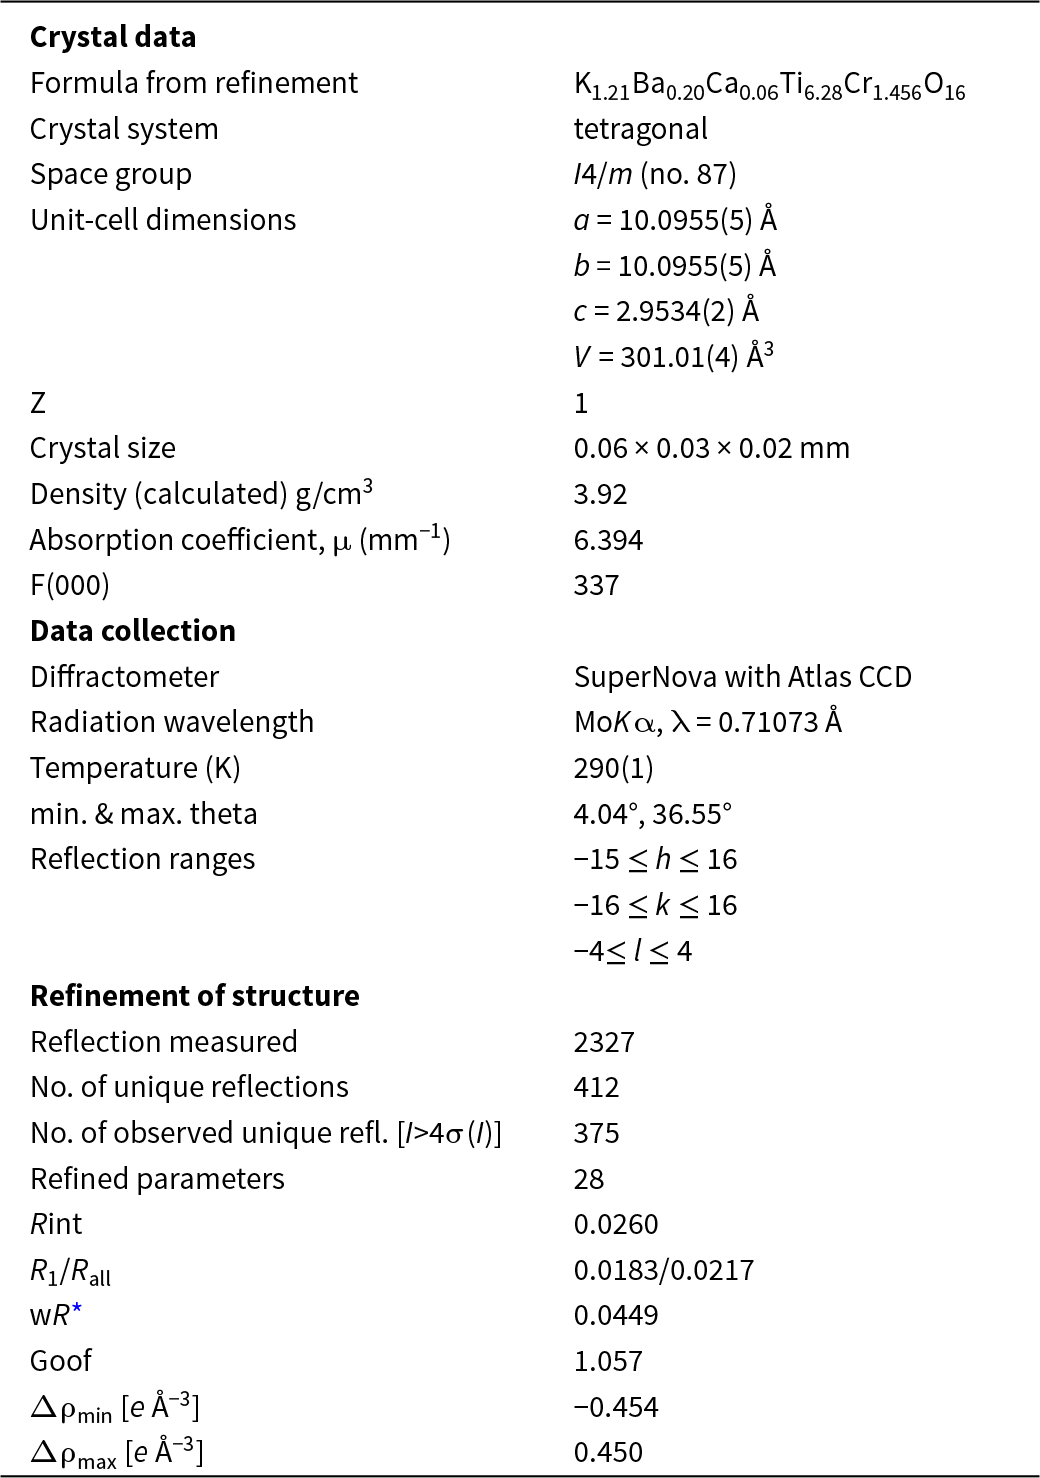
Table 2 Long description
The table provides detailed information on the crystal data and structure refinement of kopernikite. It has a tetragonal crystal system and belongs to the space group I4/m. The unit cell dimensions are approximately 10.10 by 10.10 by 2.95 angstroms, with a volume of 301.01 cubic angstroms. The calculated density is 3.92 grams per cubic centimetre, and the absorption coefficient is 6.394 per millimetre. Data collection was performed using a SuperNova diffractometer with Atlas CCD at a temperature of 290 Kelvin. The refinement process involved 2327 measured reflections, with 412 unique reflections and 375 observed unique reflections. The refinement resulted in an R1 value of 0.0183 and a weighted R value of 0.0449.
* Weighting scheme: w = 1/[σ2(F o2)+ (0.0254P)2 + 0.0973p], where P = (F o2 + 2F c2)/3
Atomic coordinates, equivalent-isotropic displacement parameters (Å2) and site occupancy (Occ.) for kopernikite

Table 3 Long description
The table provides atomic coordinates, equivalent isotropic displacement parameters, and site occupancy for kopernikite. In order: Site x y z Ueq/Uiso* Site Occ. the values are: Ti 0.85036(2) 0.33250(3) 0 0.00682(8) Ti0.785(4)Cr0.182; O1 0.65478(10) 0.29643(10) 0 0.0071(2) 1; O2 0.04099(11) 0.33437(11) 0 0.0084(2) 1; Ba 0 0 0.203(5) 0.041(5) 0.05; K 0 0 0 0.045(2) 0.607(9); Ca 0 0 0.5 0.08(3)* 0.030(9).
Anisotropic displacement parameters (Å2)

Table 4 Long description
The table presents anisotropic displacement parameters for different atomic sites. In order Site U11 U22 U33 U23 U13 U12, the values are: Ti 0.00714(12) 0.00787(12) 0.00544(12) 0 0 −0.00095(8); O1 0.0074(4) 0.0074(4) 0.0064(4) 0 0 0.0000(3); O2 0.0069(4) 0.0115(5) 0.0067(4) 0 0 0.0000(3); Ba 0.0126(16) 0.0126(16) 0.097(14) 0 0 0; K 0.0207(9) 0.0207(9) 0.094(7) 0 0 0.
Selected bond lengths (Å), occupation and BVS* calculation for kopernikite
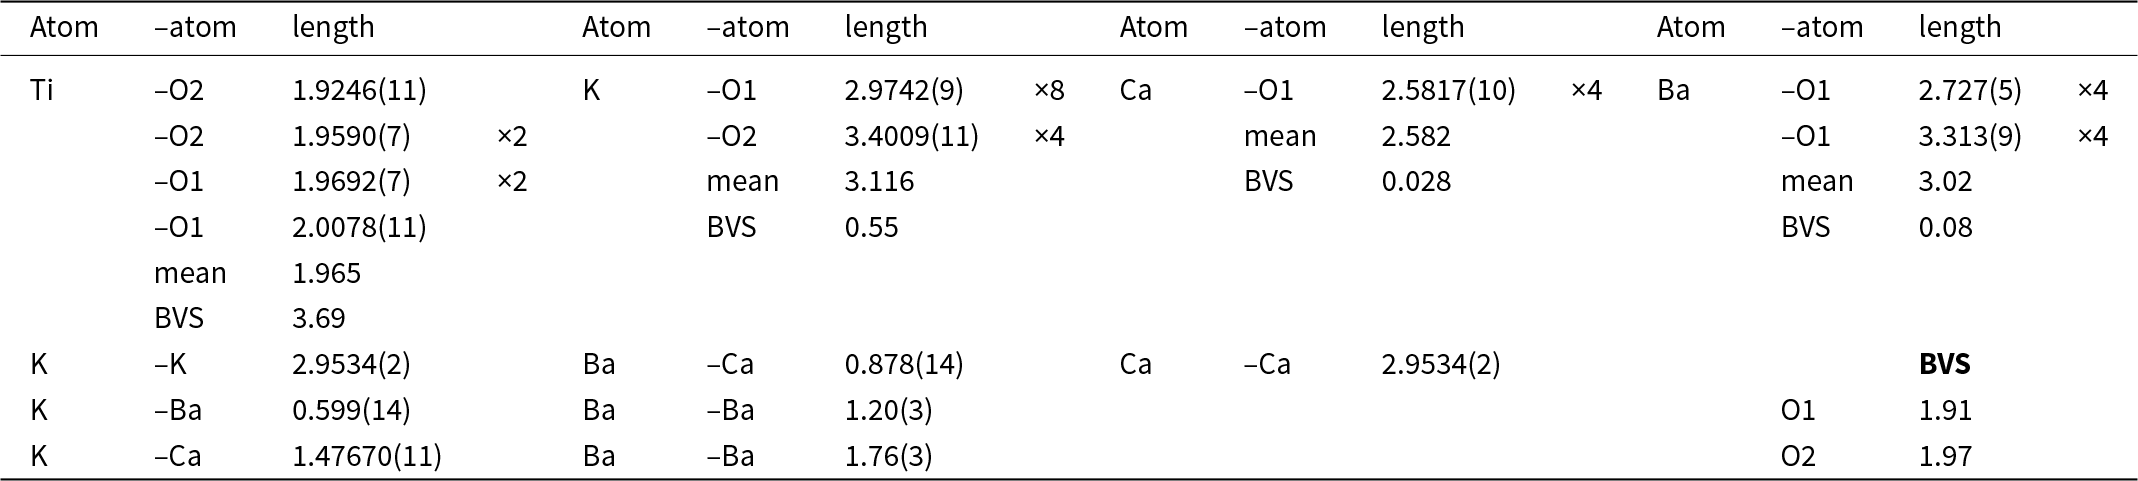
Table 5 Long description
The table presents selected bond lengths in angstroms, occupation numbers, and bond valence sum calculations for kopernikite. Titanium shows the shortest mean bond length of 1.965 angstroms. Potassium exhibits the highest bond valence sum of 3.69. Calcium and barium have similar mean bond lengths with oxygen, around 2.58 and 2.72 angstroms respectively, but their bond valence sums are much lower.
* BVS calculated on the basis our crystallographic information file (CIF) using the ECoN21 program (Ilinca, Reference Ilinca2022).
The mean distance М–О at the octahedral sites is 1.965 Å and the BVS for these sites is 3.69 valence units (vu) (Table 5). This is very consistent with both the empirical data [(Ti4+6.48Cr3+1.46Fe2+0.01Al0.01)/8]3.79+ and the theoretical distance М–О = 1.967 Å, which was calculated based on ionic radii (Shannon, Reference Shannon1976). The K-site in the channel is located at the tetragonal prism coordinated by the oxygens O1 (Fig. 4c). The distances K–О1 = 2.974 Å are longer than the theoretical distances K–О = 2.89Å for potassium at coordination 8 (Shannon, Reference Shannon1976). O2, which is located at a distance of 3.40 Å, exerts little control over the K site. Therefore, the coordination of the K site can be considered as 8+4 (Table 4c). The weakly occupied Ba sites are shifted from the centre of the tetragonal prism by 0.617 Å (Fig. 4c); this could reflect the motion trajectory (vibrations) of potassium along the channel. Due to their close proximity, the K, Ba and Ca sites cannot be occupied simultaneously (Fig. 4b).
(a) The kopernikite tunnel structure projected along the [001] axis. Pairs of edge-sharing (TiO6)8– octahedra form columns parallel to the [001] which in turn share corners to form square tunnels which run through the structure. (b) The larger cations (K, Ba) shown as circles occupy eight coordinated sites within the tunnels. (c) The local environments of the K- and Ba-sites: the K-site is at the centre of a tetragonal prism, coordinated by the oxygens O1, while the Ba-site is shifted from the centre by 0.62 Å. Cation sites are shown as thermal ellipsoids. Four O2 atoms are located 3.4 Å distance from the K-site, determining the coordination of the site as 8+4.

Figure 4 Long description
Three structural diagrams of a mineral framework are shown. Panel (a) presents a crystal framework with connected titanium-oxygen octahedra arranged in columns, forming a tunnel structure. Panel (b) highlights potassium and barium ion positions located inside these channels as circular markers. Panel (c) focusses on the coordination geometry around the potassium and barium sites, showing the potassium position centred within a prism-like oxygen arrangement, while the barium position is slightly displaced. Additional oxygen atoms surround the potassium site.
As kopernikite occurs in such tiny amounts, it was not possible to collect powder X-ray diffraction data. However, this could be more reliably calculated from the results of SC-XRD (Table S3).
Discussion
Particularities of crystal chemistry of kopernikite
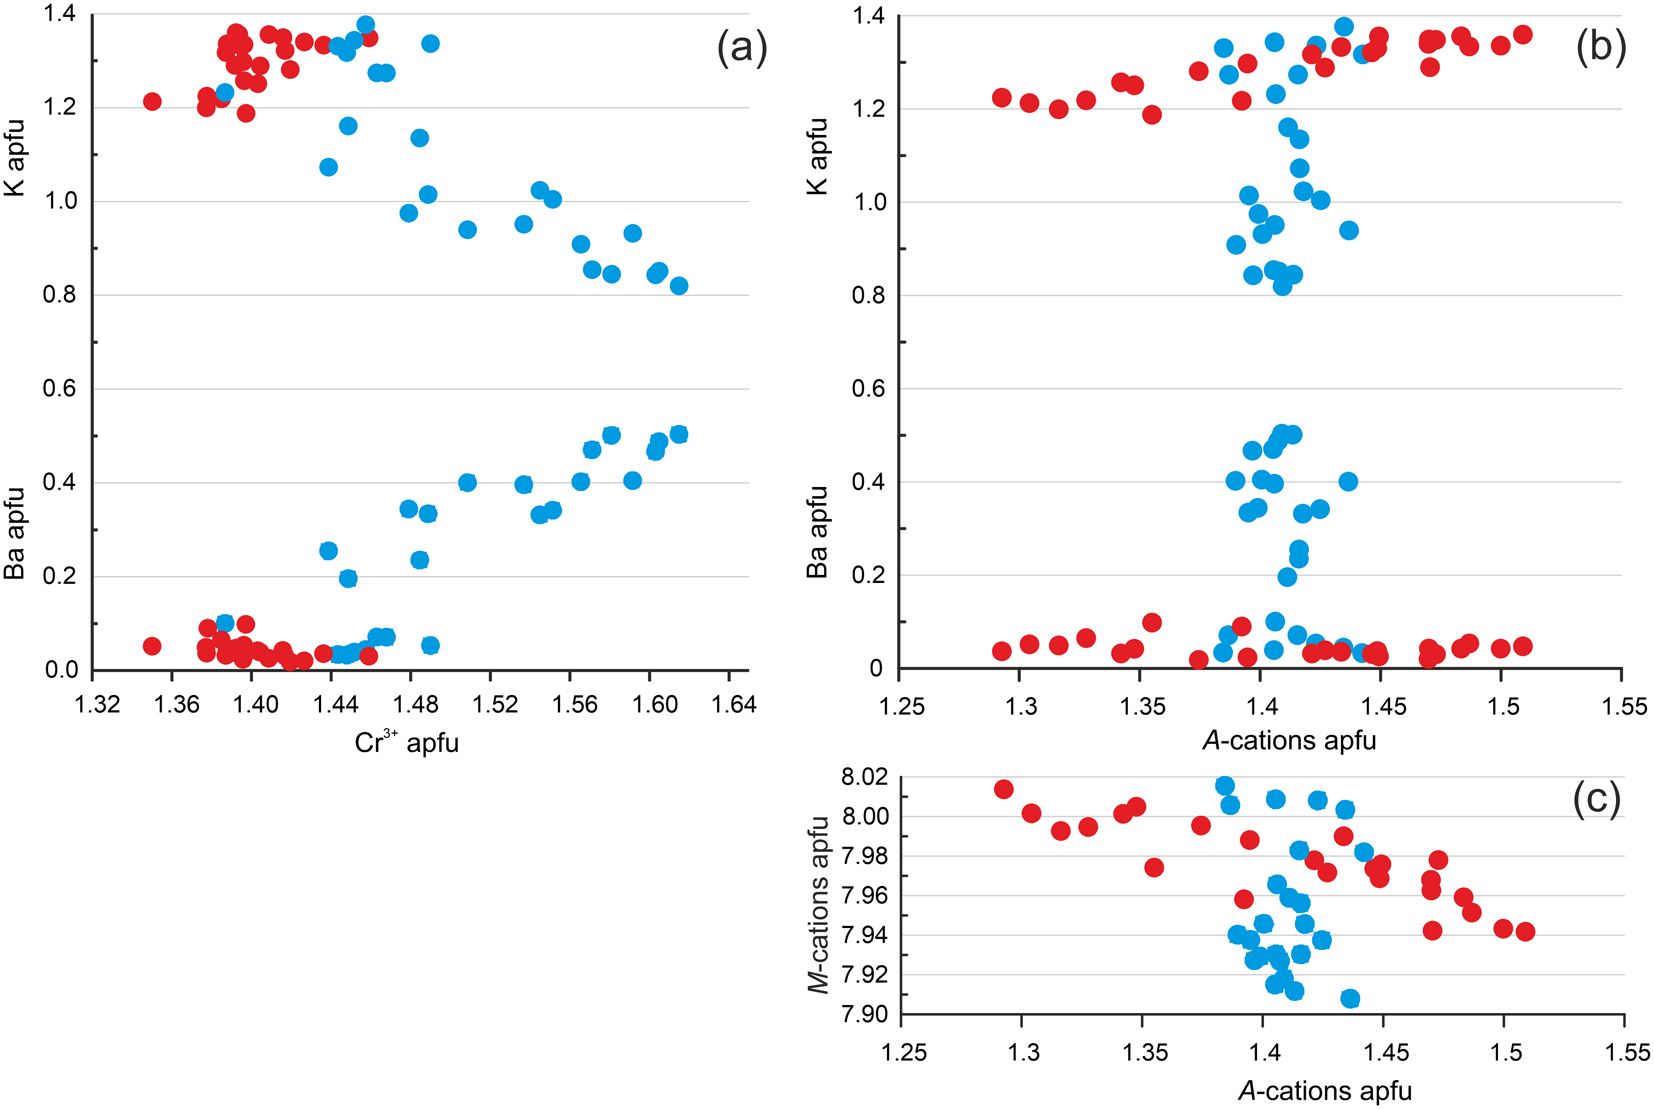
The mean results of the microprobe analyses of kopernikite performed on grains shown in Figs 1d and 1e are given in Table 1, whereas the results of the point microprobe analyses were used for the diagram construction (Fig. 5). A positive correlation between Ba vs Cr and negative correlation for K vs Cr are observed; that reflects an increased content of redledgeite, Ba(Ti6Cr3+2)O16 end-member in kopernikite with higher Ba content (Fig. 5a). The calculation of the chemical analyses of kopernikite on 16 oxygens is usually accompanied by the manifestation of negligible deficit of the octahedral cations (Table 1, Fig. 5c). It can be assumed that a minor part of these cations has a lower valence. The deficit for the octahedral cations is eliminated when the calculation of the crystal chemical formulas at ∼2–3% of Ti has valence 3+ (Table 1). Taking into consideration the reduced conditions of the primary minerals formation in the Morasko meteorite, an appearance of a minor amount of Ti3+ in the composition of kopernikite is conceivable but has practically no affect on the increase of the M–O distance.
Points of kopernikite microprobe analyses in diagrams Cr3+ vs Ba and K apfu (a), A-cations – Ba and K apfu (b) and A-cations (c) – M-cations apfu. Analyses of homogeneous low-Ba grains (Fig. 1d) are shown by red circles, analyses of inhomogeneous grains (Fig. 1e) are shown by blue circles.

Figure 5 Long description
The image consists of three diagrams labelled (a), (b) and (c). Graph (a) shows a graph of Cr apfu versus Ba apfu and above it versus K apfu. Broadly the Cr apfu increases with Ba apfu, and decreases versus K apfu. Diagram (b) displays a graph of A-cations apfu versus Ba apfu and also versus K apfu. For both K and Ba the A-cations pfu remains the same for inhomogeneous samples (where Ba and K apfu varies). Graph (c) shows A-cations versus M-cations apfu. For the blue data points for inhomogeneous samples the M-cations apfu varies but the A cations apfu remains similar.
It cannot be ruled out that insignificant deficit of the octahedral cations as well as relatively high contents of the channel cations in the composition of kopernikite are connected with artefacts appearing during microprobe experiments conditioned on a grain orientation, high potassium mobility in the channel sites, tunnel electronic effects etc. Totals of the channel cations in the analyses within the inhomogeneous grain with increased Ba content are in the range 1.39–1.44 apfu, whereas analyses of the homogenous grain with the low Ba content have totals of the channel cations within 1.28–1.51 apfu (Fig. 5b,c). It might be that a concentration increase of Ba at the channels makes diffusion of K more difficult, which results in more stable results of the K measurements on a microprobe analyser.
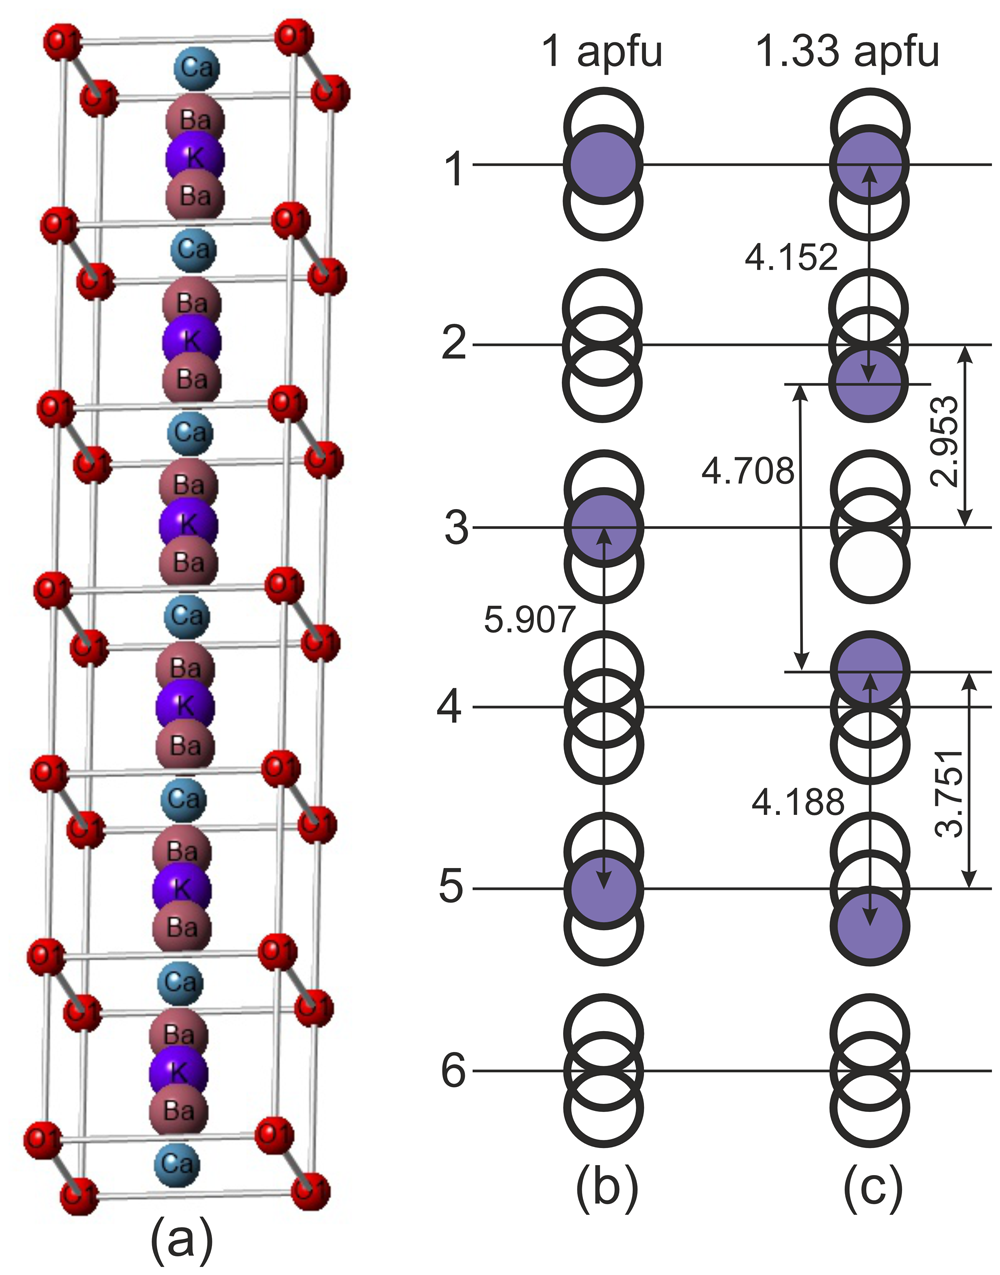
The theoretically maximum possible amount of the channel cations in the structure of the hollandite type at normal pressure could not be higher than 1.33 apfu, that is explained in Fig. 6 (Sinclair et al., Reference Sinclair, McLaughlin and Ringwood1980; Biagioni et al., Reference Biagioni, Capalbo and Pasero2013). The sum of the kopernikite channel cations changes within 1.28–1.51 apfu with the mean value of ∼1.42 apfu. In the published analyses of the ‘Cr-priderite’ from ultrabasic rocks the channel sites occupation varies in the range 1.15–1.75 apfu, here most of the values are higher than 1.4 apfu (Table S4). The filling of the channel sites in K-bearing minerals of the priderite group depends on pressure. So there can be domains with different occupation of the channel sites in the minerals. In synthetic high-temperature and high-pressure hollandite with the composition K2Cr8O16, K2V8O16 and K2Ti8O16 the potassium sites are completely filled with the distance K–K ≈ 2.9Å (Tamada et al., Reference Tamada, Yamamoto, Mori and Endo1996; Komarek et al., Reference Komarek, Isobe, Hemberger, Meier, Lorenz, Trots, Cervellino, Fernández-Díaz, Ueda and Braden2011).
(a) Schematic drawing of the channel in the kopernikite structure containing a few unit cells, showing cation sites with partial occupancy. In (b and c) possible variants of site occupation are shown. The Ba-site is responsible for the phenomenon of K-site splitting; Ca-sites are not shown, unshaded balls are vacancies. (b) Maximum possible 50% occupation of the non-splitting K-sites corresponding to 1 apfu. (c) Possible 66.6% occupation of the channel sites taking into account the shifting of the cation from the central position corresponding to 1.33 apfu. At increasing pressure, the variant with a K–K distance = 3.751 Å can be realised (see Fig. 6c), that can then cause an increase of the channel occupation filling. The idea of Fig. 6b and c for the six unit cells is adopted from Sinclair et al. (Reference Sinclair, McLaughlin and Ringwood1980).

Figure 6 Long description
The image consists of three diagrams labelled (a), (b) and (c). Diagram (a) shows the vertical arrangement of each unit cell with the atoms arranged Ca, Ba, K, Ba, in each unit cell. Diagram (b) displays just the Ba and K atoms as a series of circles with a label ‘1 apfu’ at the top. Filled atoms are Ba or K, empty circles are vacancies. Diagram (c) is similar to (b) but labelled ‘1.33 apfu’ . The atomic positions in column b or column c give different bond distances. Column b shows 5.907 angstroms between two unit cells for 50% occupation. Column c. shows maximum 66% occupation possible by arranging the filled sites at distances of 4.152 and 4.708 and 4.188 angstroms from each other, with 2.953, and 3.751 angstroms for the unit cell. This shows how a K-K bond distance of 3.751 angstroms can occur.
The minimum K–K distance in minerals formed in terrestrial conditions is in the range 3.4–4 Å, determined by the ionic radii of potassium which vary in the range of 1.34–1.82 Å depending on the coordination (Shannon, Reference Shannon1976; Hawthorne and Gagné, Reference Hawthorne and Gagné2024). In jeppeite, K2Ti6O13, the minimum distance K–K in the channels is equal to 3.82 Å (Cid-Dresdner and Buerger, Reference Cid-Dresdner and Buerger1962). Taking into consideration that K–K distance, a simple calculation 2.953/3.82 = 0.77 shows that a maximum amount of the channel cations in the kopernikite formula may be ∼1.54 apfu.
Therefore, an increasing amount of channel cations in kopernikite, compared to the maximum value accepted for minerals of the priderite group (equal to 1.33 apfu, Biagioni et al., Reference Biagioni, Capalbo and Pasero2013), can be connected with the conditions of formation (higher pressure), in addition to the dynamic behaviour of potassium in the channels causing the analytical results to have some artefacts from the use of the microprobe.
Genesis of kopernikite
Kopernikite was discovered in the Morasko iron meteorite, which belongs to the ‘non-magmatic’ IAB-MG type (Willis, Reference Willis1981; Wasson and Kallemeyn, Reference Wasson and Kallemeyn2002; Hilton and Walker, Reference Hilton and Walker2020). The presence of silicate inclusions and graphite in this meteorite may indicate impact melting involving material contamination and incomplete differentiation of a melt (Benedix et al., Reference Benedix, McCoy, Keil and Love2000). This is reflected in the formation of mixed mineral aggregates with contrasting compositions (Wasson and Kallemeyn, Reference Wasson and Kallemeyn2002). The formation of oval troilite nodules in the iron matrix of the Morasko meteorite is the result of the melt liquation. As a consequence of this process, elements incompatible with iron accumulate in the melting sulfide nodules. Graphite begins to crystallise first in these enclaves. At this time, a small amount of carbon takes part in the formations of the cohenite zone on the boundary with iron. Cooling of the sulfide melt is accompanied by the formation of a schreibersite zone in place of cohenite. The segregation of graphite crystals in the sulfide melt leads to the formation of irregular zones of deformed graphite partly cemented by troilite, usually confined to the outer parts of the nodules (Fig. 1a, Karwowski et al., Reference Karwowski, Kusz, Muszyński, Kryza, Sitarz and Galuskin2015; Galuskin et al., Reference Galuskin, Muszyński, Panikorovskii, Kusz, Książek, Galuskina, Zieliński and Prusik2026). Inclusions of relatively large silicate and phosphate aggregates and separate crystals are usually located inside the graphite zones or on their boundary with troilite. The relationships between the various minerals in the troilite–graphite nodules of the Morasko iron meteorite suggest that their formation was a multi-stage process involving a period of partial melting and recrystallization of the primary phases. A reconstruction of the mechanisms and conditions of non-metallic minerals growth in the Morasko meteorite requires additional investigations, and at present, we can only speak in general terms about the mechanisms and conditions of kopernikite crystallization. The formation of kopernikite and fluorapatite aggregates is related to phosphate melt drops that were captured within a graphite layer that was locally enriched with elements that are incompatible with fluorapatite, such as K, Ba, Cr and Ti. This provided kopernikite crystallization at a temperature of ∼1000°C, which is characteristic of the formation of fluorapatite and other phosphates in the Morasko meteorite nodules (Karwowski et al., Reference Karwowski, Kusz, Muszyński, Kryza, Sitarz and Galuskin2015, Reference Karwowski, Kryza, Muszyński, Kusz, Helios, Drożdżewski and Galuskin2016).
Supplementary material
The supplementary material for this article can be found at https://doi.org/10.1180/mgm.2026.10230.
Acknowledgements
The authors would like to thank Valentina G. Butvina, Peter Leverett, and an anonymous reviewer for their comments and suggestions that improved the previous version of the manuscript.
Competing interests
The authors declare none.




 Open access

