

1. INTRODUCTION
Water ice is commonly subject to cyclic loading owing, for instance, to vehicles traversing ‘ice pavements’ and to wave/tidal action under the ice cover of oceans on Earth and on icy satellites. An important question is how cyclic loading affects the strength of the ice.
In this paper we report that the flexural strength of plates of columnar-grained, freshwater ice loaded normal to the long axis of the grains may be increased by about a factor of two upon subjecting the material to cycles of fully reversed, up/down bending. This behavior is rather surprising for it appears to contradict two earlier reports of cyclic weakening (Nixon and Smith, Reference Nixon and Smith1987; Haynes and others, Reference Haynes, Kerr and Martinson1993). In one case (Nixon and Smith, Reference Nixon and Smith1987) the fatigue strength of freshwater granular ice that was cycled as a rotating beam at a frequency of 2.8 Hz at temperature from −7 to −30°C decreased by as much as a factor of two upon increasing the number of cycles from ~103 to 106; and in the other case (Haynes and others, Reference Haynes, Kerr and Martinson1993) the flexural strength of the same kind of ice that we studied, but in the form of a thin plate floating on water, also decreased by as much as a factor of two upon subjecting the material at −1°C to oscillatory loading beyond a threshold number of cycles at a frequency of 15–21.5 Hz. An earlier claim of cyclic strengthening (Kermani and Farzaneh, Reference Kermani and Farzaneh2009) stemmed from experiments on atmospheric ice deposited at −6°C: following numerous cycles of reversed flexing at the same temperature but at a lower frequency of 0.3 Hz, the flexural strength was measured to be 2.68 ± 0.57 MPa compared with a static strength of 2.54 ± 0.35 MPa. We question that claim because the difference in strength is statistically insignificant. Of greater relevance is the increase by up to a factor of two of the tensile strength of cylindrical bars of freshwater granular ice upon reversed, push-pull loading at −10°C at a frequency of 0.1 Hz (Cole, Reference Cole1990).
In the sections to follow, we describe our observations, discuss the apparent contradiction noted above and then offer a tentative hypothesis to account for strengthening.
2. EXPERIMENTAL PROCEDURE
The ice we studied was produced in the laboratory. Tap water was frozen unidirectionally, top down, in the manner described elsewhere (Iliescu and Schulson, Reference Iliescu and Schulson2002). This procedure produced bubble-free, columnar-grained ice that possessed the S2 growth texture in which the c-axes were confined more or less to the horizontal plane of the ice, but randomly oriented within that plane. The average column diameter was 5.5 ± 1.3 mm and the length exceeded 50 mm. From such material we cut and then milled thin plates of dimensions ~13 mm in thickness (parallel to the long axis of the grains), ~75 mm in width and ~300 mm in length. We flexed the plates up and down under 4-point loading, using a servo-hydraulic loading system to which we attached special apparatus designed and built on site and as shown in Figure 1. The distance L between the outer pair of loading cylinders was set by the geometry of the apparatus to be L = 254 mm; the spacing between the inner pair was 127 mm; the diameter of the cylinders was 12.7 mm. To minimize contact stresses two precautions were taken: flats, 3.2 mm in width, were machined along the length of the loading cylinders; and the wing nuts (shown in Fig. 1) were adjusted just enough to allow contact between the cylinders and the ice, but never tightened. The loading induced bending stresses, both tensile and compressive that acted in the across-column direction. Owing to the confining influence of the loading cylinders and to the Poisson effect, the plates were effectively stressed biaxially: the minor stress, when calculated using isotropic elasticity and plasticity theories, was estimated to be between one-third and one-half of the major stress. The experiments were performed in a cold room set at −10°C, at an outer-fiber stress rate of ~1 MPa s−1.
Photograph showing the 4-point bending apparatus connected to an MTS hydraulic testing system. The upper part is attached to the frame of the machine while the mobile middle part is attached through a fatigue-rated load cell to the piston. (Scale: the length of the apparatus is 275 mm.) The apparatus was made from an aluminum alloy; the loading cylinders were made from a stainless steel. The ice in the apparatus was bent in one direction until it failed without cycling. Note that fracture occurred between the inner pair of loading cylinders.
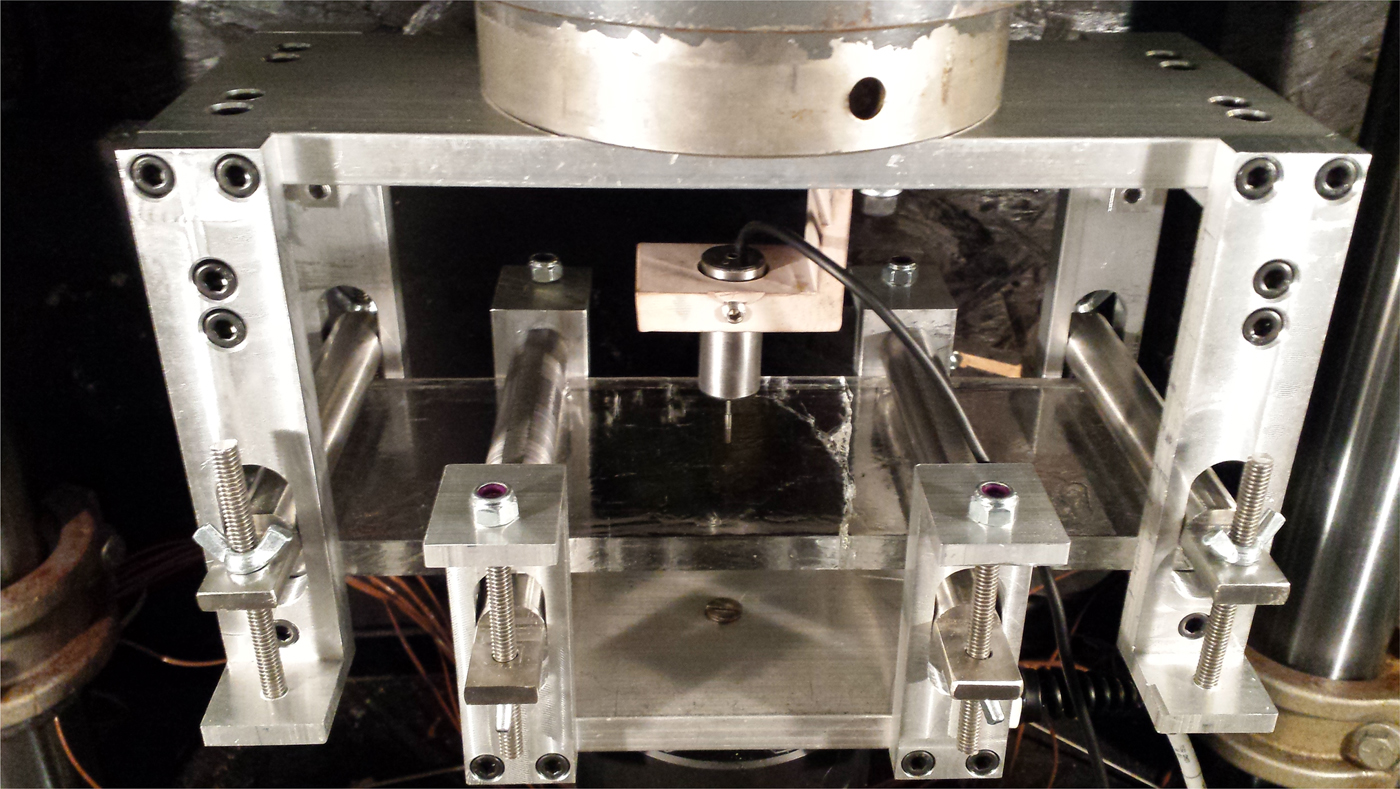
In performing the experiments, the hydraulic actuator was displaced symmetrically under displacement control with respect to the neutral axis of the plate, at a rate of 0.1 mm s−1. The resulting displacement of the top surface of the plate was measured using a calibrated LVDT gauge (shown in Fig. 1). The actuator's travel was load-limited in both directions (up and down) by an imposed load-limit that corresponded to the desired outer-fiber maximum stress. More specifically, loading was controlled using a FlexTest-40 controller that allowed the actuator, before changing its direction of motion, to slow down momentarily as the load approached the prescribed limit. In other words, the actuator was displaced at the prescribed rate until the load-limit was reached at which point displacement was reversed at the same rate. The cycle period was of the order of 10 s, but varied between 7 s and 14 s, depending on the load-limit; higher loads took longer to reach. The cycle period corresponds to a relatively low driving frequency of the order of 0.1 Hz.
We cycled reversibly in one of two ways, either (i) by cycling for ~150 times at four levels of progressively higher stress amplitude, from ~±1.30 to ~±2.3 MPa, followed by a final increase to ±2.40 ± 0.20 MPa where the ice was cycled for up to several thousand times or (ii) by cycling under a constant stress amplitude of ±1.45 ± 0.08 MPa. Table 1 lists the total number of cycles that were imparted. At the end of this process, the ice was bent monotonically one last time and in one direction until it fractured, under the same displacement rate of 0.1 mm s−1. Fracture generally occurred between the inner pair of loading cylinders, as shown in Figure 1; in the few cases when the ice fractured elsewhere, the data were not included in the analysis.
Flexural strength (failure stress) of fresh water, S2 columnar ice at −10°C loaded across the columns, following reversed cycling at ~0.1 Hz

The numbers in italics denote the stress amplitudes applied during the step-up process where the ice was cycled ~150 times at progressively higher stresses.
We computed the flexural strength, σ f, from the measured load at failure, P, and from the dimensions of the plate, using the 4-point loading relationship for the case of a beam of rectangular cross section where the loading span is one-half of the support span:
 $$\sigma _{\rm f} = \displaystyle{{3PL} \over {4bh^2}} $$
where L denotes the distance between the outer pair of loading cylinders and b and h, the width and thickness, respectively, of the plate. For comparison, we computed the flexural strength from measurements made on material that had not been cycled, but bent in one direction under monotonic loading. In the interests of reproducibility, we made multiple measurements of the strength of both cycled and non-cycled ice.
Was softening at play in these tests? Figure 2 shows curves of force/load vs time and displacement (of upper surface) vs time, for periods of 500 s near both the beginning and the end of test no.10 (Table 1). The load remained constant at P = 216 N, but the displacement increased by ~5%, from 0.491 to 0.516 mm. While it could be argued that this increase is an indication of softening, the more likely explanation is sublimation. Over the course of the test (~10 h in the cold room), the thickness of the plate decreased by ~5%. Thinning led to an increase in outer-fiber stress (barring significant creep) of ~5%, from 2.55 to 2.69 MPa, thereby accounting (on an elastic basis) for the observed increase in displacement. This is not to say that softening was entirely absent, only that it was not a major factor.
Curves of force/load and displacement vs. time for periods of 500 s near the beginning and near the end of Test 10 of Table 1.
3. RESULTS AND OBSERVATIONS
3.1. Flexural strength
The flexural strengths are listed in Table 1. Three points are noteworthy:
(i) When grouped into two categories, cycled (Tests 1–10) vs. non-cycled (Tests 11–15), the results show that upon cycling in the manner described the average flexural strength increased reproducibly and significantly (p < 0.001) by about a factor of two, from 1.43 ± 0.20 MPa to 3.00 ± 0.44 MPa. This is reminiscent of two earlier observations: of the increase in brittle compressive strength of columnar-grained ice upon cyclic loading under increasing levels of compressive stress (Iliescu and Schulson, Reference Iliescu and Schulson2002); and, more to the point of the present work, of the increase in tensile strength of freshwater granular ice upon compression-tension cycling (Cole, Reference Cole1990).
(ii) When the cycled tests are considered separately, the plates that were step-cycled at progressively higher stresses for a total of 3200 ± 300 cycles (Tests 8–10) failed at 3.56 ± 0.28 MPa. In comparison, plates that were cycled at constant stress amplitude for 4600 ± 1600 cycles (Tests 5–7) failed at 2.81 ± 0.09 MPa. This difference is statistically significant (p < 0.001) and suggests that under the conditions of these experiments the cycle-induced gain in flexural strength increases with increasing stress amplitude.
(iii) For the non-step cycled specimens that were cycled under a fixed stress of 1.45 ± 0.08 MPa, the ones that were cycled for 350 ± 38 cycles (Tests 1–3) failed at 2.68 ± 0.12 MPa. In comparison, the ones that were cycled for 4600 ± 1600 cycles (Tests 5–7) failed at 2.81 ± 0.09 MPa. This difference is statistically insignificant and suggests that beyond a few hundred cycles the number of cycles is not a major factor in strengthening.
In other words, these observations suggest that not only did cycling under the conditions explored increase bending strength, but that most of the gain was realized after a moderate number of cycles. Most importantly, step-cycling under increasing levels of stress amplified the gain.
One other observation may be significant. Upon step-cycling one specimen at progressively higher stress amplitudes of ±1.69, ±2.03, ±2.26 and ±2.48 MPa for 490 ± 10 cycles at each level, followed by cycling at an amplitude ±2.70 MPa for 503 cycles, we unloaded the ice and stored it overnight at −10°C for ~12 h. We resumed cycling the next morning. Before a single cycle could be imparted, the specimen broke, at an outer fiber stress of 2.35 MPa; i.e., at a stress lower than the highest stress amplitude of 2.70 MPa previously applied. In other words, the over-night interruption/annealing appears to have lessened the magnitude of the cycling-induced strengthening previously imparted. Although a single observation, we wonder whether it suggests that an episode of annealing can reduce-cum-eliminate the cycling-induced increase in strength.
Incidentally, although flexural strength of simply supported plates is governed by tensile strength, flexural strength is generally greater than tensile strength by a factor of about 1.7 (Ashby and Jones, Reference Ashby and Jones2005). This factor reflects the fact that in bending a smaller volume of material is subjected to the highest stress and that the largest flaw that governs may not be near the surface of bent material. Upon dividing the strength of the non-cycled ice by 1.7, the average across-column tensile strength of the ice used in these experiments to be 1.43 MPa/1.7 = 0.84 MPa, which compares favorably with the tensile strength expected for ice of 5–6 mm grain size (Schulson and Duval, Reference Schulson and Duval2009). The flexural strength itself of 1.43 ± 0.20 MPa compares reasonably well with the average value of 1.73 ± 0.25 MPa reported by Timco and O'Brien (Reference Timco and O'Brien1994) in their review.
3.2. Deformation features
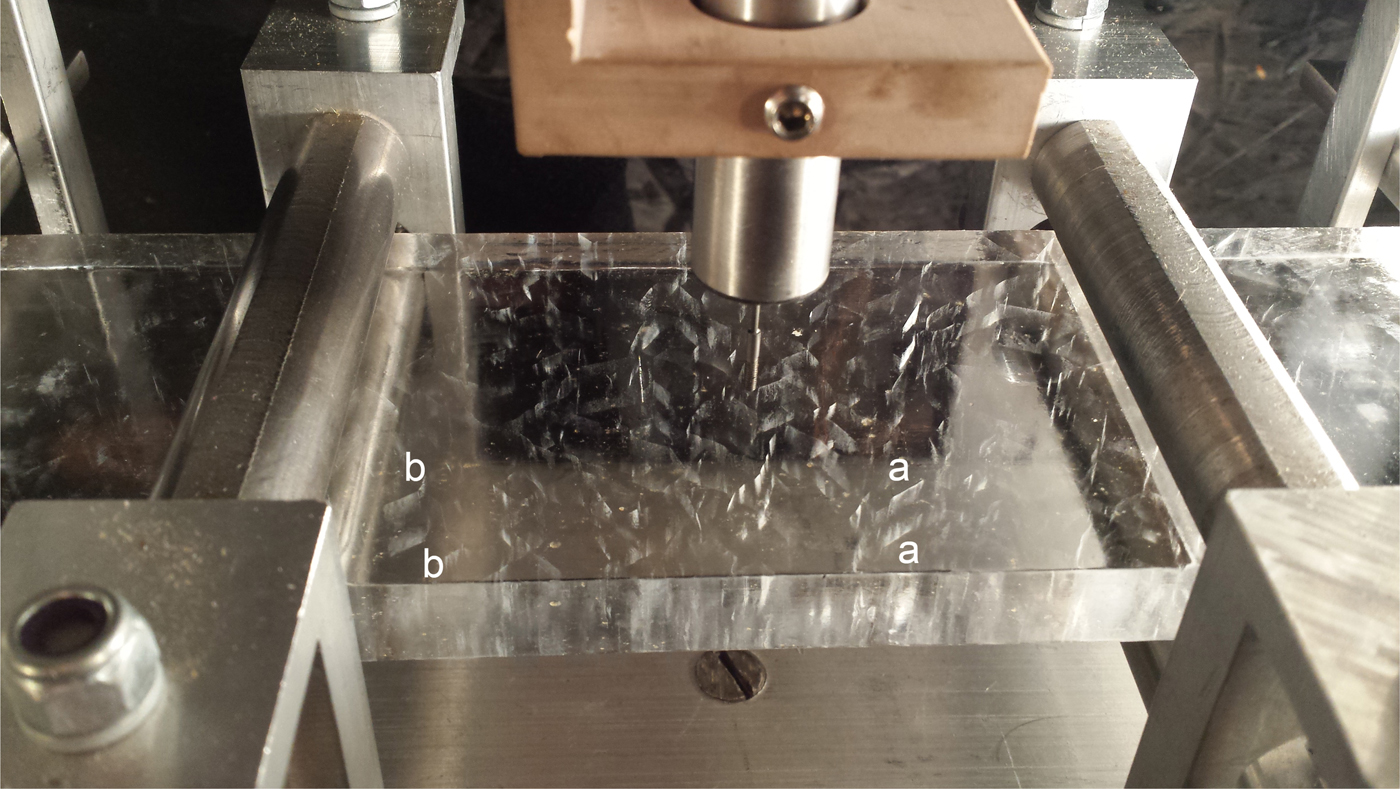
Figure 3 shows a photograph of Plate/Test-9 (Table 1) loaded in the flexural rig, prior to fracture, after having been step-cycled ~2900 times. Note the fuzzy, whitish features of grain size length (in the loading plane) distributed rather uniformly within the section of the plate between the inside support bars. The features intensified gradually during cycling rather than appearing suddenly, suggesting that they are of viscoelastic origin rather than the product of a sudden release of strain energy as in cracking. They were oriented at ~45° to the direction of the greater normal stress acting in the plane of the plate, Figure 4, suggesting that they formed through shear deformation. The whitish zones are reminiscent of similar deformation features that developed along grain boundaries within columnar-grained ice when monotonically compressed across the columns (Nickolayev and Schulson, Reference Nickolayev and Schulson1995; Picu and Gupta, Reference Picu and Gupta1995; Weiss and Schulson, Reference Weiss and Schulson2000). We term them decohesion zones, in deference to past terminology, and take them to be evidence of localized inelastic strain imparted through grain boundary sliding. Examination of Figure 3 and of other images like that one revealed that the zones formed on both ends of parent grains that penetrated the top and bottom surfaces of the plate (e.g., see zones labeled aa and bb, Fig. 3); i.e., they formed within the higher stress regions. The features extended in from both surfaces to a depth of about one-half the distance to the neutral axis of the plate; i.e., to the position within the plate where the axial stress is about one-half the outer-fiber stress. The fact that the zones extend equally inward from both the top and the bottom surfaces attests to the reversal of the loading; and their more or less uniform distribution within the central section of the plate attests to the uniform stress state that developed within that section. Decohesion zones were not detected in fractured specimens that had not been cycled (see Fig. 1).
Photograph showing a test specimen in the reversed-cyclic loading frame, after cycling ~2500 times at a displacement rate of 0.1 mm s−1 at −10°C. Note the whitish features located at grain boundaries, stemming equally from the upper and lower surfaces (e.g., a-a and b-b). The features are termed decohesion zones.
Histogram plot showing number of occurrences in each bin across the measured angle distribution. In this case, the angles made by the decohered grain boundaries with respect to the longitudinal axis of the specimen are binned and the number of decohered boundaries in each bin represents the number of occurrences. The normality test indicates that the distribution is likely normal with a mean of ~40° and a standard distribution of ~16°.

Noticeable by their absence from the two parts of plates broken after cycling were sets of microcracks, at least of the size detectable by the unaided eye. Given that upon nucleation cracks in ice are generally of grain-size dimension (Cole, Reference Cole1988; Schulson and Duval, Reference Schulson and Duval2009), their absence implies that the first crack to nucleate propagated almost immediately, leading to the creation of the fracture surface. In other words, just as the tensile strength of more coarsely grained aggregates is governed by the stress to nucleate the first crack (Schulson and others, Reference Schulson, Lim and Lee1984; Schulson and Duval, Reference Schulson and Duval2009) so, too, it appears is the bend strength of the ice described here.
4. DISCUSSION
The first question to address is why cycling led to strengthening in our experiments, but to weakening in those of Nixon and Smith (Reference Nixon and Smith1987) and of Haynes and others (Reference Haynes, Kerr and Martinson1993). Our sense is that the difference is probably a reflection of the difference in experimental conditions. Consider temperature. In the case of Haynes and others (Reference Haynes, Kerr and Martinson1993) the ice was in contact with water and was warm enough (−1°C) to possibly have partially melted at grain boundaries and thus weakened. In the other case (Nixon and Smith, Reference Nixon and Smith1987), however, the temperature of the ice (−7 to −30°C) bracketed the temperature of our ice and so melting-induced weakening was not a possibility. It is difficult, therefore, to ascribe strengthening vs. weakening to the absence or the presence of water in the ice. Even water external to the ice is likely not an important factor, for the fracture toughness of ice – the property that governs tensile strength of more coarsely grained material – appears not to be significantly affected by water (Sabol and Schulson, Reference Sabol and Schulson1989). The other point against temperature as playing the leading role in the difference of behavior is that the tensile strength of freshwater ice is relatively insensitive to this parameter (Carter, Reference Carter1971; Schulson and others, Reference Schulson, Lim and Lee1984; Schulson and Duval, Reference Schulson and Duval2009).
Another difference is frequency of cycling. In both earlier cases, the frequency was greater than in the present experiments, in one instance by two orders of magnitude (15–21.5 Hz, Haynes and others) and in the other by one order of magnitude (2.8 Hz, Nixon and Smith). Higher frequencies would have reduced any time-dependent, stress- relaxation effect (more below).
More important than differences in temperature and in cyclic frequency may be differences in the stress amplitude. In Nixon and Smith's experiments, the outer-fiber stresses (which we derived from measures given of outer-fiber strain and Young's modulus, assuming predominantly elastic behavior at the frequency employed) were ~0.8 MPa and lower. For the floating plate of Haynes and others, we derived (see Appendix) a maximum mean stress of ~0.8 MPa and a stress amplitude of ~0.3 MPa. These levels compare with a mean stress of zero in the present experiments and to a stress amplitude that stepped up from 1.3 to 2.6 MPa. The significance of these stresses relates to the grain boundary decohesions that we and others (Nickolayev and Schulson, Reference Nickolayev and Schulson1995; Picu and Gupta, Reference Picu and Gupta1995; Weiss and Schulson, Reference Weiss and Schulson2000) have observed. Importantly, from experiments on the same kind of ice as studied here, also biaxially loaded across-column along a similar loading path in principal stress space (ratio of minor stress to major stress =0.4) at −10°C at a strain rate of 10−4 s−1, Picu and Gupta (Reference Picu and Gupta1995) found the threshold principal stress for grain boundary sliding to be 0.9–1.1 MPa. In other words, weakening correlates with cyclic stresses lower than the threshold for grain boundary sliding. Strengthening, on the other hand, correlates with cyclic stresses greater than the threshold for sliding.
Why should grain boundary sliding lead to cyclic strengthening and the absence of sliding lead to cyclic weakening? We imagine that reversed cycling and the attendant reversal of the direction of sliding lessens the effectiveness of internal stress concentrators located at grain boundaries, such as facets and ledges of the kind observed by Liu and others (Reference Liu, Baker and Dudley1995). The ‘blunting’, so to say, could arise through the development of a dislocation substructure and an accompanying back stress that is heightened owing to the small number (two) of independent slip systems in ice. As a result, the applied stress must increase to nucleate the crack that eventually propagates, thus raising the flexural strength. Annealing would reduce the back stress by eliminating/rearranging the substructure, thereby reducing/eliminating the strengthening, as we observed.
Why did the ice weaken when cycled at stress amplitudes lower than the threshold just noted? Neither Nixon and Smith (Reference Nixon and Smith1987) nor Haynes and others (Reference Haynes, Kerr and Martinson1993) commented on deformation features. If our hypothesis is correct, then we expect that their ice did not develop grain boundary decohesions, either because the stress was too low or because the frequency of cycling was too high to activate grain boundary sliding at the temperature of their experiments. Instead, we imagine that, at some point where their ice began to weaken, cracks nucleated and then both increased in number as well as in length, opening and then closing during subsequent cycles, eventually reaching the point of instability.
Clearly, more work is needed to evaluate our hypothesis more deeply. At this juncture, the model offers at least a rationale for the difference in cyclic behavior of ice and thus the sense that the apparent contradiction noted in Section 1 may not be a contradiction at all.
Finally, if the foregoing hypothesis is correct, and given that grain boundary sliding is not unique to ice, then the potential for strengthening through cyclic loading might also be a feature of rock, ceramics and other crystalline materials.
5. CONCLUSION
We conclude, therefore, that under appropriate conditions of cyclic loading the flexural strength of freshwater ice can be increased. More specifically, the strength of columnar-grained material loaded across the columns at −10°C and flexed in a reverse manner at a frequency of ~0.1 Hz at stress amplitudes of 1.3–2.6 MPa can be increased by a factor of two or more. The strengthening is explained in terms of a reduction in deformation-induced stress concentration through the activation of grain boundary sliding.
ACKNOWLEDGEMENTS
We acknowledge helpful discussions/communications with Prof. Harold Frost and Drs. Robert Frederking, Robert Gagnon, Garry Timco and Dan Masterson. This work was supported by the US Department of the Interior-Bureau of Safety and Environmental Enforcement (BSEE), contract no. E16PC00005.
APPENDIX
We estimated the bending stress within the floating ice plates of Haynes and others (Reference Haynes, Kerr and Martinson1993) as follows: From a load P uniformly distributed over a circular area πa 2 on an infinite plate of ice of thickness h and of Young's modulus E and Poisson's ratio ν floating on water of density ρ, the bending stress is given by (Bernshteyn, Reference Bernshteyn1929; see also Kerr, Reference Kerr1976).
 $$\sigma = \displaystyle{{3(1 + \nu )C(\alpha )P} \over {h^2}}$$
where C(α) is a dimensionless parameter that decreases as α increases;
 $$\alpha = a/l,$$
 $$l = (D/\rho )^{1/4},$$
 $$D = Eh^3 /12(1 - \nu ^2 ).$$
From the experiments of Haynes and others (Reference Haynes, Kerr and Martinson1993), a = 0.0.08 m, h = 0.03 m, E = 5 × 10⁸ kg m−2 (or 5 GPa), ν = 0.33, ρ =103 kg m−3, which give D = 1250 kg m, l = 1.06 m and α = 0.08; correspondingly, from Figure 3 of Kerr (Reference Kerr1976) C(α) =0.45. Thus for a static load of P = 471 N and an oscillating load amplitude of 176 N (Haynes and others, Reference Haynes, Kerr and Martinson1993) we estimated from the analytical model the static or mean stress to be 0.84 MPa and the stress amplitude to be ~0.32 MPa.
We also performed a numerical analysis, which led to similar estimates, of 0.77 MPa for mean stress and 0.29 MPa for stress amplitude. For the numerical calculations ice was considered to be an isotropic linear elastic material and the domain size was taken to be ten times larger than the area over which distributed load was applied. This is also in accordance with the characteristic length in Haynes and others, (1993). Vertical lateral boundaries of the domain were fixed. The bottom surface, which had contact with water, was assumed to be a damping surface with a force proportional to displacement that acts in opposite direction. We used in the analysis the equilibrium equation  $\nabla \sigma + F_{\rm v} = 0$, where F v is the body force.


 Open access