

1 Introduction
When expected utility theory (EU) was first proposed (e.g., Reference SavageSavage, 1954) it was assumed that EU was not only the normative theory of risky decision making, but a descriptive theory as well. However it quickly became apparent that EU did not work as a descriptive theory of risky choice. One of the first and most famous challenges to EU was presented by Allais in 1953. Suppose one is given a choice between the following gambles:
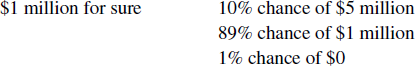
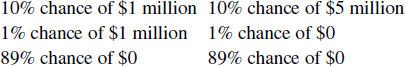
Decision-makers, Allais proposed, will generally choose the safer, certain gamble. However, when asked to choose between
decision-makers will generally chose the riskier gamble. Closer inspection reveals that the second set of gambles are obtained from the first by removing a common consequence, an 89% chance of winning $1 million, whose presence or absence should have no effect on preference. Thus, subjects’ preference reversals are nonnormative.
The Allais Paradox has been demonstrated under many different conditions (e.g., Reference BirnbaumBirnbuam 2004; Reference CamererCamerer, 1989; Reference ConliskConlisk, 1989; Reference Kahneman and TverskyKahneman and Tversky 1979; Slovic and Tversky, 1974; Reference Wu and GonzalezWu & Gonzalez, 1996). It is a real and robust phenomenon, at least when it involves a standard presentation of large monetary gains. However, the literature on the results of varying the presentation of the paradox is mixed. The present experiments investigate two circumstances in which the leading explanation of the Allais Paradox, Cumulative Prospect Theory (CPT), predicts an Allais common consequence effect should occur, but in which the effect has not always previously been found. Experiment 1 addresses the issue of the Allais Paradox and losses, while Experiment 2 investigates the effects of event splitting on the paradox.
1.1 Explanations of the Allais Paradox
A number of explanations for the Allais Paradox have been advanced. These theories include fanning-out theories, which explain the paradox via the shape of indifference curves in the unit triangle (Reference MachinaMachina, 1982), and expected cardinality-specific utility theories, which speculate that the utility function varies with the number of outcomes (Reference NeilsonNeilson, 1992; Reference HumphreyHumphrey, 1998, Reference Humphrey2001). However, for the present discussion I will concentrate on two particular classes of theories: probability weighting theories and configural weight theories.
The most common explanation for the paradox is that decision-makers weight the probabilities of outcomes via a π function that overweights small values of p and underweights large values of p, as in original Prospect Theory (Kahneman & Tversky 1979). In the first pair of gambles, when the common consequence (CC) is $1 million ("CC-high" gambles), the 1% greater chance of winning the safe gamble is overweighted because it falls in the very steep section of the π function near π(1). Decision-makers are thus drawn to the safe gamble. When the common consequence is changed to $0 ("CC-low" gambles), both the 10% chance of winning the riskier gamble and the 11% chance of winning the safer gamble fall in a flat portion of the π function. The difference between them seems small, and decision-makers choose the more valuable, riskier gamble.
Under Cumulative Prospect Theory (Tversky & Kahneman, 1992) the π function is not applied directly to the probability of an outcome but rather to the cumulative probabilities: the utility of the outcome is multiplied by π(the probability of obtaining an outcome at least as good as X) minus π(the probability if an outcome strictly better than X). Thus, the weight given to an outcome depends not only on the probability and utility of the outcome itself, but also on how good the outcome is relative to the other possible outcomes of the gamble.
Rather than using cumulative probabilities, configural weight models (e.g., Reference Birnbaum and MarleyBirnbaum, 1997, Reference Birnbaum, Shanteau, Mellers and Schum1999) directly weight the outcome according to its rank in the outcome set, with the smallest outcomes given the highest weight. By weighting smaller outcomes more heavily than larger ones, a configural weight model captures the intuition that people are more interested in avoiding the worst outcomes than they are in obtaining the best outcomes. For example, in the transfer of attentional exchange (TAX) model (Reference Birnbaum and MarleyBirnbaum 1997, Reference Birnbaum, Shanteau, Mellers and Schum1999; Reference Birnbaum and MarleyBirnbaum & Chavez, 1997; Reference Birnbaum and StegnerBirnbaum & Stegner, 1979), each lower outcome “taxes” probability weight from each higher outcome. The TAX model therefore explains the Allais Paradox primarily via the transfer of probability weights: in the three-outcome CC-high risky gamble, the highest outcome is weighted less than its probability alone would suggest, the middle outcome weighted somewhat less, and the lowest outcome more. The decision-maker thus prefers the safe gamble in the CC-high pair, which, as a single-outcome gamble, has an unaltered probability weight. In the CC-low gambles, both gambles have two outcomes. Thus, the probability weights undergo similar changes in both gambles and decision-makers simply choose the better, higher-paying risky gamble.
1.2 Losses and the Allais Paradox
Although the Allais Paradox has been demonstrated for a wide variety of monetary gains, the few studies that have used losses or mixed gambles have had conflicting results. Reference CamererCamerer (1989) found a reverse Allais Paradox — that is, greater risk-seeking for the CC-high gambles than for the CC-low gambles — for losses obtained by subtracting a common amount from all the outcomes of small-magnitude gains gambles. Neither probability weighting theories nor the TAX model predict a reverse paradox under such conditions. However, Reference BirnbaumBirnbaum (2007) obtained an Allais Paradox for mixed gambles obtained in the same manner. Three other studies found no paradox for either losses or similarly sized gains (Reference CamererCamerer 1989; Reference Chew and WallerChew & Waller, 1986; Reference HarlessHarless 1992).
Thus, the literature is conflicting on the existence of Allais Paradox for losses. Moreover, no studies that I am aware of have examined the effect of reflecting the paradox across the origin rather than shifting it. The question of the Allais Paradox for reflected loss gambles will be addressed by Experiment 1.
1.3 Event splitting and the Allais Paradox
Suppose we take the standard Allais Paradox CC-low gambles and split each of the gambles into three outcomes instead of two:
Normatively, the split gambles are identical to the standard ones. Because CPT incorporates the rank of an outcome using cumulative probability, the two sets of gambles are also identical under CPT, which therefore predicts that the paradox should be unaltered by the split. Under original PT, the effects of the split depend on whether the decision-maker chooses to coalesce the gambles during the editing stage. If so, the split gambles should be treated identically to the standard ones. If not, the split should serve to increase the desirability of the safe CC-low gamble (as 10% and 1% considered separately seem larger than 11%) and decrease that of the risky CC-low gamble, thus eliminating the paradox. Under the TAX model, the split will also serve to increase the value of the safe CC-low gamble: the outcomes with the highest payout lose less weight to the lowest outcome when split into two outcomes than when coalesced as one outcome. At the same time, the value of the CC-low risky gamble decreases when split, as the highest outcome loses more weight to the lowest outcome when the lowest outcome is split. Thus the TAX model predicts that such a split should reduce or eliminate the paradox.
Such a manipulation is known as event splitting (Reference Starmer and SugdenStarmer & Sugden, 1993). Several studies have found that event splitting, or presentation formats that constitute event splitting, reduce violations of EU in Allais Paradox. (e.g., Reference BirnbaumBirnbaum, 2004, Reference Birnbaum2007; Reference CarlinCarlin, 1990; Reference HumphreyHumphrey, 2000; Reference KellerKeller, 1985; Slovic & Tversky, 1974; Reference StarmerStarmer, 1992; Reference Starmer and SugdenStarmer & Sugden, 1991), although other studies have failed to find an effect of presentation format (e.g., Moskowitz, 1974). The extent to which event splitting disrupts something fundamental to the paradox is unclear. It is possible that it simply makes the common consequence more obvious by separating out the shared probability of obtaining the lowest outcome, a possibility that could tested by splitting the gambles in a fashion that does not make the common consequence more apparent. Reference BirnbaumBirnbaum (2007) partially accomplished this by examining the effects of splitting only one of the two CC-low gambles. He found that splitting only the risky gamble (which makes the common consequence most evident) did not eliminate the Allais Paradox, while splitting only the safe gamble did. This result argues against the suggestion that event splitting makes the common consequence more evident. However, splitting one of the two CC-low gambles and not the other still means at least one of the outcomes is easily comparable across gambles. The effect of splitting the Allais Paradox CC-low gambles so that none of the outcomes may be easily compared is not known and will be examined in Experiment 2.
1.4 Choice and the Allais Paradox
All studies that have examined the Allais Paradox for losses or event splitting in the past have used a simple choice technique: subjects demonstrate the paradox by choosing the risky CC-high gamble and the safe CC-low gamble. However, what is important about the Allais Paradox is not the preference reversal itself, but rather the increase in risk seeking when the common consequence is removed. A set of two single-choice pairs can detect a shift in risk preference only if the presented gambles happen to span the shift — that is, if the shift causes to decision-maker to prefer the safe CC-high gamble but the risky CC-low gamble. A decision-maker who chose the risky CC-high gamble might well be more risk-seeking for the CC-low gambles — and therefore be experiencing the paradox — but be unable to demonstrate this using the single-choice technique. This limitation of the choice technique poses challenges for experimenters: if a manipulation produces a reduction in the number of subjects making the Allais Paradox pattern of choices, does it actually indicate a reduction in the common consequence effect, or have risk preference merely been changed overall? One aim of the present experiments was to examine the effects of sign and event splitting on the paradox using a matching technique more sensitive than the choice technique used in previous studies.
2 Experiment 1: Losses
The purpose of Experiment 1 was to examine the Allais Paradox for loss gambles obtained from the corresponding gain gambles in one of two ways: either by shifting the outcomes across the origin by subtracting a common amount from all the gambles (as in Reference CamererCamerer, 1989) or by reflecting the gambles across the origin.
2.1 Method
2.1.1 Subjects
229 Rutgers University undergraduates participated in the experiment as part of a class requirement for an introductory psychology class.
2.1.2 Design
Each subject saw both levels of the Allais Paradox: gamble pairs with both the common consequence present (“CC-high” gambles) and those with common consequence absent (“CC-low” gambles). Each subject also saw three sign conditions: gain gambles, shifted loss gambles, and reflected loss gambles. This resulted in a 2 (CC-high vs. CC-low) 3 (sign condition) within-subjects design, for a total of 6 gambles. The gain gambles used a middle outcome of $250 and a lowest outcome of $0, with the highest outcome varying as part of the choice titration matching technique (described below). The shifted loss gambles were obtained from the gain gambles by subtracting $249 from all outcomes. This left a middle outcome of $1 and a lowest outcome of -$249. ($249 was chosen rather than $250 because, in pilot studies, subjects had expressed the opinion that being asked to make choices that included a 100% chance of $0 seemed strange.) The reflected loss gambles were obtained from the gain gambles by negating all outcomes, for a middle outcome of -$250 and a “lowest” (in absolute value) outcome of $0. The gambles used in Experiment 1 are shown in Table 1.

To facilitate comparison with the literature, the six pairs of gambles were also presented as single choice questions. In these questions the highest outcome of both the CC-high and CC-low gambles was derived from the corresponding choice titration questions: it was equal to the mean of the indifference points for the CC-high and CC-low conditions. The results of the single choice questions did not differ from the choice titration results except where noted in the footnotes. Subjects also saw one choice titration question and one single choice question that was not related to gains and losses and is not reported here.
2.1.3 Obtaining indifference points
The present experiments used a matching technique, which is more sensitive than a choice technique and therefore better able to detect changes in the Allais Paradox. Subjects’ indifference points for the largest outcome of Allais Paradox gamble pairs were elicited using a computerized choice titration procedure. The subject made a repeated series of choices between the risky and safe gambles of an Allais Paradox pair. The size of the largest outcome of the risky gamble was adjusted towards the subject’s indifference point in response to the subject’s previous choices using a bisection algorithm, described in greater detail in Reference Chapman and WeberChapman and Weber (2006), until the indifference point was obtained to the desired degree of accuracy: to within $11.72 for gains and reflected losses, and $1.53 for the shifted losses. At this point, the midpoint of the interval was considered the indifference point for the subject. The starting interval was (250, 1000) for the gains gambles, (-250, -1000) for the reflected gambles, and (1, 50) for shifted gambles. The fact that the shifted loss interval is not simply the gains interval minus $249 is the result of a programming error, and the implications are discussed in the results, below.
To eliminate incorrect indifference points caused by subject inattention or an incorrect choice, the subjects were presented with two check choices after their indifference point was obtained. One check choice presented a value for the largest outcome slightly higher than the inferred indifference point, the other an amount slightly lower than the inferred indifference point. If a subject’s response to either check choice was inconsistent with the estimated indifference point, a message box was displayed informing the subject that he had responded inconsistently, and the series of choices was presented again from the beginning. Each question was repeated until the subject produced a consistent series of responses or until the question had been presented three times. Questions for which subjects failed to give a consistent series of responses after three repetitions were not used in the analysis.
2.1.4 Materials
Questions were presented to the subjects on their own computers via the World Wide Web. Subjects read through a series of instruction pages before starting the experiment. The instructions were available to the subjects at all times during the experiment. The choices were presented one at a time in a separate window, with the order of the gambles randomly determined.
2.2 Results
The shape of the distribution of the individual cells varied with the common consequence condition. For the CC-high gambles, all distributions were bimodal, with a large peak at responses representing the largest possible absolute value of the indifference point and a small peak at responses representing the smallest possible absolute value of the indifference point. For the CC-low gambles, the responses were simply skewed, with the mode at the smallest possible absolute value of the indifference point. Providing the largest possible indifference point indicates extreme risk aversion: the subjects are indicating that they prefer the safer option regardless of the payouts of the risky option. Providing the smallest possible indifference point indicates extreme risk seeking. The shapes of the distributions suggest that subjects are more prone to extreme risk aversion when certainty is present (the CC-high gambles) than when it is not, a pattern consistent with PT, CPT, and the TAX model.
I re-analyzed the indifference point data after eliminating all responses at either floor or ceiling. These results did not differ from the results of the analyses using the full data set except where noted and are not reported. Because the indifference point distributions were not normal, in addition to ANOVAs, I also ran nonparametric Friedman and Wilcoxon-Mann-Whitney tests on the size of the Allais Paradox (the difference between the indifference points for the CC-high and CC-low gambles for each subject). Results from the nonparametric tests did not differ from the parametric tests except where noted and are not reported.
The mean indifference points for the gambles used in Experiment 1 are shown in Table 2a. Each of 229 subjects provided six indifference points. Of the resulting 1374 indifference points, 111 (8%) were missing due to failed check questions. The missing indifference points were produced by a total of 83 subjects. These observations were not included in the analyses.
Because the highest outcome is found only in the riskier gamble, higher indifference points for the highest outcome indicate greater preference for the safe gamble and higher levels of risk aversion. If the indifference points are higher for the CC-high gambles then the CC-low gambles, it indicates that subjects are showing the Allais Paradox.
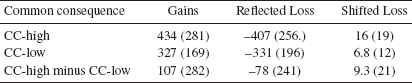
As shown in Table 2a, the indifference points are higher for the CC-high gambles than the CC-low gambles for both the gain and subtracted loss outcomes. For the reflected loss outcomes, the absolute values of the indifference points are higher for the CC-high gambles than the CC-low gambles as well. A 2 (CC-high vs. CC-low) 2 (gains vs. reflected losses) ANOVA on the absolute values of the indifference points found that the main effect of common consequence was significant, (F(1,215) = 31.78, p < 0.0001), indicating the Allais Paradox was significant.Footnote 1 However, neither the main effect of gains vs. reflected losses nor the interaction between outcome sign and common consequence was significant. (F(1,199) = 0.53, p=0.47; F(1,156) = 0.98, p=0.32) The lack of a main effect of sign indicates that subjects were not more risk-seeking for losses than they were risk-averse for gains. The lack of an interaction indicates that the reflected Allais Paradox for reflected losses was not smaller than the normal Allais Paradox for gains.
Because of the programming error that resulted in a smaller range of possible indifference points for the shifted losses than for the other two sign conditions, the shifted losses could not be compared to the other loss conditions using an ANOVA. Although the shifted losses had a much smaller response range than the other two gambles, additional analyses (data not shown) gave no indication of an enhanced ceiling effect for shifted losses, allowing the subtracted loss condition to be analyzed for the presence of the Allais Paradox. A paired-sample t-test showed that the effect of common consequence was significant, (t(202) = 6.41, p < 0.0001), indicating an Allais Paradox.Footnote 2
To compare shifted losses to the other two sign conditions, I calculated whether the subject showed or did not show the Allais Paradox for each pair of gambles, and a 1 × 3 (sign condition) logistic regression analysis was performed on the result. (The percentage of subjects showing the Allais Paradox for each sign condition is presented in Table 2b. For purposes of this analysis, the reverse paradox and EU-consistent categories shown in Table 2b were combined.) The logistic regression analysis found that the main effect of sign was significant (χ2(1, N=229) = 16.92, p = .0002), indicating that the percentage of subjects showing the Allais Paradox varied across the three conditions.Footnote 3 Planned comparisons showed that the difference between the percentage of subjects showing the Allais Paradox for gains and reflected losses was not significant (χ2(1, N=229) = 46.50, p = .16). However, significantly more subjects showed the Allais Paradox for shifted losses than for reflected losses (χ2(1, N=229)= 6.97, p = .0083).

2.3 Discussion
The present experiment shows that reflecting the Allais Paradox gambles across the origin produces a reflected Allais common consequence effect, as predicted by both probability weighting theories and the TAX model.
I also returned to the question of shifting the Allais Paradox gambles downwards across the origin. The behavior of the paradox predicted by PT, CPT or TAX in this situation depends upon the shape of the utility function. A downwards shift does not change the probabilities of the outcomes, the shape of the π function, or the number and rank order of the outcomes. However, because the utility function proposed by PT and CPT is steepest near the origin, moving the Allais Paradox gambles across the origin changes the relative utilities of the outcomes. This affects indifference points obtained by matching as well as single choice: because the utility of the value the subjects match on (the highest outcome) is larger relative to the other outcomes for shifted gambles than for gains ones, they will tend to provide smaller indifference points for the shifted gambles than for the gains gambles.
The effect of this change on the Allais Paradox depends on the exact parameters of the utility function. According to the parameters suggested by Reference Tversky and KahnemanTversky and Kahneman (1992), the shift used in Experiment 1 should have slightly decreased the size of the Allais Paradox (KöReference Köbberlingbberling, 2002). The TAX model can incorporate a utility function of varying shape, however Reference BirnbaumBirnbaum (2004) suggests the utility function u(x) = x. Under this utility function, TAX predicts no difference between the size of the paradox in the shifted and gain conditions.
None of the theories discussed predicts a reverse Allais Paradox (as found by Reference CamererCamerer, 1989, for shifted gambles), nor was one found in the present experiment. Although the limited response range of the shifted gambles did not allow for direct comparison of the size of the paradox between gains and shifted losses, a higher percentage of subjects showed the paradox for shifted losses than for gains. This suggests that the shift does not diminish the size of the Allais Paradox (as CPT predicts) and may even serve to increase it.
3 Experiment 2: Event Splitting
As discussed in the introduction, CPT and TAX make very different predictions about the effects of event splitting on the size of the Allais Paradox: CPT predicts no effect, while TAX predicts elimination of the effect. The purpose of Experiment 2 was to use a matching technique to determine whether the paradox is eliminated when the CC-low gambles are split, and if so whether this elimination occurs only for splits that ease comparisons of outcomes by highlighting the presence of the common consequence.
3.1 Method
3.1.1 Subjects
174 Rutgers University undergraduates participated in the experiment as part of a class requirement for an introductory psychology class. No subject participated in both Experiment 1 and Experiment 2.
3.1.2 Design
As in Experiment 1, in Experiment 2 each subject saw both gamble pairs with both the common consequence present and those with common consequence absent. Each subject also saw three types of split gambles: the standard, unsplit gambles, gambles split in a manner that highlighted the common consequence, and gambles split in a manner that obscured the common consequence. These splits involved only the CC-low gambles. For both the standard and nonstandard splits the risky CC-high gamble did not differ from the unsplit risky CC-high gamble, as, having three outcomes already, it could not be split further without adding additional outcomes. The safe CC-high gamble was split into three outcomes along the standard 10%, 89%, 1% lines to parallel the risky CC-high gamble. The same CC-high responses were used for both the standard and nonstandard splits. Thus there were only 5 questions in the 2 (CC-high vs. CC-low) 2 (split type: unsplit, standard, or nonstandard). The gambles used in Experiment 2 are shown in Table 3.

Subjects also saw six single choice questions obtained from their indifference points for the choice titration questions, in the manner described in Experiment 1. The results of the single choice questions did not differ from the choice titration results and are therefore not reported further.
The choice titration procedure used was conducted in exactly the same manner as described in Experiment 1. Indifference points for the highest outcome were obtained using a bisection algorithm as described above. The bisection algorithm process continued for 5 choices, after which subjects saw two check choices.
3.1.3 Materials
The materials and procedure were analogous to those in Experiment 1.
3.2 Results
As in Experiment 1, the indifference point distributions were not normal. For the unsplit gambles, the distributions showed the same pattern as in Experiment 1: bimodal with modes at the floor and ceiling for the CC-high gambles, skewed with the mode at floor for the CC-low gambles. The standard and nonstandard splits had very weakly bimodal distributions (with very little peak at the ceiling and a large peak at the floor) for all conditions. As in Experiment 1, I re-analyzed the data with the ceiling and floor removed. Results did not differ from the analysis of the full data set except where noted and are not reported. Because the indifference point distributions were not normal, in addition to parametric ANOVAs, I also ran nonparametric Friedman and Wilcoxon-Mann-Whitney tests on the size of the Allais Paradox (the difference between the indifference points for the CC-high and CC-low gambles for each subject). Results from the latter did not differ from the parametric tests except where noted and are not reported.
The mean indifference points for the highest outcome are shown in Table 4a. The mean difference between the CC-high and CC-low indifference points are also shown in Table 4a. (Note that these are the means of the differences, not the differences between the means.) Larger indifference points indicate greater risk aversion. The Allais Paradox is present when the indifference points for the CC-high gambles are higher than those for the CC-low gambles, with larger differences indicating a larger paradox.


Each of 174 subjects provided five indifference points. Of the resulting 870 indifference points, 94 (11%) were missing due to failed check questions. These observations were produced by 44 subjects. The missing observations were not included in the analyses.
As shown in Table 4a, the indifference points are higher for the CC-high gambles than the CC-low gambles for the unsplit gambles, only slightly higher for the standard splits, and lower for the nonstandard splits. Because the standard and nonstandard splits had the CC-high gambles in common, an ANOVA on the mean indifference points could not be performed. Instead, a one-way ANOVA on split type (unsplit, standard split, or nonstandard split) was performed on the difference between the indifference points for the CC-high gambles and the CC-low gambles. It found that the main effect of split type was significant (F(2,274) = 17.52, p < 0.0001), indicating that the Allais Paradox differed in size for the three types of splits. Planned comparisons found that the standard and nonstandard splits did not differ significantly from each other, (F(1,274) = 2.82, p = 0.09)Footnote 4, but they did differ from the unsplit condition, (F(1, 274) = 32.33, p < .0001). A one-sample t-test indicated that the difference between the CC-high and CC-low gambles was significantly larger than 0 for the unsplit gambles (t(139) = 6.12, p < .0001), indicating a significant Allais Paradox. However, the Allais Paradox size (that is, the difference between the indifference points for the CC-high and CC-low gambles) was not significantly different from 0 for the standard and nonstandard splits. (t(151) = 1.40, p = 0.17; t(148) = -1.17, p = 0.25)Footnote 5
3.3 Discussion
Experiment 2 tested the possibility that event splitting eliminates the Allais Paradox by increasing the salience of the common consequence by splitting the risky and safe CC-low gambles such that no two outcomes share a common probability. The results of the present study indicate that even a nonstandard splitting of the CC-low gambles — one that does not make the common consequence more salient — dramatically increases consistence with EU. The paradox was not significant for either the standard or nonstandard splits, and the two splits did not differ from each other. This indicates that the split itself, not highlighting the common consequence, eliminates the paradox. These results tend to support Birnbaum’s TAX model and Kahneman and Tversky’s original Prospect Theory over Cumulative Prospect Theory, which predicts that splitting the gambles should have no effect on the paradox.
Past literature on event splitting and the Allais Paradox has concentrated on the effects of splitting the CC-low gambles (e.g., Reference BirnbaumBirnbaum, 2004, 2007). Thus, in Experiment 2 I used a nonstandard split only for the CC-low gambles. It is possible that the split increased the salience of the common consequence of the CC-high gamble. This possibility cannot be ruled out by the present data. It is true that the indifference point was higher for the unsplit CC-high gambles than for the split CC-high gambles (t(136) = 2.26, p = 0.026). However, this is predicted by original PT (although not the TAX model) even without any change in the salience of the common consequence. Moreover, the elimination of the Allias Paradox in Experiment 2 cannot be fully explained by increased salience of the common consequence in the CC-high gambles, as the paradox is not eliminated by splitting the CC-high gambles alone (F(1, 151) = 16.21, p < .0001).
4 General discussion
The present experiments investigated the effects of two manipulations that previous literature suggests may affect the Allais Paradox in a manner inconsistent with CPT. Experiment 1 examined the transformation of gains into losses via both reflection and shifting of the gambles, while Experiment 2 investigated the transformation of gambles into three-outcome gambles via event splitting. Both experiments used a choice titration technique, which has greater sensitivity than the single choice technique that has been used in past studies of the paradox. This is especially useful when testing a manipulation that is thought to remove the paradox, as it precludes the possibility that the paradox has not been eliminated but simply shifted out of the range in which single choice can detect it. In Experiment 1, the change from gains into losses had a minimal effect on the Allais Paradox (except to reflect it where appropriate), but in Experiment 2 the splitting of the CC-low gambles rendered the paradox nonsignificant.
4.1 The Allais Paradox and losses
Unlike earlier results of Reference CamererCamerer (1989), the results of Experiment 1 are compatible with CPT. CPT predicts an Allais Paradox for both the normal and shifted loss gambles: using the parameters suggested by Reference Tversky and KahnemanTversky and Kahneman (1992) CPT predicts a difference of $123 between the mean indifference points for the normal CC-high and CC-low gambles, and a difference of $83 between the shifted CC-high and CC-low gambles (KöReference Köbberlingbberling, 2002). Thus, CPT predicts that the paradox should be slightly smaller for the shifted gambles than for the normal ones. The predicted $83 change between the CC-high and CC-low gambles in the shifted condition was larger than the overall range of possible responses, so the failure to find such a large change in Experiment 1 does not indicate a failing of CPT. The actual change in mean indifference points for the normal CC-high and CC-low gambles was $107.25, roughly comparable with CPT’s prediction. The TAX model predicts that the difference between the indifference points for the CC-high and CC-low gambles should be about $785 for both the normal and shifted gambles, much larger than was actually found for even the normal gambles (Birnbaum & Bailey, 1998). Nonetheless, it is clear that both CPT and TAX predict a robust Allais Paradox for the shifted gambles in Experiment 1, and a robust Allais Paradox was found. Thus, while the results of Experiment 1 contradict the findings of Reference CamererCamerer (1989), they agree with CPT, and to a lesser extent with the TAX model.
4.2 Event splitting and the Allais Paradox
One possible confound with earlier studies of the Allais Paradox and event splitting is that the split may facilitate comparison between the risk and safe gambles, in particular making the presence of the common consequence extremely salient. The present Experiment 2 eliminates this confound, at least for the CC-low gambles, by using a nonstandard split that conceals the common consequence, in addition to the standard increased-salience split. The fact that the Allais Paradox is eliminated for both the standard and nonstandard splits, and that the two splits are not significantly different from each other, indicates that the effects of event splitting on the paradox are not due to the increased salience of the common consequence, but are a property of the split itself.
What does the finding that event splitting eliminates the Allais Paradox say about the underlying mechanism of the paradox? It is inconsistent with CPT’s explanation of the paradox, as splitting an outcome leaves its cumulative probability unchanged. However, PT is consistent with these results assuming the decision maker does not coalesce the outcomes of the gambles in the editing phase, as a 10% chance of $25,000 and a 1% chance of $25,000 receive a larger decision weight separately than combined. This increases the value of the safe CC-low gamble and decreases that of the risky CC-low gamble eliminating the paradox for the split gambles. A similar explanation applies to the nonstandard split in Experiment 2.
The TAX model also easily accounts for the results of Experiment 2. Under TAX, splitting the lowest outcome of the risky CC-low gamble decreases the value of the gamble because now the probability weight of the highest outcome is taxed by two separate low outcomes, rather than one. This means the probability of losing is treated as though it is higher relative to the probability of winning after the gamble is split, and the value of the gamble therefore decreases. At the same time, splitting the highest outcome of the safe CC-low gamble increases the safe gamble’s value.
There is also a very simple theory that may explain the results of Experiment 2. Subjects may see the split CC-low gambles and notice that the split safe CC-low gamble offers “more ways to win” than the risky gamble, while the split risky gamble appears to offer “more ways to lose.” If the probabilities of winning and losing were very dissimilar across the two gambles, perhaps subjects would combine the probabilities and note that “more ways to win” does not necessarily translate into a significantly increased probability of winning. However, lacking an obvious dissimilarity in the probabilities, the subjects may simply be choosing according to a simple, “more ways to win is good, more ways to lose is bad” heuristic. There is some evidence that subjects pay attention to the number of ways to win or lose a gamble (e.g., Reference HumphreyHumphrey, 1999; Lopes & Oden, 1999; Reference PaynePayne, 2005) and if this is the case, event splitting may not be disrupting the basic mechanism of the Allais Paradox so much as it is overriding it. It may be that the decision process that decision-makers normally use is one that, like CPT, should cause the subjects to choose the risky CC-low gamble even after the split. However, CPT cannot cause subjects to choose the risky gamble if it is never invoked. If subjects choose between the split CC-low gambles according to a “more ways to win good, more ways to lose bad” heuristic before even evaluating the gamble according to CPT, then CPT cannot influence the outcome of the decision.
If the latter explanation is correct, then the failure to find the Allais Paradox for split gambles does not reflect on the mechanism of the paradox at all, but rather identifies a heuristic that we invoke to make our decisions simpler. Such an explanation is consistent with a bounded rationality perspective of decision-making (e.g., Reference SimonSimon, 1955, 1956; Gigerenzer, et al., 1999) in which decision making is driven by a set of heuristics, which are automatically invoked whenever situationally appropriate (and sometimes when inappropriate).
Thus, although the results of Experiment 2 are suggestive, they are not in and of themselves sufficient to demonstrate that CPT does not offer an adequate explanation for the Allais Paradox. Further research is required to investigate the possibility that subjects are simply choosing according to a “more ways to win is good” heuristic and are not invoking a deeper analysis of the gambles at all. Assuming that subjects are not invoking such a heuristic, further research is also necessary to determine whether PT or TAX provides a better explanation of the paradox. Ultimately it may be that no single theory can provide an adequate explanation of all the phenomena related to the Allais Paradox.


 Open access