

1 INTRODUCTION
The Wide-field Infrared Survey Explorer (WISE; Wright et al. Reference Wright2010) surveyed the entire sky in four passbands, which were intended to have effective wavelengths of 3.4, 4.6, 12 and 22 μm. The two reddest filters, W3 and W4, are useful for constraining the thermal emission from objects with temperatures of several hundred kelvin (e.g., Mainzer et al. Reference Mainzer2011a, Reference Mainzer, Grav, Masiero, Bauer, Wright, Cutri, Walker and McMillan2011b; Wu et al. Reference Wu2012). The W4 filter also provides a star formation rate indicator for nearby galaxies that should be comparable in accuracy to Spitzer 24 μm (e.g., Kennicutt et al. Reference Kennicutt2009; Jarrett et al. Reference Jarrett2013; Cluver et al. Reference Cluver2014).
Unfortunately, the pre-launch laboratory-measured WISE W4 relative system response (RSR) curve does not match its on-sky performance (Wright et al. Reference Wright2010). As WISE photometry was calibrated using A stars and K-M giants (Jarrett et al. Reference Jarrett2011), by construction objects with spectral indices between 1 and 2 (where the spectral index is defined by f ν∝να) have accurate photometry. However, the AB magnitudes and flux densities for star-forming galaxies and active galactic nuclei with spectral indices of α < 0 are systematically in error.
Wright et al. (Reference Wright2010) found that the fluxes of star-forming galaxies (with spectra approximated by f ν∝ν− 2) were overestimated by 9%. Brown et al. (Reference Brown2014) found the error is a smooth function of 22 μm spectral index, with the error approaching 30% for some ultra-luminous infrared galaxies. Wright et al. (Reference Wright2010) concluded that the flux errors could be resolved by shifting the effective wavelength of the W4 filter redward by 2–3%.
The aim of this paper is to define an accurate effective wavelength, photometric calibration, and practical RSR model for the WISE W4 filter. For filters with effective wavelengths of ~ 22 μm, the AB magnitudes of Vega were determined using a single-temperature Kurucz model for Vega (Kurucz Reference Kurucz, Philip, Upgren and Janes1991; Cohen et al. Reference Cohen, Walker, Barlow and Deacon1992), incorporating a 2.7% increase in the fluxes as described by Cohen (Reference Cohen2009). This Vega basis has an overall systematic uncertainty of ≃ 1.45% (Cohen et al. Reference Cohen, Walker, Barlow and Deacon1992). The resulting AB magnitude of Vega is m 22 = 5.81 in the Spitzer IRS Peak-Up Imager red channel and m 24 = 6.67 in the Spitzer MIPS 24 μm band. In general we use Vega-based magnitudes, with all exceptions being explicitly noted in the text.
2 EFFECTIVE WAVELENGTH
In this paper, we define apparent magnitudes using
 \begin{eqnarray}
m = -2.5 {\rm log} \left[ \left( \int R(\nu ) \frac{f_\nu (\nu )}{h\nu } d\nu \right) \times \left( \int R(\nu ) \frac{g_\nu (\nu )}{h\nu } d\nu \right)^{-1} \right], \nonumber\\
\end{eqnarray}
\begin{eqnarray}
m = -2.5 {\rm log} \left[ \left( \int R(\nu ) \frac{f_\nu (\nu )}{h\nu } d\nu \right) \times \left( \int R(\nu ) \frac{g_\nu (\nu )}{h\nu } d\nu \right)^{-1} \right], \nonumber\\
\end{eqnarray}
(e.g., Hogg et al. Reference Hogg, Baldry, Blanton and Eisenstein2002) where f ν is the SED of the source, g ν is the SED of a m = 0 source (either Vega or f ν = 3631 Jy), R(ν) is the filter response function (defined as electrons per incident photon) and hν is the energy of a photon with frequency ν. Please note that these magnitudes are based on photon counts rather than fluxes, and do not simply correspond to monochromatic flux densities at the effective wavelengths of the relevant filters.
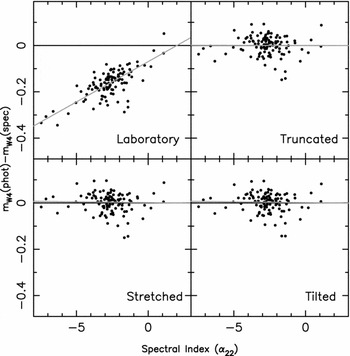
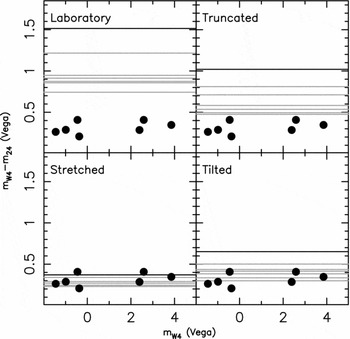
Brown et al. (Reference Brown2014) quantified the systematic error in the WISE W4 photometry by comparing measured photometry with synthetic photometry derived from galaxy spectral energy distributions. The Brown et al. (Reference Brown2014) sample spans a broad range of galaxy types, including early-type galaxies, late-type galaxies, luminous infrared galaxies, starbursts, Seyferts, and blue compact dwarfs. The top-left panel of Figure 1 shows the anomaly as a function of ~ 22 μm spectral index, α22.
The difference between measured and synthesised W4 magnitudes for galaxies drawn from Brown et al. (Reference Brown2014), plotted as a function of ~ 22 μm spectral index. The top-left panel shows that the pre-launch laboratory-measured WISE W4 RSR does not match the on-sky performance (Wright et al. Reference Wright2010; Jarrett et al. Reference Jarrett2011), so the measured W4 magnitudes are systematically too bright for galaxies with spectra that differ significantly from the Rayleigh–Jeans approximation. All three modified filter curves reduce the discrepancy between the measured the synthesised W4 magnitudes, with the stretched and tilted filter response curves performing best.
The residual is well approximated by
 \begin{equation}
\Delta m_{W4} = (0.035 \pm 0.001) \times (\alpha _{22} - 2 )
\end{equation}
\begin{equation}
\Delta m_{W4} = (0.035 \pm 0.001) \times (\alpha _{22} - 2 )
\end{equation}
with an RMS of 0.05 magnitudes (Brown et al. Reference Brown2014). This residual is much larger than the flux corrections discussed by Wright et al. (Reference Wright2010), which were intended for derivations of monochromatic flux densities from W4 photometry. For a minority of objects with measured α22 or with an assumed α22, Equation (2) can be used to correct WISE W4 photometry so that it matches the pre-launch RSR curve (e.g., Brown et al. Reference Brown2014). For the majority of objects that lack known α22 values, we need a revised effective wavelength and WISE W4 RSR model.
We can use Equation (2) to derive the revised effective wavelength for the W4 filter. If the pre-launch effective wavelength and actual effective wavelengths correspond to frequencies of ν0 and ν1 respectively, then
 \begin{equation}
\Delta m_{W4} \simeq - 2.5 {\rm log} \left( \frac{f_\nu (\nu _1)}{g_\nu (\nu _1)} \right) + 2.5 {\rm log} \left( \frac{f_\nu (\nu _0)}{g_\nu (\nu _0)} \right),\\
\end{equation}
\begin{equation}
\Delta m_{W4} \simeq - 2.5 {\rm log} \left( \frac{f_\nu (\nu _1)}{g_\nu (\nu _1)} \right) + 2.5 {\rm log} \left( \frac{f_\nu (\nu _0)}{g_\nu (\nu _0)} \right),\\
\end{equation}
 \begin{equation}
\Delta m_{W4} \simeq 2.5 {\rm log} \left( \frac{f_\nu (\nu _0)g_\nu (\nu _1)}{g_\nu (\nu _0) f_\nu (\nu _1) } \right). \qquad\qquad
\end{equation}
\begin{equation}
\Delta m_{W4} \simeq 2.5 {\rm log} \left( \frac{f_\nu (\nu _0)g_\nu (\nu _1)}{g_\nu (\nu _0) f_\nu (\nu _1) } \right). \qquad\qquad
\end{equation}
If g ν is a Rayleigh–Jeans spectrum and f ν is a power-law with index α22 then
 \begin{equation}
\Delta m_{W4} \simeq 2.5 {\rm log} \left( \frac{f_\nu (\nu _0)g_\nu (\nu _0)\nu _1^{2}\nu _0^{-2}}{g_\nu (\nu _0)f_\nu (\nu _0) \nu _1^{\alpha }\nu _0^{-\alpha }} \right),\qquad \\
\end{equation}
\begin{equation}
\Delta m_{W4} \simeq 2.5 {\rm log} \left( \frac{f_\nu (\nu _0)g_\nu (\nu _0)\nu _1^{2}\nu _0^{-2}}{g_\nu (\nu _0)f_\nu (\nu _0) \nu _1^{\alpha }\nu _0^{-\alpha }} \right),\qquad \\
\end{equation}
 \begin{equation}
(0.035 \pm 0.001) \times (\alpha _{22} - 2 ) \simeq 2.5 {\rm log} \left( \frac{\nu _0^{(\alpha _{22}-2)}}{\nu _1^{(\alpha _{22}-2)}} \right), \\
\end{equation}
\begin{equation}
(0.035 \pm 0.001) \times (\alpha _{22} - 2 ) \simeq 2.5 {\rm log} \left( \frac{\nu _0^{(\alpha _{22}-2)}}{\nu _1^{(\alpha _{22}-2)}} \right), \\
\end{equation}
 \begin{equation}
(0.035 \pm 0.001) \simeq 2.5 {\rm log} \left( \frac{\nu _0}{\nu _1} \right).\qquad\qquad
\end{equation}
\begin{equation}
(0.035 \pm 0.001) \simeq 2.5 {\rm log} \left( \frac{\nu _0}{\nu _1} \right).\qquad\qquad
\end{equation}
Equation (7) shows the W4 effective wavelength should be revised upward by 3.3 ± 0.1%, from 22.1 (Wright et al. Reference Wright2010) to 22.8 μm. The W4 filter can be considered, to first order, a 23 μm passband. The corresponding AB magnitude of Vega in the W4 band is revised from m W4 = 6.59 to m W4 = 6.66. When updating existing WISE catalogues to use the new effective wavelength, Vega-based magnitudes can remain unchanged in value, but AB magnitudes (and SED (spectral energy distribution) dependent monochromatic flux densities) must account for the revised AB magnitude of Vega.
3 RSR MODELS AND GALAXIES
To compare observed and model SEDs with observed W4 photometry, a revised W4 RSR model is needed. We have tested the pre-launch laboratory-measured W4 RSR and three alternative W4 RSR models to determine which provides the best agreement between measured photometry and photometry synthesised from spectra. All three alternative W4 RSR models have an effective wavelength of 22.8 μm.
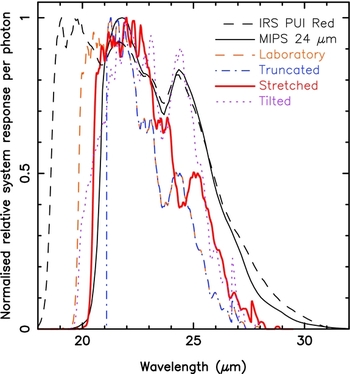
The truncated RSR model is identical to the laboratory-measured RSR except it has zero transmission below a wavelength of 21.1 μm. The stretched RSR is identical to the laboratory-measured RSR except all the wavelengths have been revised upward by 3.3% (i.e., Δλ = 0.033λ). Please note that comparisons of measured and synthesised photometry using the stretched RSR and a modified laboratory-measured RSR with the wavelengths increased by 0.73 μm (i.e., Δλ = 0.73 μm) were equivalent within our uncertainties. The tilted RSR is the product of the laboratory-measured RSR multiplied by a function that increases linearly from 0 to 1 between 18.6 and 28 μm wavelength. All of the RSRs used in this paper are plotted in Figure 2.
The laboratory-measured W4 RSR, the three modified W4 RSRs, the Spitzer IRS Peak-Up Imager red channel (22.3 μm) RSR and the MIPS 24 μm RSR. All of the RSRs are renormalised so the RSRs peak at 1.00.
We used the Brown et al. (Reference Brown2014) Spitzer IRS-LL spectra and models of galaxies to generate synthetic photometry for the laboratory-measured W4 RSR and the three alternative W4 RSR models, and then compared this to the measured matched aperture photometry of Brown et al. (Reference Brown2014). As we illustrate in Figure 1, all three modified W4 RSRs produce excellent agreement between measured photometry and photometry synthesised from spectra for galaxies, with no significant residual as a function spectral index.
4 RSR MODELS AND PLANETARY NEBULAE
To further discriminate between the RSR models, we have measured the mid-infrared colours of bright planetary nebulae with WISE W4 and Spitzer MIPS 24 μm filters, and compared these with colours synthesised from Spitzer IRS-LL spectroscopy. While galaxy spectra are dominated by a (relatively) featureless continuum near 23 μm, planetary nebulae often feature a prominent [O iv] emission line at 25.9 μm. Although the planetary nebulae spectra in the W4 wavelength range are dominated by a single emission line, the magnitudes still depend on the shape of the entire W4 RSR as they are normalised with a model Vega spectrum. As the [O iv] emission line is far from the effective wavelength of the W4 filter, it is non-trivial to convert AB magnitudes (defined by Equation (1)) into monochromatic flux densities.
Planetary nebulae from the NGC and IC catalogues were selected from Kohoutek (Reference Kohoutek2001), and these were then cross matched with data in the Spitzer Heritage Archive Footnote 1 and the Cornell Atlas of Spitzer/IRS Sources (CASSIS; Lebouteiller et al. Reference Lebouteiller, Barry, Spoon, Bernard-Salas, Sloan, Houck and Weedman2011). Spitzer IRS-LL spectra of planetary nebulae are typically ‘stare mode’ spectra rather than ‘spectral maps’, so we could not easily match our photometric aperture with the spectroscopic extraction aperture. However, the stare mode spectra were sufficient to check that the planetary nebulae selected had weak continua and strong [O iv] emission. We also attempted to use supernova remnants, but found most of the objects with IRS-LL spectra had relatively strong continua and weak [O iv] emission, so we excluded them from our analysis.
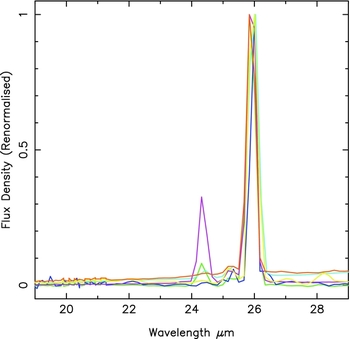
The final sample of planetary nebulae was NGC 246, NGC 3587, NGC 6720, NGC 6852, NGC 6853 and NGC 7293, and the renormalised spectra are plotted in Figure 3. The photometry of the planetary nebulae was measured using large rectangular apertures as in Brown et al. (Reference Brown2014), and this photometry is provided in Table 1. We have not removed stellar contamination from the planetary nebula photometry, but stars only significantly alter the photometry well short-ward of the W4 filter. As all of the planetary nebulae are very bright, we expect systematic errors (e.g., calibration errors) to dominate over photon Poisson noise.
The Spitzer IRS-LL planetary nebula spectra used for testing the shape of the W4 RSR. To aid the comparison of the spectra, they have all been renormalised using the peak of the [O iv] emission line at 25.9 μm. All of the planetary nebulae have weak continuum emission and strong [OIV [O iv] emission, and some of the nebulae feature the[Ne v] emission line at 24.3 μm.
Planetary nebula photometry.
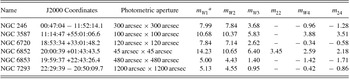
a Foreground and background stars were not subtracted from the images, and can contribute significantly to the W1 and W2 photometry.
In Figure 4, we compare the measured m W4 − m 24 colours of planetary nebula with colours synthesised from spectra. There are gross offsets between the measured colours and those synthesised from the laboratory RSR and the truncated RSR. Smaller offsets are seen between measured colours and those synthesised from the tilted RSR, while there is good agreement between the measured and synthesised photometry for stretched RSR. Both the tilted and stretched RSRs effectively increase transmission at the red end of the filter (i.e., they are consistent with a ‘red leak’).
The measured m W4 − m 24 colours of planetary nebula and colours synthesised from spectra. The black solid line denotes a spectrum with a single 25.9 μm emission line while the grey lines are synthesised from Spitzer IRS-LL spectra of planetary nebulae. Of the RSRs tested, the stretched filter response curve provides the best agreement between the measured photometry and photometry synthesised from spectra.
The Spitzer IRS Peak-Up Imager red channel (22.3 μm) allows us to cross check the measured and synthesised colours of planetary nebulae without relying on calibration of the MIPS 24 μm band, although we can undertake this test for just one object in our sample. The measured colour of NGC 6852 is m 22 − m W4 = 0.86, while a single 25.9 μm emission line produces m 22 − m W4 colours of − 0.22, 0.28, 0.93, and 0.65 for the laboratory-measured, truncated, stretched and tilted RSRs (respectively). This is consistent with our tests using m W4 − m 24 colours, where the best agreement between measured and synthesised colours was for the stretched RSR.
We caution that only three RSR models are presented in this paper, and our stretched RSR is unlikely to be a unique solution for resolving the discrepancy between measured and synthesised W4 photometry. We also caution that while the stretched RSR provides the best agreement between the measured and synthesised W4 photometry, an error in transmission or quantum efficiency is far more likely than a wavelength error. The stretched filter curve should thus be considered a useful empirical model for comparing W4 photometry with spectra, rather than a unique physical description of the W4 RSR.
5 SUMMARY
We present a revised effective wavelength, photometric calibration, and RSR models for the WISE W4 filter, derived using comparisons of measured photometry and photometry synthesised from galaxy and planetary nebula spectra. The on-sky performance of the WISE W4 RSR does not match pre-launch laboratory measurements, resulting in large flux density errors for star-forming galaxies, active galactic nuclei, and planetary nebulae.
The offset between the measured W4 photometry and photometry synthesised from spectra is a function of 22 μm spectral index. When spectral index information is available, Equation (2), can be used to adjust measured photometry so it is on the system defined by the pre-launch laboratory-measured RSR.
When spectral index information is not available, a revised effective wavelength must be used (although Vega-based magnitudes remain unchanged). We find the effective wavelength of the W4 filter should be revised upward by 3.3%, from 22.1 to 22.8 μm. The corresponding AB magnitude of Vega in the W4 band should be revised from m W4 = 6.59 to m W4 = 6.66. The W4 filter can be considered, to first order, a 23 μm passband.
To compare SEDs with observed W4 photometry, a revised W4 RSR model is needed. Using galaxy spectra, we could not easily distinguish between different models of the W4 RSR that all have an effective wavelength of 22.8 μm. The prominent 25.9 μm [O iv] emission line in planetary nebula spectra allowed us to distinguish between three possible W4 RSR models. Of the three RSR models tested, we find that a RSR that matches the shape laboratory-measured curve, but with the wavelengths increased by 3.3% (or increased by ≃ 0.73 μm) adequately reconciles measured photometry and photometry synthesised from spectra.
ACKNOWLEDGEMENTS
MB acknowledges financial support from the Australian Research Council (FT100100280) and the Monash Research Accelerator Program (MRA). TJ and MC would like to acknowledge the support of the South African National Research Foundation and Department of Science and Technology. This publication makes use of data products from the Wide-field Infrared Survey Explorer, which is a joint project of the University of California, Los Angeles, and the Jet Propulsion Laboratory/California Institute of Technology, funded by the National Aeronautics and Space Administration. This work is based in part on observations made with the Spitzer Space Telescope, obtained from the NASA/IPAC Infrared Science Archive, both of which are operated by the Jet Propulsion Laboratory, California Institute of Technology under a contract with the National Aeronautics and Space Administration. The Cornell Atlas of Spitzer/IRS Sources (CASSIS) is a product of the Infrared Science Center at Cornell University, supported by NASA and JPL.


