


1. Introduction
The Paleoproterozoic Bergslagen mining district, within the Bergslagen lithotectonic unit (BLU), occurs in metasedimentary-metavolcanic (felsic-dominated) rocks on the Fennoscandian Shield in south-central Sweden. The mining district hosts a variety of ore deposit types including polymetallic Zn-Pb-Ag-(Cu-Au) deposits, with two end-member types being recognised by Allen et al. (Reference Allen, Lundström, Ripa, Simeonov and Christofferson1996): 1. Bedded stratiform Zn-Pb-Ag-rich sulphide mineralisation within rhyolitic ash-siltstone spatially associated with skarn, marble and metamorphosed sedimentary rocks (SAS-type); and 2. Stratabound, stacked sulphide lenses hosted in limestone-skarn and adjacent volcanic/volcaniclastic rocks (SVALS-type). SAS-type deposits include the large Zinkgruvan deposit (17.4 Mt @ 7.8 % Zn, 3.3 % Pb, 73 ppm Ag and 3.4 Mt @ 2.1 % Cu 33 ppm Ag, measured and indicated resources as of 2023, https://lundinmining.com/operations/reserves-and-resources, Hedström et al. Reference Hedström, Simeonov and Malmström1989, Jansson et al. Reference Jansson, Sädbom, Allen, Billström and Spry2018), and the smaller Lovisa deposit (1.2 Mt @ 9.4 % Zn, 5.3 % Pb and 10–20 ppm Ag; Jansson et al. Reference Jansson, Sädbom, Allen, Billström and Spry2018). The more common SVALS-type deposits include the giant Garpenberg deposit with reserves (as of 2022) of 109 Mt @ 2.6 % Zn, 1.2 % Pb, 0.04 % Cu, 87 ppm Ag and 0.29 ppm Au; Falun (28.1 Mt @ 2–4 % Cu, 4 % Zn, 1.5 % Pb, 13–25 ppm Ag and ∼3 ppm Au, Allen et al. Reference Allen, Lundström, Ripa, Simeonov and Christofferson1996); Sala (5 Mt @ 150- > 3,000 ppm Ag, 12 % Zn and 1.5 % Pb; Allen et al. Reference Allen, Lundström, Ripa, Simeonov and Christofferson1996; Jansson Reference Jansson2017; Jansson et al. Reference Jansson, Allen, Skogsmo and Turner2021); and Svärdsjö (1 Mt @ 6.0 % Zn, 2.7 % Pb, 0.62 % Cu and 112 ppm Ag, Ripa et al. Reference Ripa, Sundberg, Wik, Bergman, Claeson, Hallberg, Hellström, Kübler and Nysten2015; Fahlvik et al. Reference Fahlvik, Kampmann and Jansson2022).
There are various genetic theories regarding the formation of SVALS-type deposits including Broken Hill-type (BHT), skarn, volcanogenic massive sulphide (VMS) and sedimentary exhalative (SEDEX) models. However, studies by Allen et al. (Reference Allen, Lundström, Ripa, Simeonov and Christofferson1996) and Jansson et al. (Reference Jansson, Erismann, Lundstam and Allen2013, Reference Jansson, Allen, Skogsmo and Turner2021) suggest they form a continuum between syn-volcanic, sub-seafloor replacement deposits and intrusion-related metasomatic Zn skarn deposits such as Sala. In contrast, SAS-type deposits are interpreted as metamorphosed SEDEX-like deposits and hybrid SEDEX-VMS deposits that formed in or above the volcanic successions from basinal brines (e.g. Allen et al. Reference Allen, Lundström, Ripa, Simeonov and Christofferson1996; Jansson et al. Reference Jansson, Zetterqvist, Malmström and Allen2017, Reference Jansson, Sädbom, Allen, Billström and Spry2018).
Genetic considerations for some SVALS- and SAS-type deposits are, in part, based on light stable isotope (S, C and O) studies. Specifically, sulphur isotope studies have been carried out on the Falun (Gavelin et al. Reference Gavelin, Parwel and Ryhage1960), Gruvåsen (Hellingwerf & van Raaphorst Reference Hellingwerf and van Raaphorst1988), Svärdsjö (Billström Reference Billström1985), Zinkgruvan (Billström Reference Billström1991; Jansson et al. Reference Jansson, Zetterqvist, Malmström and Allen2017), Hällefors (Wagner et al. Reference Wagner, Jonsson and Boyce2005), Lovisa (Jansson et al. Reference Jansson, Sädbom, Allen, Billström and Spry2018) and Sala deposits (Jansson et al. Reference Jansson, Allen, Skogsmo and Turner2021). Three survey studies of C and O isotopes have been conducted on carbonates spatially associated with polymetallic sulphide deposits in the Bergslagen district. Billström et al. (Reference Billström, Äberg and Nord1985) evaluated the C and O isotope compositions of carbonates in several deposits spatially associated with marbles, including a limited number of analyses of carbonates from the Stollberg, Sater and Saxberget SVALS-type deposits. They also included single C and O isotope compositions of carbonates from several other base metal occurrences and suggested that they could be used for exploration purposes. The survey study of De Groot and Sheppard (Reference De Groot and Sheppard1988) concerned the C and O isotopic compositions of calcite and dolomite in stratabound carbonates, patches of carbonates in skarn deposits and carbonate veins, while Jonsson and Boyce (Reference Jonsson and Boyce2002) conducted a C and O isotope study of dolomitic marbles and calcite within ore, and calcite veins in skarn ore in the Långban area. Other C and O isotope studies of massive sulphide deposits in the Bergslagen district include that of Allen et al. (Reference Allen, Bull, Ripa and Jonsson2003) of carbonates associated with the Garpenberg SVALS-type Zn-Pb-Cu-Ag deposit along with a more limited study by Gebeyehu and Vivallo (Reference Gebeyehu, Vivallo, Pagel and Leroy1991). Combined S, C and O isotopes compositions in the Bergslagen district are restricted to those of Jansson et al. (Reference Jansson, Allen, Skogsmo and Turner2021) on the sub-seafloor Zn-Pb-Ag skarn deposits in the Sala area and of Billström (Reference Billström1985) on the Svärdsjö deposit.
The importance of the effects of high-temperature metasomatic fluids and how they modified the C and O isotope composition of the metamorphosed dolomites and limestone (now marbles) spatially associated with sulphide mineralisation was emphasised by Billström et al. (Reference Billström, Äberg and Nord1985), De Groot and Sheppard (Reference De Groot and Sheppard1988), Jonsson and Boyce (Reference Jonsson and Boyce2002) and Jansson et al. (Reference Jansson, Allen, Skogsmo and Turner2021). The current study extends these earlier studies by evaluating the C and O isotope compositions of calcite in three deposits (Dammberget, Tvistbo and Gränsgruvan), and the S isotope compositions of sulphides (sphalerite, pyrite, chalcopyrite and galena) in the Dammberget, Baklängan and Gränsgruvan deposits in the Stollberg ore field, as well as a single sample of chalcopyrite from the Grönkullan banded iron formation deeper in the stratigraphy. These locations were chosen because they are distributed around the Stollberg syncline and are considered representative of deposits in the ore field. The aims of the study are to consider to which the degree metasomatic or magmatic-hydrothermal processes have operated in the Stollberg area and whether metamorphic decarbonation of spatially associated metamorphosed limestone was important, the source of the sulphur in the ore field, and to expand on the conditions of ore formation proposed previously by Jansson et al. (Reference Jansson, Erismann, Lundstam and Allen2013) and Frank et al. (Reference Frank, Spry, Raat, Allen, Jansson and Ripa2019). In this study, comparisons will be made with stable isotope compositions obtained previously from the Bergslagen district to evaluate the commonality of sulphur sources for the district and the possible role metasomatic/magmatic-hydrothermal/metamorphic processes played in ore formation.
2. Regional geology
The BLU, a lithotectonic unit that forms part of the Svecokarelian orogen in the Fennoscandian shield, originated as a marine intra-arc or back-arc basin on continental crust (e.g. Allen et al. Reference Allen, Lundström, Ripa, Simeonov and Christofferson1996; Stephens & Jansson, Reference Stephens and Jansson2020). It consists primarily of c. 1.91–1.89 Ga plutonic rocks (mainly granite, diorite, granodiorite and gabbro) that intruded a thick unit of mainly felsic volcanic rocks (pyroclastic flow deposits, ash silt-sandstone, volcanogenic sandstone, coherent lavas, subvolcanic intrusions and volcaniclastic mass flow deposits), which are underlain and overlain by a package of siliciclastic rocks consisting of argillite, turbidite, quartzite and conglomerate (e.g. Allen et al. Reference Allen, Lundström, Ripa, Simeonov and Christofferson1996; Stephens & Jansson, Reference Stephens and Jansson2020). Allen et al. (Reference Allen, Lundström, Ripa, Simeonov and Christofferson1996) showed that stromatolitic limestones and minor banded iron formations occurring as interbeds in the volcanic succession formed in shallow marine environments during pauses in volcanism. The BLU was metamorphosed primarily to the amphibolite facies with areas reaching greenschist and granulite facies, with local evidence of migmatization (e.g. Andersson et al. Reference Andersson, Larsson and Wikström1992; Stephens et al. Reference Stephens, Ripa, Lundström, Persson, Bergman, Ahl, Wahlgren, Persson and Wickström2009). The Bergslagen district was subjected to at least two periods of ductile deformation (Stephens et al. Reference Stephens, Ripa, Lundström, Persson, Bergman, Ahl, Wahlgren, Persson and Wickström2009; Beunk & Kuipers Reference Beunk and Kuipers2012) with shear zones and plutonic rocks bounding the supracrustal rocks to form inliers (e.g. Stephens & Bergmann Reference Stephens and Bergman2020). Other than polymetallic SVALS- and SAS-type Zn-Pb-Ag-(Cu-Au) deposits, the Bergslagen district hosts thousands of banded iron formation, Mn oxide, Fe oxide skarn, Fe oxide, W skarn, granite-pegmatite-hosted Mo deposits and pegmatite-hosted deposits (Weihed et al. Reference Weihed, Arndt, Billström, Duchesne, Eilu, Martinsson, Papunen and Lahtinen2005; Allen et al. Reference Allen, Ripa and Jansson2008; Stephens et al. Reference Stephens, Ripa, Lundström, Persson, Bergman, Ahl, Wahlgren, Persson and Wickström2009). Note the term ‘skarn’ in the present study refers to stratiform or stratabound calc-silicate rocks dominated by garnet, clinopyroxene and/or clinoamphibole without any implied genetic or spatial association to an igneous intrusion, as defined previously by Jansson et al. (Reference Jansson, Erismann, Lundstam and Allen2013).
3. Local geology of the Stollberg ore field
The Stollberg ore field, which extends for ∼15 km, was mined intermittently for over six centuries until 1982. It produced ∼ 6.65 Mt with ore grades ranging from 0.5–5 wt. % Zn, 0.5–15.6 wt. % Pb and 5–320 ppm Ag, for at least a dozen sulphide occurrences (Selinus, Reference Selinus1983; Ripa, Reference Ripa1996; Jansson et al. Reference Jansson, Erismann, Lundstam and Allen2013; Table 1). These deposits were metamorphosed to the amphibolite facies (∼560o–600o C and 2–3.5 kb, Beetsma, Reference Beetsma1992) and occur around a regional structural feature known locally as the Stollberg syncline, which is a N-S trending, upright to steeply dipping, S-plunging, second-generation fold (F2) (Fig. 1). Like other SVALS-type deposits in the Bergslagen district, sulphides are spatially associated with bimodal felsic and mafic volcanic rocks and metamorphosed limestone. The felsic volcanic rocks are dominated by variably altered rhyolitic ash-siltstone and massive pumice deposits, whereas the intrusive rocks include granitoids, porphyritic metarhyolite, amphibolite and post-Svecokarelian dolerite dykes. At least nine deposits occur on the eastern side of the Stollberg syncline with Gränsgruvan occurring on the western side and Norrgruvan and Tvistbo being located at the northern end, near the hinge of the F2 fold (Fig. 1). Mafic sills are interspersed throughout the stratigraphy associated with the syncline (Figs. 2 and 3). The sulphide deposits formed just after a major rhyolitic, volcanic eruption and the development of a submarine caldera (Jansson et al. Reference Jansson, Erismann, Lundstam and Allen2013).
Characteristics of selected deposits in the Stollberg ore field

Abbreviations after Warr (Reference Warr2021).
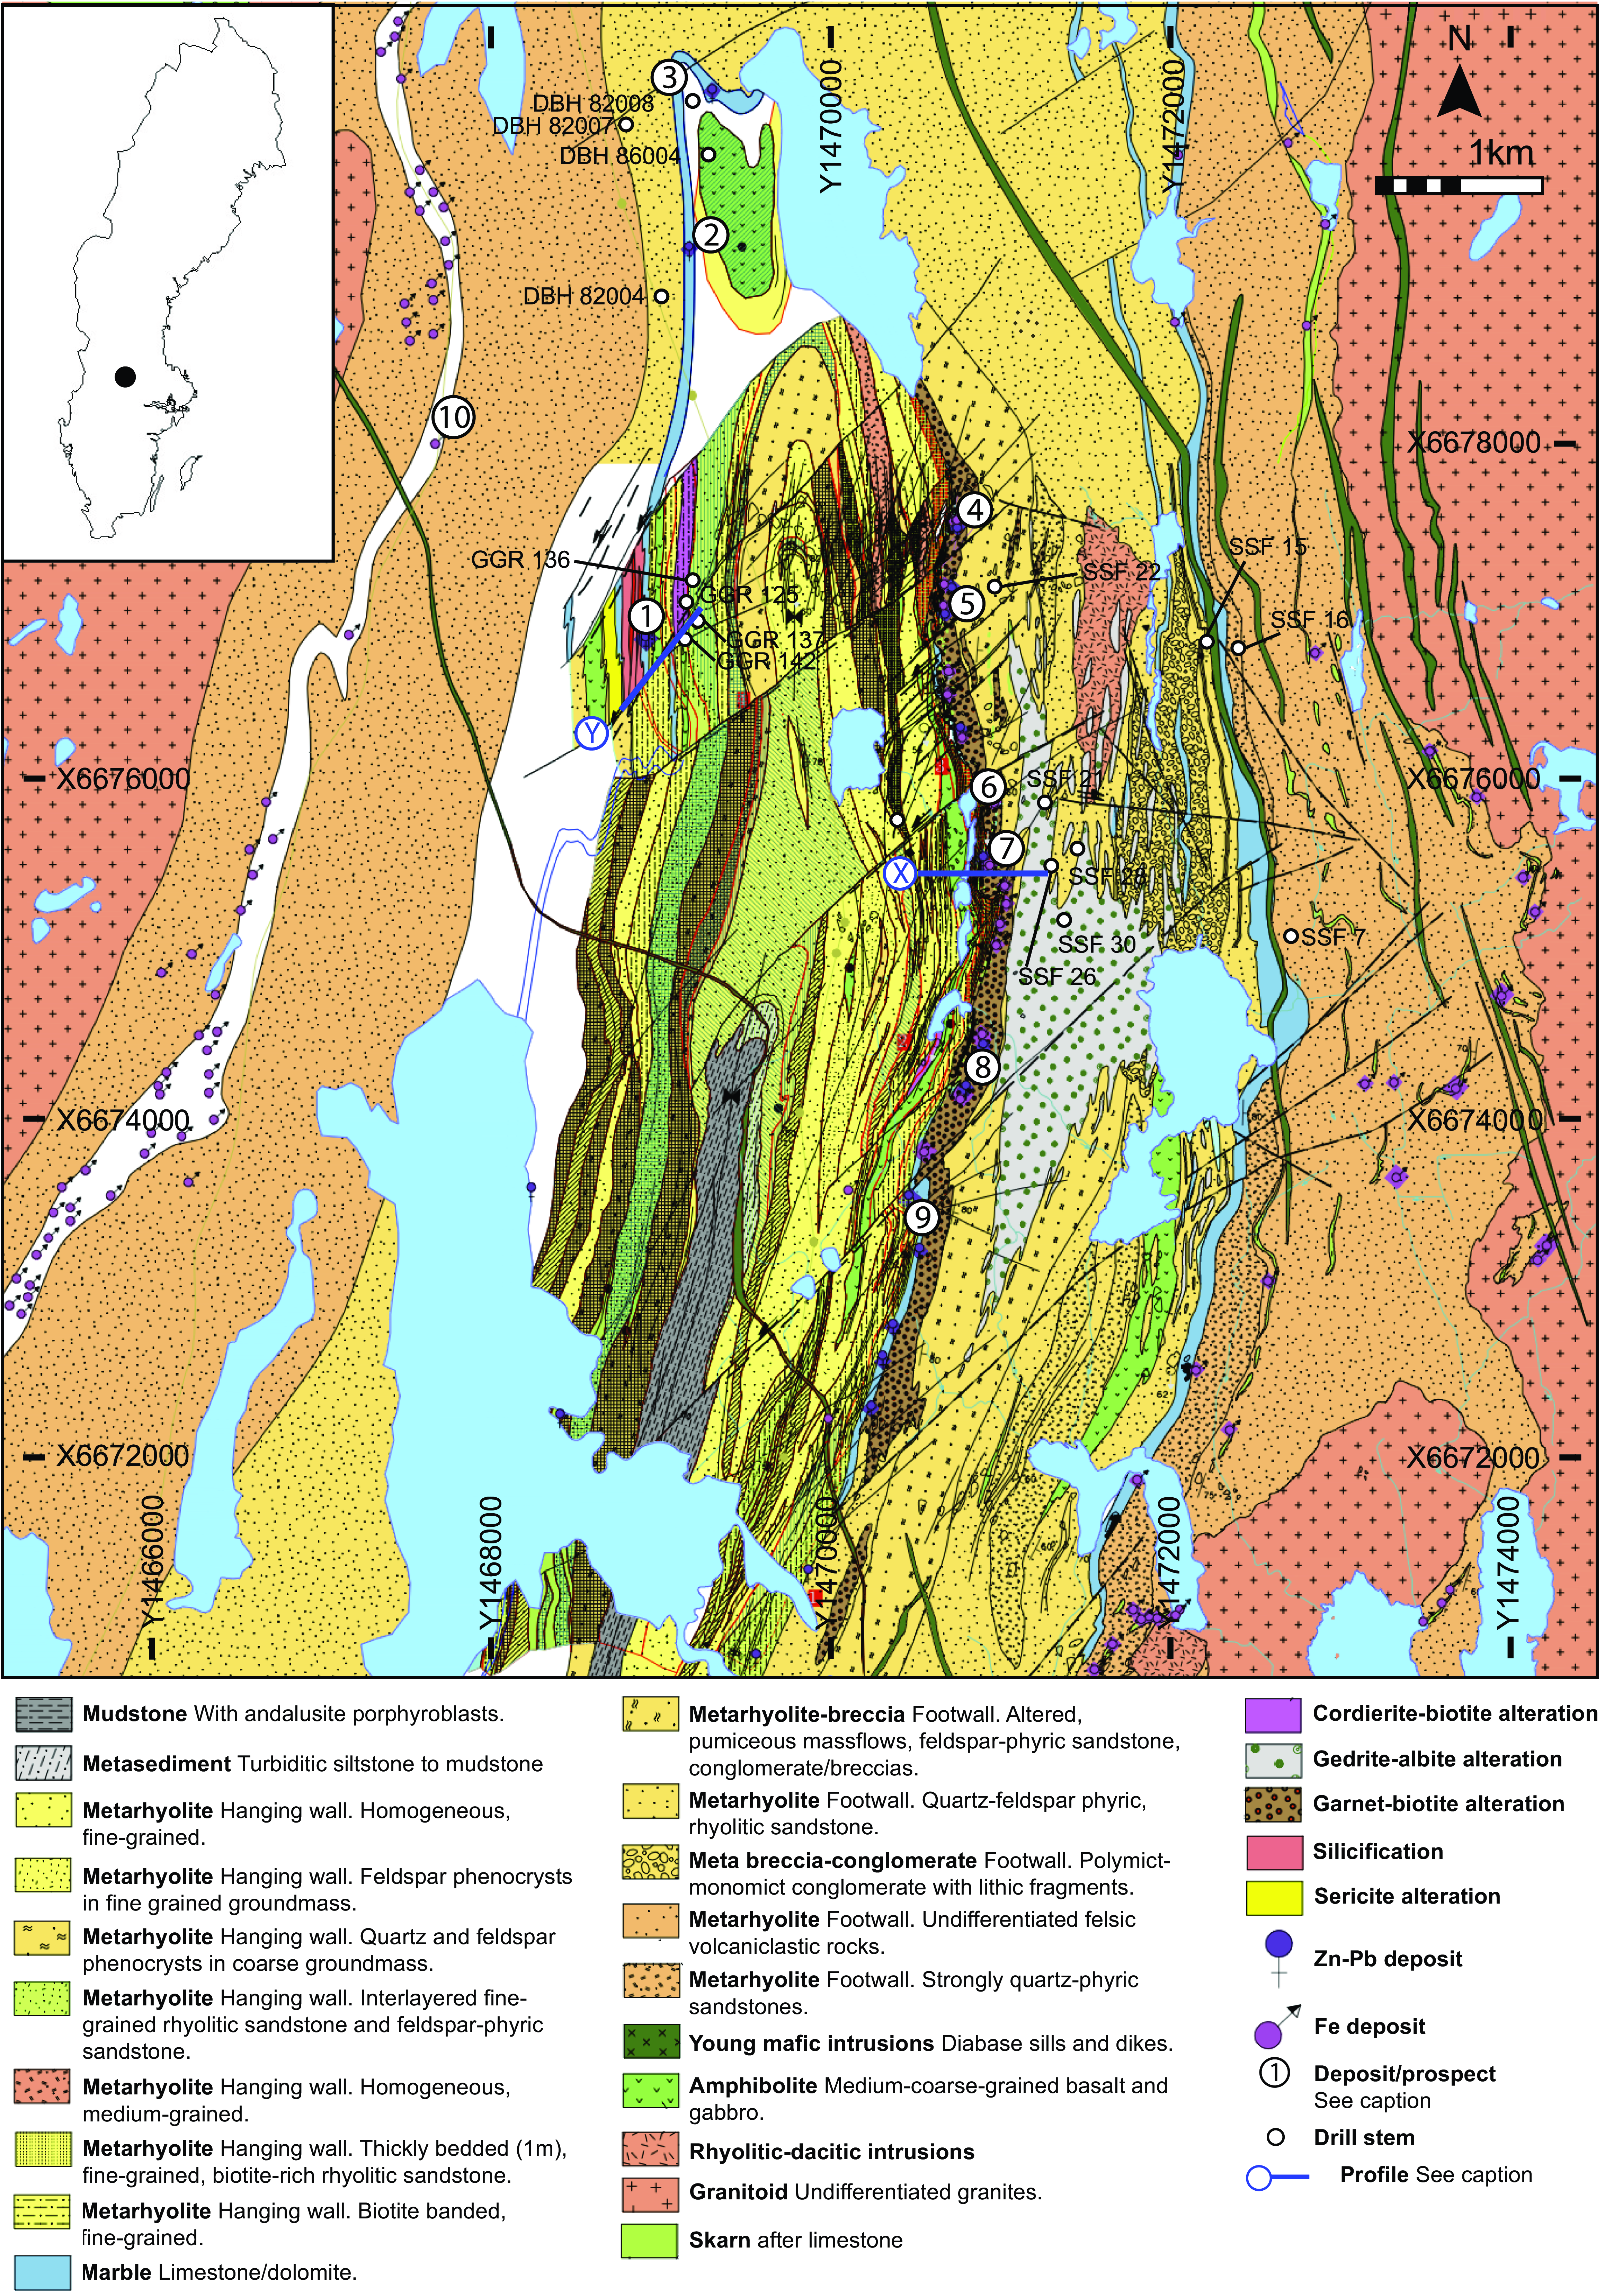
Geologic map of the Stollberg area, showing the location of mines, mineral occurrences and drill cores. 1 = Gränsgruvan, 2 = Norrgruvan, 3 = Tvistbo, 4 = Lustigkullagruvan, 5 = Cedercreutz, 6 = Baklängan, 7 = Dammberget, 8 = Stollmalmen, 9 = Brusgruvan, 10 = Grönkullan. Drill cores from which samples were taken are shown. Grid is Swedish National Grid RT90, and inset map shows location of Stollberg in Sweden. Key provided on following page. Modified after Raat et al. (Reference Raat, Jansson and Lundstam2013).
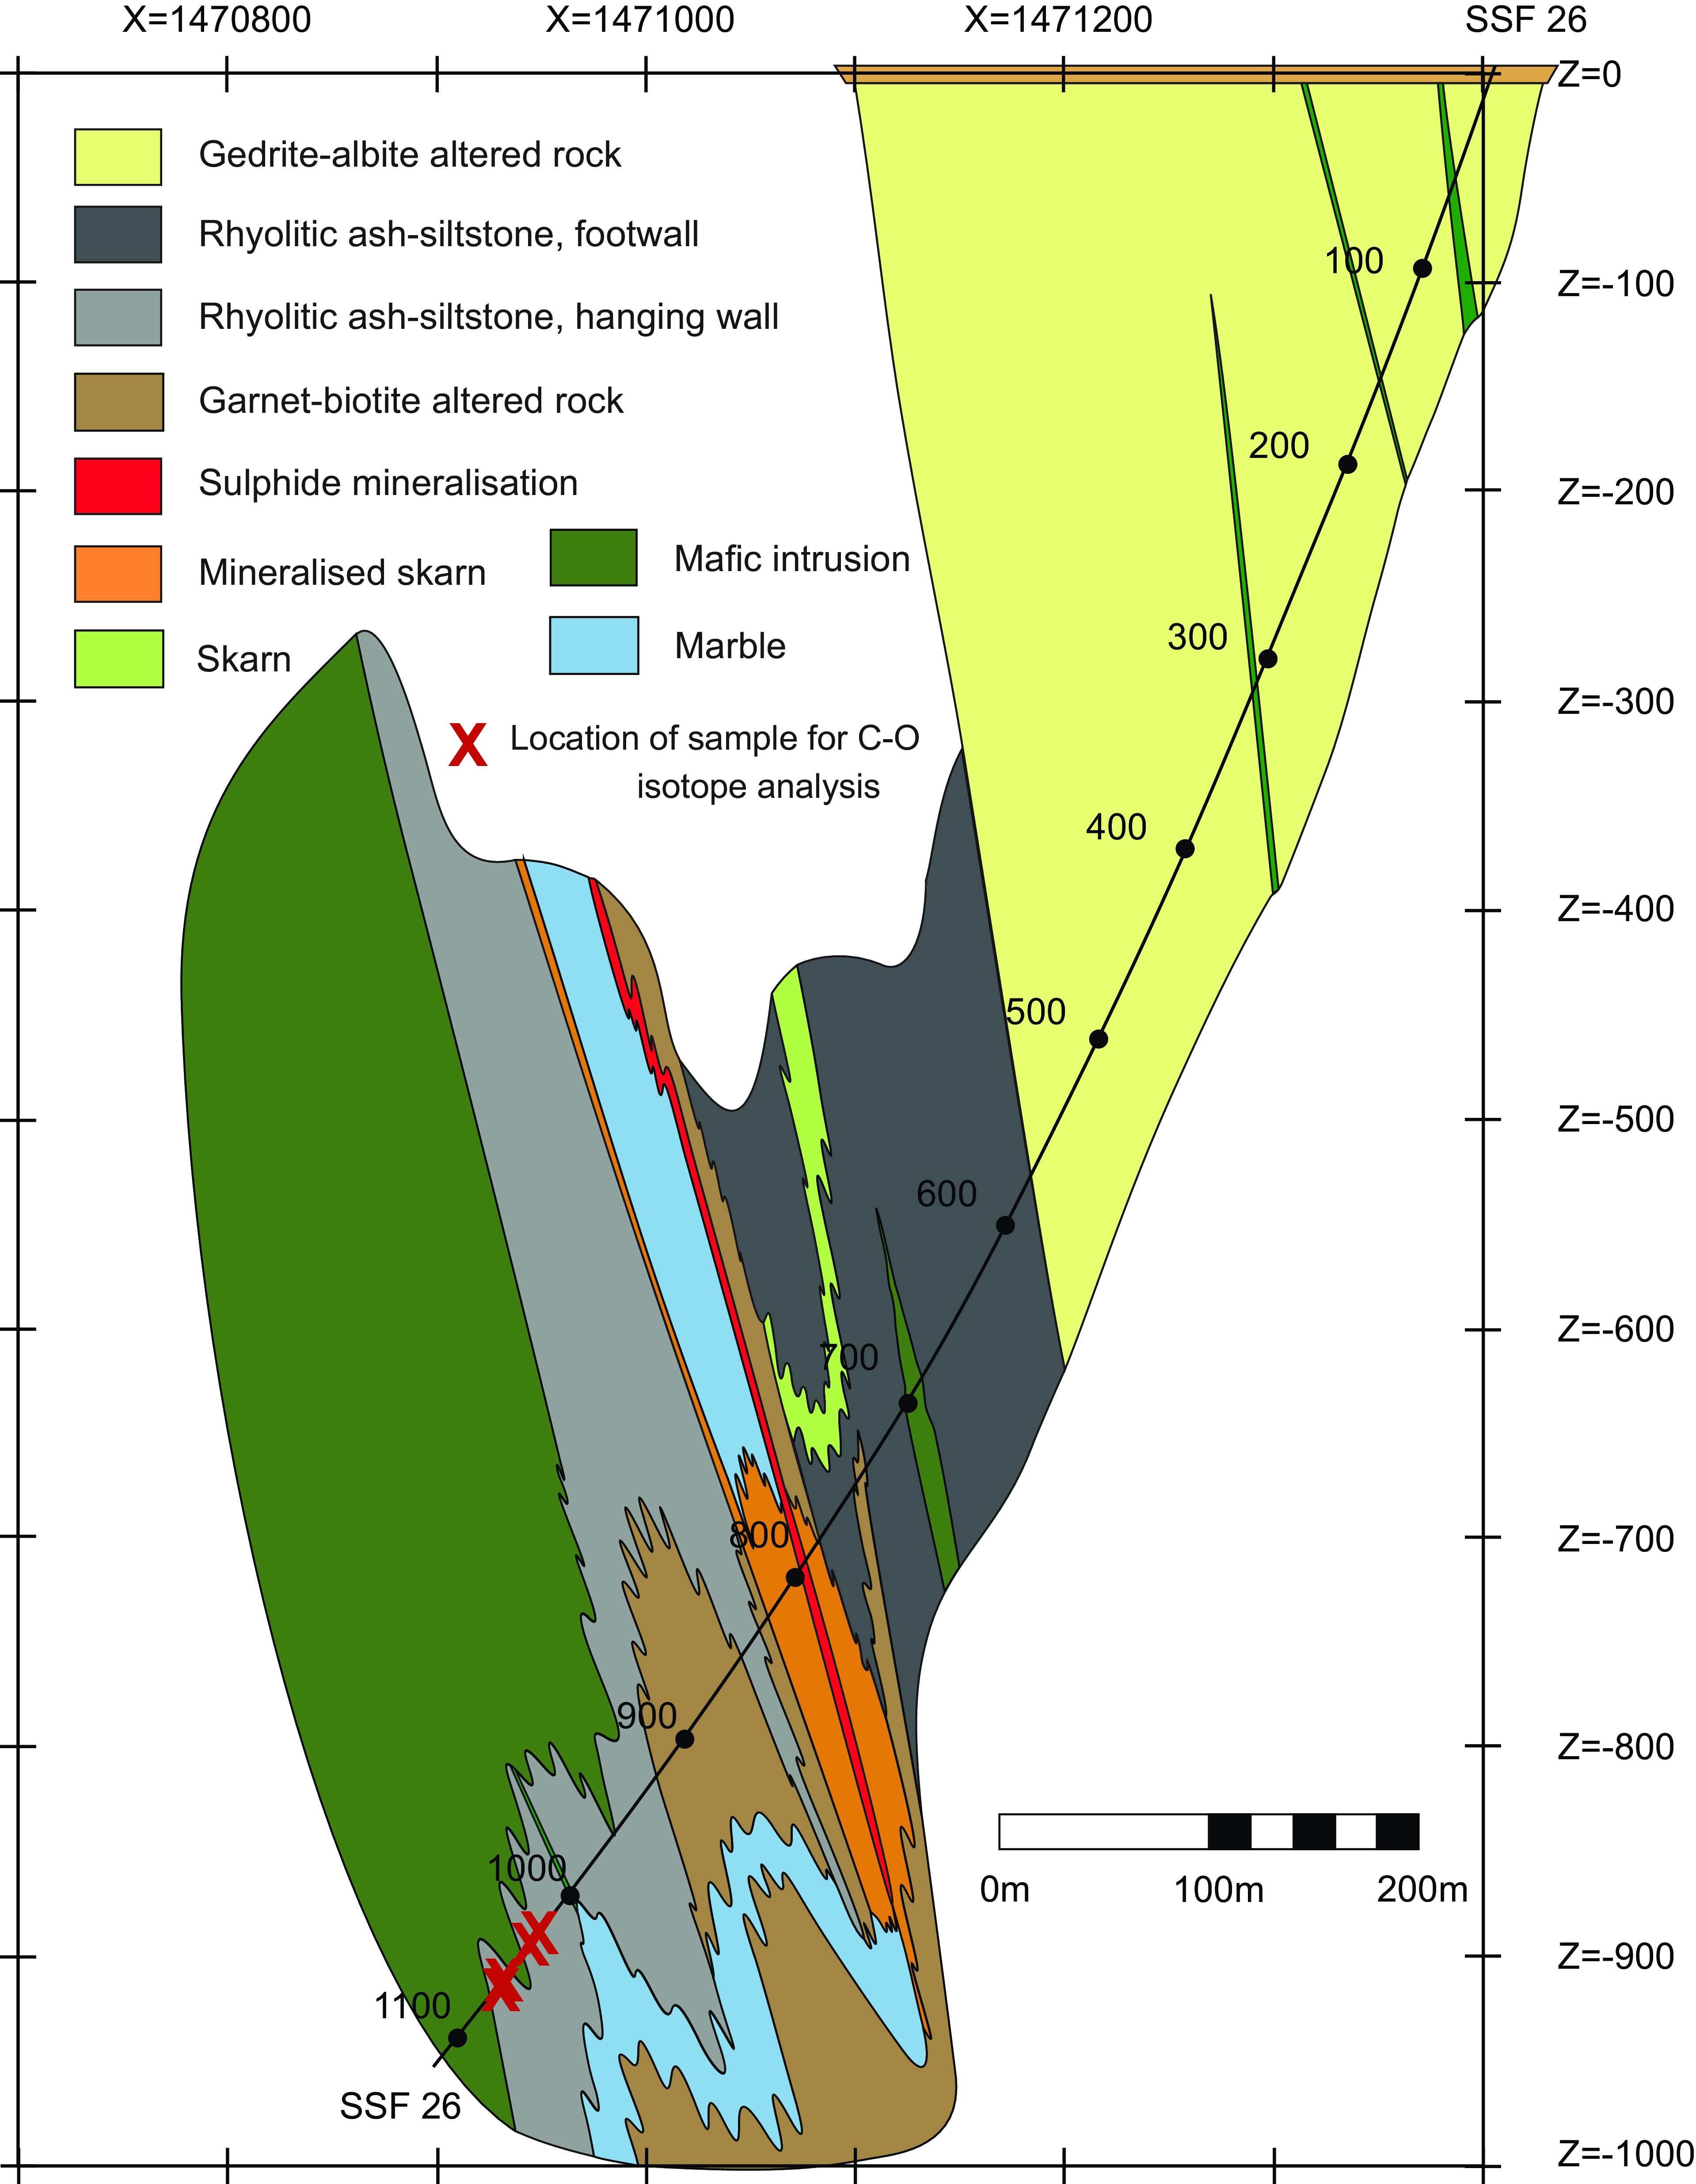
Geologic cross-section of the Dammberget deposit along grid coordinate 6675600, shown as Profile Y in Figure 2. Drill core SSF 26 intersects this cross-section and shows the location of C and O isotope samples. Grid is Swedish National Grid RT90.
Geologic cross-section of the Gränsgruvan deposit along grid coordinate 6677050, shown as Profile X in Figure 2. Drill cores GGR 125 and GGR 137 intersect this cross-section. The location of S, C and O isotope samples are indicated. Grid is Swedish National Grid RT90.

The deepest part of the stratigraphy occurs on the eastern side of the Stollberg syncline and consists of a thick sequence of a rhyolitic quartz-feldspar-phyric volcaniclastic sandstone and magnetite skarn (Jansson et al. Reference Jansson, Erismann, Lundstam and Allen2013). Note the term ‘phyric’ is used for volcaniclastic rocks in the Stollberg district with scattered larger phenocrysts in a fine-grained matrix as defined by Jansson et al. (Reference Jansson, Erismann, Lundstam and Allen2013). Overlying this package is the Staren limestone, which is a calcite marble locally altered to skarn. This, in turn, is overlain by limestone and rhyolite breccias, and conglomerates that are interbedded with limestone (Jansson et al. Reference Jansson, Erismann, Lundstam and Allen2013). This group of rocks is referred to as the Staren succession and is overlain by a 0.5 km thick unit of weakly altered feldspar + quartz-phyric pumice breccia-sandstone. Stratigraphically higher in the sequence is the so-called Stollberg limestone consisting of metamorphosed felsic volcaniclastic rocks, skarn and interbedded limestone that is hydrothermally altered near sulphide and magnetite mineralisation (Jansson et al. Reference Jansson, Erismann, Lundstam and Allen2013). Above the Stollberg ore trend, a thick package of bedded rhyolitic ash silt-sandstone, with local beds of pumice and lithic breccia fills the upper part of the Stollberg syncline. These hanging wall rocks to the sulphide mineralisation contain calc-silicate aggregates and local coarse accumulations of cordierite, andalusite and muscovite. Further details of the stratigraphy and lithology on the eastern side of the syncline are given in Ripa (Reference Ripa2012) and Jansson et al. (Reference Jansson, Erismann, Lundstam and Allen2013), while those for the deposits on the western side and northern end are given in Frank et al. (Reference Frank, Spry, Raat, Allen, Jansson and Ripa2019).
Sulphides occur in semi-massive zones, as disseminations and in veinlets with the dominant metallic minerals consisting of sphalerite, galena, chalcopyrite, pyrrhotite, pyrite, arsenopyrite and magnetite, along with rare gahnite (Table 1). Carbonates (mainly calcite) occur in marble units and in metamorphosed altered rocks as veins and clots. Ripa (Reference Ripa2012) identified sulphide zonation in deposits on the eastern limb of the Stollberg syncline (herein referred to as the eastern deposits) with sphalerite and galena being dominant in metalimestone, whereas chalcopyrite and pyrrhotite mainly occur in metarhyolite. A notable difference in the sulphide mineralogy for Gränsgruvan versus the eastern deposits is the high ratio of pyrite to pyrrhotite in the former; pyrrhotite is the dominant Fe sulphide in all other deposits in the Stollberg ore field. The metamorphosed altered rocks spatially related to the different deposits varies around the ore field. On the eastern side of the Stollberg syncline, a prominent zone of gedrite-albite rock occurs beneath the Dammberget, Baklängan, Stollberg and Korgruvan-Myggruvan deposits (Fig. 2). A unit up to 20 m wide consisting of a porphyroblastic garnet-amphibole-biotite±gahnite±cordierite±andalusite±sillimanite rock occurs immediately above some of the eastern deposits, where it is especially well exposed at Stollgruvan (Ripa, Reference Ripa1994; Jansson et al. Reference Jansson, Erismann, Lundstam and Allen2013). Metamorphosed altered rocks spatially associated with sulphides include quartz-garnet-pyroxene, cordierite-biotite, garnet-biotite rock, skarn, siliceous and sericitic rocks, with the last two alteration styles being prominent at the Gränsgruvan deposit (Fig. 3).
The timing relationships between skarn formation, sulphide formation and regional metamorphism are complex. Recent local observations in the Stollberg ore field by us suggest that massive salite (i.e. ferroan diopside) skarn pre-dates both massive semi-massive magnetite and sulphide mineralisation. However, observations elsewhere of sphalerite, galena, pyrrhotite, chalcopyrite, arsenopyrite and pyrite as inclusions in porphyroblasts of garnet and hedenbergite (Jansson et al. Reference Jansson, Erismann, Lundstam and Allen2013) suggest that sulphides were introduced prior to the formation of these anhydrous silicates. Syn-tectonic sulphide remobilisation is prevalent in the entire district which along with the lack of absolute ages for skarn silicates complicates interpretation and precludes generalisations. Specifically, it is unclear to what extent sulphides overprinting salite skarns represent syn-retrograde metamorphic, remobilised mineralisation cross-cutting peak metamorphic assemblages, or whether this cross-cutting relationship is a relict temporal feature of an original, premetamorphic mineral system where barren early anhydrous skarns were overprinted by sulphide-bearing, hydrous skarns.
Based on the variations in mineralogy and bulk rock compositions of skarn (i.e. Al-rich and Al-poor) spatially associated with sulphide mineralisation, Jansson et al. (Reference Jansson, Erismann, Lundstam and Allen2013) and Frank et al. (Reference Frank, Spry, Raat, Allen, Jansson and Ripa2019) suggested that skarn in the Stollberg ore field formed as a result of isochemical regional metamorphism of variable mixtures of limestone, rhyolite and iron oxides with the Al-rich skarns containing a higher proportion of hydrothermally altered rhyolite. Detailed descriptions of the metamorphosed altered rocks are given in Ripa (Reference Ripa1988, Reference Ripa1994, Reference Ripa2012), Björklund (Reference Björklund2011), Jansson et al. (Reference Jansson, Erismann, Lundstam and Allen2013), Raat et al. (Reference Raat, Jansson and Lundstam2013) and Frank et al. (Reference Frank, Spry, Raat, Allen, Jansson and Ripa2019, Reference Frank, Spry, O’Brien, Koenig, Allen and Jansson2022).
4. Analytical methods
Conventional sulphur isotopic analyses of sulphide powders for 41 samples (along with two duplicate analyses from the same sample) from drill core, obtained by crushing hand-picked sulphide grains using a binocular microscope, were performed via elemental analyser-continuous flow isotope ratio mass spectrometry (Studley et al. Reference Studley, Ripley, Elswick, Dorais, Fong, Finkelstein and Pratt2002) at the Indiana University Stable Isotope Research Facility. About 1-2mg of V2O5 and the sample powder (0.1–0.2 mg) were loaded into tin cups, combusted in an elemental analyser to form SO2 and analysed in a Finnigan Delta V stable isotope ratio mass spectrometer. International standards NBS-127, IAEA S-1, IAEA S-2 and IAEA S-3 with values of δ34S = +20.3 ‰, −0.3 ‰, +21.7 ‰ and −31.3 ‰ on the SO2-scale were used as reference standards. Sample reproducibility determined by multiple analyses of standards is ± 0.2 ‰; instrumental measurement uncertainty is less than 0.05 ‰. Results are given relative to Vienna Canyon Diablo troilite (VCDT) (Table 2).
Sulphur isotope compositions of sulphides from the Stollberg ore field
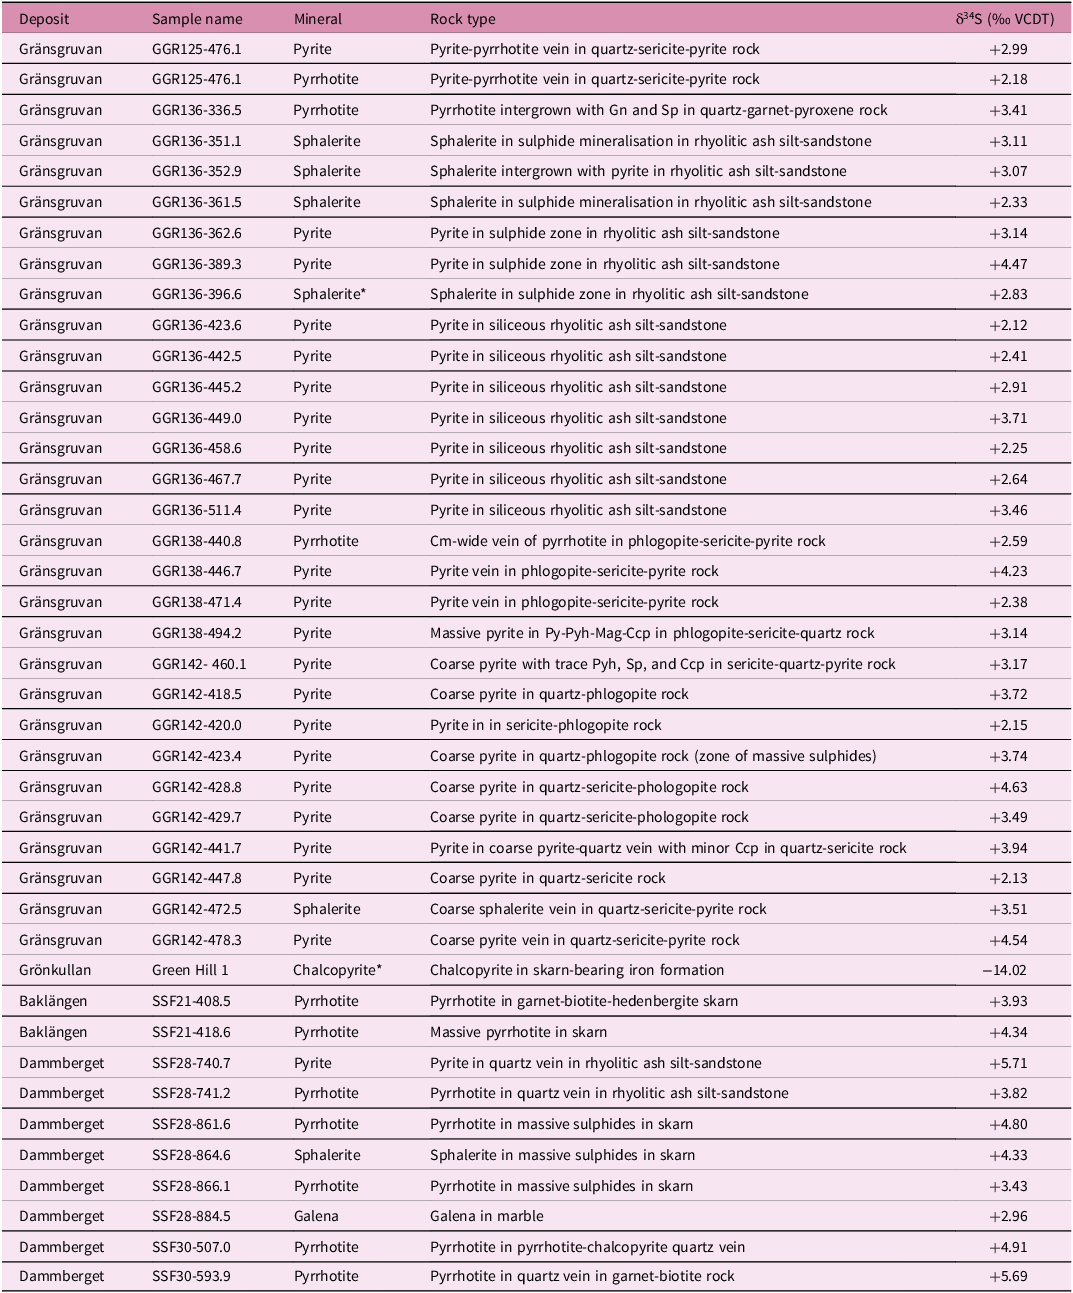
*Average of duplicate analyses.
Abbreviations after Warr (Reference Warr2021).
Carbon and oxygen isotope compositions were obtained from 23 samples of calcite from drill core and followed a modified CO2 extraction method of McCrea (Reference McCrea1950). Up to 2.7 mg of sample was reacted with H3PO4 at 50 °C in He-flushed vials. The released CO2 was measured in a Finnigan MAT Delta Plus XL mass spectrometer in continuous flow mode connected to a Gas Bench with a CombiPAL autosampler housed in the Department of the Earth, Atmosphere and Climate, Iowa State University. At least one reference standard was used for every five samples. Results given in Table 3 are relative to Vienna Pee Dee Belemnite (VPDB) and Standard Mean Ocean Water (VSMOW). The combined uncertainty (analytical uncertainty and average correction factor) for δ13C is ± 0.05 ‰ (VPDB) and δ18O is ± 0.06 ‰ (VPDB/SMOW), respectively, on the basis of two internal standards calibrated against primary reference standards (NBS-18, NBS-19, LSVEC).
Carbon and oxygen isotope compositions of calcite from the Stollberg district

SBS, sulphide-bearing biotite schist; RAS, rhyolitic ash silt-sandstone; QGP, quartz-garnet-pyroxene altered rock.
5. Results
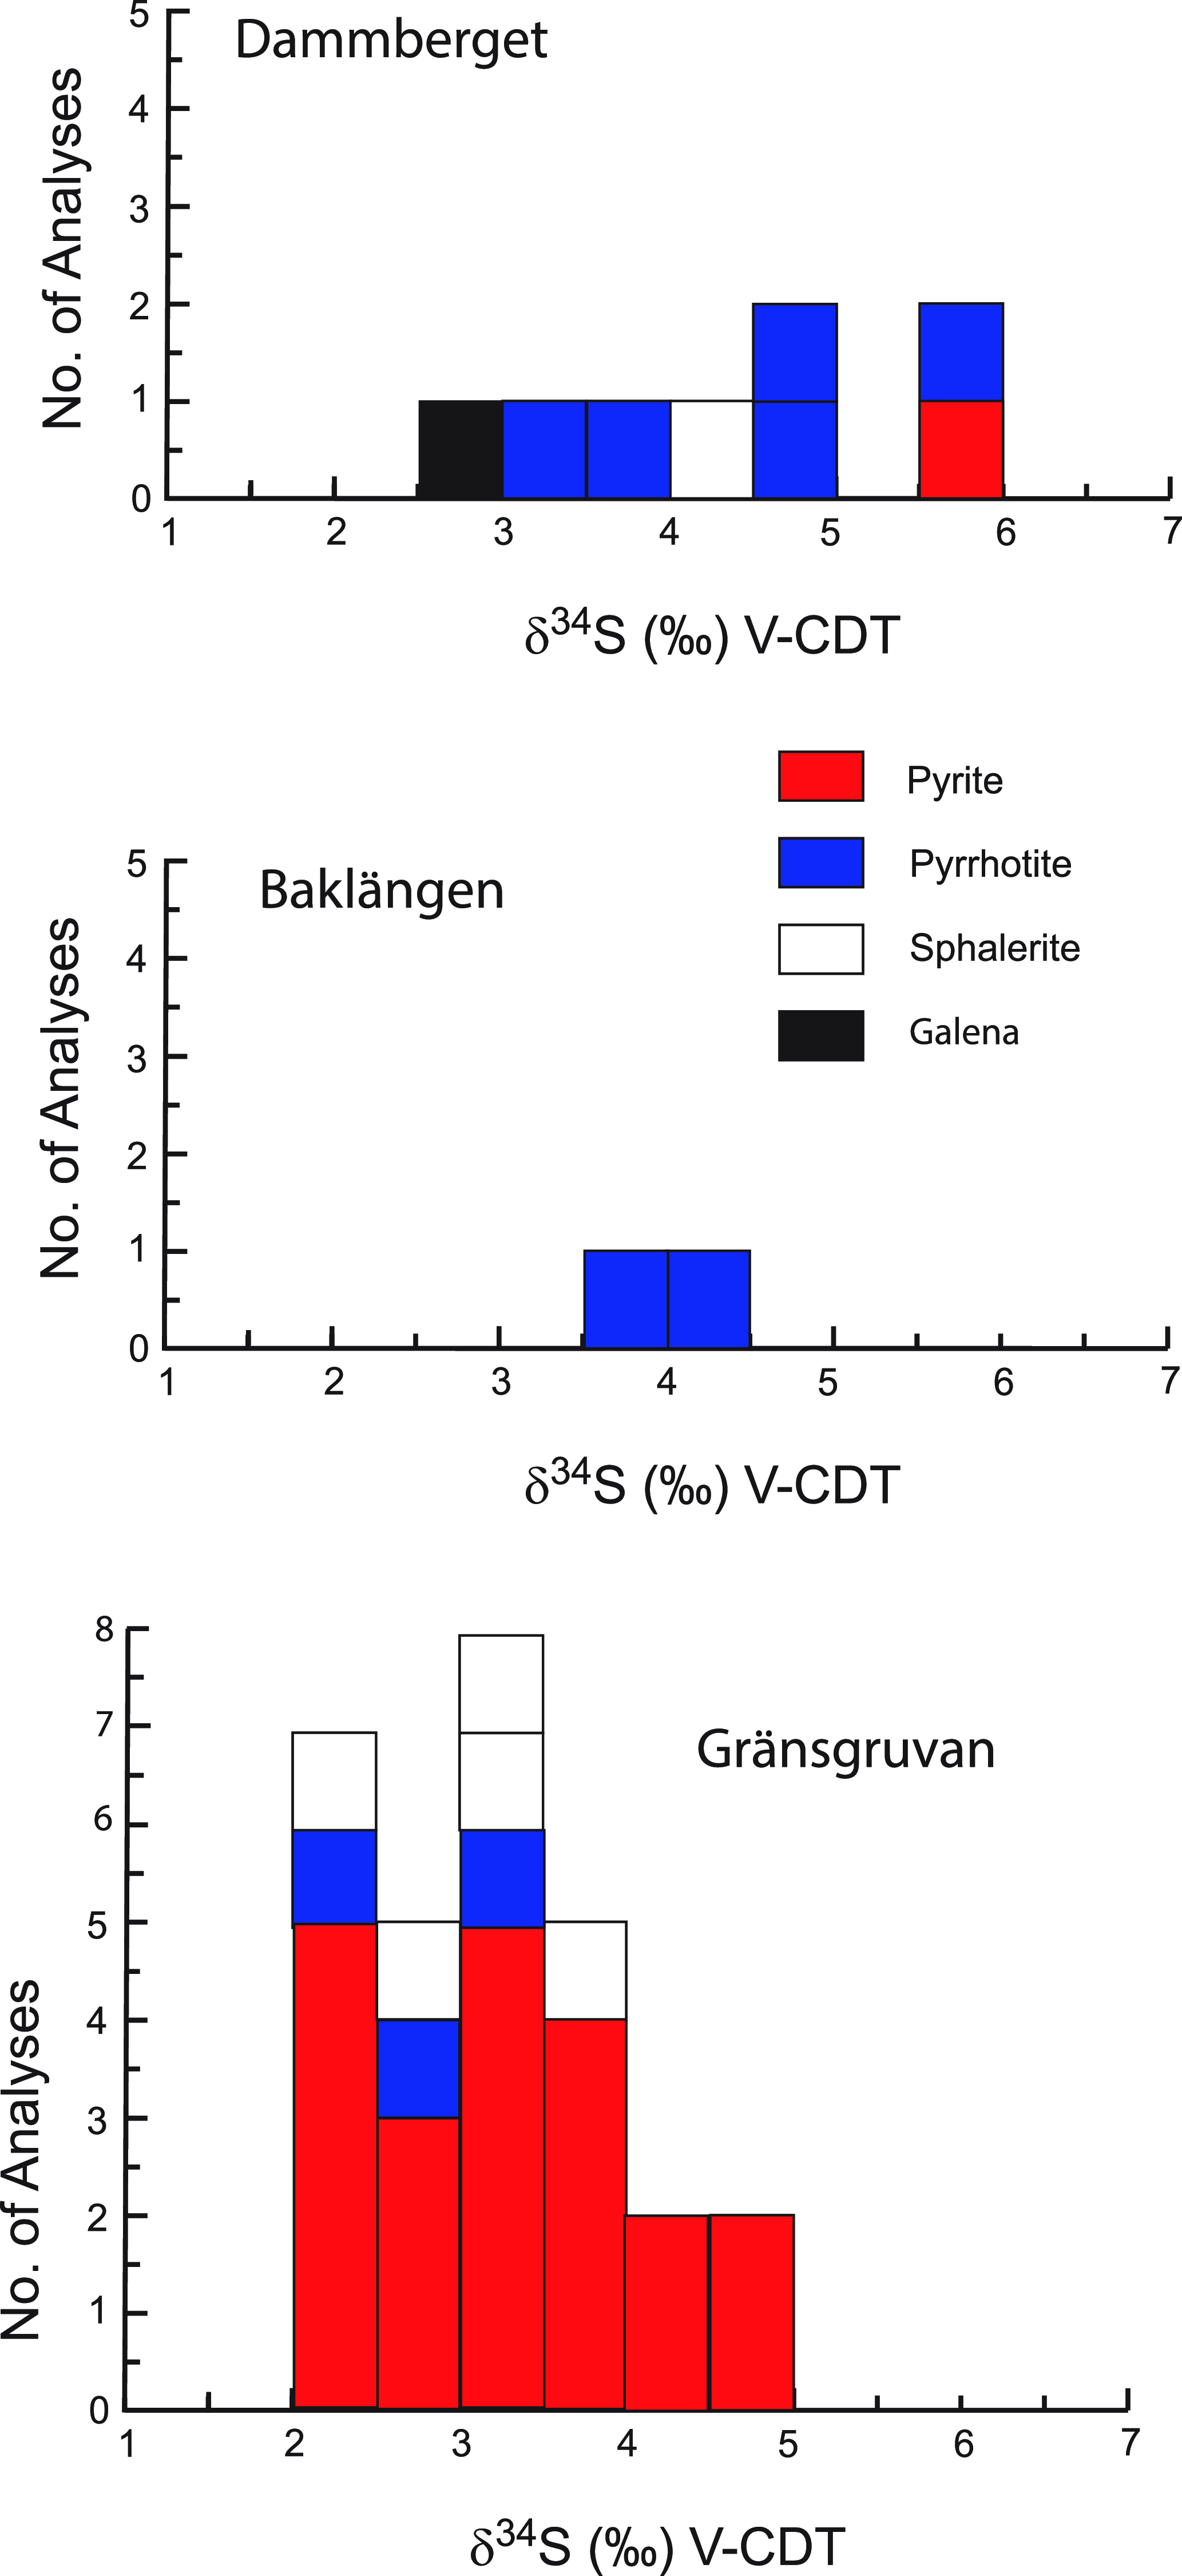
The sulphur isotope compositions of sulphides from the Stollberg ore field are shown in Table 2 and Figure 4. Of the 41 samples analysed here, 30 were of sulphides (pyrite, pyrrhotite and sphalerite) from the Gränsgruvan deposit, with all but one sample (GGR136 336.5, a quartz-garnet-pyroxene rock) derived from veins/veinlets, masses or disseminations in rhyolitic ash silt-sandstone, sericite-altered rocks or siliceous altered rock. Samples from Gränsgruvan have the following isotopic values: δ34Spyrite = + 2.12 to +4.54 ‰, n = 22; δ34Spyrrhotite = +2.18 to +3.41 ‰, n = 3; δ34Ssphalerite = +2.33 to +3.51 ‰, n = 5, whereas those from Dammberget show values of δ34Spyrite = +5.71 ‰, n = 1; δ34Spyrrhotite = +3.82 to +5.69 ‰, n = 4; δ34Ssphalerite = +4.33 ‰, n = 1; δ34Sgalena = +2.96 ‰, n = 1). Two samples of pyrrhotite from the Baklängan deposit have values of δ34Spyrrhotite = +3.93 and +4.34 ‰, whereas a sample of chalcopyrite in iron formation from Grönkullan has a very light isotopic value of δ34Schalcopyrite = −14.02 ‰. Given this anomalous value, relative to all the other samples analysed here, this sample was reanalysed to check whether there was an unforeseen problem with the analytical procedure. However, the same value (-14.00 ‰ and -14.04 ‰) was obtained within analytical uncertainty. The average sulphur isotopic values for samples from Gränsgruvan, Dammberget and Baklängan are δ34S = + 3.15 ‰ (n = 30), +4.46 ‰ (n = 8) and +4.14 ‰ (n = 2), respectively, which are similar regardless of the composition of the sulphide and the number of samples analysed.
Histograms showing the sulphur isotope compositions of the Dammberget, Baklängan and Gränsgruvan deposits in the Stollberg ore field.
Carbon and oxygen isotope compositions of calcite are shown in Table 3 and were obtained in skarn and sulphide-bearing schist from the Tvistbo deposit (δ13C = −9.41 to −0.11 ‰; δ18OVSMOW = −6.89 to +11.15 ‰; n = 7), marble, quartz garnet pyroxene altered rock, amphibolite and sulphide-bearing schist from Gränsgruvan (δ13C = −5.46 to +0.75 ‰; δ18OVSMOW = +8.91 to +13.40 ‰; n = 12) and sulphide-bearing schist from the Dammberget deposit (δ13C = −2.10 to -0.66 ‰; δ18OVSMOW = +10.01 to +14.06 ‰; n = 4). Sample DBH 82008 155.80, a skarn, is anomalous by comparison to other samples showing the lightest isotopic compositions (δ13C = −9.41 ‰ and δ18OVSMOW = −6.89 ‰) of all samples analysed here.
6. Discussion
6.a. Source of sulphur and physicochemical conditions of formation of Stollberg sulphides
In evaluating the general physicochemical conditions of formation of SVALS-type deposits, Jansson et al. (Reference Jansson, Erismann, Lundstam and Allen2013) and Kampmann et al. (Reference Kampmann, Jansson, Stephens, Majka and Lasskogen2017) suggested they formed from mineralising fluids that were acid, reducing and hot (> 250 oC), in part, based on the feldspar-destructive alteration style associated with sulphide mineralization, the presence of positive Eu anomalies in hydrothermal precipitates and the nature of the carbonate replacement/skarn formation. Jansson et al. (Reference Jansson, Allen, Skogsmo and Turner2021) proposed the temperature of the ore fluid at Sala was around 300 oC, while Kampmann et al. (Reference Kampmann, Jansson, Stephens, Majka and Lasskogen2017) considered that associated with sulphide formation at Falun to have been approximately 300° to 400 °C.
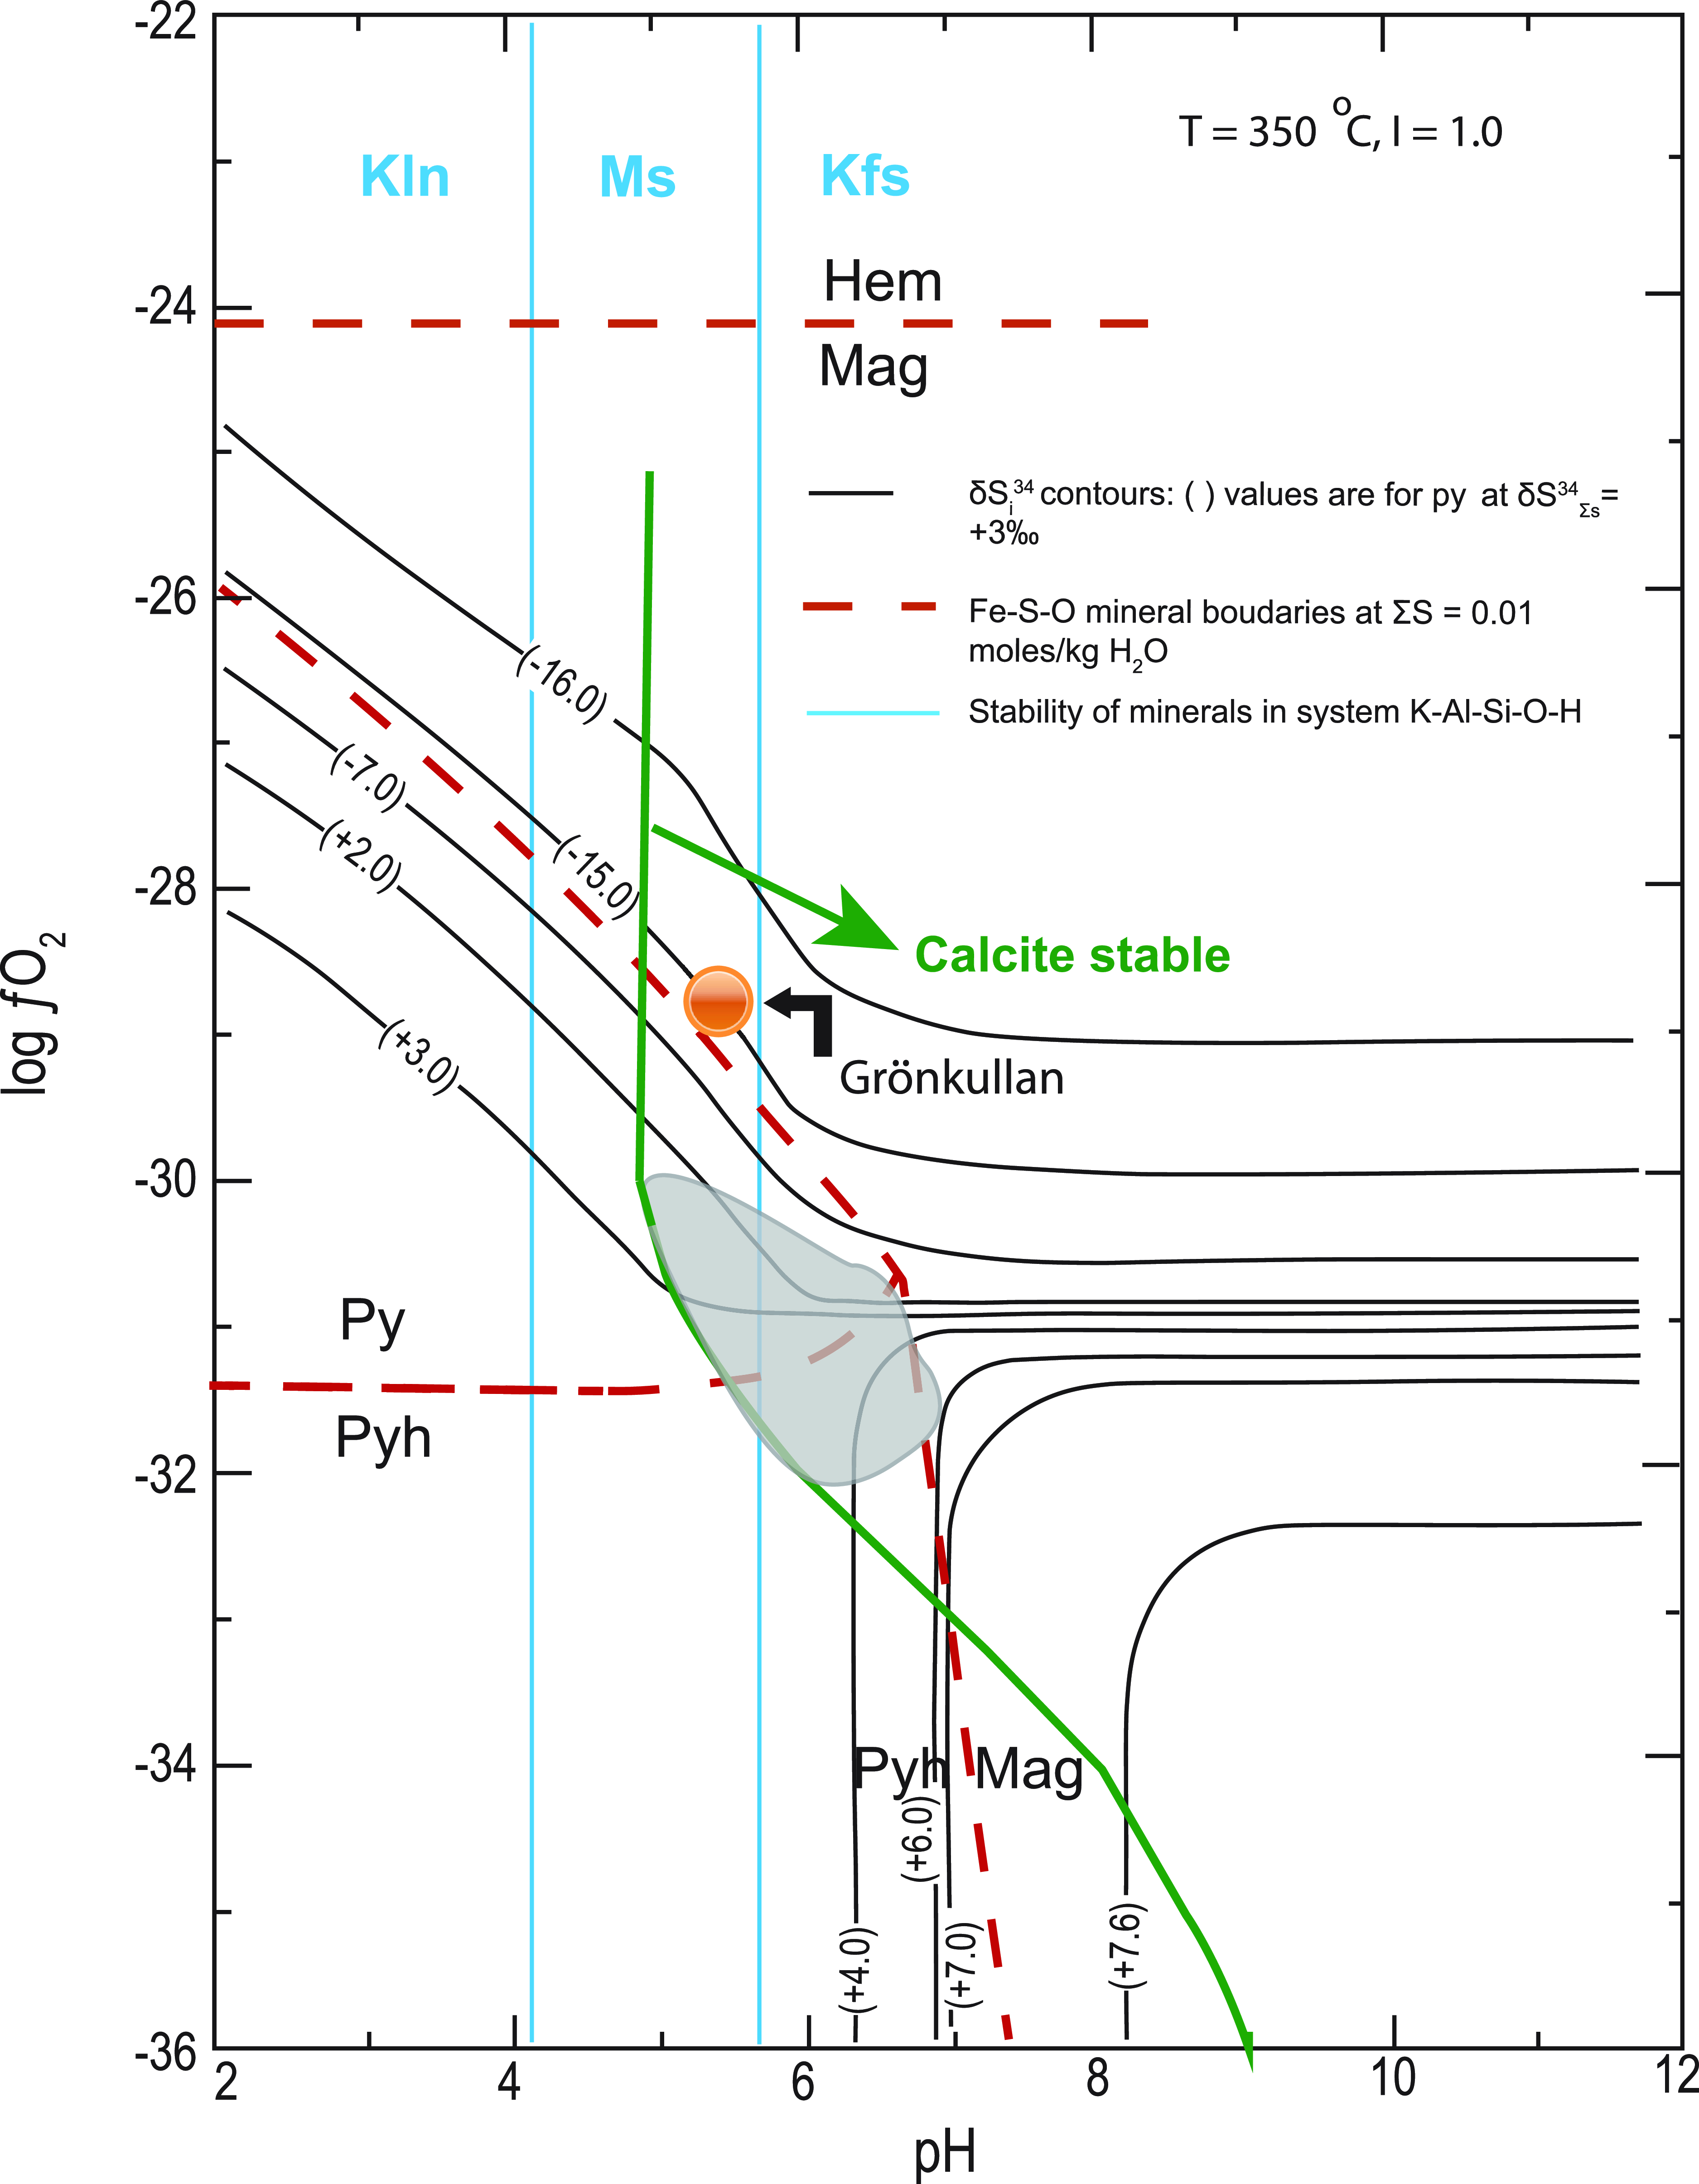
The absence of organic material (i.e. graphite) in the ore-forming sequence at Stollberg makes bacteriogenic sulphate reduction (BSR) and thermochemical sulphate reduction (TSR) of seawater an unlikely source of sulphur. Instead, the ore-forming conditions are compatible with inorganic reduction of seawater sulphate. In an attempt to model the approximate log fO2 and pH conditions of the premetamorphic ore-forming fluid, information on T, ionic concentration of the ore fluid (I) and δ34SΣS are required (Ohmoto, Reference Ohmoto1972). Further constraints can be made on the ore-forming conditions by knowing the stabilities of members of the systems Fe-S-O and K-Al-Si-O-H. The assemblage magnetite-pyrrhotite-pyrite, which is common in the Stollberg ore field, is a metamorphic assemblage, but there is no textural evidence to suggest that these three minerals did not precipitate from the premetamorphic ore-forming solution. In keeping with Jansson et al.’s (Reference Jansson, Erismann, Lundstam and Allen2013) assumption that the ore-forming fluid temperature in the Stollberg ore field was >250 oC, we have calculated possible premetamorphic conditions at temperatures of 250 o and 350 oC in fO2-pH space (Figs. 5 and 6). These figures have been drawn for values of δ34SΣS = +3 ‰ and + 17 ‰ (the latter assuming a 1.9 Ga seawater sulphate value of Claypool et al., Reference Claypool, Holser, Kaplan, Sakai and Zak1980), I = ∼1 m NaCl (approximate seawater salinity), and a total dissolved S content of 0.01 and 0.1 moles/kg H2O at T = 250 oC (Fig. 5), along with a total dissolved S content of 0.01 moles/kg H2O at T = 350 oC (Fig. 6). The presence of sericite, quartz, K-feldspar and pyrite in silica-altered rocks adjacent to the Gränsgruvan deposit (Frank et al. Reference Frank, Spry, Raat, Allen, Jansson and Ripa2019) as well as the likely precursor of the porphyroblastic garnet-amphibole-biotite altered rock associated with some of the eastern deposits, which Ripa (Reference Ripa1988) and Jansson et al. (Reference Jansson, Erismann, Lundstam and Allen2013) proposed was a sericite-chlorite-rich alteration zone, suggests that the ore-forming fluid was in the muscovite stability field close to or on the muscovite-K-feldspar equilibrium boundary (Figs. 5, 6). The sulphur isotopic compositions of pyrite are superimposed on Figures 5 and 6 noting that the range of isotopic compositions from the Stollberg ore field (δ34S = +1 to +6 ‰) fall along contours that occur near the pyrite-pyrrhotite-magnetite triple point regardless of the temperature (250 o or 350 oC) and the total dissolved S content chosen (0.01 or 0.1 moles/kg H2O) chosen. The stability field of the ore-forming fluid is further constrained by the stability of calcite, which is present in the ore. A value δ34SΣS of +3 ‰ may suggest a direct input from a magmatic source or from disseminated sulphides in the volcaniclastic pile associated with the ore trend. However, we also consider the possibility that the source of sulphur may have been entirely derived from contemporaneous Proterozoic seawater sulphate, without any contribution from an igneous source of sulphur, given that modified seawater was likely responsible for the widespread alteration associated with mineralisation. If a value of δ34SΣS = +17 ‰ is applied to Figures 5 and 6 instead of δ34SΣS = +3 ‰, contours for the values of δ34S = +1 to +6 % for Stollberg sulphides intersect the pyrite-magnetite join but never overlap the pyrrhotite stability field. Given that pyrrhotite is the most common member of the system Fe-S-O in metallic minerals in ore in the Stollberg ore field, nothwithstanding the pyrite:pyrrhotite ratio > 1 at Gränsgruvan, would suggest for a value of δ34SΣS = +17 ‰ that a premetamorphic ore-forming fluid was relatively oxidising and that the assemblage in the system Fe-S-O was pyrite-magnetite. If this was the case, then the premetamorphic assemblage would have to convert to pyrrhotite-magnetite and pyrite-pyrrhotite-magnetite during amphibolite facies metamorphism via the desulphidation of pyrite. It is more likely that the common presence of pyrrhotite in the Stollberg ore field is simply due to the premetamorphic ore assemblage being relatively sulphur-poor. This suggestion is consistent with the high abundance of iron oxides and iron silicates in the ore field (i.e. much Fe is not in sulphides), probably because the amount of sulphur was limited. Note also that there are other polymetallic sulphide deposits in the Bergslagen district (e.g. Falun, Garpenberg), which have been subject to amphibolite facies conditions, where pyrite is a stable metamorphic mineral and was not all converted to pyrrhotite. Regardless, primary premetamorphic pyrrhotite has not been observed at Stollberg. This may not be surprising given that pyrrhotite is such a ductile and mobile phase (Gilligan & Marshall, Reference Gilligan and Marshall1987). There are several examples in the Stollberg ore field where tectonically remobilised pyrrhotite occurs in post-D2 faults and fractures as well as in pressure shadows of silicate minerals. The one caveat to the idea that the ore fluid was relatively oxidising is that the anomalous value of δ34S = −14.02 ‰ for chalcopyrite in iron formation from the Grönkullan sample can be accounted for by equilibration of chalcopyrite at higher fO2 conditions with magnetite/hematite (Figs. 5, 6). However, it must be stressed that Grönkullan occurs stratigraphically below the Stollberg ore field and may not belong to the same fluid system. Given that only one sample was analysed here, the isotopic value is an outlier and the conditions of formation of sulphides at Grönkullan warrant further investigation.
Isothermal logfO2-pH diagram for the stability of sulphides in the system Fe-S-O from the Stollberg ore district. Sulphur isotope contours for pyrite are drawn for T = 250 oC, δ34SΣS = +3 ‰ and +17 ‰ (i.e. 1.9 Ga seawater sulphate value; Claypool, 1980), and I = 1.0. Minerals in the system Fe-S-O are shown for ΣS = 0.01 moles/kg H2O as red dashed lines and ΣS = 0.01 moles/kg H2O as red solid lines. The shaded region shows the approximate range of conditions for δ34S of pyrite over fO2-pH range indicated given the presence of the assemblages: pyrite-pyrrhotite, pyrite-pyrrhotite-magnetite, pyrite-magnetite and magnetite-pyrrhotite, as well as calcite. The stability field of calcite is shown for ΣC = 1 moles/kg H2O. Also shown are the stability fields of minerals in the system K-Al-Si-O-H, based on data from Hemley (Reference Hemley1959) where the abbreviations are Kln kaolinite, Ms muscovite and Kfs K-feldspar. The figure is modified after Ohmoto (Reference Ohmoto1972). The orange circle shows the approximate position for the chalcopyrite sample from Grönkullan. It is positioned on the δ34S = −14 ‰ contour for pyrite within the magnetite stability field.

Isothermal logfO2-pH diagram for the stability of sulphides in the system Fe-S-O from the Stollberg ore district. Sulphur isotope contours for pyrite are drawn for T = 350 oC, δ34SΣS = + 3 ‰ and I = 1.0. Minerals in the system Fe-S-O are shown for ΣS = 0.01 moles/kg H2O as red dashed lines. The shaded region shows the approximate range of conditions for δ34S of pyrite in fO2-pH space given the presence of the assemblages: pyrite-pyrrhotite, pyrite-pyrrhotite-magnetite, pyrite-magnetite and magnetite-pyrrhotite, as well as calcite. The stability field for calcite is shown for ΣC = 3 moles/kg H2O. Also shown is the stability field of minerals in the system K-Al-Si-O-H, based on data from Hemley (Reference Hemley1959) where the abbreviations are Kln kaolinite, Ms muscovite and Kfs K-feldspar. The figure is modified after Ohmoto (Reference Ohmoto1972). The orange circle shows the approximate position for the chalcopyrite sample from Grönkullan. It is positioned on the δ34S = −14 ‰ contour for pyrite within the magnetite stability field.
Regardless of the absence of an obvious spatially related igneous intrusion that may have been involved in the mineralising event, it cannot be ruled out that the ore system transitioned with time and burial to a metasomatic one probably involving magmatic-hydrothermal fluids. Nonetheless, despite this possibility, our preferred model to explain the alteration associated with the mineralisation and the observed sulphur isotopic values is for heated modified seawater to have circulated through the volcaniclastic pile and to have assimilated disseminated sulphide.
6.b. Metasomatism, subsea floor premetamorphic alteration or interaction with high-T fluids with carbonates at Stollberg?
When appraising the origin of limestones in the Stollberg ore field, Jansson et al. (Reference Jansson, Erismann, Lundstam and Allen2013) considered several possibilities based on textural and bulk rock geochemical data. For example, based on the presence of positive Eu anomalies in the Stollberg limestone, they suggested that the limestone could be a hydrothermal non-exhalative carbonate. They also considered the possibility that the limestone formed by microbial stromatolitic growth with a hydrothermal-exhalative component. In this regard, Jansson et al. (Reference Jansson, Erismann, Lundstam and Allen2013) recognised that the Stollberg limestone bore resemblance to the well-described stromatolitic limestone at Sala (Allen et al. Reference Allen, Bull, Ripa and Jonsson2003; Jansson et al. Reference Jansson, Allen, Skogsmo and Turner2021), even though primary stromatolitic textures have not been observed in the limestones at Stollberg. In places, the limestone contains elevated concentrations of Mn (i.e. percent levels), which is anomalous for metamorphosed limestones in the Bergslagen district. The presence of Mn along with the aforementioned positive Eu anomaly supports the concept of a hydrothermal-exhalative component to the limestone, possibly in the form of Ca+Mn carbonate. Alternatively, Jansson et al. (Reference Jansson, Erismann, Lundstam and Allen2013) opined that the elevated Mn and Eu concentrations of the limestone, which is locally dolomitic, may be the result of premetamorphic hydrothermal alteration of the limestone. Such Fe and Mn alteration has been demonstrated elsewhere in the Bergslagen district at Garpenberg by Allen et al. (Reference Allen, Bull, Ripa and Jonsson2003) and at Sala by Jansson & Allen (Reference Jansson and Allen2020) and Jansson et al. (Reference Jansson, Allen, Skogsmo and Turner2021).
In further considering the origin of carbonates at Stollberg, Jansson et al. (Reference Jansson, Erismann, Lundstam and Allen2013) noted that Billström et al. (Reference Billström, Äberg and Nord1985) analysed the C and O isotopic composition of four samples of the Stollberg limestone, which yielded values ranging from δ13CVPDB = −2.3 to −0.8 ‰ and δ18OVSMOW = +9.5 to +11.2 ‰, and one sample from the Staren limestone showed values of δ13CVPDB = −0.1 ‰, δ18OVSMOW = +10.9 ‰. The isotopic values obtained by Billström et al. (Reference Billström, Äberg and Nord1985) overlap the range obtained here (δ13CVPDB = −5.46 to +0.75 ‰ and δ18OVSMOW = +8.91 to +14.06 ‰) (Fig. 7), although this range does not include a single sample of calcite in skarn from Tvistbo (DBH82008 155.80), which possesses extremely negative isotopic values for both C and O (δ13CVPDB = −9.41 ‰ and δ18OVSMOW = −6.89 ‰). Notwithstanding this sample, which is conceivably the result of analytical error, the C and O isotopic values of carbonate in the Staren limestone are close to the average isotopic values of Late Proterozoic (i.e. Orosirian) dolomite and calcite (Shields & Veizer Reference Schields and Veizer2002). About half of the samples analysed here show C isotopic composition close to average values of Late Proterozoic carbonates, while the remainder are isotopically lighter. Values of δ18OVSMOW for carbonates analysed here are 6 to 11 ‰ lighter than the isotopic values of average Orosirian carbonate.
A plot of δ13C(VPDB) vs δ18O(VSMOW) for calcite samples from the Tvistbo, Gränsgruvan and Dammberget deposits in the Stollberg ore field. A single anomalous sample (i.e. DBH 82008 155.80, a skarn, which exhibits the lightest isotopic compositions (δ13C = −9.41 ‰ and δ18OVSMOW = −6.89 ‰) reported here is not shown. Drill hole numbers are shown for the Tvistbo, Gränsgruvan and Dammberget deposits. Symbols of samples derived from unlocated ore-associated limestone samples and carbonate in the Staren limestones in the Stollberg ore field from Billström et al. (Reference Billström, Äberg and Nord1985) are also shown. Note the isotopic compositions of these samples overlap with the data obtained here from Stollberg. Isotopic compositions from other SVALS-type deposits are also shown in the shaded areas: Garpenberg – A = calcite in mineralised skarn (Allen et al. Reference Allen, Bull, Ripa and Jonsson2003), Garpenberg – Dol = dolomite halo around mineralisation (Allen et al. Reference Allen, Bull, Ripa and Jonsson2003), Garpenberg – GV = limestone (L) and dolomite (D) associated with ore (Gebeyehu & Vivallo Reference Gebeyehu, Vivallo, Pagel and Leroy1991), Saxberget = ore-associated limestone (Billström et al. Reference Billström, Äberg and Nord1985), and Sala = dolomite marble, calcite marble and calcite gangue associated with mineralisation (Jansson et al. Reference Jansson, Allen, Skogsmo and Turner2021). Isotopic shifts are shown using the approach of Valley (Reference Valley1986) due to batch volatilisation (dashed grey lines) and Rayleigh volatilisation (solid grey lines). Modelling was done utilising fluid rock fractionation factors α18O (CO2-rock) of 1.006 and 1.012 (shown as ‘alpha’) for siliceous dolomite from Valley (Reference Valley1986). Shifts due to infiltration of a possible magmatic hydrothermal fluid at δ13C(VPDB) = −5 ‰ and δ18O(VSMOW) = +6.3 ‰ (Taylor & Sheppard, Reference Taylor and Sheppard1986) at T = 300 oC and XCO2 = 0.1 and 0.5 were modelled using the method of Bowman (Reference Bowman and Lentz1988). The global average for Orosirian calcite marble (star symbol), based on the Precambrian Marine Carbonate Isotope Database of Shields and Veizer (Reference Schields and Veizer2002), is shown along with the igneous fields for calcite from the mantle (Ray et al. Reference Ray, Ramesh and Pande1999) and mantle-derived primary carbonatites (Taylor et al. Reference Taylor, Frechen and Degens1967).

In evaluating the causes of the isotopically light C and O isotope values, the following factors need to be considered: 1. The sulphides were likely premetamorphic and subsequently subjected to amphibolite facies regional metamorphism; and 2. Sulphur isotope studies of sulphides suggest the primary involvement of modified seawater in the formation of the deposits, although the contribution of a magmatic-hydrothermal component cannot be discounted. To evaluate the reasons for the isotopically light C and O isotope values, we use the approach taken by Bowman et al. (Reference Bowman, O’Neil and Essene1985) for evaluating the origin of carbonates in hydrothermal systems.
One possible reason for the light isotopic values obtained here is that the marbles spatially associated with sulphide mineralisation may be products of the decarbonation of limestone during the amphibolite facies regional metamorphism. Modelling the effect of decarbonation can be done in two ways (batch volatilisation and Rayleigh volatilisation) that were proposed by Nabelek et al. (Reference Nabelek, Labotka, O’Neil and Papike1984) and Valley (Reference Valley1986). The difference between these two processes is that batch volatilisation involves a closed system with the evolved fluid equilibrating with the host carbonate, whereas Rayleigh volatilisation involves the continuous exchange and removal of the fluid during the volatilisation process. These processes have been modelled using an α factor of 1.006 appropriate for the decarbonation of a siliceous dolomite (Valley, Reference Valley1986) and a higher α value of 1.012 for comparison purposes, utilising starting δ13CVPDB and δ18OVSMOW values of least-altered dolomite (Fig. 7). However, regardless of which α factor is used, there is a maximum amount of 18O depletion that occurs via decarbonation reactions (Bowman, Reference Bowman and Lentz1998). So the effect of decarbonation during the amphibolite facies metamorphism may account for the light values of δ13CVPDB observed in some Stollberg carbonates but not the isotopic light values of δ18OVSMOW. Instead, the cause for the shift to light oxygen isotope values is likely a result of heated seawater that was modified as it interacted with the volcaniclastic sequence hosting the sulphide mineralisation. The modified seawater also produced the premetamorphic alteration associated with sulphide formation and an increase in the Mn and Mg content of carbonates that was reported by Jansson et al. (Reference Jansson, Erismann, Lundstam and Allen2013).
Given the possibility that the unaltered carbonate could have been altered by a magmatic-hydrothermal fluid, the isotopic compositions have also been modelled using a hypothetical fluid of δ13CVPDB = −5.0 ‰ and δ18OVSMOW = +6.3 ‰ (Taylor & Sheppard, Reference Taylor and Sheppard1986) for a T = 300 oC (i.e. midway between the T range used to calculate the S isotope calculations in Figure 5 and 6) and XCO2 = 0.1 and 0.5. The distribution of data obtained here, coupled with those of Billström et al. (Reference Billström1985), of light isotope data from Stollberg form an array that is consistent with a magmatic-hydrothermal fluid regardless of the host rock type and location. Note that the shape of the curves will vary only slightly if calculated at T = 250 or 350 oC. Although the distribution of the C and O isotope compositions of Stollberg carbonates resembles the knee-shaped curve characteristic of contact skarns where there is an interaction of a limestone horizon with magmatic-hydrothermal fluids from an adjacent causative intrusion, no such intrusive rock is currently known in the Stollberg ore field. The approach taken here has its limitations because it assumes that the knee-shaped trend is due to interaction of a single batch of magmatic-hydrothermal fluid. It ignores the possibility that isotopic compositions were modified during subsequent metamorphism. Another possible explanation for the knee-shaped curve of the isotopic compositions is a hybrid scenario, proposed by Bowman (Reference Bowman and Lentz1998), where early alteration causes a shift to lighter O isotopic compositions, along with decarbonation of carbonates with different starting C isotopic compositions.
6.c. Comparison of stable isotopic compositions with those from other SVALS-, SAS-type deposits in the Bergslagen mining district
Sulphur isotope values of δ34SVCDT = +1.12 to +5.71 ‰ for sulphides at Stollberg with averages of +3.15 to +4.46 ‰ for the three deposits studied here (Fig. 4) are higher than average isotopic composition of sulphides reported to date from other SVALS-type deposits in the Bergslagen district (Hällefors: δ34SVCDT = −0.6 to 2.7 ‰, Wagner et al. 2003 (Fig. 8a); Gruvåsen: −1.4 and + 1.5 ‰, Hellingwerf & van Raaphorst Reference Hellingwerf and van Raaphorst1988 (Fig. 8b); Falun: = −2.3 to −0.2 ‰, Gavelin et al. Reference Gavelin, Parwel and Ryhage1960 (Fig. 8c); Svärdsjö: = −4.0 to +3.0 ‰, Billström, Reference Billström1985 (Fig. 8d); and Sala: -1.07 to +4.17 ‰, Jansson et al. Reference Jansson, Allen, Skogsmo and Turner2021 (Fig. 8e). Such isotopic values are close to 0 ‰ and within the range of 0 ± 5 ‰ generally ascribed to a magmatic-hydrothermal or primordial volcanic source (Ohmoto, Reference Ohmoto1986). The values near 0 ‰ do not discern between a source of sulphur that was derived from a magma or leached from disseminated sulphides in the volcaniclastic pile associated with the deposits. Given that both sources of sulphur are ultimately the same, it is likely that they have a component of both of these sources. In the Bergslagen district, the dominant sulphide in the volcanic successions is pyrite, so that it is likely that pyrite was dissolved to liberate sulphur, which subsequently reacted with a metal-bearing solution from another source that contained Pb, Zn and Ag.
Histogram showing sulphur isotope compositions of SVALS- and SAS-type deposits. Data are for the following SVALS-type deposits. (a) Hällefors, Wagner et al. (Reference Wagner, Jonsson and Boyce2005); (b) Gruvåsen, Hellingwerf & van Raaphorst (Reference Hellingwerf and van Raaphorst1988); (c) Falun, Gavelin et al. (Reference Gavelin, Parwel and Ryhage1960); (d) Svärdsjö, Billström et al. (Reference Billström, Äberg and Nord1985); and (e) Sala, Jansson et al. (Reference Jansson, Allen, Skogsmo and Turner2021); and SAS-type deposits (f) Zinkgruvan, Billström (Reference Billström1991) and Jansson et al. (Reference Jansson, Zetterqvist, Malmström and Allen2017); (g) Lovisa, Jansson et al. (Reference Jansson, Sädbom, Allen, Billström and Spry2018).
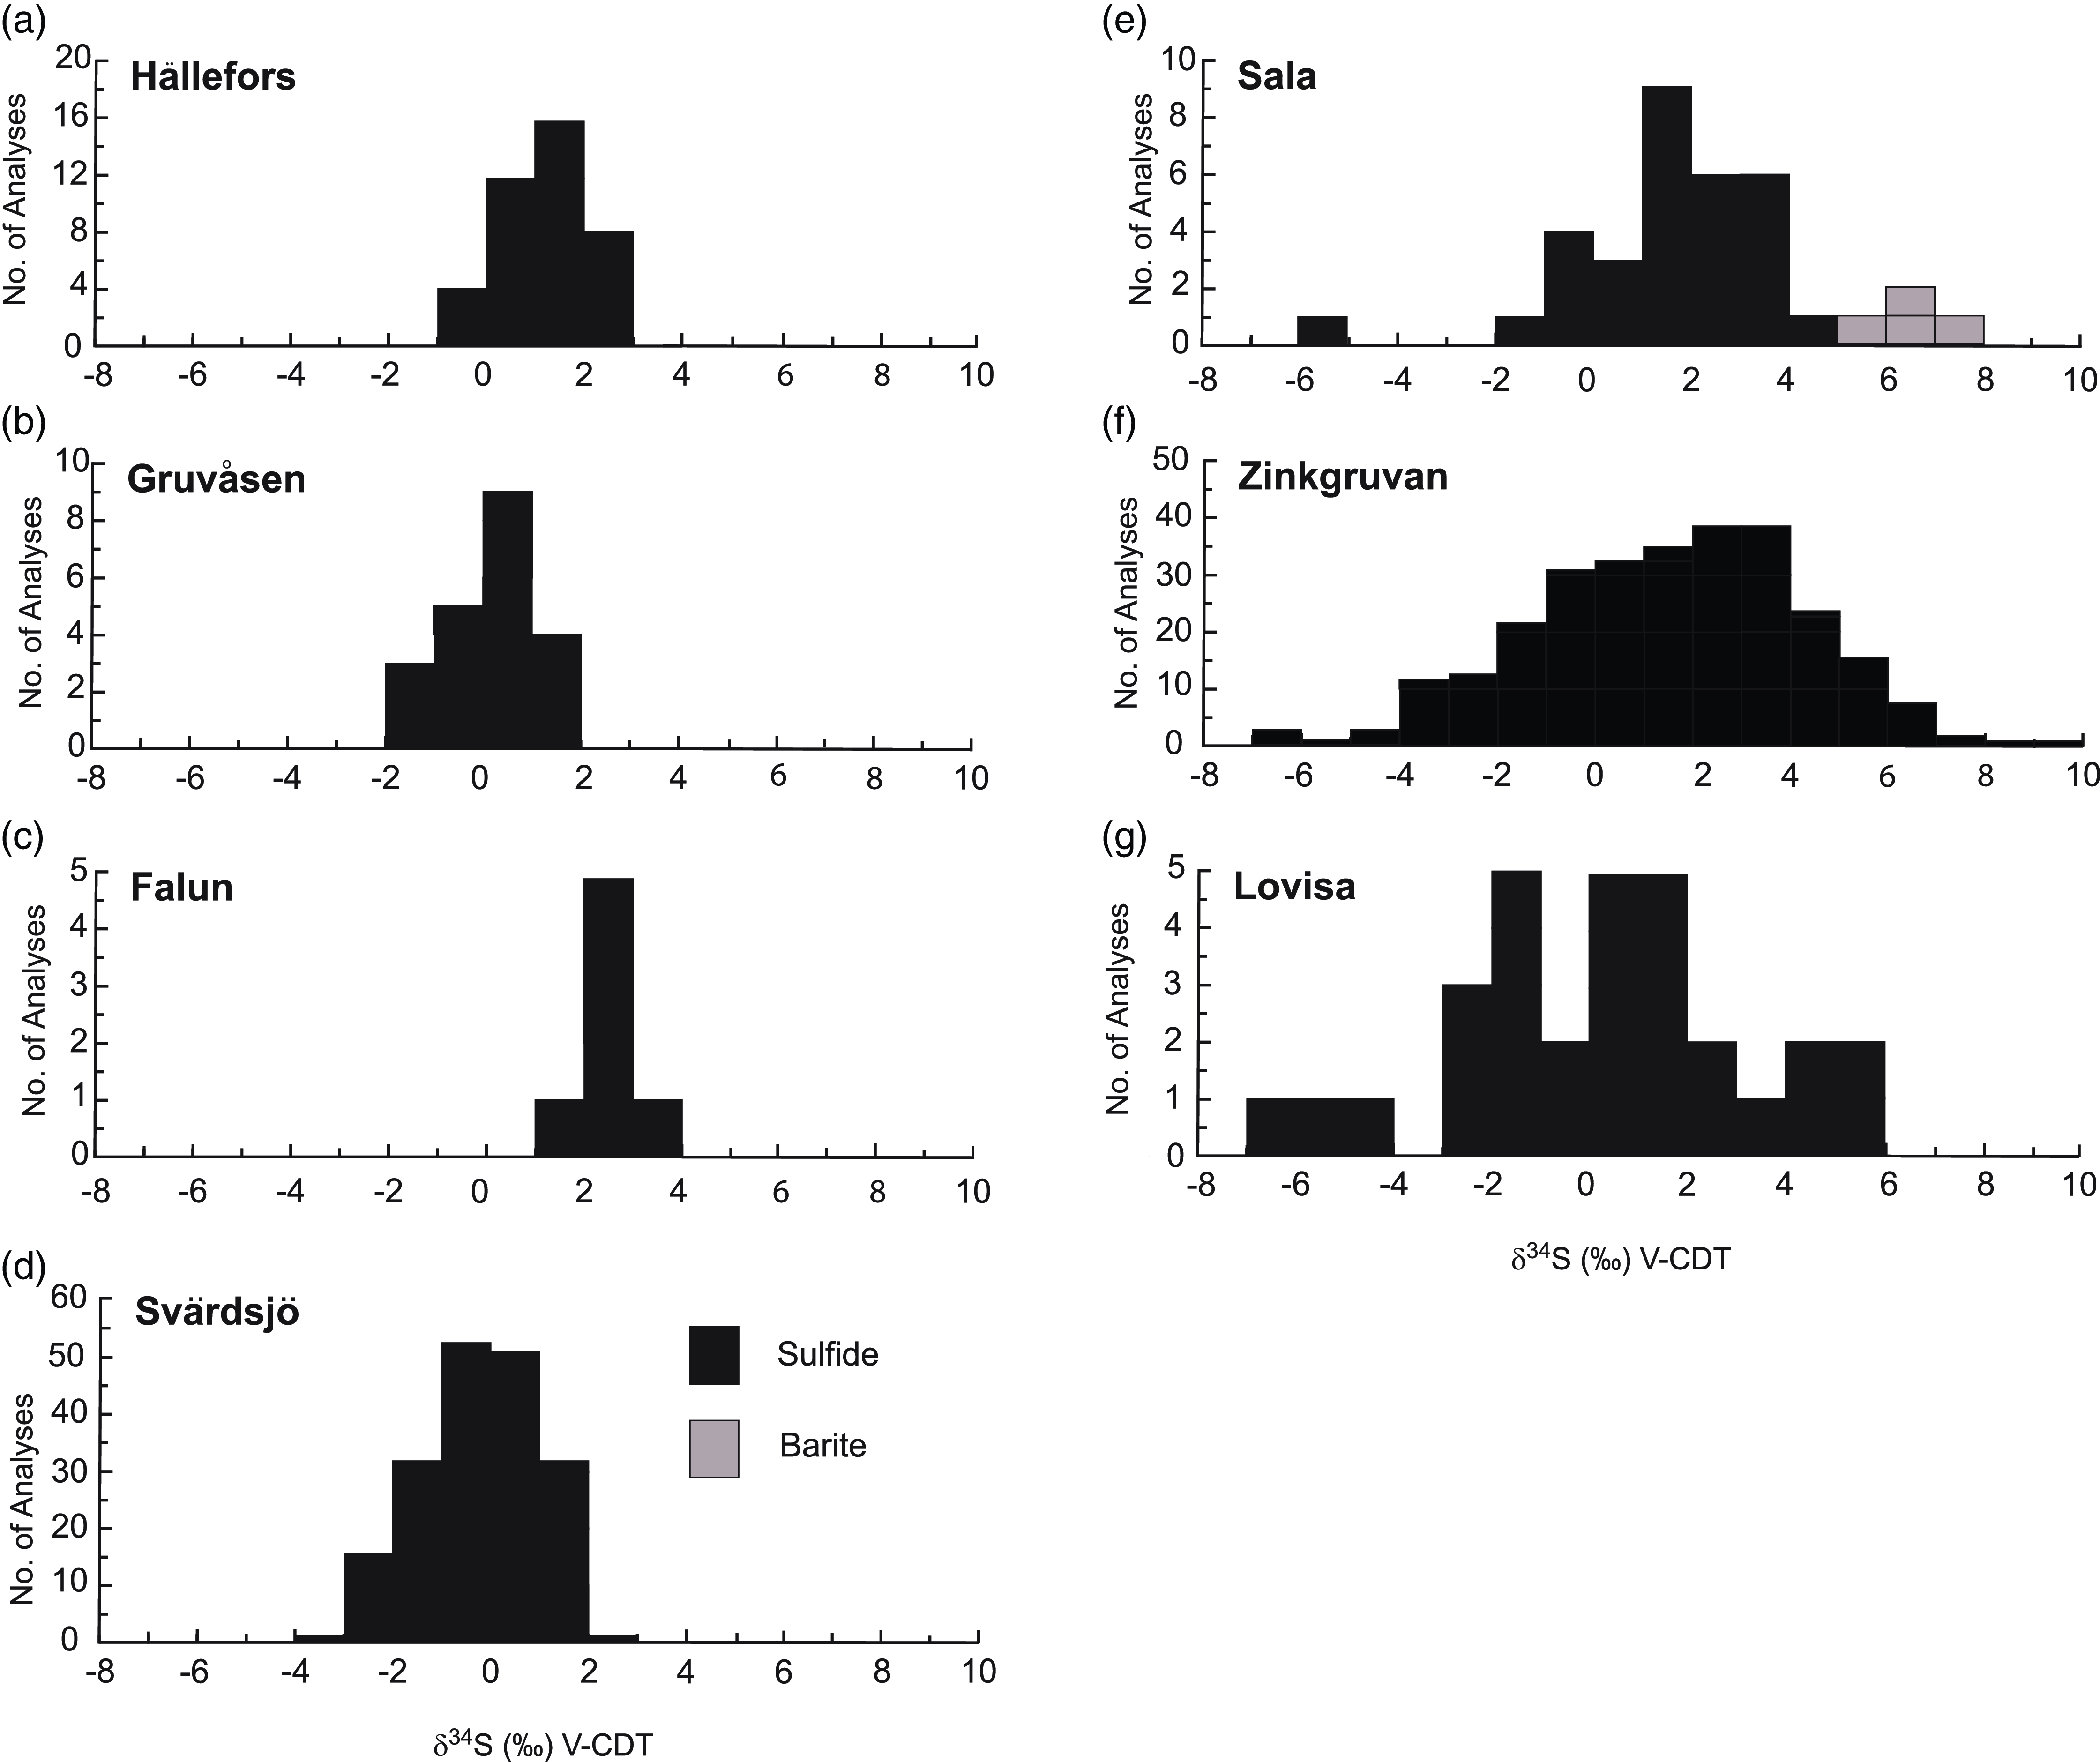
Although formed from lower temperature fluids (i.e. < 250 oC, Jansson et al. Reference Jansson, Zetterqvist, Malmström and Allen2017, Stephens & Jansson, Reference Stephens and Jansson2020), the sulphur isotope compositions of sulphides from SAS-type deposits also overlap with those from SVALS-type deposits (i.e. Zinkgruvan: δ34SVCDT = −6.5 to +16.5 ‰ (Fig. 8f), Billström, Reference Billström1991; Jansson et al. Reference Jansson, Zetterqvist, Malmström and Allen2017; Lovisa: −6.1 to +4.7 ‰ (Fig. 8g), Jansson et al. Reference Jansson, Sädbom, Allen, Billström and Spry2018) but generally exhibit a broader isotopic range. Jansson et al. (Reference Jansson, Zetterqvist, Malmström and Allen2017) invoked mixing between a magmatic-volcanic sulphur source from spatially related volcanic rocks and a reduced sulphur source derived from graphite-bearing interbedded siltstone, dolomite and mudstone spatially associated with the Zinkgruvan deposit. Stratiform SAS-type mineralisation also characterises the Lovisa Zn-Pb deposit. In this deposit, sulphide-bearing iron formation occurs stratigraphically below banded sphalerite ore, which in turn is overlain by the main ore zone consisting of laminated sphalerite, coarse galena-sphalerite veins and brecciated (durchbewegt) ore. Sulphur isotope compositions vary through the stratigraphic sequence with the isotopically lightest isotope values being associated with impregnated sulphides in the iron formation with the overall isotopically heaviest values in the sphalerite ore. The main ore zone values are centred around 0 ‰ (Jansson et al. Reference Jansson, Sädbom, Allen, Billström and Spry2018). The broad range of sulphur isotopic values for sulphides from Lovisa was interpreted by Jansson et al. (Reference Jansson, Sädbom, Allen, Billström and Spry2018) to be due to mixing of H2S from TSR and BSR seawater sulphate reduction and sulphur derived from the leaching of volcanic rocks, with the latter source being more important with time as sulphides precipitated in a shallow sedimentary basin.
A knee bend shape distribution of C and O isotopes in carbonates associated with other SVALS-type deposits (i.e. Garpenberg, Saxberget) can be seen in Figure 7 and resembles that shown for carbonates from the Stollberg ore field, although Garpenberg and Saxberget have O isotope values ∼ +3 to + 4 ‰ lighter than those from the Stollberg ore field. It should be noted that the isotopically lightest C and O isotope compositions for carbonates from the Garpenberg, Saxberget and Stollberg deposits overlap carbonate compositions derived from the mantle and primary carbonatite fields of Ray et al. (Reference Ray, Ramesh and Pande1999) and Taylor et al. (Reference Taylor, Frechen and Degens1967), respectively. Although such values support the concept of a magmatic-hydrothermal contribution to the ore fluid, they are not diagnostic of such a contribution. The presence of altered rocks composed of sericite, K-feldspar and pyrite at proposed ore fluid temperatures of around 250 o to 350 oC and the stabilities of minerals in the system Fe-S-O (assuming that pyrite, pyrrhotite and magnetite are primary) is compatible with a scenario in which the ore fluid was initially acidic and then became more alkaline as it interacted with limestone prior to regional metamorphism. Small reductions in the pH would allow dissolution and replacement of the carbonate by a warm to hot hydrothermal fluid.
Factors, other than the incorporation of a magmatic component to the ore fluid, which may explain the variable light C isotopes in the Bergslagen district include the composition of the ore fluid, the buffering of the wall rock, the nature of structures and lithological contacts, as well as the degree of decarbonation and fluid-rock alteration. For example, light C isotopes can also result from the incorporation of organic matter and hydrocarbons into the ore fluid. Such organic matter occurs in graphitic mudstones spatially associated with the Zinkgruvan deposit (Jansson et al. Reference Jansson, Zetterqvist, Malmström and Allen2017). In the Bergslagen district, ore-forming fluids which produced a lowering of δ18OVSMOW also precipitated SiO2 into an originally pure dolomite marble. This likely affected subsequent syn-metamorphic decarbonation reactions under amphibolite facies conditions. In such cases, syn-metamorphic decarbonation would more likely occur in an altered marble than in an unaltered marble. Another factor that will possibly affect values of δ13CVPDB is the control of lithological contacts as well as textural and structural features in the carbonate rocks resulting from premetamorphic alteration (e.g. vugs, breccia etc.) and subsequent syn-metamorphic alteration. For example, dolomitic limestone distal to any synsedimentary fault and away from any lithological contact would be less likely to be significantly altered by hydrothermal fluids, which would result in a lowering of δ18OVSMOW in comparison with that in limestone proximal to faults. Upon conversion to marble, porosity and permeability would decrease further which would inhibit decarbonation reactions. The isotopic compositions of the carbonates would not follow vectors that trend towards the primary carbonatite/mantle field (i.e. magmatic water box of Sahlström et al. Reference Sahlström, Jonsson, Högdahl, Troll, Harris, Jolis and Weis2019) but instead would retain a marine carbonate signature. In contrast, marble close to early faults would probably be more texturally complex and amenable to developing secondary porosity, and reactivated faults would be important in generating permeability to allow the CO2 generated by decarbonation reactions to effervesce or be flushed away, which would enhance driving decarbonation reactions. While these scenarios are speculative, they are ways to explain why decarbonation reactions would be more likely to occur in carbonates that were altered or to generate pathways between geological features. Such situations will ultimate produce variability in the C isotope composition among different lithologies and SVALS-/SAS-type deposits in the Bergslagen district.
The results of the current study are in keeping with the tantalising observation made by Billström et al. (Reference Billström, Äberg and Nord1985) and Allen et al. (Reference Allen, Bull, Ripa and Jonsson2003) that the depletion of δ13CVPDB (by at least 2 ‰) and δ18OVSMOW relative to Proterozoic limestone values could potentially be used as an exploration guide to carbonate-related metamorphosed massive sulphide deposits in the Bergslagen district. In the case of δ18OVSMOW values, Figure 7 suggests that values +12 to +15 ‰ lighter than the isotopic values of average Orosirian carbonate (Shields & Veizer, Reference Schields and Veizer2002) are useful indicators of hydrothermal processes, which may be related to, but not necessarily diagnostic of, ore-forming processes.
Conclusions
Sulphide occurrences in the Stollberg ore field are SVALS-type deposits that formed as semi-massive bodies hosted by marble, skarn and metavolcanic rocks. Modelling of sulphur isotope values, and stabilities in the systems Fe-S-O and K-Al-Si-O-H as well as calcite, for temperatures of 250 o to 350 oC, δ34SΣS = +3 and +17 %, I = ∼1 m NaCl, and a total dissolved S content of ∼0.01 and 0.1 moles/kg H2O are most compatible with sulphur being the product of inorganic reduction of Proterozoic seawater sulphate. Sulphur isotope compositions of sulphides from the Stollberg ore field, like those from other SVALS-type deposits, show a narrow range but are slightly heavier than those for other SVALS-type deposits. In comparison, sulphur isotope compositions of sulphides from SAS-type deposits in the Bergslagen district show a wider range of isotopic compositions likely due to the involvement of TSR and BSR of seawater sulphate. Modelling of carbon and oxygen isotope compositions of calcite from altered rocks and marble in the Stollberg ore field also resemble carbonates from other SVALS-type deposits in that they are isotopically light relative to carbonate in Proterozoic limestones. It is unclear whether marbles in the Stollberg ore field are stromatolitic or not, due to the lack of observed stromatolitic textures. Regardless, the C and O isotope compositions of calcite in the ore field are consistent with the involvement of limestone with modified seawater, which produced oxygen isotopic compositions in calcite lighter than those of spatially related marbles. The same fluids were also responsible for the premetamorphic altered rocks throughout the district. Decarbonation of limestone during the amphibolite facies regional metamorphism resulted in the light C isotope values. We emphasise the role of modified seawater in the ore-forming process since it is compatible with the observed S isotope values of sulphides and the O isotope compositions of carbonates in the Stollberg ore field. However, the incorporation of a magmatic-hydrothermal component to the ore-forming fluid cannot be ruled out. The isotopically light C and O isotope values of carbonates in metamorphosed massive sulphide deposits in the Bergslagen district constitute a potential exploration guide to ores of this type.
Acknowledgements
Boliden Mineral AB is gratefully acknowledged for funding this project. Discussions with Magnus Ripa (Geological Survey of Sweden) and Boliden Mineral AB geologists, particularly Hein Raat, Jan Olav-Öst and Eric Lundstam, about the geology of the Stollberg area are very much appreciated. We thank Ed Ripley and Suzanne Ankjersterne for assistance with the sulphur and carbon-oxygen isotope analyses, respectively. Kate Frank assisted with sample collection. The constructive reviews of Iain Pitcairn and an anonymous reviewer are appreciated and improved the quality of the manuscript. Tim Johnson is thanked for his editorial handling of the paper and his comments.


 Open access