


Introduction
Fruit flies (Diptera: Tephritidae) are among the most destructive invasive pests in agroforestry systems, accounting for substantial annual losses in fruit and vegetable production worldwide (Gutierrez et al., Reference Gutierrez, Ponti, Neteler, Suckling and Cure2021; Papadopoulos et al., Reference Papadopoulos, De Meyer, Terblanche and Kriticos2024). In Argentina and other South American countries, the native Anastrepha fraterculus and the exotic Ceratitis capitata are the most polyphagous and economically significant species, infesting an extensive range of cultivated and wild hosts (Ovruski et al., Reference Ovruski, Schliserman and Aluja2003; Segura et al., Reference Segura, Vera, Cagnotti, Vaccaro, De Coll, Ovruski and Cladera2006; Devescovi et al., Reference Devescovi, Liendo, Bachmann, Bouvet, Milla, Vera, Cladera and Segura2015; Funes et al., Reference Funes, Escobar, Meneguzzi, Ovruski and Kirschbaum2017). Their broad geographic distributions and frequent overlap in host use, including simultaneous exploitation of the same plant individual, underscore the importance of understanding their interactions (Liquido et al., Reference Liquido, McQuate, Hanlin and Suiter2017; Hernández-Ortiz et al., Reference Hernández-Ortiz, Barradas-Juanz and Díaz-Castelazo2019).
Ceratitis capitata was introduced into the Americas in 1901 (Norbom and Foote, Reference Norrbom, Foote, Robinson and Hooper1989) and was first recorded in Argentina shortly thereafter, likely entering through Buenos Aires, where it was detected infesting peach crops in 1905 (Vergani, Reference Vergani1952). An alternative hypothesis proposes a natural introduction from Brazil (González, Reference González1978). The species’ successful establishment and subsequent spread have been attributed to its broad climatic tolerance and pronounced ecological plasticity (Nyamukondiwa et al., Reference Nyamukondiwa, Kleynhans and Terblanche2010; Liquido et al., Reference Liquido, McQuate, Hanlin and Suiter2017), allowing it to colonise most of Argentina, from subtropical to subpolar latitudes (Vera et al., Reference Vera, Rodriguez, Segura, Cladera and Sutherst2002; Ovruski et al., Reference Ovruski, Schliserman and Aluja2003).
Research on fruit fly invasions and native–alien interactions has revealed that, although alien species rarely extinguish native ones, interspecific competition is often asymmetric, altering population dynamics and resource-use patterns (Duyck et al., Reference Duyck, David, Junod, Brunel, Dupont and Quilici2006; Malacrida et al., Reference Malacrida, Gomulski, Bonizzoni, Bertin, Gasperi and Guglielmino2007; Geurts et al., Reference Geurts, Mwatawala and De Meyer2012; Charlery De La Masseliere et al., Reference Charlery De La Masseliere, Ravigné, Facon, Lefeuvre, Massol, Quilici and Duyck2017; Moquet et al., Reference Moquet, Payet, Glenac and Delatte2021; Silva et al., Reference Silva, Roriz, Petitinga, Lima, Do Nascimento and Joachim‐bravo2021). Such competitive interactions, together with environmental variability and habitat structure, strongly influence infestation levels on shared hosts (Benavidez et al., Reference Benavídez, Ordano and Schliserman2021; Clarke and Measham, Reference Clarke and Measham2022; Hassani et al., Reference Hassani, Delatte, Ravaomanarivo, Nouhou and Duyck2022). Understanding how these factors interact is therefore essential for developing effective, ecologically informed management strategies.
Environmental conditions, including temperature, precipitation, barometric pressure, and solar radiation, are known to regulate physiology, behaviour, and population dynamics of fruit flies (Duyck et al., Reference Duyck, David, Junod, Brunel, Dupont and Quilici2006; Morán-Tejeda et al., Reference Morán-Tejeda, López-Moreno and Beniston2013; Aluja and Guillen, Reference Aluja and Guillen2025). Land use is an additional key driver: cultivated areas generally provide greater host availability and modified microclimatic conditions, leading to different infestation patterns compared with natural habitats (Schliserman et al., Reference Schliserman, Aluja, Rull and Ovruski2014; Flores et al., Reference Flores, Montoya, Ruiz-Montoya, Villaseñor, Valle, Enkerlin and Liedo2016). The combined influence of these factors contributes to the spatial and temporal complexity of infestation dynamics.
Despite their relevance, few studies have quantified infestation levels of C. capitata and A. fraterculus under natural or semi-natural conditions in Argentina (Devescovi et al., Reference Devescovi, Liendo, Bachmann, Bouvet, Milla, Vera, Cladera and Segura2015; Liendo et al., Reference Liendo, Devescovi, Boca, Cladera, Vera and Segura2016, Reference Liendo, Parreno, Cladera, Vera and Segura2018; Oroño et al., Reference Oroño, Aluja, Ovruski, Rull, Interdonato, Prado and Hilal2018). Most available research has focused on competitive mechanisms assessed experimentally (Liendo et al., Reference Liendo, Parreño, Pietrek, Bouvet, Milla, Vera, Cladera and Segura2020). Evidence indicates that exotic plants, particularly Citrus spp., commonly host C. capitata, while native plant species are more strongly associated with A. fraterculus (Ovruski et al., Reference Ovruski, Schliserman and Aluja2003; Segura et al., Reference Segura, Vera, Cagnotti, Vaccaro, De Coll, Ovruski and Cladera2006; Calvo et al., Reference Calvo, Delgado, Duarte, Garcia, Scatoni and González2022). Furthermore, C. capitata abundance increases in disturbed habitats, whereas A. fraterculus is more prevalent in wild vegetation (Ovruski et al., Reference Ovruski, Schliserman and Aluja2003; Segura et al., Reference Segura, Vera, Cagnotti, Vaccaro, De Coll, Ovruski and Cladera2006; Schliserman et al., Reference Schliserman, Aluja, Rull and Ovruski2014). These patterns likely reflect the evolutionary history between each fruit fly species and its preferred host plants (Segura et al., Reference Segura, Vera, Cagnotti, Vaccaro, De Coll, Ovruski and Cladera2006; He et al., Reference He, Chen, Jiang and Pan2021). Consequently, infestation levels on shared host species are expected to vary with both host origin and habitat type. However, a systematic comparison of infestation distributions for both species on shared host plants in northwestern Argentina remains unaddressed.
In this study, we compiled and synthesised published data on infestation levels of C. capitata and A. fraterculus on native and exotic host plants in northwestern Argentina. Our objectives were (1) to summarise infestation levels of both species across host plant species in the region and (2) to assess the potential influence of environmental unit type and altitude on infestation intensity. We hypothesised that (1) infestation levels of both fruit fly species decrease with increasing altitude and (2) infestation levels are higher in cultivated areas than in natural areas.
Materials and methods
Data search and criteria for data selection
We reviewed the literature available in Web of Science and Google Scholar using the words ‘fruit’, ‘infestation’, ‘Ceratitis capitata’, and ‘Anastrepha fraterculus’ along with the name of each province of Northwest Argentina (Catamarca, Jujuy, Salta, Santiago del Estero, and Tucumán). We searched for published documents in any year (until 8 March 2022) or language. We then examined the references of these studies to find earlier publications.
We included studies that reported a measure of infestation level only for C. capitata and A. fraterculus fruit fly species (criteria 1), collected data from field conditions in Northwest Argentina (criteria 2), specified locality, sampling date, and host plant species (criteria 3), and data at the plant species level (criteria 4). We excluded studies that did not meet these criteria. Ultimately, we included 140 cases from 12 studies in our analysis. Northwestern Argentina was selected due to previous experience in the region, the importance of fruit production, and the need to develop integrated pest management strategies for the region (Ovruski et al., Reference Ovruski, Schliserman and Aluja2003; Schliserman et al., Reference Schliserman, Aluja, Rull and Ovruski2014). The database utilised in this study reflects the limited availability of published fruit fly infestation records for the region, resulting from a scarcity of standardised and long-term datasets rather than limitations in our search strategy. The limited number of research groups working on this topic leads to some overlap in authorship among studies, underscoring the need for standardised and reproducible data collection and reporting protocols. In this context, the dataset compiled here is regarded as the most reliable information available, as it is based on consistent and standardised criteria.
Data extraction
For each study case, the following variables were recorded: year of the study, location, geographical coordinates and altitude (meters a.s.l.), fruit fly species (C. capitata, A. fraterculus), identity of the host plant (order, family, genus, species), origin of the plant species (native or exotic to northwest of Argentina), landscape unit (wild, crop, mixed), and fruit infestation level. The fruit infestation level was defined as the number of individuals of a given stage (pupae or adult) per measurement unit (kilogram; see Benavídez et al., Reference Benavídez, Ordano and Schliserman2021 for more details). The complete database and variable descriptions are provided in supplementary material (Appendix S1). Plant species nomenclature follows Zuloaga et al. (Reference Zuloaga, Morrone and Belgrano2016).
Statistical analyses
The infestation level was calculated as the number of individuals per kilogram of fruit (Benavídez et al., Reference Benavídez, Ordano and Schliserman2021). Individuals were defined as either pupae or adults emerging per kilogram. Most records corresponded to adult emergence, while a smaller number reported pupae counts. Since pupae represent the developmental stage immediately preceding adult emergence, both measures were considered comparable indicators of infestation intensity. All data were standardised as individuals per kilogram for analyses (Benavidez et al., Reference Benavídez, Ordano and Schliserman2021).
The distribution patterns of infestation levels among host plant species for each fruit fly species were described using mean values ± standard deviation (SD). The mean values were calculated as the arithmetic mean of the infestation level (pupae or adults per kg) across all repetitions (n) for each host plant species. For each host plant, infestation values from all samples were summed and divided by the total number of samples for that species. For host plant species with only a single infestation value, the reported value from the original publication was used. Differences in infestation levels of C. capitata and A. fraterculus according to the origin of host plant, plant family, and host species were evaluated using Kruskal–Wallis tests, followed by pairwise Dunn’s tests with Bonferroni correction (Zar, Reference Zar1999). To assess the variance structure of infestation levels across landscape units, origin of host plant species, plant family, and host plant species, we compared between-group and within-group variances using non-parametric permutation tests (Legendre and Legendre, Reference Legendre and Legendre2012). Statistical significance was assessed at α = 0.05.
Additionally, we fitted generalised additive models (GAMs) with a negative binomial distribution to examine the relationships between altitude, landscape unit, and infestation level for each fruit fly species (Wood, Reference Wood2017). Altitude and landscape unit were used as explanatory variables and infestation level as the response variable. These models are suitable for capturing non-linear relationships and addressing overdispersion in count data. Prior to model fitting, Mantel tests were conducted to evaluate potential spatial autocorrelation in infestation levels based on geographic distance among sampling sites (Mantel, Reference Mantel1967). For A. fraterculus, the Mantel test revealed a significant positive correlation between infestation level and geographic distance (r = 0.235, p = 0.038). In this case, spatial structure was accounted for by incorporating smooth terms for geographic coordinates into the GAM framework. Model fit and selection statistics supported the inclusion of spatial effects in the analysis.
All statistical analyses and graphs were conducted in the R environment (R Core Team, 2024), using the packages mgcv (Wood, Reference Wood2017) and ggplot2 (Wickham, Reference Wickham2016). The R code is available in Appendix S2.
Results
Host plant diversity
According to our criteria, 21 and 23 host plant species were identified from 16 and 18 genera in 11 families with infestation data for A. fraterculus and C. capitata, respectively (table 1). A total of 17 host plant species were recorded as infested by both fruit fly species, with the plant family exhibiting the highest number of shared host species being Rosaceae, represented by eight species (table 1).
Host plant species of Ceratitis capitata (Cc) and Anastrepha fraterculus (Af) reported with data of infestation level in northwestern Argentina

Table 1 Long description
The table lists host plants by family and species, noting whether each plant is native or exotic, the fruit fly species reported, land use type, and mean infestation levels per kilogram of fruit for Ceratitis capitata and Anastrepha fraterculus. Anastrepha fraterculus is highest in Psidium guajava, with other high values in Rubus species and Juglans australis, and also elevated in Eugenia uniflora and Chrysophyllum gonocarpum. Ceratitis capitata is highest in Ficus carica and is also high in Prunus persica, Eugenia uniflora, Eriobotrya japonica, Passiflora caerulea, and Juglans australis. Several hosts show near-zero or zero infestation for one species, including Af in multiple Citrus species and in Passiflora caerulea, and Cc in Inga marginata. Many hosts are shared by both flies across mixed, crop, and wild land uses, while some are associated with only one fly in the records. Variation is large for some plants, especially guava, Rubus, and Juglans, so comparisons should consider the reported spread around the means.
Note: The infestation level variable was standardised as individuals per kilogram of fruit.
Variation in infestation levels among plant family
Infestation levels varied among plant families. For A. fraterculus, the highest infestation levels were observed in Myrtaceae and Juglandaceae, which demonstrated significant differences in post hoc comparisons (fig. 1). Conversely, Sapotaceae exhibited relatively high values but was not involved in significant contrasts. For C. capitata, the highest infestation levels were recorded in Rosaceae, Moraceae, and Anacardiaceae (fig. 1). Overall, infestation levels differed significantly among plant families for A. fraterculus (Kruskal–Wallis test, χ 2 = 35.99, df = 10, p = 0.001), but not for C. capitata (χ 2 = 9.59, df = 10, p = 0.47). Post hoc pairwise comparisons for A. fraterculus (Dunn’s test with Bonferroni correction) revealed significant differences between Myrtaceae and Rosaceae (Z = 3.34, adjusted p < 0.05), Myrtaceae and Rutaceae (Z = 5.04, adjusted p < 0.05), and Juglandaceae and Rutaceae (Z = 3.52, adjusted p < 0.05).
Mean infestation level (± SD) of Anastrepha fraterculus and Ceratitis capitata across different plant families in northwestern Argentina. The bars represent the average number of individuals per kilogram of fruit for each fruit fly species within each plant family, and error bars indicate standard deviation. Significant differences identified by post hoc tests are described in the text (see Results for details).

Variation in infestation levels among host plant species
Infestation levels varied significantly among host plant species (table 1). Citrus maxima, C. reticulata, Passiflora caerulea, and Pyrus communis were not infested by A. fraterculus, while Inga marginata was not infested by C. capitata. The lowest infestation levels recorded by A. fraterculus were in Cydonia oblonga (0.01 ± 0.01 adults/kg of fruit), Citrus aurantium (0.02 ± 0.03 adults/kg of fruit), and Ficus carica (0.03 ± 0.06 adults/kg of fruit). The highest levels occurred in Psidium guajava (84.35 ± 103.49 adults/kg of fruit), Rubus sp. (67.80 ± 119.21 adults/kg of fruit), and Juglans australis (42.29 ± 32.64 adults/kg of fruit). For C. capitata, the lowest infestation values were recorded in Malus domestica (0.52 adults/kg of fruit), Citrus reticulata (1.79 adults/kg of fruit), and Rubus sp. (1.31 ± 1.97 adults/kg of fruit), while the highest were observed in F. carica (18.88 ± 21.34 adults/kg of fruit), Eugenia uniflora (16.81 ± 8.55 adults/kg of fruit), and Prunus persica (14.15 ± 11.1 adults/kg of fruit). Statistically significant differences in infestation levels were observed among host plant species for both A. fraterculus (χ 2 = 45.35, df = 22, p = 0.002) and C. capitata (χ 2 = 39.93, df = 22, p = 0.011). Pairwise comparisons employing the Bonferroni correction revealed several significant contrasts. For A. fraterculus, significant differences were identified between C. aurantium and E. uniflora (Z = −2.36, adjusted p < 0.05), Citrus sinensis and E. uniflora (Z = −2.46 ,p < 0.05) and C. oblonga and E. uniflora (Z = −2.24, adjusted p < 0.05). For C. capitata, significant differences were identified between C. oblonga and Eriobotrya japonica (Z = −2.43, adjusted p < 0.05), C. oblonga and E. uniflora (Z = −2.78, adjusted p < 0.05), C. sinensis and C. oblonga (Z = 2.36, adjusted p < 0.05), and E. uniflora and I. marginata (Z = 2.43, adjusted p < 0.05).
Effects of host plant origin and landscape on infestation levels
Regarding the origin of host plant, C. capitata showed no significant difference in infestation levels between native and exotic plants (Kruskal–Wallis test, χ 2 = 0.38, df = 1, p = 0.53), whereas A. fraterculus showed significantly higher infestation levels in native plants than in exotic ones (χ 2 = 18.46, df = 1, p < 0.001). The infestation level varied across landscape units for both species. For A. fraterculus, infestation levels differed significantly among landscape units (χ 2 = 12.93, df = 2, p = 0.0016), whereas no significant differences were detected for C. capitata (χ 2 = 0.15, df = 2, p = 0.93). Post hoc tests for A. fraterculus revealed a significant difference between mixed-use and wild areas (Z = −3.58, adjusted p = 0.001).
Between- and within-group variation in the infestation level
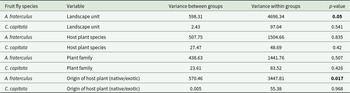
For A. fraterculus, infestation levels showed significantly greater between-group variance than within-group variance for origin of plant categories than within them (p = 0.01) and a marginally significant difference for landscape units (p = 0.05). In all other comparisons, including plant species, plant family, and landscape units for C. capitata, the within-group variance was higher than the between-group variance (table 2).
Comparison of between-group and within-group variance in infestation level of Anastrepha fraterculus and Ceratitis capitata according to landscape unit, host plant species, plant family, and origin of host plant

Table 2 Long description
The table compares how infestation variability is split between differences among groups and differences within groups for two fruit fly species across four grouping variables. For A. fraterculus, landscape unit has between-group variance 598.31 versus within-group variance 4696.34 with a p-value of 0.05, and host plant origin has between-group variance 570.46 versus within-group variance 3447.81 with a p-value of 0.017. For A. fraterculus, host plant species and plant family show non-significant results, with p-values 0.835 and 0.507, and within-group variance larger than between-group variance in both cases. For C. capitata, none of the variables are significant: landscape unit p-value 0.541, host plant species 0.42, plant family 0.426, and host plant origin 0.968. Across C. capitata rows, between-group variance is very small compared with within-group variance, especially for host plant origin. P-values come from permutation tests, so results indicate evidence for group differences rather than effect size or direction.
Note: p-values correspond to permutation tests for each variable. Bold values indicate statistically significant differences (p < 0.05) based on permutation tests.
Effects of altitude, landscape units, and spatial structure on infestation level (GAMs)
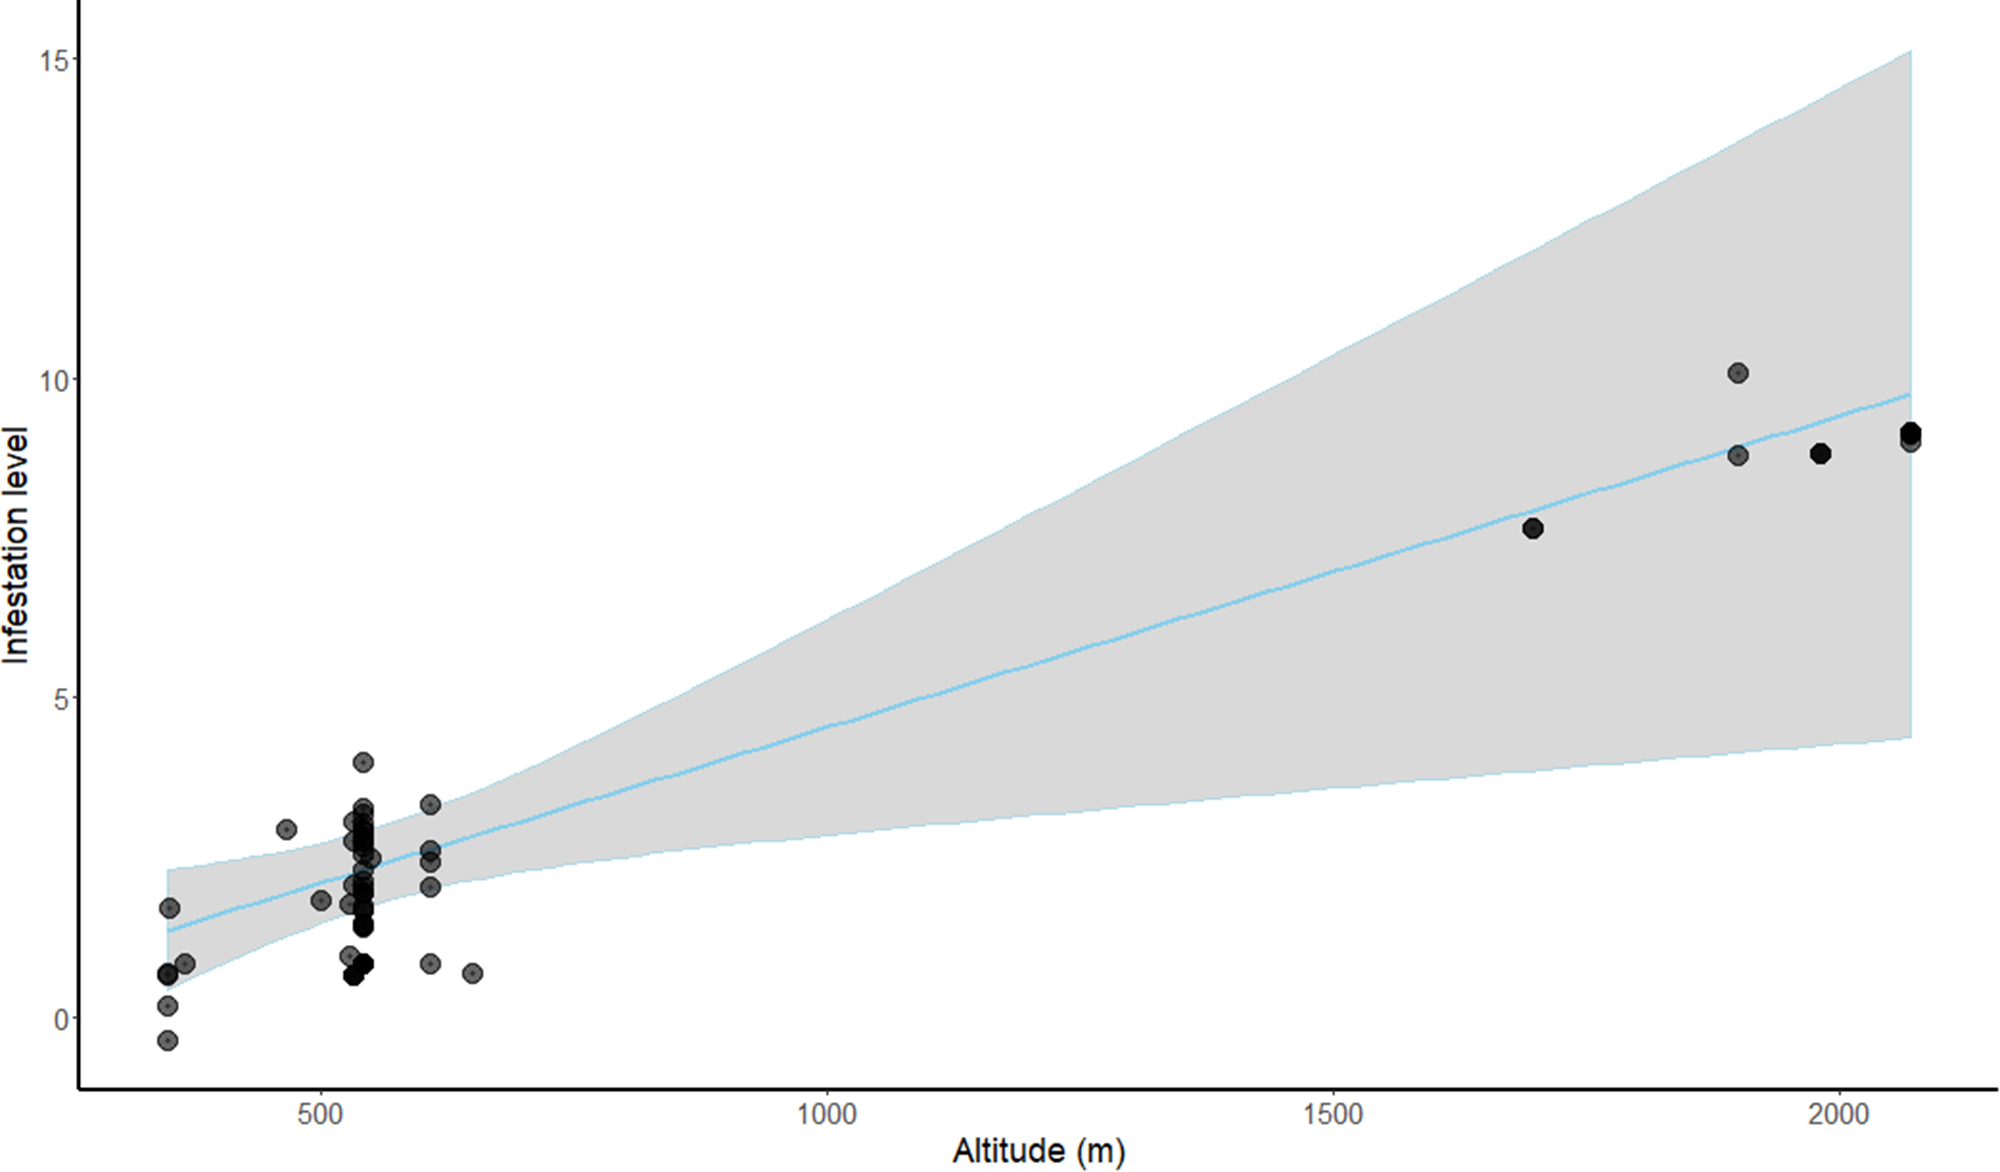
For A. fraterculus, the spatial GAM showed a significantly better fit than the non-spatial model (AICc = 468.11 vs 476.27), and the spatial term was highly significant (p = 0.00065). After accounting for spatial structure, altitude had a significant positive effect on infestation level (Estimate = 0.0049, SE = 0.0018, p = 0.0067, supplementary table S1), indicating a slight increase in infestation level with elevation (sampling range 300–2100 m a.s.l.) (fig. 2). Among landscape units, wild areas were associated with significantly lower infestation levels than crops (Estimate = −2.70, SE = 1.26, p = 0.032, supplementary table S1), while mixed-use landscapes showed no significant effect (p = 0.89). For C. capitata, the GAM revealed a significant non-linear effect of altitude on infestation levels (edf = 3.01, χ 2 = 23.76, p < 0.001, supplementary table S2). In contrast, landscape units had no significant effect (p > 0.05 for both mixed and wild categories). The model demonstrated moderate explanatory power, accounting for 25.7% of the deviance explained (adjusted R 2 = 0.114).
Effect of altitude on the infestation level by Anastrepha fraterculus in northwestern Argentina estimated using a spatial generalised additive model. The blue line represents the adjusted effect of altitude (holding other model variables constant), and the grey band indicates the 95% confidence interval.

Discussion
This study summarises the infestation patterns of the fruit fly species A. fraterculus and C. capitata in northwestern Argentina. The results demonstrate that both species are associated with a broad range of host plants; however, a significant difference in infestation levels was observed between the two species at the levels of plant family, plant species, and origin of host plant. Furthermore, the effects of altitude and landscape units on the infestation patterns varied between species. These patterns may be influenced by broader ecological factors, including climatic and environmental conditions, resource availability, and interactions among co-occurring species, such as competition, which may shape infestation dynamics across habitats.
Anastrepha fraterculus exhibited significantly higher and more variable infestation levels across host plant families, plant species, origin of host plant, and landscape units. The elevated infestation levels of A. fraterculus in Myrtaceae, Juglandaceae, and Sapotaceae suggest a closer relationship with these native or semi-domesticated hosts, which may be attributable to co-evolutionary processes (Aluja and Mangan, Reference Aluja and Mangan2008). This finding is consistent with earlier studies suggesting a closer association of this species with native vegetation (Ovruski et al., Reference Ovruski, Schliserman and Aluja2003; Hernández-Ortiz et al., Reference Hernández-Ortiz, Barradas-Juanz and Díaz-Castelazo2019). The Myrtaceae family has been demonstrated to be strongly associated with A. fraterculus (Raga et al., Reference Raga, Machado, de Souza Filho, Sato and Siloto2005; Zucchi, Reference Zucchi2008; Hernández-Ortiz et al., Reference Hernández-Ortiz, Barradas-Juanz and Díaz-Castelazo2019), leading to the hypothesis that the species of the Myrtaceae family may have significantly influenced the original diversification of the A. fraterculus species complex (Hernández-Ortiz et al., Reference Hernández-Ortiz, Barradas-Juanz and Díaz-Castelazo2019).
Conversely, C. capitata exhibited more homogeneous and generally lower infestation levels, with no significant differences observed according to the origin of the host plant and landscape units. Nonetheless, elevated values of infestation levels were observed in the exotic host plants, such as F. carica and the four species of Citrus recorded. The disparities in infestation levels observed between the two fruit fly species on different host plants and plant families can be attributed to host plant selection, influenced by fly physiology, fruit chemical composition, plant phenology, and the evolutionary history of plant–insect interactions (Segura et al., Reference Segura, Vera, Cagnotti, Vaccaro, De Coll, Ovruski and Cladera2006; He et al., Reference He, Chen, Jiang and Pan2021). Host plants release infochemicals, which have been demonstrated to influence mating, feeding, and oviposition behaviours (Cunningham et al., Reference Cunningham, Carlsson, Villa, Dekker and Clarke2016). In addition, the presence of certain chemical compounds in some species of Citrus has been linked to enhanced reproductive success in C. capitata (Shelly et al., Reference Shelly, Dang and Kennelly2004; Ioannou et al., Reference Ioannou, Papadopoulos, Kouloussis, Tananaki and Katsoyannos2012). Moreover, extant research has demonstrated that volatiles emanating from exotic fruit hosts generally do not influence A. fraterculus sexual behaviour (Vera et al., Reference Vera, Ruiz, Oviedo, Abraham, Mendoza, Segura, Kouloussis and Willink2013; Belliard et al., Reference Belliard, Bachmann, Fernández, Hurtado, Vera and Segura2022).
The observed differences in host utilisation and infestation intensity may indicate ecological niche partitioning, which could facilitate the coexistence of these two tephritid species in the region (Duyck et al., Reference Duyck, David, Junod, Brunel, Dupont and Quilici2006; Aluja and Mangan, Reference Aluja and Mangan2008; Moquet et al., Reference Moquet, Payet, Glenac and Delatte2021). Specifically, A. fraterculus appears to be dominant in native and semi-domesticated hosts, particularly in less disturbed environments, while C. capitata tends to exploit exotic and cultivated species more effectively (Segura et al., Reference Segura, Vera, Cagnotti, Vaccaro, De Coll, Ovruski and Cladera2006). This pattern of host utilisation minimises direct competition for oviposition sites and larval resources, an established mechanism in tephritid communities that mitigates interspecific competition (Aluja and Mangan, Reference Aluja and Mangan2008; Clarke and Measham, Reference Clarke and Measham2022). Laboratory and field studies have also demonstrated that even when both species coexist on shared hosts (e.g. Citrus spp.), temporal segregation in oviposition, larval development, or microhabitat use within fruits may further reduce interspecific competition (Segura et al., Reference Segura, Vera, Cagnotti, Vaccaro, De Coll, Ovruski and Cladera2006; Liendo et al., Reference Liendo, Parreno, Cladera, Vera and Segura2018). Similar host-use differentiation patterns have been reported in other tephritid systems; for example, in West Africa, the invasive Bactrocera dorsalis outcompetes the native Ceratitis cosyra on cultivated mango, forcing the latter to shift to wild hosts (Zida et al., Reference Zida, Nacro, Dabiré and Somda2019). In the southwest Indian Ocean islands, C. capitata persisted by using host plants rarely infested by B. dorsalis, such as Murraya paniculata and Passiflora suberosa, acting as ecological refuges (Moquet et al., Reference Moquet, Payet, Glenac and Delatte2021).
Our results demonstrate contrasting patterns between A. fraterculus and C. capitata in relation to altitude and land use, suggesting habitat segregation at the landscape scale. For A. fraterculus, altitude positively affected infestation levels, even after controlling for spatial structure, indicating higher infestation at higher altitudes. These results align with previous studies in the Neotropical region, which report that this species is more common at mid to high elevations (Katiyar et al., Reference Katiyar, Molina and Matheus2000; Birke and Aluja, Reference Birke and Aluja2011). Furthermore, A. fraterculus showed higher infestation levels in natural and mixed-use habitats, indicating a stronger association with native ecosystems (Duarte et al., Reference Duarte, Calvo, Delgado, Garcia and Scatoni2021). This could reflect the habitat preference of this species, associated with native hosts and less disturbed environments commonly found at higher elevations (Ovruski et al., Reference Ovruski, Schliserman and Aluja2003; Altamirano, Reference Altamirano2017). Conversely, C. capitata demonstrated a notable non-linear response to altitude, suggesting a more complex relationship that may be influenced by additional factors, such as microclimate and host phenology. Previous studies have documented a decline in C. capitata abundance with increasing altitude (Rodovitis et al., Reference Rodovitis, Verykouki, Zarpas, Papanastasiou, Moraiti, Patronis and Papadopoulos2024). However, this species has also been documented across a broad altitudinal range under optimal conditions (Flores et al., Reference Flores, Montoya, Ruiz-Montoya, Villaseñor, Valle, Enkerlin and Liedo2016). While higher infestation levels were observed in cultivated areas, no significant differences were found among landscape units, suggesting minimal variation in infestation levels across different landscape contexts and highlighting its ecological flexibility. These findings are consistent with previous studies emphasising its generalist nature and capacity to thrive in human-modified environments (Querino et al., Reference Querino, Maia, Lopes, Alvarenga and Zucchi2014; Lemic et al., Reference Lemic, Bjeliš, Ninčević, Živković, Popović, Gašparić and Benitez2021).
From a pest management perspective, the results of this study emphasise the necessity for species-specific strategies that account the distinct ecological traits of these two economically significant fruit fly species, incorporating both spatial and environmental variables. Identifying plant species or families that persistently exhibit low infestation levels could provide valuable insights for management. Promoting these less preferred or non-host plant species within buffer zones or integrating them into agroecosystems as part of habitat management approaches aimed at reducing the landscape’s permeability to fruit flies has been suggested (Gurr et al., Reference Gurr, Wratten and Luna2004; Aluja and Rull, Reference Aluja, Rull, Aluja, Leskey and Vincent2009). Furthermore, the findings indicate that A. fraterculus demonstrates significant spatial autocorrelation and altitude-dependent patterns, underscoring the necessity of spatially targeted monitoring and control efforts (such as trapping and biological control agents) focusing on high-risk areas defined by environmental and landscape features (Nicacio et al., Reference Nicacio, Oliveira, Uchoa, Faccenda, Abot, Fernandes and Garcia2019). Conversely, the greater spatial variability and less predictable patterns exhibited by C. capitata suggest that broader, landscape-level management across multiple cropping systems may be more effective. These management strategies align with the principles of integrated pest management and ecological engineering, advocating for the manipulation of landscape composition and structure to sustainably suppress pest populations (Gurr et al., Reference Gurr, Wratten and Luna2004; Deguine et al., Reference Deguine, Atiama-nurbel, Aubertot, Augusseau, Atiama, Jacquot and Reynaud2015; Karsten et al., Reference Karsten, Barton, Addison, Addison and Terblanche2018).
Supplementary material.
The supplementary material for this article can be found at https://doi.org/10.1017/S0007485326101199.
Acknowledgements
We thank the anonymous reviewers for their constructive comments, which helped improve the manuscript.
Author contributions
Conceptualisation: A.B. and M.O.; methodology: A.M. and M.O.; formal analysis: A.B.; investigation: A.B. and M.O.; writing – original draft preparation: A.B.; writing – editing and reviewing: all authors; visualisation: A.B.; and funding acquisition and resources: M.O and P.S. All authors have read and agreed to the published version of the manuscript.
Financial support.
This study was funded by Consejo Nacional de Investigaciones Científicas y Técnicas de Argentina (CONICET) (Grant PIP 2021–2025, 11220200102989CO).
Competing interests
The authors declare that they have no conflict of interest.