


Significant outcomes
-
There exist positively or negatively modulated brain networks during processing of diagnostic specific task (depression scale).
-
Diagnostic conditions (depression scale) when contrasted to neutral conditions demonstrate differential activity of right superior frontal gyrus and right middle cingulate cortex in the comparison of patients with healthy controls.
-
Potential neuroimaging state-dependent biomarker has been directly linked with clinical assessment self-evaluation scale, administered as fMRI stimuli.
Limitations
-
The sample size is relatively small.
-
The group ICA is a more liberal method in comparison with SPM.
Introduction
Psychiatry has been considered to be in a long-term crisis as medical discipline, from the perspectives of both ontology and epistemology (Di Nicola and Stoyanov, Reference Di Nicola and Stoyanov2021). From an epistemological point, the main concerns are raised at the confidence in the methods of assessment and relevant taxonomy as well as in the entailed crisis of identity. The common issue for both is the problem of the diagnostic methods validity.
Traditional biomedical knowledge triangulates clinical diagnostic entities upon robust nomothetic networks composed of molecular, imaging and physiological (functional) alteration bio-markers. As a result, neither clinical assessment nor the laboratory confirmation methods can constitute a sole diagnostic entity but only the incremental combination between the different measures (Stoyanov et al., Reference Stoyanov, Stieglitz, Lenz, Borgwardt and Stoyanov2015, Reference Stoyanov, Kandilarova and Borgwardt2017; Maes & Stoyanov, Reference Maes and Stoyanov2022). As a result, medicine has clear definition and boundaries of normal structures and functions and delineates disease outside those normative boundaries.
By contrast, psychiatry is operating with patchy reductionist paradigmatically framed, conventional diagnostic entities, which can hardly transcend beyond subjective narratives in the context of cultural pluralism (Stoyanov et al., Reference Stoyanov, Aryutova, Kandilarova, Paunova, Arabadzhiev, Todeva-Radneva, Kostianev and Borgwardt2021a). Thus, psychopathology is missing consensual theory of normal personality, structure and functional range of mental systems. In effect, mental disorder is very often defined merely as absense of manifest psychopathology given the context of cultural, political and societal norms. Therefore, psychopathological symptoms, signs, syndromes and nosology are seen more as social constructs rather than as real scientific objects or as real kinds with highly problematic taxonomy (Zachar et al., Reference Zachar, Stoyanov, Aragona and Jablensky2014).
In the past decade, our efforts were directed towards establishing of a new model of validation in psychiatry, the trans-disciplinary cross-validation, as exposed in detail elsewhere (Todeva-Radneva et al., Reference Todeva-Radneva, Paunova, Simeonova, Kandilarova and Stoyanov2020a). In summary, according to this model, there are convergent and divergent validity operations, which may be tested across clinical diagnostic self-assessment tests and functional magnetic resonance imaging (fMRI) in real time. Generally, the approach is adopted from psychometrics, where it is applied to comparisons between different measurement tools (self-administered or observer-based rating scales), which anyway dwell in the domain of subjective patients, or professional narratives. Convergent operations essentially mean that the scores on clinical assessments tools and brain activation as detected by the BOLD (blood oxygenation level dependent) signal in the brain are concordant, or in the same direction. When the two measures happen to be in the opposite directions, this is regarded as divergent validity.
This model has been tested empirically with the depressive scale, paranoid-depressive scale international affective pictures system and Stroop colour and word test in various populations (Stoyanov, Reference Stoyanov2022). Our group has demonstrated in earlier studies with task-related MRI that simultaneous administration of depressive scale as contrasted with diagnostically neutral interest scale in block design has produced meaningful results and is able to distinguish patients with major depressive episode (MDE) from healthy controls (HC). More specifically, the depressive scale item versus neutral items responses yielded significant clusters of residual activation in middle frontal gyrus, reported in depressive patients, and not in controls (Stoyanov et al., Reference Stoyanov, Kandilarova, Borgwardt, Stieglitz, Hugdahl and Kostianev2018).
The aim of the presents study is to further expand the model of translational cross-validation by investigating the brain circuits or networks which underpin the same tasks by means of group independent component analysis for FMRI toolbox (GIFT). We hypothesised that there will be neural network patterns of activation and deactivation, which correspond to real-time performance on clinical self-evaluation scales.
Subjects and methods
Subjects
There were 42 subjects included in this study: 20 (HC and 22 patients with MDE. Each individual was evaluated by board certified psychiatrists using Mini International Neuropsychiatric interview (Sheehan et al., Reference Sheehan, Lecrubier, Sheehan, Amorim, Janavs, Weiller, Hergueta, Balker and Dunbar1998) and Montgomery–Åsberg Depression Rating Scale (MADRS) (Montgomery & Åsberg, Reference Montgomery and Åsberg1979). Exclusion criteria were defined as earlier history of comorbid mental disorders (considered for HC and for patients on a separate basis), systematic and organic neurological diseases, cranial trauma or MRI incompatible metal implants. All participants signed in person a written informed consent following the Declaration of Helsinki. The study was approved by the Medical University of Plovdiv Ethical Committee (2/19.04.2018).
Demographic and clinical characteristics
No significant differences have been reported between the two groups in terms of their age, sex and education distribution. Significantly higher MADRS score is reported for the patient group (see Table 1).
Demographic and clinical characteristics of the groups
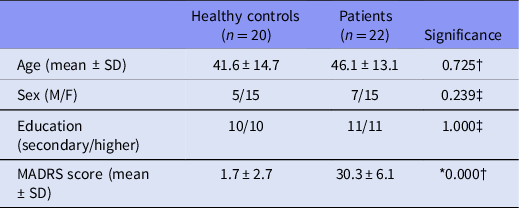
SD, standard deviation; MADRS, Montgomery–Åsberg Depression Rating Scale.
* p < 0.05.
† Two-sample Kolmogorov–Smirnov nonparametric test.
‡ χ2-test.
Methods
MR Scanning
The MR scanning procedure was performed on a 3T MRI system (GE Discovery 750w). The experimental protocol is introduced comprehensively elsewhere (Stoyanov et al., Reference Stoyanov, Fulford, Stanghellini, Van Staden and Wong2021b).
fMRI task
Detailed description of the paradigm structure has already been published (Stoyanov et al., Reference Stoyanov, Kandilarova, Borgwardt, Stieglitz, Hugdahl and Kostianev2018; Stoyanov et al., 2021). We used a standard block-design paradigm with two different active (ON) conditions and one resting (OFF) condition. Diagnostically specific (DS) blocks consisted of von Zerssen self-assessment depression scale, with a total duration of 8 min and 32 s. Each DS block consisted of 4 statements from the von Zerssen depression scale (von Zerssen, Reference von Zerssen, Sartorius and Ban1986), e.g. ‘I feel melancholic and depressed’; ‘I cry easily’. Diagnostically neutral (DN) was composed of statements from a questionnaire about general interests and likes (such as ‘I like to repair household appliances’, ‘I like to study ways to reduce water pollution’ etc.). The items were selected by an expert panel, supervised by certified clinical psychologist.
For each statement, there were four possible item responses presented, as well as the four buttons corresponding to the responses (completely true = upper left, mostly true = lower left, somewhat true = lower right and not true = upper right button). There were four blocks of each type, alternating between DS and DN conditions, and each ON block was followed by an ‘OFF’ block with a fixation cross in the middle of the screen (DS_OFF_DN_OFF_DS_OFF…). The duration of ON and OFF blocks was 32 s. For the active conditions, the participants were instructed to read the statements carefully and to respond with a button press according to their level of agreement, and for the passive OFF condition, to focus on the fixation cross without thinking of anything in particular.
Image processing
Neuroimaging data were processed using SPM 12 software (Statistical Parametric Mapping, http://www.fil.ion.ucl.ac.uk/spm/) running on MATLAB R2021 for Windows. The functional images of each participant were processed following established procedures – realignment, co-registration with the high-resolution anatomical image and normalisation to standard MNI space (for more comprehensive details see Stoyanov et al., Reference Stoyanov, Aryutova, Kandilarova, Paunova, Arabadzhiev, Todeva-Radneva, Kostianev and Borgwardt2021a, Reference Stoyanov, Khorev, Paunova, Kandilarova, Simeonova, Badarin, Hramov and Kurkin2022).
Data analysis
We analysed the differences in brain activation patterns during the experimental conditions between HC and MDD patients. First, we identified brain networks that were activated in response to the task across all subjects. We considered the comparisons between the DS vs rest (OFF) blocks, the diagnostically neutral (DN) vs rest blocks and DS vs DN blocks using the circuit-based approach through the individual component analysis (see the ‘Independent component analysis’ section). Then, we compared the activity of regions in the revealed brain networks between HC and MDD groups of subjects via statistical parametric mapping (see the ’Statistical analysis’ section).
Independent component and statistical analysis
Group ICA (Calhoun et al., Reference Calhoun, Adali, Pearlson and Pekar2001, Reference Calhoun, Adali, Pekar and Pearlson2003; Rodriguez et al., Reference Rodriguez, Calhoun and Adalı2012) was performed to identify brain networks that were activated in response to a task (DS vs OFF, DN vs OFF, DS vs DN). ICA was performed on the BOLD fMRI scans of all 42 subjects using GIFT (http://trendscenter.org/software/gift). We computed individual ICA solutions employing the Infomax algorithm (Bell & Sejnowski, Reference Bell and Sejnowski1995). For the group ICA, all subjects were analysed concurrently, and principal component analysis (PCA) was used for compression. ICA attempts to decompose a multiple signal into independent, mostly non-Gaussian, signals. This approach has been widely used for fMRI data processing (Forsyth et al., Reference Forsyth, McMillan, Campbell, Malpas, Maxwell, Sleigh, Dukart, Hipp and Muthukumaraswamy2020; Colato et al., Reference Colato, Stutters, Tur, Narayanan, Arnold, Gandini Wheeler-Kingshott, Barkhof, Ciccarelli, Chard and Eshaghi2021; Morie et al., Reference Morie, DeVito, Potenza and Worhunsky2021).
The number of components selected was 50. The choice of the number of components is effectively a choice of the spatial scale of the results (fewer components leads to larger brain networks). Thus, we obtained 50 independent components for each subject representing specific circuits with similar activation patterns. The component time courses were analysed using multiple regression to evaluate the components, which are modulated by the task. We first calculated slopes of regression for the conditions and obtained beta weights for each of the components. The resulting beta values were analysed via a one sample t-test across subjects to identify significant effects at the false discovery rate (FDR) corrected p < 0.025. As a result, out of the 50 components, only those components remain that are significantly related to task performance. Then, statistical analysis was further applied to the remaining components. We extracted the list of the areas corresponding to the component activity in MNI and Talairach coordinates using the ‘Write Talairach Table’ procedure in GIFT with the following parameters: threshold – 3.5 and the distance between the contiguous voxels – 4 mm.
Statistical analysis
Characterising a regionally specific effect rests on the estimation of inference. Inferences in neuroimaging may be about differences expressed when comparing one group of subjects to another. They may pertain to structural differences in voxel-based structures or neurophysiological indices of fMRI. We will focus on the analysis of the fMRI time series because this covers most of the issues that are likely to be encountered in task-related experiments. For that purpose, we used statistical parametric mapping (SPM 12 software) to analyse the ICA component maps in order to reveal clusters of voxels (brain regions) that showed a significant difference in response to the task between HC and MDD groups of subjects. Analysis included factorial design specification where we used a two-sample t-test with two groups (HC and MDD). The volumes of significantly changed components revealed in DS vs OFF, DN vs OFF, DS vs DN comparisons on the ICA analysis step were used as input data. An implicit mask was set by default. No global normalisation was used. The restricted maximum likelihood method was used for the general linear model parameters estimation. This assumes the error correlation structure is the same at each voxel. For the contrasting we used t-contrast approach including two groups and [1 −1] and [−1 1] weights for the HC > MDD and MDD > HC conditions, respectively. Statistical significance was determined by cluster forming threshold of uncorrected p-value less than 0.05 and a peak level of p < 0.001 uncorrected.
Results
Independent component analysis
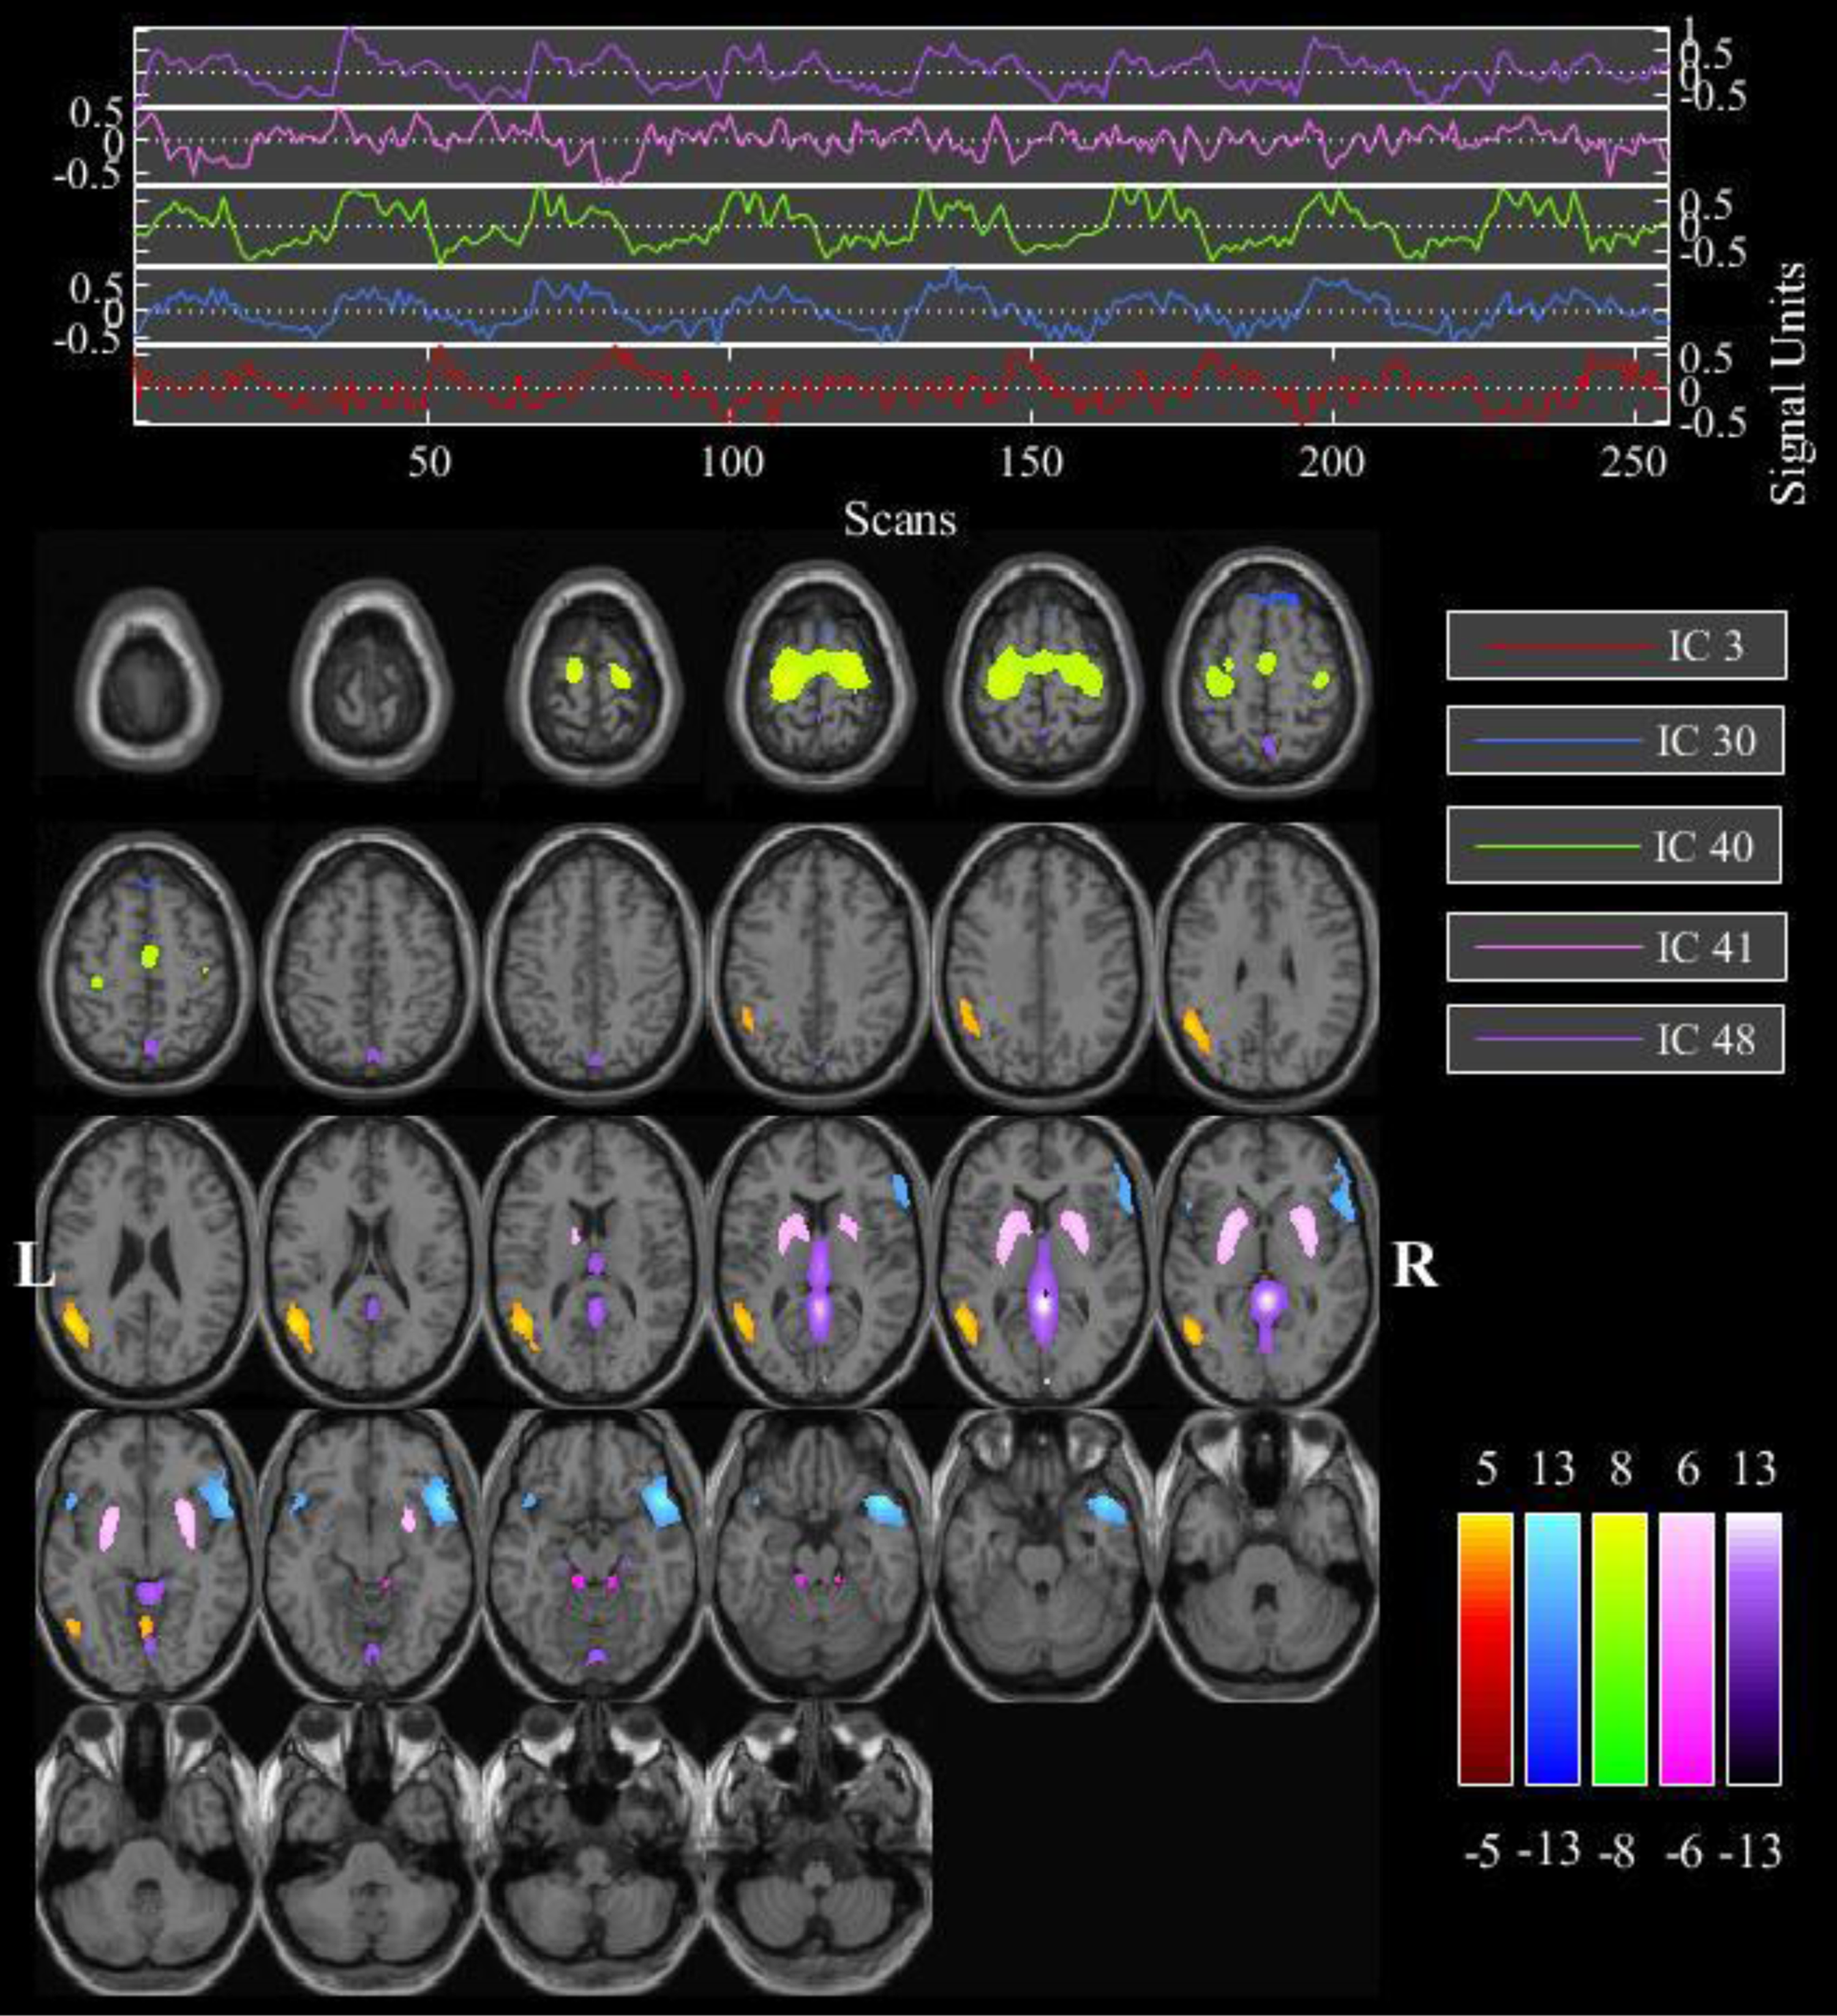
We first looked at which brain networks were activated when a subject responded to the task. The GIFT analysis identified one significantly activated component (#4) for the condition DS vs OFF, none – for the DN condition vs OFF, and five components – for the DS vs DN comparison (Fig. 1). The time series and activity areas corresponding to the components are shown in Figs. S1–S6 and Tables S1–S2 in the Supplement.
Map of the components, significantly modulated by the DS–DN conditions (IC, Independent Component).
Statistical parametric mapping (SPM) results
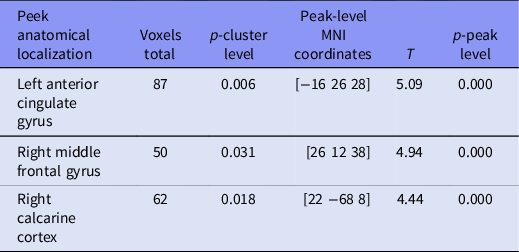
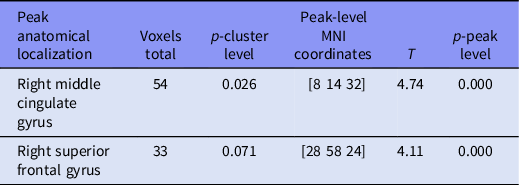
Statistical parametric mapping (SPM) mapping was utilised to analyse the regional brain network differences in within network connectivity between HC and MDD groups of subjects for the task modulated components. Within the 4th component, which is modulated by the DS vs OFF, we found three clusters of voxels with peaks located in left anterior cingulate gyrus, right middle frontal gyrus, and right calcarine cortex (Tables 2 and 3). It has significantly stronger connectivity in controls (HC) compared to patients (MDD). No significant clusters were found for the opposite MDD > HC contrast. Within the 3rd component, which is modulated by the DS task relative to the DN task, we found one cluster of voxels with significantly stronger connectivity in HC compared to MDD and one more on a trend level p = 0.07. Their peaks were located in right middle cingulate gyrus and right superior frontal gyrus, respectively (Table 3). No significant clusters were found for the opposite MDD > HC contrast. No significant clusters were found for the other components for either contrast.
Group differences in clusters modulated by the DS condition versus off blocks (HC > MDE)
Group differences in clusters modulated by the DS vs DN condition (HC > MDE)
Discussion
This study has demonstrated brain circuits positively or negatively modulated during the processing of diagnostic-specific task questions for major depressive disorder. By the ‘brain circuit’, we understand a population of neurons interconnected to carry out a specific function when activated. In our study, independent component analysis of the activity was used to obtain the brain circuits.
The first important finding is the significant difference in the activation of component 4 in ICA and SPM for diagnostic condition contrasted to resting state blocks. It is of particular interest that no such difference exists for the neutral condition, which may well be considered as a measure of what has been defined as translational validity operation in the introduction. The component includes a distributed circuit of thalamus, caudate, middle temporal gyrus, superior and middle frontal gyri, inferior parietal lobule and lingual gyrus.
The middle frontal gyrus has previously been associated with the residual activations during processing of depression scale versus neutral items in depressive patients (Stoyanov et al., Reference Stoyanov, Kandilarova, Borgwardt, Stieglitz, Hugdahl and Kostianev2018). The region is essential for the selective attention, working memory and inhibitory control, which are impaired during a MDE. In addition, lingual and fusiform gyri appear to be a hub of disturbed connectivity in our most recent studies of functional connectivity (Stoyanov et al., Reference Stoyanov, Khorev, Paunova, Kandilarova, Simeonova, Badarin, Hramov and Kurkin2022). That may be interpreted in the sense of an over-arousal or vulnerability of the same region at rest, which is highlighted by the diagnostic task in patients with depression as hypo-activation.
These results are also consistent with the studies of Escamilla et al. (Reference Escamilla, Sandoval, Calhoun and Ramirez2018) and Petchkovsky et al. (Reference Petchkovsky, Petchkovsky, Morris, Dickson, Montgomery, Dwyer and Burnett2013) with Word Association Test of Carl Gustav Jung. In those studies, emotionally significant complex triggering words activate similar patterns to the common network, including superior and middle frontal gyrus, caudate, temporal areas and deactivate precuneus, medial frontal gyrus, cingulate and thalamus. In our study, the associated regions also include inferior parietal lobule, including supramarginal gyrus and angular gyrus, which take part in the mechanisms of empathy and understanding of emotions and theory of mind (Silani et al., Reference Silani, Lamm, Ruff and Singer2013; Hoffmann et al., Reference Hoffmann, Koehne, Steinbeis, Dziobek and Singer2016). Lingual and fusiform gyrus have also been previously reported by our group to be hypo-activated in patients with depression during execution of Stroop Color and Word test (Simeonova et al., Reference Simeonova, Paunova, Stoyanova, Todeva-Radneva, Kandilarova and Stoyanov2022). The impairment of those functions is pivotal for a MDE.
The second finding of the current study is that the preferential processing of depression scale items as compared to neutral item responses is associated with patterns of activity in five independent components which encompass common, shared and distinct networks across components during the processing of the diagnostic specific scale items. The distinct may be subtracted from the common ones.
An executive summary of the same is presented in Table 4. The common network for all or both DS vs OFF and DS vs DN independent components (IC) includes superior and middle frontal gyri, inferior parietal lobule (composed of supramarginal gyrus and angular gyrus), middle and superior temporal gyri, middle occipital gyrus, thalamus (IC4 and IC48), caudate (IC4 and IC41) and lingual gyrus (IC4, IC3 and IC41). The shared circuit between DS vs DN components involve cuneus, precuneus (all 5 IC), culmen (IC3 and IC48), parahippocampal gyrus (30 and 48), superior parietal lobule (IC40 and IC41); medial frontal gyrus (IC3 and IC40) and precentral gyrus (IC3, IC30, IC40). The distinct or unique regions/networks which are revealed in IC3 includes inferior temporal gyrus, in IC41 – lentiform nucleus and in component 48 – posterior cingulate and fusiform gyrus.
Circuits preferentially processing depressive scale (regions activated (“+”)/deactivated (“−”) by the condition)
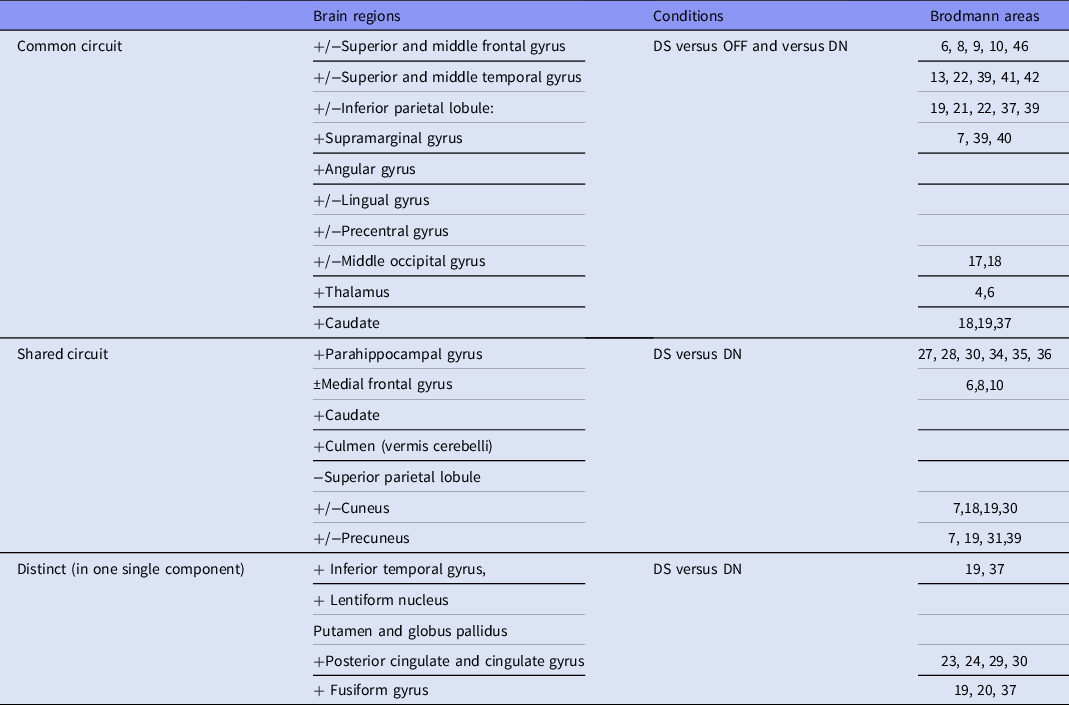
The common circuit corresponds to major nodes from the triple network and is involved in word and language semantic processing, empathy and self-reflection (Xu et al., Reference Xu, Lin, Han, He and Bi2016). In that context, verbal self-evaluation scale items are normally expected to yield activations in those regions.
The shared circuit between DS vs DN components involves caudate, cuneus and precuneus, thalamus, medial frontal gyrus, culmen, parahippocampal gyrus, superior parietal lobule and precentral gyrus. Thalamus and parahippocampal gyrus are implicated as connections of the limbic distributed system, whereas caudate and culmen belong to the basal ganglia, that play critical role in affective regulation and disorders (Ikemoto et al., Reference Ikemoto, Yang and Tan2015; Macpherson & Hikida, Reference Macpherson and Hikida2019). They should be expected therefore to process emotional content of stimuli.
Medial frontal gyrus, precuneus and angular gyrus belong to a system of autobiographical memory and self-identity, which is apparently disturbed in depression (Mazzoni et al., Reference Mazzoni, Clark, De Bartolo, Guerrini, Nahouli, Duzzi, De Marco, McGeown and Venneri2019). As it has been already demonstrated by means of effective connectivity measures and other task-related paradigm (paranoid-depressive scale) in our previous publications, the latter regions are implicated in the mechanisms of affective disorders (Aryutova et al., Reference Aryutova, Paunova, Kandilarova, Stoyanova, Maes and Stoyanov2021b). More specifically, changes in effective connectivity of precuneus with orbitofrontal cortex as defined by means of dynamic causal modelling can potentially differentiate major psychiatric disorders (Kandilarova et al., Reference Kandilarova, Stoyanov, Aryutova, Paunova, Mantarkov, Mitrev, Todeva-Radneva and Specht2022). Activations in the same area during processing of a task with paranoid scale items differentiate schizophrenia from depression as well (Stoyanov et al., 2021). This may well indicate that the modulation of precuneus and its connections has opposite dysfunctions in two major clusters of mental disorders: schizophrenia and depression.
The distinct or unique networks are found within Component 3 – inferior temporal gyrus, Component 41 – lentiform nucleus and Component 48 – posterior cingulate and fusiform gyrus. All of those areas are clearly and traditionally associated with neural systems regulating cognitive and emotional functions in health and disease (Squire et al., Reference Squire, Berg, Bloom, Du Lac, Ghosh and Spitzer2012; Banich & Compton, Reference Banich and Compton2018; Cheng et al., Reference Cheng, Rolls, Qiu, Xie, Wei, Huang, Yang, Tsai, Li, Meng, Lin, Xie and Feng2018)
In summary, the patterns of activation behind depression scale encompass components from triple and limbic networks, which are not activated during neutral items processing. Preferential processing of the depression scale items by those components indicates that they measure properly depression as diagnostic construct and thereby may reify it in terms of incremental validity (Zachar et al., Reference Zachar, Stoyanov, Machamer and Schaffner2012; Stoyanov et al., Reference Stoyanov, Machamer, Schaffner and Rivera-Hernández2012; Stoyanov, Reference Stoyanov2020).
The third major finding of the present study is confirmation of differences in the networks processing diagnostic (DS) versus off blocks between patients and controls in Components 4 with SPM, mainly anterior cingulate cortex and middle frontal gyrus. The deregulation of this crucial hub for processing of verbal information, convergence of dorsal and ventral attention networks and salience network, is consistent with our previous findings using the same paradigm in patients with depression (Stoyanov et al., Reference Stoyanov, Kandilarova, Borgwardt, Stieglitz, Hugdahl and Kostianev2018) and with resting state fMRI (Kandilarova et al., Reference Kandilarova, Stoyanov, Paunova, Todeva-Radneva, Aryutova and Maes2021; Chen et al., Reference Chen, Xia, Zhao, Kuang, Jia and Gong2021).
The fourth and most significant finding of the current study is DS contrasted to DN conditions demonstrate differential activity of right superior frontal gyrus and right middle cingulate cortex in the comparison of patients with HC. This finding implicates deregulation of the triple network in depression, critically affecting self-awareness and pro-social behaviour. Although such dysfunctions have been previously reported (Liu et al., Reference Liu, Ma, Yuan, Song, Jing, Lu, Tang, Fan, Walter, Liu, Wang and Wang2017; Zheng et al., Reference Zheng, Li, Bo, Li, Yao, Yao, Wang and Wu2018; Cheng et al., 2018), it is for the first time when potential neuroimaging state-dependent biomarker has been directly linked with clinical assessment self-evaluation scale, administered as stimuli simultaneously with the fMRI acquisition. It may be regarded as further evidence in support of the ability of both methods to concordantly distinguish groups by means of incremental translational cross-validation (Stoyanov Reference Stoyanov2022).
Limitations
This study is based on relatively small sample. However, in neuropsychiatric imaging, unless large-scale consortia are involved, this is not unusual, including when independent component analysis is used (see Liu et al., Reference Liu, Jiao, Zhong, Hao, Wang, Xu, Teng, Song, Xiao, Fox, Zhang and Wang2021, for example). The limited size of the sample is partly compensated for by the intensive and comprehensive methodology. Replication studies under the same design are necessary in order to confirm the results. In addition, the group ICA is relatively more liberal method than SPM (Maglanoc et al., Reference Maglanoc, Kaufmann, Jonassen, Hilland, Beck, Landrø and Westlye2020). Nonetheless, the two approaches may be well complemented.
Conclusion
This study discovered the existence of positively or negatively modulated brain networks during processing of diagnostic specific task (depression scale). Diagnostic conditions (depression scale) when contrasted to neutral conditions demonstrate differential activity of right superior frontal gyrus and right middle cingulate cortex in the comparison of patients with HC.
In the recent decade, much progress has been achieved towards implementation of functional MRI studies in neuropsychiatry. Yet translation between neuroimaging findings and psychopathology remains a major challenge. The current contribution adds to a body of evidence that the translation may be facilitated by validation of clinical evaluation tests as integrated into task-based fMRI paradigm. In this way, there has been revealed potential neuroimaging state-dependent biomarker directly linked with clinical assessment self-evaluation scale, administered as fMRI stimuli.
Given the non-linear temporal complexity of both mental and neural system dynamics, a methodological frameshift from mainstream statistics towards non-conventional approaches for data analysis such as GIFT would also have potential impact on incremental validity of clinical methods.
Supplementary material
For supplementary material accompanying this paper visit https://doi.org/10.1017/neu.2023.22
Acknowledgements
Vladimir Khorev and Semen Kurkin thank the federal academic leadership program ‘Priority 2030’.
Author contributions
Drozdstoy Stoyanov delivered the concept, rationale, supervised collection and processing of the data, wrote introduction and discussion. Vladimir Khorev and Rossitsa Paunova analysed the data independently from each other, produced visualisations; Semen Kurkin wrote the methods and results section; Sevdalina Kandilarova edited the manuscript and Vince Calhoun supervised the data analysis and quality control and edited the manuscript.
Financial support
This research received no specific grant from any funding agency, commercial or not-for-profit sectors.
Conflict of interest
There is no potential conflict of interest to be disclosed.


 Open access