


I. INTRODUCTION
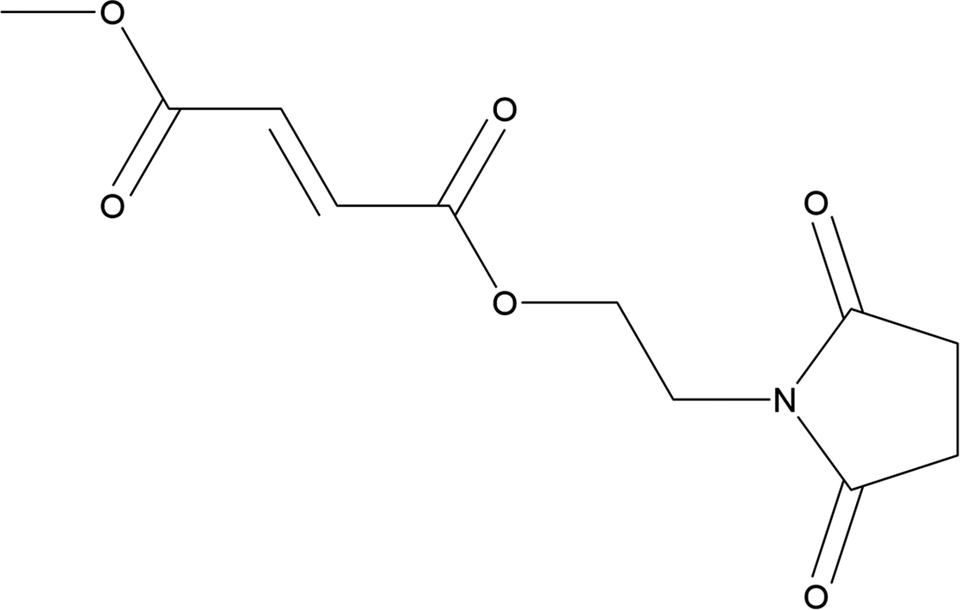
Diroximel fumarate, C11H13NO6, (marketed under the trade name Vumerity) is used for treating multiple sclerosis, acting as an anti-inflammatory and immunosuppressant. As a formulary, Vumerity is administered as a capsule, dissolving in the intestine. The systematic name (CAS Registry Number 1577222-14-0) is 4-O-[2-(2,5-dioxopyrrolidin-1-yl)ethyl] 1-O-methyl (E)-but-2-enedioate. A two-dimensional molecular diagram of diroximel fumarate is shown in Figure 1.
The two-dimensional structure of diroximel fumarate.
Powder patterns for crystalline diroximel fumarate and amorphous solid dispersions are reported in International Patent Application WO 2021/053476 A1 (Chand et al., Reference Chand, Patil, Deshmukh, Gampawar, Godase, Naik, Kadam, Peddy, Bhujade and Bhirud2021; Glenmark Life Sciences Ltd.). This work was carried out as part of a project (Kaduk et al., Reference Kaduk, Crowder, Zhong, Fawcett and Suchomel2014) to determine the crystal structures of large-volume commercial pharmaceuticals, and include high-quality powder diffraction data for them in the Powder Diffraction File (Kabekkodu et al., Reference Kabekkodu, Dosen and Blanton2024).
II. EXPERIMENTAL
Diroximel fumarate was a commercial reagent, purchased from TargetMol (Batch # 117380), and was used as received. The white powder was packed into a 0.5 mm diameter Kapton capillary and rotated during the measurement at ~2 Hz. The powder pattern was measured at 298(1) K at the Wiggler Low Energy Beamline (Leontowich et al., Reference Leontowich, Gomez, Moreno, Muir, Spasyuk, King, Reid, Kim and Kycia2021) of the Brockhouse X-ray Diffraction and Scattering Sector of the Canadian Light Source using a wavelength of 0.819563(2) Å (15.1 keV) from 1.6 to 75.0° 2θ with a step size of 0.0025° and a collection time of 3 min. The high-resolution powder diffraction data were collected using eight Dectris Mythen2 X series 1 K linear strip detectors. NIST SRM 660b LaB6 was used to calibrate the instrument and refine the monochromatic wavelength used in the experiment.
The peaks were located by interactive profile fitting using JADE Pro (MDI, 2024), and the pattern was indexed (permitting up to 3 unindexed lines) with DICVOL14 (Louër and Boultif, Reference Louër and Boultif2014) on a primitive triclinic unit cell (M(20) = 66.5, F(20) = 253.0) with a = 6.1213(15), b = 8.1557(17), c = 12.7303(17) Å, α = 85.839(20), β = 81.146(20), γ = 71.136(20)°, V = 594.09 Å3, and Z = 2. The space group was assumed to be P-1, which was confirmed by the successful solution and refinement of the structure. A reduced cell search of the Cambridge Structural Database (Groom et al., Reference Groom, Bruno, Lightfoot and Ward2016) yielded no hits.
The diroximel fumarate molecule was downloaded from PubChem (Kim et al., Reference Kim, Chen, Cheng, Gindulyte, He, He, Li, Shoemaker, Thiessen, Yu, Zaslavsky, Zhang and Bolton2023) as Conformer3D_COMPOUND_CID_73330464.sdf. It was converted to a *.mol2 file using Mercury (Macrae et al., Reference Macrae, Sovago, Cottrell, Galek, McCabe, Pidcock, Platings, Shields, Stevens, Towler and Wood2020). The crystal structure was solved using Monte Carlo simulated annealing techniques as implemented in EXPO2014 (Altomare et al., Reference Altomare, Cuocci, Giacovazzo, Moliterni, Rizzi, Corriero and Falcicchio2013). Eight of the 10 trials yielded essentially the same solution.
Rietveld refinement was carried out with GSAS-II (Toby and Von Dreele, Reference Toby and Von Dreele2013). Only the 3.5–50.0° portion of the pattern was included in the refinements (d min = 0.969 Å). All non-H bond distances and angles were subjected to restraints, based on a Mercury/Mogul Geometry Check (Sykes et al., Reference Sykes, McCabe, Allen, Battle, Bruno and Wood2011, Bruno et al., Reference Bruno, Cole, Kessler, Luo, Motherwell, Purkis, Smith, Taylor, Cooper, Harris and Orpen2004). The Mogul average and standard deviation for each quantity were used as the restraint parameters. The dioxopyrrolidine rings were restrained to be planar. The restraints contributed 2.7% to the overall χ2. The hydrogen atoms were included in calculated positions, which were recalculated during the refinement using Materials Studio (Dassault Systèmes, 2023). The U iso of the heavy atoms were grouped by chemical similarity. The U iso for the H atoms was fixed at 1.3× the U iso of the heavy atoms to which they are attached. The peak profiles were described using the generalized microstrain model (Stephens, Reference Stephens1999). Preferred orientation was described using a second-order spherical harmonics model (Von Dreele, Reference Von Dreele1997). The background was modeled using a 6-term shifted Chebyshev polynomial, with a peak at 10.86° to model the scattering from the Kapton capillary and any amorphous component.
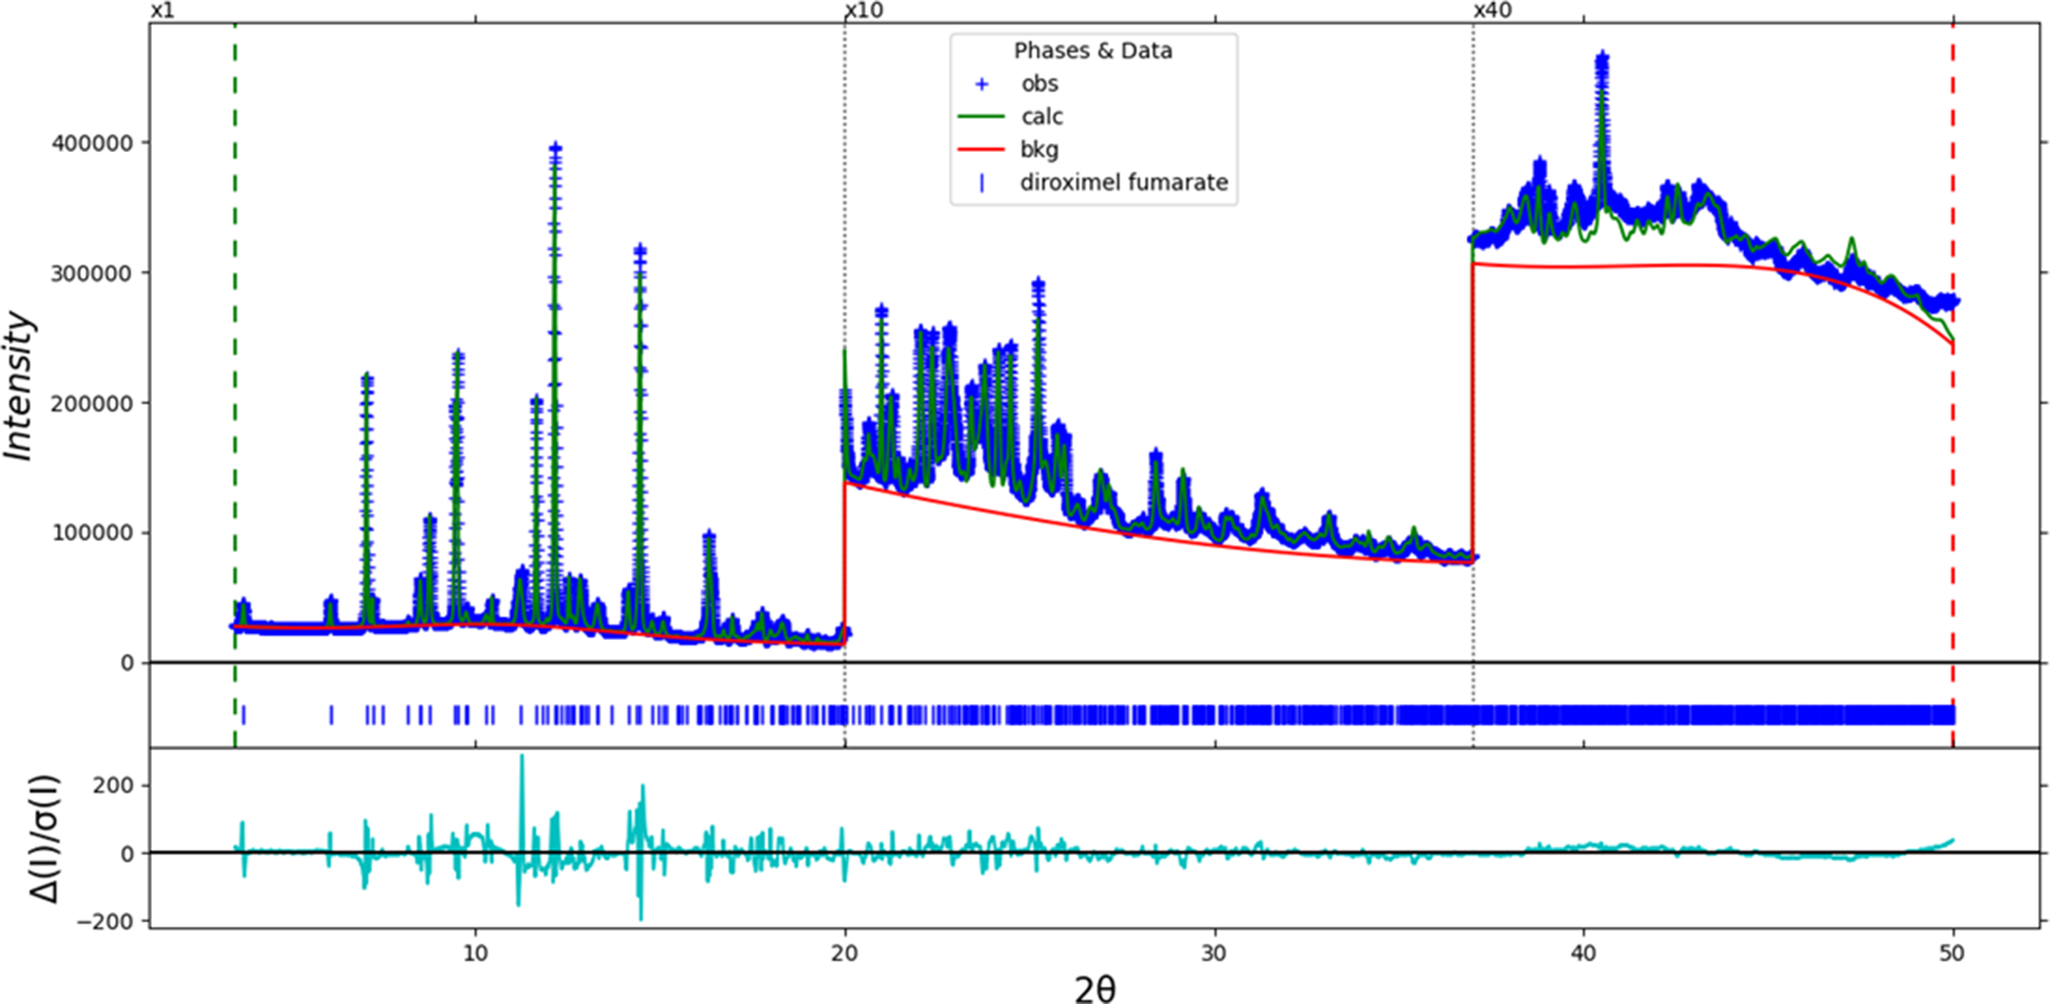
The final refinement of 94 variables using 18,601 observations and 42 restraints yielded the residual R wp = 0.0424. The largest peak (1.51 Å from C8) and hole (0.90 Å from C18) in the difference Fourier map were 0.55(11) and −0.41(11) eÅ−3, respectively. The final Rietveld plot is shown in Figure 2. The largest features in the normalized error plot are in the description of the amorphous scattering and the shapes and positions of some of the low-angle peaks. These misfits probably indicate a change in the specimen during the measurement.
The Rietveld plot for diroximel fumarate. The blue crosses represent the observed data points, and the green line is the calculated pattern. The cyan curve is the normalized error plot, and the red line is the background curve. The vertical scale has been multiplied by a factor of 10× for 2θ > 20.0°, and by a factor of 40× for 2θ > 37.0°.
The crystal structure of diroximel fumarate was optimized (fixed experimental unit cell) with density functional theory techniques using VASP (Kresse and Furthmüller, Reference Kresse and Furthmüller1996) through the MedeA graphical interface (Materials Design, 2024). The calculation was carried out on 32 cores of a 144-core (768 Gb memory) HPE Superdome Flex 280 Linux server at North Central College. The calculation used the GGA-PBE functional, a plane wave cutoff energy of 400.0 eV, and a k-point spacing of 0.5 Å−1 leading to a 3 × 2 × 1 mesh, and took ~23 min. Single-point density functional theory calculations (fixed experimental cell) and population analysis were carried out using CRYSTAL23 (Erba et al., Reference Erba, Desmarais, Casassa, Civalleri, Donà, Bush, Searle, Maschio, Daga, Cossard, Ribaldone, Ascrizzi, Marana, Flament and Kirtman2023) and CRYSTAL17 (Dovesi et al., 2018). The basis sets for the H, C, N, and O atoms in the calculation were those of Gatti et al. (Reference Gatti, Saunders and Roetti1994). The calculations were run on a 3.5 GHz PC using 8 k-points and the B3LYP functional and took ∼1.0 h.
III. RESULTS AND DISCUSSION
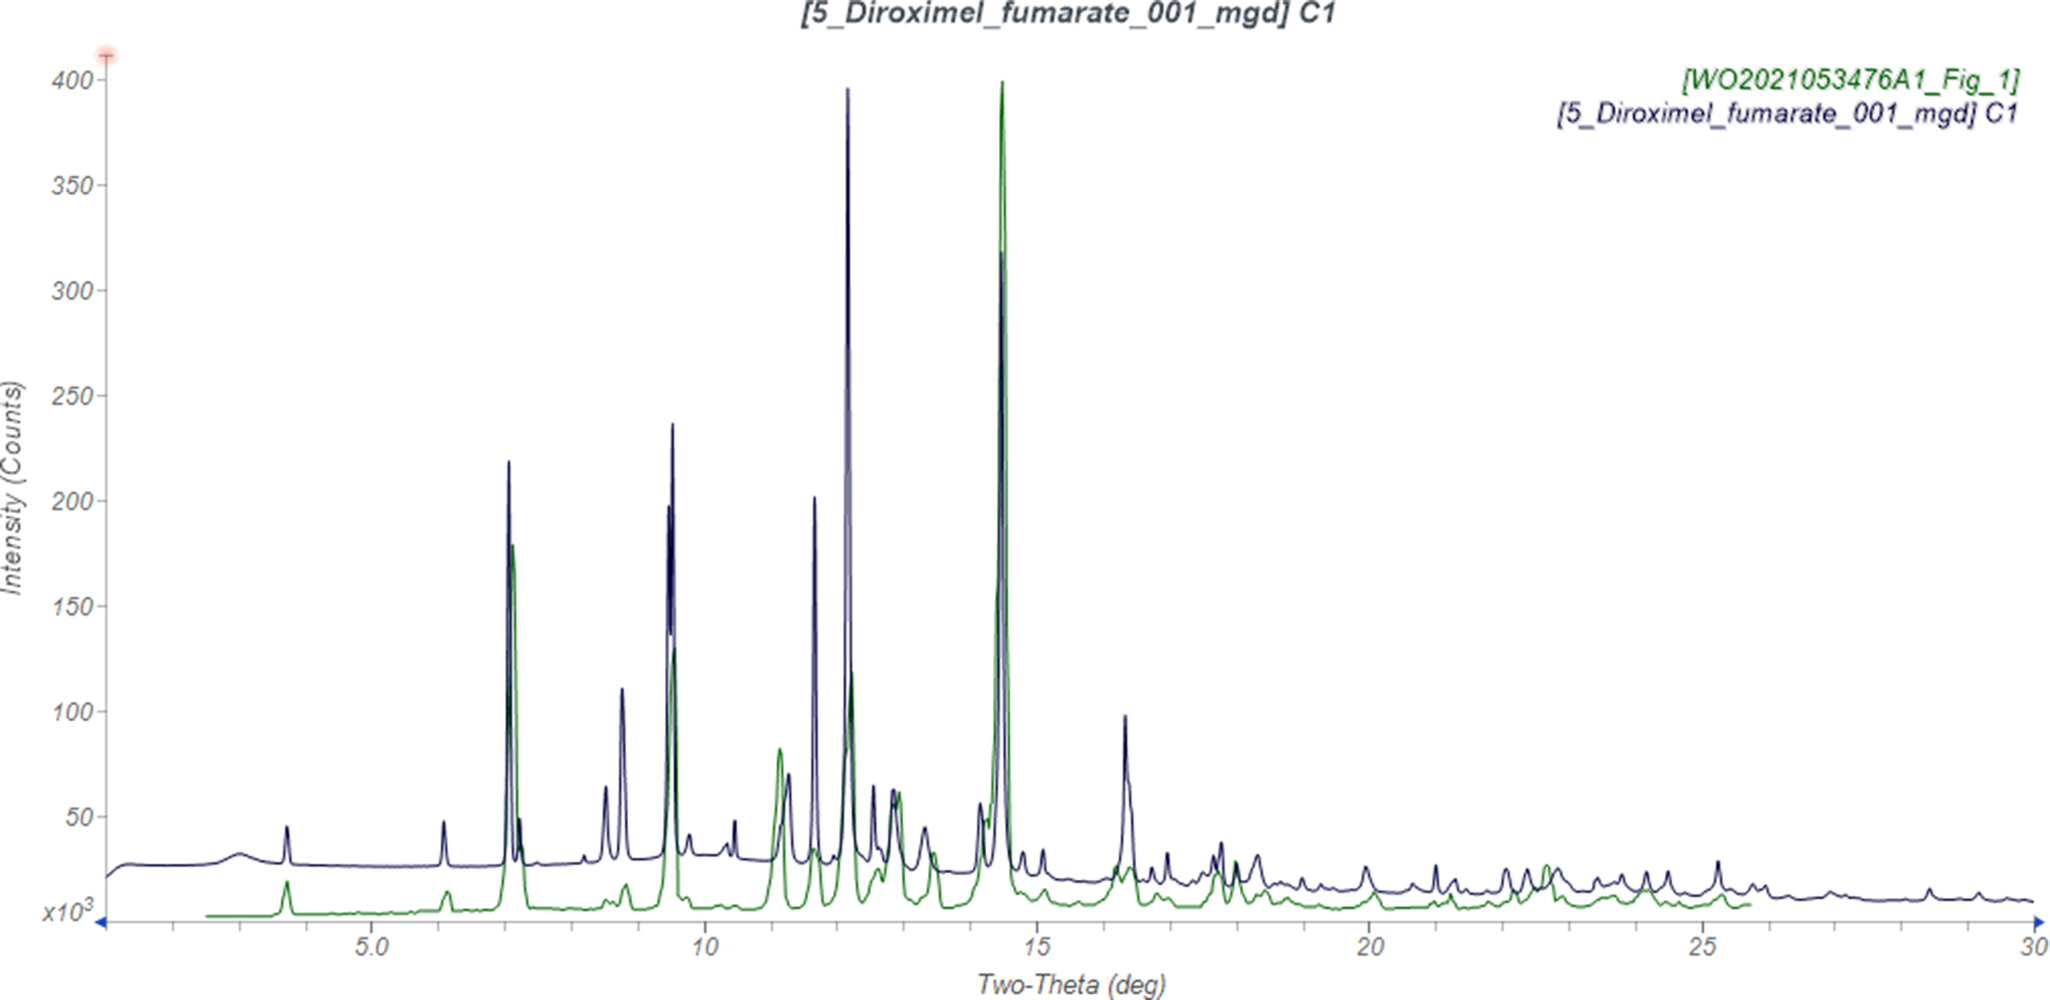
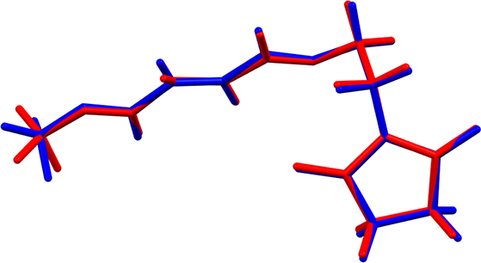
This synchrotron pattern of diroximel fumarate matches that of Chand et al. (Reference Chand, Patil, Deshmukh, Gampawar, Godase, Naik, Kadam, Peddy, Bhujade and Bhirud2021) well enough to conclude that they represent the same material, and thus that our material is representative (Figure 3). The root-mean-square Cartesian displacement of the non-H atoms in the Rietveld-refined and VASP-optimized molecules is 0.076 Å (Figure 4). The agreement is within the normal range for correct structures (van de Streek and Neumann, Reference van de Streek and Neumann2014). The major difference is in the orientation of the hydrogen atoms in the methyl group, but this is to be expected since those positions were calculated using force field techniques. The asymmetric unit is illustrated in Figure 5. The remaining discussion will emphasize the VASP-optimized structure.
Comparison of the synchrotron pattern of diroximel fumarate (black) to that reported by Chand et al. (Reference Chand, Patil, Deshmukh, Gampawar, Godase, Naik, Kadam, Peddy, Bhujade and Bhirud2021; green). The literature pattern (measured using Cu Kα radiation) was digitized using UN-SCAN-IT (Silk Scientific, 2013) and converted to the synchrotron wavelength of 0.819563(2) Å using JADE Pro (MDI, 2024). Image generated using JADE Pro (MDI, 2024).
Comparison of the Rietveld-refined (red) and VASP-optimized (blue) structures of diroximel fumarate. The root-mean-square Cartesian displacement is 0.076 Å. Image generated using Mercury (Macrae et al., Reference Macrae, Sovago, Cottrell, Galek, McCabe, Pidcock, Platings, Shields, Stevens, Towler and Wood2020).
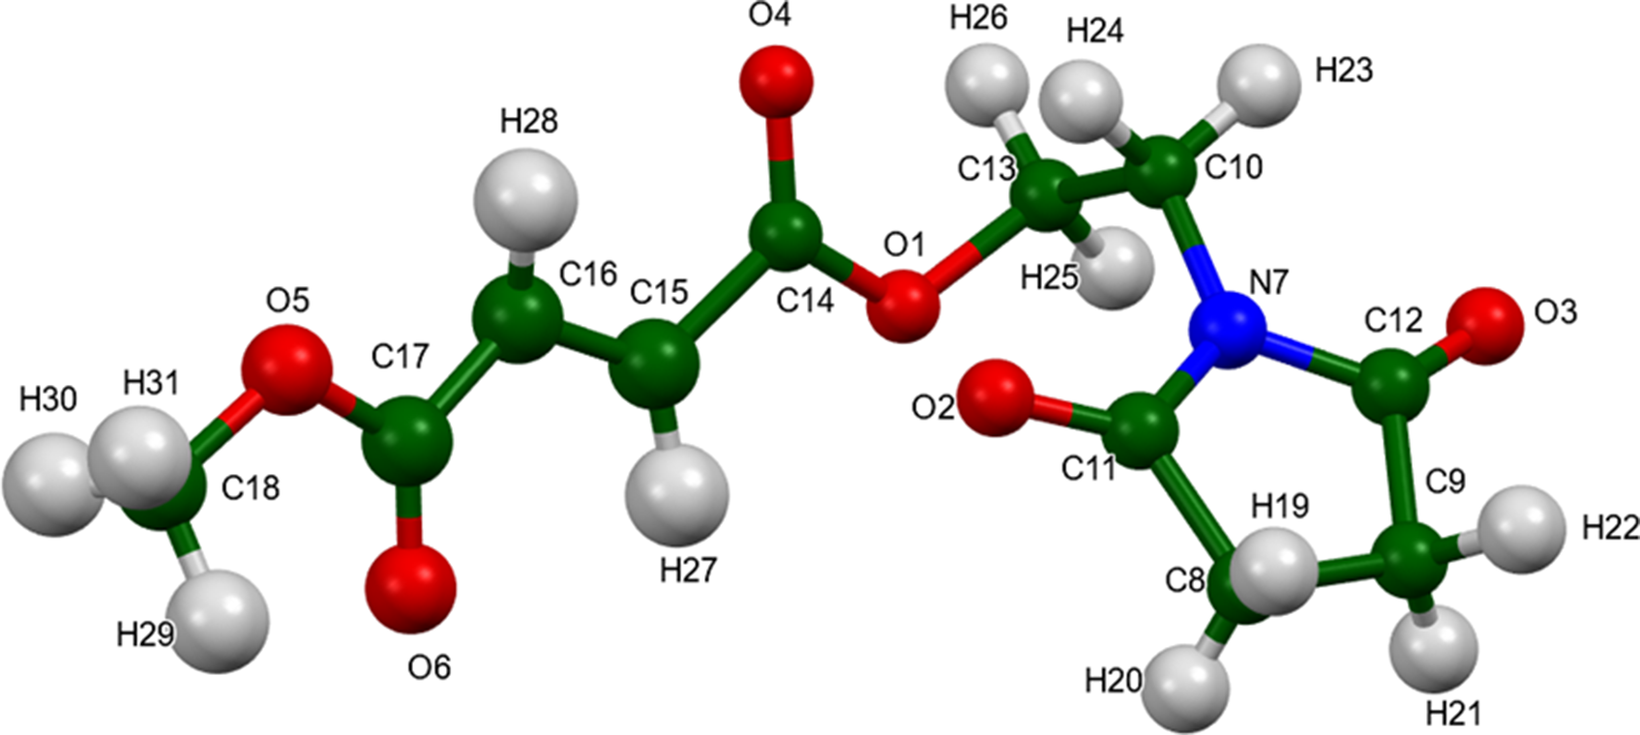
The asymmetric unit of diroximel fumarate, with the atom numbering. The atoms are represented by 50% probability spheroids. Image generated using Mercury (Macrae et al., Reference Macrae, Sovago, Cottrell, Galek, McCabe, Pidcock, Platings, Shields, Stevens, Towler and Wood2020).
All bond distances, bond angles, and torsion angles fall within the normal ranges indicated by a Mercury Mogul Geometry check (Macrae et al., Reference Macrae, Sovago, Cottrell, Galek, McCabe, Pidcock, Platings, Shields, Stevens, Towler and Wood2020). Quantum chemical geometry optimization of the isolated molecule (DFT/B3LYP/6-31G*/water) using Spartan ‘24 (Wavefunction, 2023) indicated that the observed conformation is 1.8 kcal/mol lower in energy than the local minimum, which has a similar conformation (rms displacement = 0.306 Å). The global minimum-energy conformation is 6.6 kcal/mol lower in energy, but has a kinked side chain, showing that intermolecular interactions are important in determining the solid-state conformation.
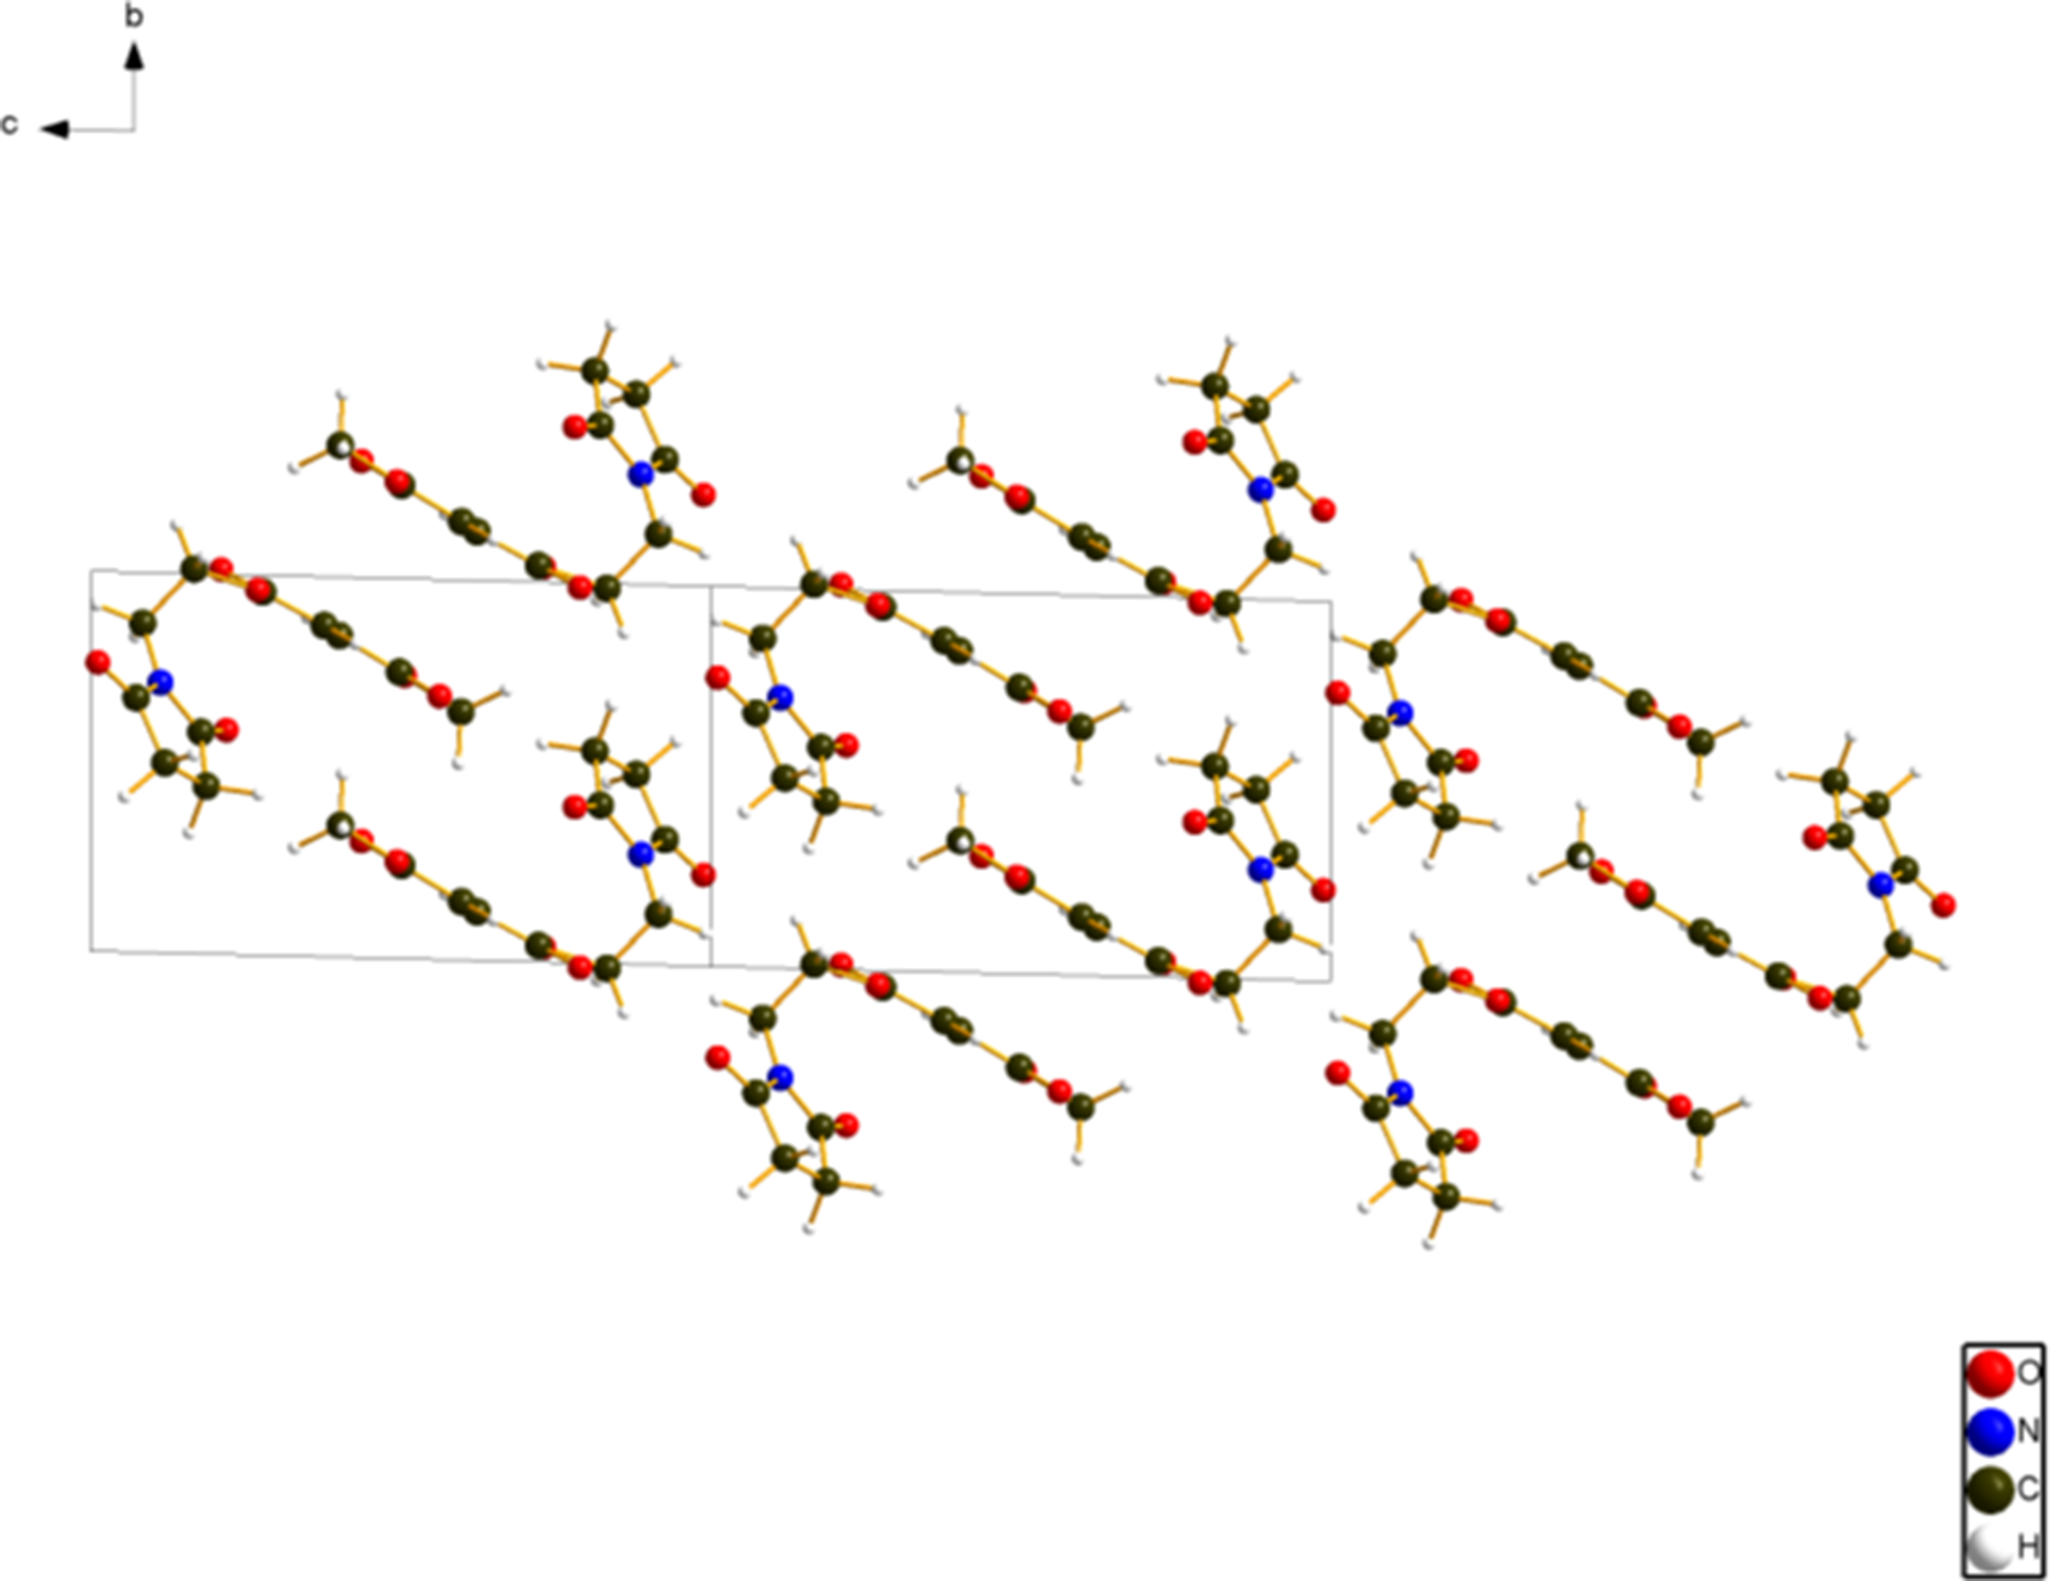
The crystal structure (Figure 6) consists of interleaved double layers of hook-shaped molecules parallel to the ab-plane. The side chains form the inner portion of the layers, and the rings comprise the outer surfaces. The mean plane of the side chain is approximately 0, 9, -8, and that of the dioxopyrrolidine ring is −7, −14, 25.
The crystal structure of diroximel fumarate, is viewed down the a-axis. Image generated using Diamond (Crystal Impact, Reference Putz and Brandenburg2023).
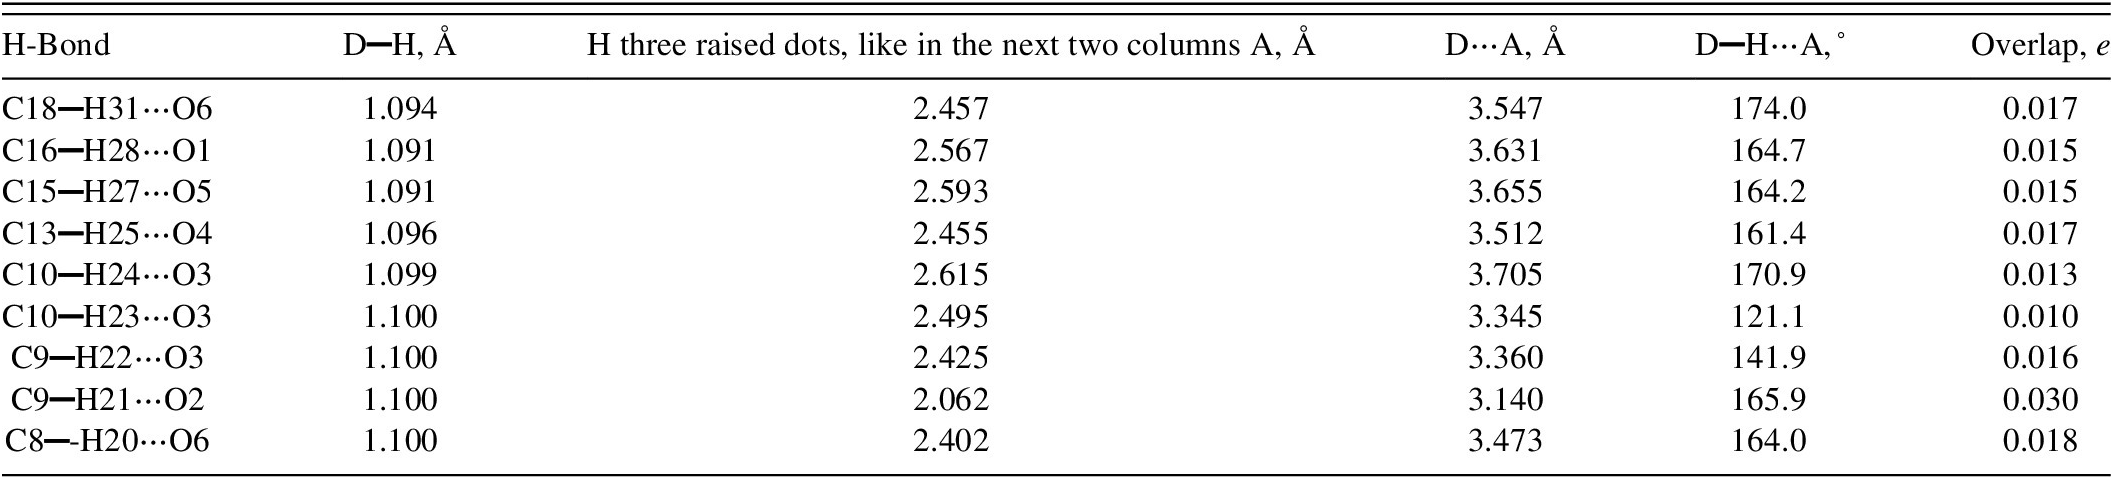
Analysis of the contributions to the total crystal energy of the structure using the Forcite module of Materials Studio (Dassault Systèmes, 2023) indicates that angle distortion terms dominate the intramolecular energy. The intermolecular energy is dominated by electrostatic repulsions. The hydrogen bonds are better discussed using the results of the DFT calculation. There are no classical hydrogen bonds in the structure, but nine C▬H⋯O hydrogen bonds (Table I) contribute to the crystal energy.
Hydrogen bonds (CRYSTAL23) in diroximel fumarate.
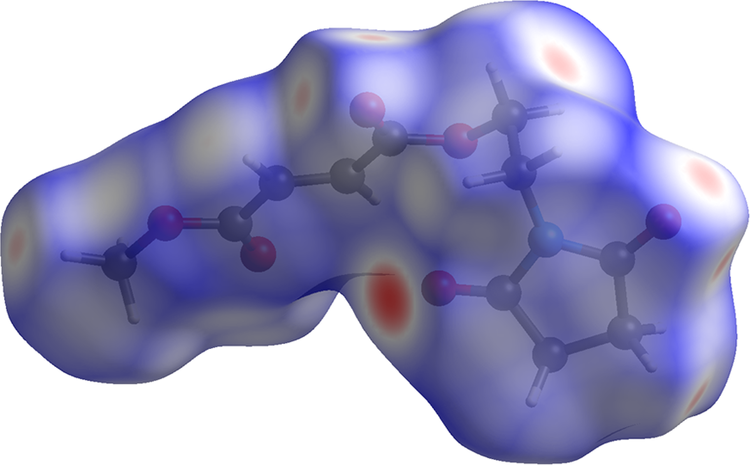
The volume enclosed by the Hirshfeld surface of diroximel fumarate (Figure 7, Hirshfeld, Reference Hirshfeld1977, Spackman et al., Reference Spackman, Turner, McKinnon, Wolff, Grimwood, Jayatilaka and Spackman2021) is 291.68 Å3, 97.97% of the unit cell volume. The packing density is thus fairly typical. The only significant close contacts (red in Figure 7) involve the hydrogen bonds. The volume/non-hydrogen atom is smaller than normal, at 16.5 Å3.
The Hirshfeld surface of diroximel fumarate. Intermolecular contacts longer than the sums of the van der Waals radii are colored blue, and contacts shorter than the sums of the radii are colored red. Contacts equal to the sums of radii are white. Image generated using CrystalExplorer (Spackman et al., Reference Spackman, Turner, McKinnon, Wolff, Grimwood, Jayatilaka and Spackman2021).
The Bravais–Friedel–Donnay–Harker (Bravais, Reference Bravais1866, Friedel, Reference Friedel1907, Donnay and Harker, Reference Donnay and Harker1937) algorithm suggests that we might expect platy morphology for diroximel fumarate, with {001} as the major faces. A second-order spherical harmonic model was included in the refinement. The texture index was 1.011(0), indicating that the preferred orientation was not significant in this rotated capillary specimen. The relative intensities in the pattern of Chand et al. (Reference Chand, Patil, Deshmukh, Gampawar, Godase, Naik, Kadam, Peddy, Bhujade and Bhirud2021) are very different. A refinement using the digitized patent pattern indicates that the specimen was highly textured, with a texture index >5. We might then expect a significantly preferred orientation in typical flat plate samples of diroximel.
DEPOSITED DATA
The powder pattern of diroximel fumarate from this synchrotron data set has been submitted to ICDD for inclusion in the Powder Diffraction File. The Crystallographic Information Framework (CIF) files containing the results of the Rietveld refinement (including the raw data) and the DFT geometry optimization were deposited with the ICDD. The data can be requested at pdj@icdd.com.
ACKNOWLEDGMENTS
Part of the research described in this article was performed at the Canadian Light Source, a national research facility of the University of Saskatchewan, which is supported by the Canada Foundation for Innovation (CFI), the Natural Sciences and Engineering Research Council (NSERC), the Canadian Institute of Health Research (CIHR), the Government of Saskatchewan, and the University of Saskatchewan. This work was partially supported by the International Centre for Diffraction Data. We thank Adam Leontowich for his assistance in the data collection. We also thank the ICDD team – Megan Rost, Steve Trimble, and Dave Bohnenberger – for their contribution to research, sample preparation, and in-house XRD data collection and verification.
CONFLICTS OF INTEREST
The authors have no conflicts of interest to declare.


 Open access