


Governance is a costly business in electoral terms. Existing studies show the average government party losing support at the next election (Nannestad and Paldam Reference Nannestad and Paldam1999; Wlezien Reference Wlezien2017). At the same time, observers have found a u-shaped pattern of support for government parties throughout the electoral cycle: declining support at first, followed by a (partial) recovery (e.g., Tufte Reference Tufte1975; Erikson Reference Erikson1988; Campbell Reference Campbell1991). The strength of this “recovery” is, however, a point of contention: does government support decline in a monotonic fashion (Mueller Reference Mueller1970; Hix and Marsh Reference Hix and Marsh2011; Döring Reference Döring2016) or do we observe a u-shaped “electoral cycle effect”?
Most work on this pattern of cyclical support for government parties in parliamentary democracies has analyzed mid-term or second-order elections, often in one or few countries (see, e.g., Reif and Schmitt Reference Reif and Schmitt1980; Hix and Marsh Reference Hix and Marsh2007). Instead of looking at second-order election results to map party support during an electoral cycle, we capture parties’ standing in national opinion polls. The unique cross-national focus is possible thanks to the availability of voting intention polls across many countries (Jennings and Wlezien Reference Jennings and Wlezien2016, Reference Jennings and Wlezien2018). This allows us to empirically examine the electoral cycle effect in much more detail than previous studies have done and to describe the conditions under which the electoral cycle effect is more pronounced.
By analyzing more than 25,000 opinion poll results for government parties from 171 electoral cycles between 1955 and 2017, we provide the first comparative study about patterns of government party support throughout the legislative cycle. We find that government parties tend to lose support during the first half of an electoral cycle, and can at most partially recover from these losses in the second part of the cycle. A small rise in support during the second half of the cycle tends to exist for single party governments and when the prime minister has the power to call early elections. Our analysis of general patterns as well as institutional and election-specific determinants contributes to the literature on political representation, responsiveness, and the political business cycle.
The electoral cycle effect
We define the expected pattern of support over a parliamentary term as the electoral cycle effect: government party support will decrease during the first part of an electoral cycle, and increase prior to the next election, while opposition party support will first increase and then decrease. Figure 1 plots a stylized version of what this cycle might look like under a single-party government. When a cabinet gets elected into office, the government is likely to enjoy a short “honeymoon” period of public support for a few months (phase 1). Afterward, we expect support to start declining. Election campaigns may have raised hopes in the electorate, but the government might be unable to fulfill the expectations of many voters (Mueller Reference Mueller1970; Stimson Reference Stimson1976). Moreover, grievance-asymmetry theory suggests that voters punish government parties more strongly for things that go badly than rewarding them for favorable outcomes (Nannestad and Paldam Reference Nannestad and Paldam1999). As a result, the support for the government should decrease (phase 2).
The expected popularity of government parties throughout an electoral cycle. Note: The electoral cycle ranges from the government inauguration date to the next election date.
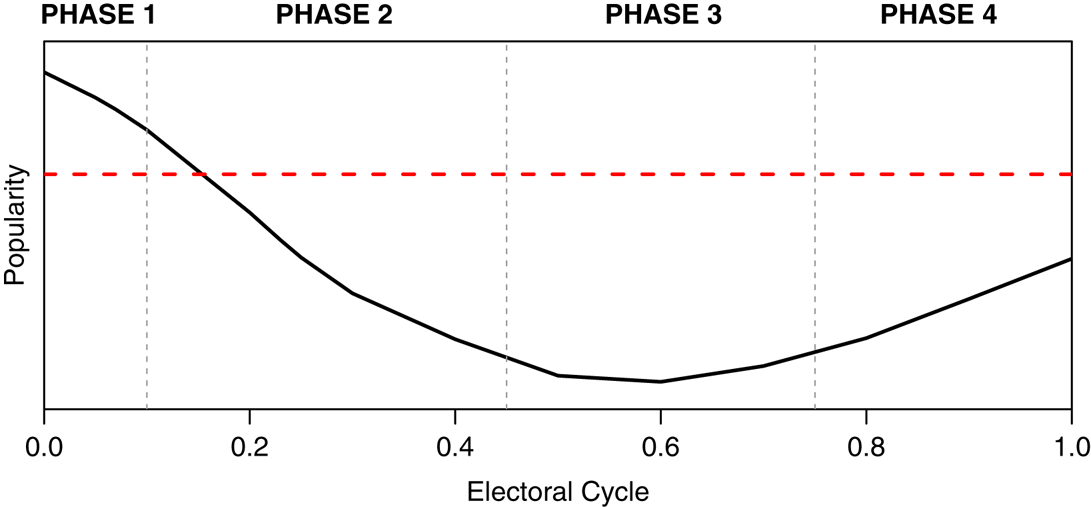
Yet, we expect a partial recovery from these losses. Following a period of stable, but low support (phase 3), government support should increase when the next election comes closer (phase 4). Previous studies about US elections show that governments try to enact policies with highly visible benefits in the election year, while voters are likely to reward incumbents for high growth in the last six months, rather than the entire term (Healy and Lenz Reference Healy and Lenz2013; Achen and Bartels Reference Achen and Bartels2016). Moreover, disapproval throughout a cycle may be a form of punishment by party supporters, but when the next election comes closer voters are more likely return to their former vote choice (Miller and Mackie Reference Miller and Mackie1973; Reif and Schmitt Reference Reif and Schmitt1980). Increased partisan mobilization may also contribute to this recovery (Michelitch and Utych Reference Michelitch and Utych2018).
We would not expect the electoral cycle effect to be equally strong under all circumstances. Based on the existing literature, we identify a number of moderator variables that we expect to affect the existence and strength of the electoral cycle effect. We argue, based on the “clarity of responsibility” literature, that the electoral cycle effect is weaker if voters do not know which party to blame for government policy (Powell and Whitten Reference Powell and Whitten1993, 398). In majoritarian systems and under single party governments, clarity of responsibility is higher than in coalition governments (Powell Reference Powell2000; Lijphart Reference Lijphart2012). It is more difficult for voters to determine which party should be held accountable for policies or the state of the economy when executive power is shared among more than one party. When a country is governed by a coalition, we would expect the largest party to be identified most strongly with the government and therefore show a stronger electoral cycle effect than junior opposition parties. Lastly, we expect that a lack of clarity of responsibility will result in weaker electoral cycle effects under minority governments. These governments require support from at least part of the opposition to implement their legislative agenda, which makes it more difficult for voters to hold specific parties to account for government policies (De Vries, Edwards, and Tillman Reference De Vries, Edwards and Tillman2011).
Voters’ abilities to assign responsibility for policy to parties is partly balanced out by parties’ abilities to control the electoral cycle. Calling elections strategically can be advantageous for government parties: they can use the timing of the elections to maximize their support, for example by enacting policies that provide benefits in the election year or by holding elections when the economy is doing well (Schleiter and Tavits Reference Schleiter and Tavits2016). Although these attempts are not always successful, we should expect that on average higher party control over election timing results in a stronger recovery for government parties in the last phase of the electoral cycle. Therefore, we predict the electoral cycle effect to be more pronounced when the prime minister has strong institutional powers to decide on dissolution of parliament (Goplerud and Schleiter Reference Goplerud and Schleiter2016). All in all, we thus expect to see stronger electoral cycle effects under single party governments, for the largest parties in coalitions, for majority governments, and when the prime minister has strong dissolution powers.
Data and measurement
Although the precision of opinion polls for forecasting election results has been criticized, unquestionably polls play a role in (the media coverage of) politics, and within a margin of error show the relative standing of parties. We make use of recent datasets that contain poll data from legislative and presidential elections (Jennings and Wlezien Reference Jennings and Wlezien2016, Reference Jennings and Wlezien2018). We limit our analysis to legislative elections resulting in a sample of 22 countries, 171 electoral cycles, and 25,333 polls for government parties (see Tables A1 and A2 in the Supplementary Material for descriptive statistics). The unit of observation is a polling result for a government party. If more than one poll was published for the same party on the same day, the poll results are averaged. The dependent variable is the Poll change of each party calculated as difference between the current poll and the vote share at the previous election. For example, if party A gained 40 percent of the votes and drops to 30 percent in a poll, Poll change amounts to −10. The main independent variable Electoral cycle measures the difference between the date when a poll was published and the date of the government inauguration divided by the actual length of the electoral cycle. The variable can thus take values between 0 (inauguration) and 1 (day of upcoming election). The expected curvilinear effect of the time in the electoral cycle on poll support is modeled by including the square of Electoral cycle. We also add the cubic value of the Electoral cycle to allow for more complicated patterns of government party support over the electoral cycle. Including the cubic value improves the model fit and mirrors the loess regression lines (Figure A1 in the Supplementary Material) better.
We derive information on the type of government from the European Representative Democracy Data Archive (Andersson, Bergman, and Ersson Reference Andersson, Bergman and Ersson2014) and the ParlGov dataset (Döring and Manow Reference Döring and Manow2018). The variable Single party government indicates whether the cabinet was formed by ministers from only one party. Minority government captures if a government commanded a majority in the lower house of the parliament. From the polling datasets (Jennings and Wlezien Reference Jennings and Wlezien2016, Reference Jennings and Wlezien2018), we recode a binary variable Largest party that indicates whether a party was the largest one in the coalition. The index developed by Goplerud and Schleiter (Reference Goplerud and Schleiter2016) operationalizes the dissolution power of the prime minister (PM dissolution power) and the government’s power to dissolve the parliament (Government dissolution power). Both indices range on a continuous scale between 0 and 10 with a higher number signaling stronger dissolution power. We also add Party support at the last election and the Election year to control for the possibility that the electoral cycle effect has changed over time and that the “costs of ruling” (Stevenson Reference Stevenson2002) increased in recent decades. The economic situation prior to an election has a considerable impact on vote choice (see, e.g., Lewis-Beck and Stegmaier Reference Lewis-Beck and Stegmaier2000). An increase in GDP growth prior to an election is usually attributed to the incumbent resulting in increased popularity (Achen and Bartels Reference Achen and Bartels2016). We therefore merge each poll result with the economic situation during the lagged growth rate of the Gross Domestic Product (GDP) compared with the previous quarter and add GDP change to all models. To check whether the relative GDP growth within a country leads to different conclusions, we also standardize GDP change by country and decade.
We test the relationship between the dependent and independent variables in a linear mixed-effects multilevel model with random intercepts for legislative cycles, parties and countries. As outlined above, our time variable (Electoral cycle) is expressed between 0 and 1 to allow for a comparison between election cycles and because countries and polls are taken at irregular intervals. Therefore, a panel data setup is not feasible and a multilevel model is the most appropriate choice. Autocorrelation of support for a party through a cycle is a potential issue that is explored in Section C of the Supplementary Material: when we model autocorrelation using a Continuous Autoregressive (CAR1) structure, our results are comparable in substantive terms and the findings presented here remain statistically significant (Pinheiro and Bates Reference Pinheiro and Bates2000, 229). The basic model includes the following independent variables: El. cycle, El. cycle 2, El. cycle 3, GDP Change, Party support at last election, Election year. To test the expectations, we add the interaction effects of the respective variable with El. cycle, El. cycle 2, and El. cycle 3.
Results
Our basic model explains the change in support for government parties as a function of the electoral cycle. Figure 2(a) reports the expected values of support change across the electoral cycle, keeping all other variables at their mean or modes. The model predicts that on average government parties, see a decline in party support over the first half of the electoral cycle. Afterward, governments experience a very slight recovery, but cannot return to the levels when the government was inaugurated. The shape of the effect in the basic model mirrors the results of a bivariate analysis that fits a loess line to the relationship between the electoral cycle and government party support change (see Figure A1 in the Supplementary Material). On average, we do not observe an increase in support prior to the next election. The similarity of the shape between the base model and the loess regression shows that the findings are not artifacts of our modeling strategy.
Moderated electoral cycle effects. Note: The bands around the lines show the 95 percent confidence intervals. Figures are based on Models 1–3 of Table A3 in the Supplementary Material.
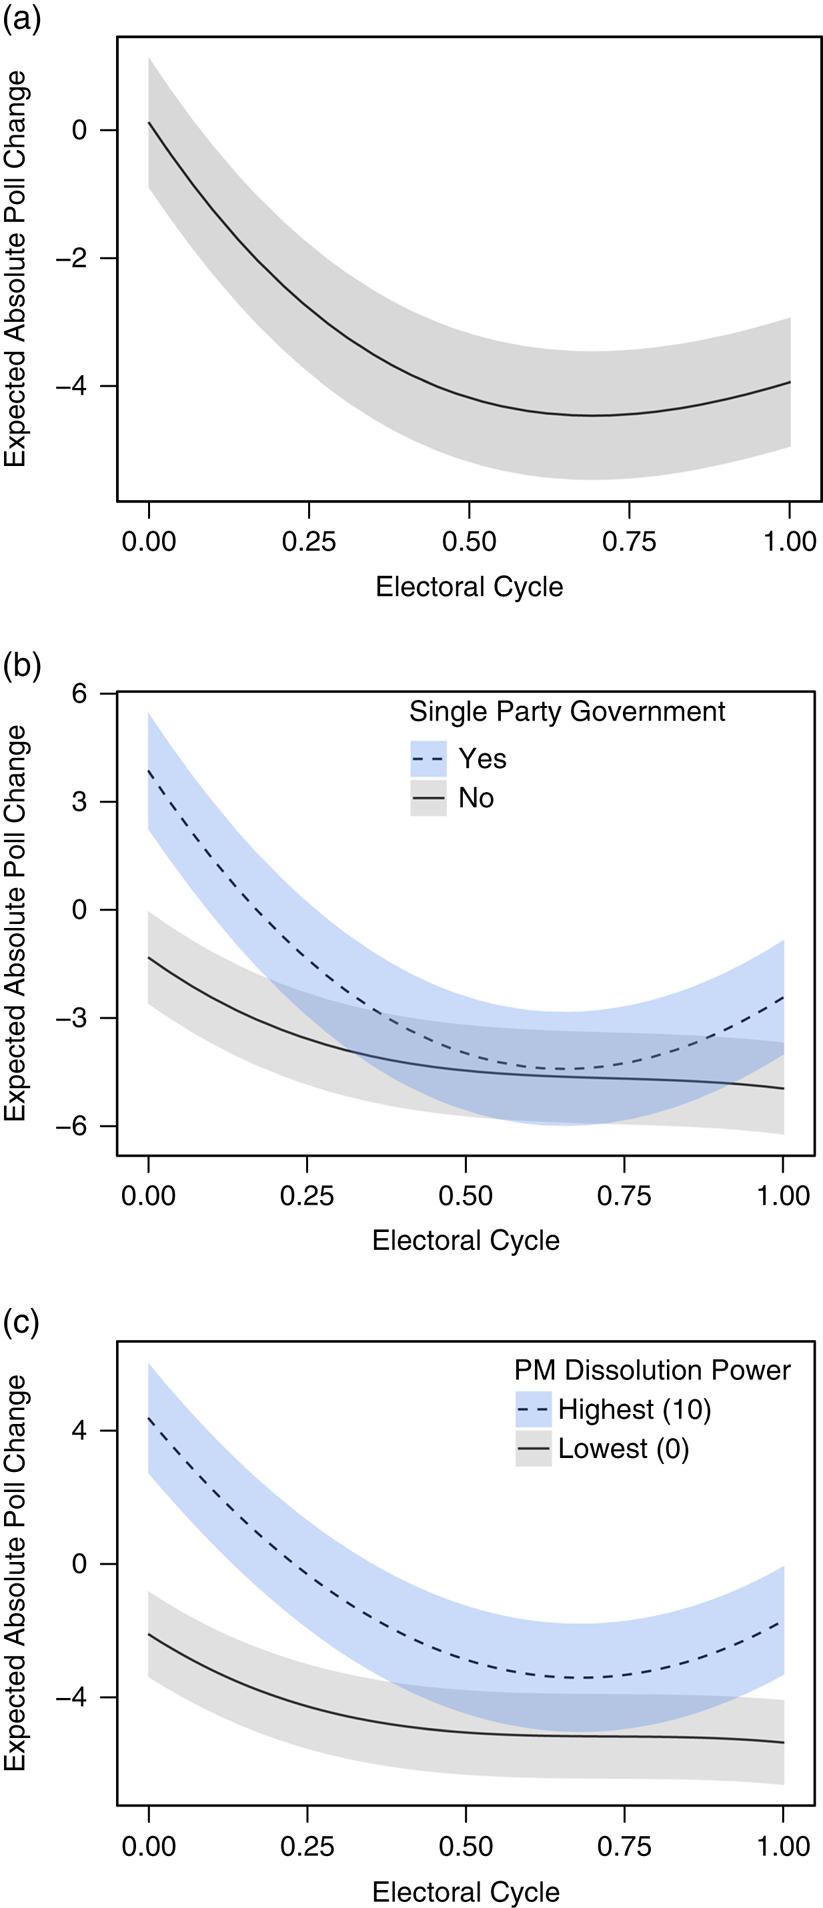
How does this electoral cycle effect differ between systems and governments? First, we compare single party and multi-party governments (Figure 2(b)). Single party governments show a somewhat u-shaped electoral cycle effect, starting off well with early gains, but gradually losing support over the electoral cycle. The lowest point is reached at around 70 percent of the electoral cycle, after which the single government party recovers somewhat. For other types of governments (coalition or minority cabinets), we do not see a similar pattern. These government parties seem to be losing quite consistently over the electoral cycle, with only a slight, mostly linear decline. Against our expectations, neither being the largest party in the coalition nor minority government have a substantial impact on the electoral cycle effect (see Figures A5(a) and A5(b) in the Supplementary Material).
Regarding the dissolution power of governments, our analysis points to a sizable impact of prime ministerial dissolution power on the electoral cycle of government party support (Figure 2(c)). When prime ministerial control is at the highest level (10 on a 0–10 scale), we observe a u-shaped pattern of government party support, starting off at a high level of support. When the prime minister has no control over the election timing, there seems to be only a limited electoral cycle effect with some losses early in the cycle that level off towards the second half of the term. These effects are not observable when dissolution power lies with the government as a whole (Figure A5(e) in the Supplementary Material). The strategic use of election timing thus only seems to work when it is put in the hand of a single, unified actor.
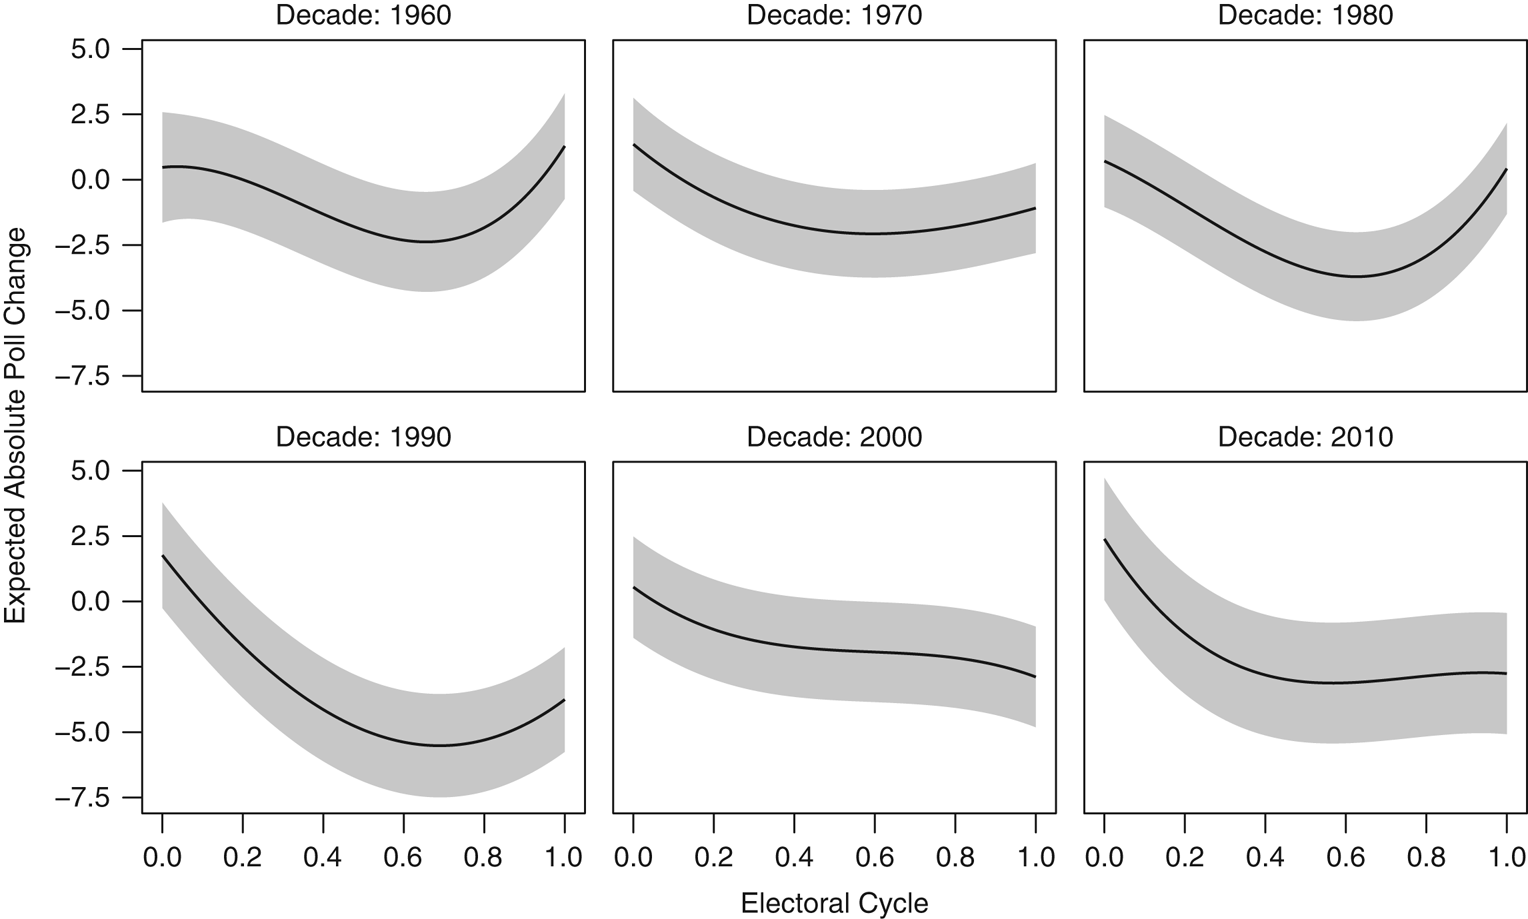
Do we observe a change in the “electoral cycle effect” over time? Having polling data for seven countries since the 1960s (Australia, Canada, Denmark, Germany, The Netherlands, Norway, and UK) allows us to test our model on this sub-sample and interact the absolute poll change with the decade of an election. Figure 3 shows that the u-shaped electoral cycle effect was stronger in the 1960s–90s, and has almost disappeared entirely since the 2000s. The cost of governing increased without the prospect of earning back support, particularly in countries with single party governments and strong prime ministerial dissolution power. Thus, whereas in the past government support was more likely to follow a u-shaped pattern, a linear decline is prevalent more recently. One potential explanation is the decline of party identification (Dalton Reference Dalton2000): dissatisfied government party supporters might have been more likely to “return” to their party at the general election ballot box in the past than they are today. Another reason for this development is the ideological convergence of political parties, especially in the UK. Parties’ vote-seeking behavior might lead them to converge “too close” to the median voter, which reduces the clarity of the electoral choice between the two main contenders in a majoritarian system (Laver Reference Laver2011, 494). The Supplementary Material reports several robustness checks; in all cases these confirm the results presented here. First, the patterns based on institutional clarity of responsibility are confirmed when conditioning the electoral cycle effect on (Lijphart’s Reference Lijphart2012) executive-parties and federal-unitary dimensions. Second, the models presented above include one moderator variable for the electoral cycle at a time to avoid multicollinearity due to including multiple interaction effects. Adding all of the significant variables to a single model confirms the patterns reported above. Third, we performed an analysis that included the subset of 15 countries for which we have at least three cycles. Fourth, we changed our measure of Poll change by looking at the percentage deviation from the election result, and ran an additional model with a lagged dependent variable. Fifth, instead of using the length of the actual cycle, we also measure the electoral cycle by using the “planned” length (i.e., the maximum number of years of a legislative period) as the end point of a cycle. Finally, in many countries, the government can strategically set the election date which could influence the shape of the support throughout the cycle. We distinguish between regular and early (opportunistic or failure) elections (Schleiter and Tavits Reference Schleiter and Tavits2016). Regular elections show a modest u-shaped electoral cycle effect with losses early in the term and a slight recovery from about midway through the cycle. In opportunistically called elections, we observe a recovery at the end of the cycle, whereas failure elections are characterized by a steady, almost linear, decline of government party support.
Historical development of the electoral cycle effect. Note: This model only includes countries with available polling data since the 1960s (Australia, Canada, Denmark, Germany, The Netherlands, Norway, and UK). Each panel includes all cycles that ended in the respective decade. The gray bands show the 95 percent confidence intervals. The figure is based on Model 4 (Table A3) in the Supplementary Material.
Discussion
Our results document the “electoral cycle effect” throughout more than 170 legislative cycles. The often assumed u-shaped electoral cycle pattern predicted from the study of mid-term and second-order elections holds only under certain circumstances. While we found consistent evidence that government party support decreases during the first part of an electoral cycle, parties recover from these losses at most partially. Our general pattern matches best with recent analyses of national government parties’ results in European Parliament elections (Hix and Marsh Reference Hix and Marsh2011; Döring Reference Döring2016). A curvilinear effect is more evident under single party governments and if the prime minister has high dissolution power. Small coalition partners tend to lose more support compared with the largest coalition party. Despite these general trends, we still observe large deviations across countries and cycles. We hope that future research examines potential reasons for this variation more closely.
These findings are relevant to the broader comparative debate on the representative link between voters and party governments. Parties increasingly seem to have to choose between responsible and representative party government or, to put it slightly differently, between office and votes (Mair Reference Mair2009). Whereas parties might accept that there is some cost to governing, the knowledge that it will be difficult to regain early losses might be particularly worrisome from the perspective of responsible party government. Further research is warranted to study the causes of these changes in the prevalence of the electoral cycle effect: Is this an indirect effect of modern, critical voters, or do supply-side factors explain why government parties cannot recover their electoral losses?
Supplementary Material
To view supplementary material for this article, please visit https://doi.org/10.1017/psrm.2018.47
Acknowledgments
The authors thank the participants of the 2017 EPSA Annual Conference and the Leiden Political Science seminar for helpful comments. The excellent feedback from the anonymous reviewers and the PSRM editor significantly helped us to improve the quality of this article. Stefan Müller acknowledges support from the Irish Research Council (IRC) Government of Ireland Postgraduate Scholarship Programme.


 Open access