


The origin of the Penrose hypothesis
The Penrose hypothesis,Reference Penrose1 first postulated over 80 years ago, states that an inverse relationship exists between psychiatric in-patient numbers and the prison population: when the in-patient population decreases the prison population will increase. The hypothesis was conceptualised by studying 18 European countries, using a cross-sectional design in 1939. In the original work, Penrose specifically referred to two types of mental disorder in relation to the hypothesis: ‘insanity’ (mental illness) and ‘intellectual insufficiency’ (intellectual disability, also known as learning disability in UK health services), with both of these contributing to the association. Penrose also noted that in countries with smaller psychiatric in-patient bed numbers, the psychiatric in-patient population showed a gender split similar to the prison population, with a higher proportion of men.Reference Penrose1
Previous investigations relating to the Penrose hypothesis
A series of longitudinal studies have investigated the Penrose hypothesis over varying time periods. In six South American countries, the hypothesis was confirmed over a 21-year period;Reference Mundt, Chow, Arduino, Barrionuevo, Fritsch and Girala2 for every psychiatric bed closed there was an increase of five prisoners. Further research supported the Penrose hypothesis in six out of seven European countries studied over periods between 12 and 36 years, using regional and national data (Italy was the exception).Reference Priebe, Badesconyi, Fioritti, Hansson, Kilian and Torres-Gonzales3,Reference O'Neill, Kelly and Kennedy4 A Norwegian studyReference Hartvig and Kjelsberg5 over a period of 70 years supported the hypothesis both during a 30-year period when bed numbers increased and during the subsequent 40 years when bed numbers decreased. However, there were large gaps in the data on bed numbers.
Relevance to the National Health Service today
In the UK, as in many advanced healthcare systems, both acute and psychiatric hospital in-patient beds have reduced.6 The National Health Service (NHS) was created in 1948 and psychiatric bed numbers peaked in the 1950s.Reference Davidge, Elias, Jayes, Wood and Yates7 By the 1960s, a new plan was developed for hospitals and bed closures affected all areas of the health service. Reductions in both psychiatric and non-psychiatric beds followed.Reference Triggle8 In this paper, we document changes to NHS hospital in-patient beds and the prison population since the 1960s, and test the Penrose hypothesis over a 58-year period between 1960 and 2018–2019. We aim to investigate whether any association with hospital bed closures is specific for psychiatric beds, and whether this association applies equally to mental illness and intellectual disability beds. We will also conduct additional analysis to see whether there is any difference in the Penrose hypothesis according to gender.
Method
Procedure
Routinely collected data on the average daily number of NHS in-patient beds each year between 1960 and 2008–2009 were obtained from a data request to NHS England. Data for 2008–2009 to 2018–2019 were available on the NHS England website.9 This included data by sector (general and acute, maternity, mental illness, and intellectual disability). Total psychiatric bed numbers were calculated by combining mental illness and intellectual disability. General and acute, and maternity bed numbers were combined to form a non-psychiatric category.
The average end-of-month prison population in England and Wales for each year from 1940 to 2014 was obtained from the Howard League for Penal Reform.10 The data for 2015–2018 were gathered from the Ministry of Justice website.11 These numbers were available for male and female prisoners for the whole time period. The Ministry of Justice website also had separate numbers in custody in Welsh prisons and English prisons for more recent years. This indicated that 96.1% of the prison population was in England. This was used to estimate the prison population in England for the years where only the combined number for England and Wales was available. A sensitivity analysis was conducted replacing 96.1% with 94%, 98% and 100%.
England population data were obtained for 1971–2018 from the Office of National Statistics website.12 The general population of England and Wales from 1960 to 1970 were combined, so an estimate of 94.35% from England was made based on the 1971–1980 data for England and Wales separately for those years.
Ethical approval was not required for this study, as all of the source data were freely available in the public domain.
Analysis
Population-adjusted bed numbers and prison population were calculated per 100 000 population of England for each year. A time series was created with SPSS (Windows, version 25), and annual changes in each variable were calculated with the differencing function. The prison population and psychiatric bed numbers were then correlated against each other across the 58-year study period. A time-lagged analysis was then undertaken comparing bed numbers with the prison population 20 years earlier and up to 20 years later. These analyses were carried out in this way to investigate fully which change (psychiatric in-patients or prison population) came first, and thus potentially influenced the other. The time-lag analysis was carried out to test for any temporal link between the closure of hospital beds and the increase in the prison population. Pearson's correlations were calculated at each time-lag year. These correlations were calculated for annual numbers and annual changes. The association was measured for the total prison population and for the male and female prison populations separately. Similarly, the association was measured for all NHS beds and for the number of psychiatric and non-psychiatric beds. Within psychiatric beds, the association was measured for mental illness and intellectual disability beds.
We chose an alpha level of 0.01, given the multiple time-lag years. We then applied a Bonferroni correction as five variables (three bed types and the male and female prison populations) were used. Therefore, we used the P-value [0.01÷5 = 0.002] for the time-series analysis.
The final step was to create two models by using linear regression. The ‘enter’ function was used on SPSS instead of a stepwise regression. This was carried out at the time lag with the strongest association. The annual change in the prison population was the dependent variable. In model 1, the reduction in psychiatric beds and non-psychiatric beds were the explanatory variables. In model 2, the reductions in mental illness, intellectual disability and non-psychiatric beds were the explanatory variables. The regression models were created to determine the magnitude of the association of the reduction of NHS psychiatric beds and non-psychiatric beds with subsequent changes in the prison population (model 1), and whether this differed between the subcategories of psychiatric beds (mental illness or intellectual disability) (model 2).
Results
Across the 58-year period studied (1960 to 2018–2019), the number of psychiatric beds fell by 90%, from 201 275 to 19 389 (see Table 1), compared with a 56% reduction in non-psychiatric beds (from 246 244 to 108 994). Intellectual disability beds had the largest proportion (98%) of bed closures (56 181 reduction), and 87% of mental illness beds were closed (125 706 reduction).
The number of NHS in-patient hospital beds, the prison population and the total population in England from 1960 to 2018
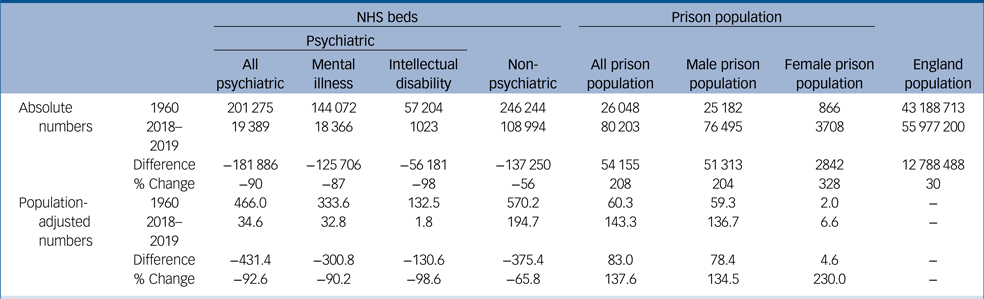
NHS in-patient beds are divided into psychiatric and non-psychiatric. Psychiatric beds are further divided into mental illness and intellectual disability. The total prison population is shown along with the male and female prison populations. Total numbers, population-adjusted (per 100 000) number and the percentage change between the beginning and end of the study period are shown. NHS, National Health Service.
At the same time, the prison population more than trebled, from 26 048 to 80 203 (208% increase). The male prison population increased by 204%, from 25 182 to 76 495; the female prison population increased by 328%, from 866 to 3708. The increase in the prison population between 1960 and 2018 was significantly different for men and women (χ 2 (1, 58) = 80.492, P < 0.001). The population of England increased by nearly 13 million, from 43 188 712 to 55 977 200 (30% increase).
Association between NHS bed numbers and the prison population
The key finding was a very strong inverse association between the prison population and the number of psychiatric beds (r = −0.92, n = 59, P < 0.001) over the 58-year period. This applied across all the time lags, and to the male prison population (r = −0.92, n = 59, P < 0.001) and female prison population (r = −0.88, n = 59, P < 0.001). An equally strong inverse association was found between the prison population and the number of non-psychiatric beds (r = −0.95, n = 59, P < 0.001; male prison population: r = −0.90, n = 59, P < 0.001; female prison population: r = −0.95, n = 59, P < 0.001).
Association between annual reduction of bed numbers and annual change in prison population
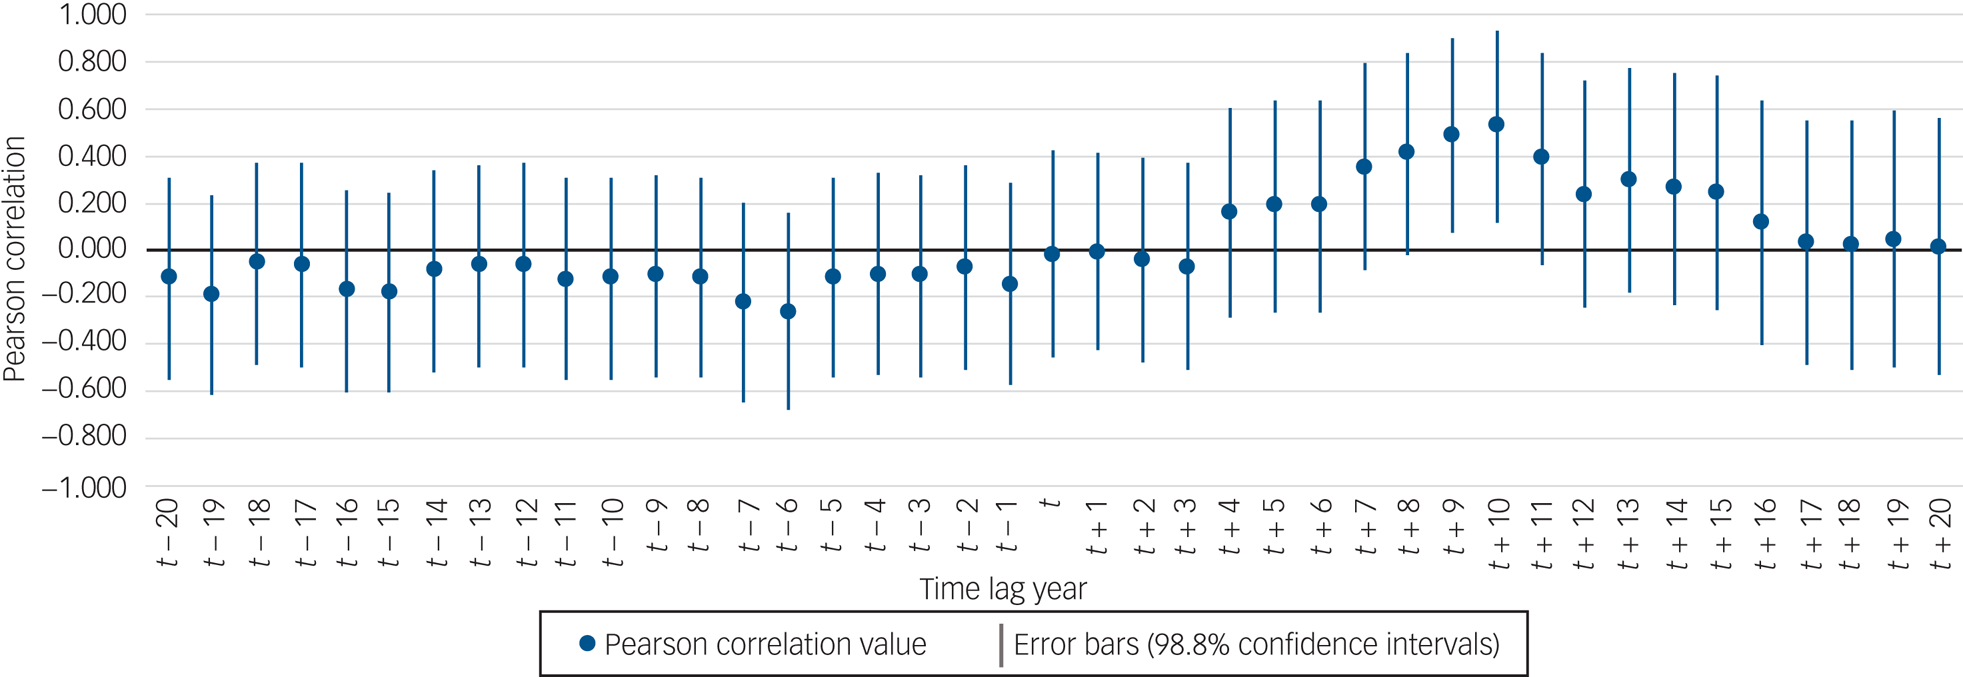
There was a moderately strong and significant association between the annual reduction in psychiatric beds and the subsequent increase in the prison population in later years. Visual inspection of Fig. 1 showed that this association started at a time lag of 4 years, peaked at 10 years (t + 10, r = 0.53, n = 48, P < 0.001) and ended at a lag of 16 years. For the female prison population, the association was significantly positive for six time lags (t + 7, t + 8, t + 9, t + 10, t + 11, t + 12), with the strongest correlation at 10 years (t + 10, r = 0.64). However, for the male prison population, there were significantly positive associations for 2 years (t + 9, t + 10), with the strongest correlation at 10 years (t + 10, r = 0.50).
Associations between annual reduction in psychiatric bed numbers and the annual change in the prison population lagged over a period of 20 years previous (earlier years: t − 20 to t − 1) and 20 years later (later years: t + 1 to t + 20). Significant years of association were identified at t + 9 and t + 10 where error bars do not cross 0. These show a positive association between the reduction of psychiatric bed numbers and the increase in the prison population 9 and 10 years later.
When psychiatric beds were split into constituent parts, there was a significant association between the reduction of intellectual disability beds and the increase in prison population, this was significant for 2 years (t + 9, t + 10), with the strongest being at 10 years (t + 10, r = 0.54, n = 48, P < 0.001), and showed a similar pattern according to gender (female prison population: t + 7, t + 8, t + 9, t + 10, t + 11, with the strongest at 10 years, r = 0.57; male prison population: t + 9, t + 10, with the strongest at 10 years, r = 0.52). The association with the reduction of mental illness beds was weaker and only significant for the female prison population (t + 9, t + 10, t + 11), with the strongest at 11 years (r = 0.56) (see Table 2). The association between annual reduction of non-psychiatric beds and prison population was also only significant for the female prison population (t + 9, t + 10, r = 0.57 for both years).
Time-lagged analysis of the association between the reduction in NHS beds and changes in the prison population in earlier years (on the left) and later years (on the right)
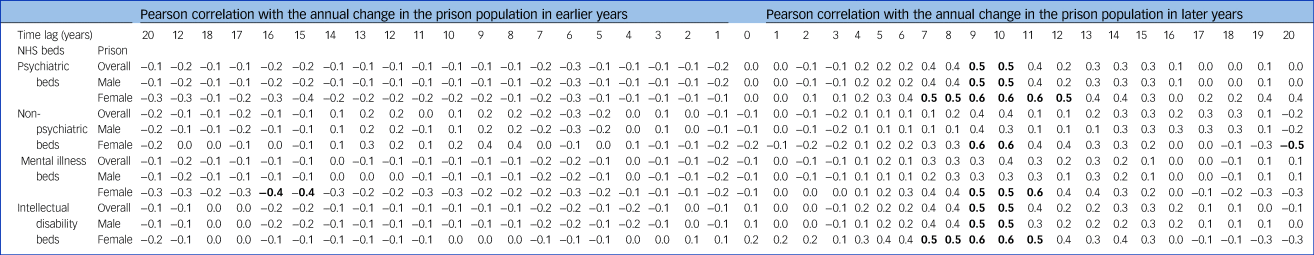
Data are for psychiatric beds and non-psychiatric beds. Psychiatric beds are further divided into mental illness and intellectual disability. For each type of NHS bed, associations are shown with the change in the overall prison population, the male prison population and the female prison population. NHS, National Health Service.
Bolding refers to a significant association at the P < 0.002 significance level.
Linear regression model
In model 1, the reduction in psychiatric bed numbers was a significant explanatory variable for the subsequent increase in the total prison population 10 years later (F(2, 45) = 8.81, P = 0.001, R 2 = 0.28). The same findings applied to the male prison population (F(2, 45) = 7.72, P = 0.001, R 2 = 0.26). Both the reduction in psychiatric beds and non-psychiatric beds were significant explanatory variables for the subsequent increase in the female prison population (F(2, 45) = 19.2, P < 0.001, R 2 = 0.46) (see Table 3).
Regression models 1 (using annual change in prison population at t + 10 years as the dependent variable and annual reduction in psychiatric and non-psychiatric as explanatory variables) and 2 (using annual change in the prison population at t + 10 years as the dependent variable and annual reduction in mental illness, learning disability, and non-psychiatric beds as explanatory variables).
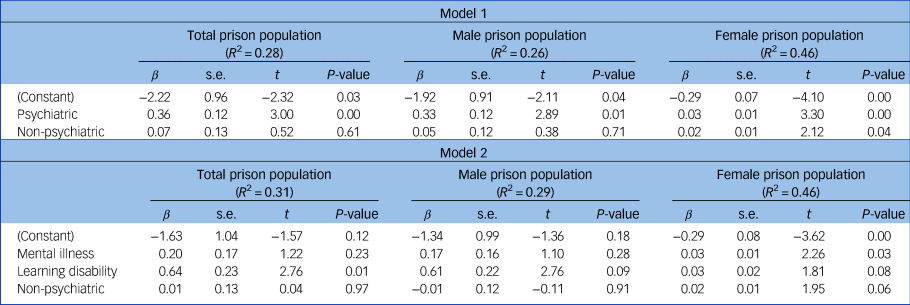
In model 2, the reduction in intellectual disability beds was an explanatory variable for the subsequent increase in the total prison population 10 years later (F(3, 44) = 6.67, P = 0.001, R 2 = 0.31). In contrast, the reduction in mental illness beds was a significant explanatory variable for the increase in the female prison population 10 years later, with a trend toward the reduction in intellectual disability beds and non-psychiatric beds (see Table 3). There was no significant explanatory variable for the rise in the male prison population.
In the sensitivity analysis, the previously identified associations persisted.
Discussion
Over the 58-year period studied, there was a very strong inverse relationship between the number of psychiatric beds and total prison population. This finding supports the Penrose hypothesis and is consistent with a number of previous studies across many countries.Reference Mundt, Chow, Arduino, Barrionuevo, Fritsch and Girala2–Reference Hartvig and Kjelsberg5
We also found an inverse relationship between the number of non-psychiatric NHS hospital beds and the prison population. However, when the association between annual change in NHS bed numbers was studied, the following important findings were identified. First, the association between the reduction of NHS beds with the increase in the prison population was only significant for psychiatric beds, and was not significant for non-psychiatric beds. Furthermore, this association was strongest at a lag of 10 years: the reduction of psychiatric beds was associated with an increase in the prison population 10 years later. This annual reduction of psychiatric beds was more strongly associated with the increase in the female prison population.
Recent researchReference Jones and Talbot13 has suggested that for some with less severe intellectual disability, or within the borderline intellectual functioning category, the move from hospital to the community may have led some to come into contact with the criminal justice system, where (before bed closures) these risks had previously been managed in hospital under mental health legislation.Reference Lindsay, Steele, Smith, Quinn and Allan14 Previous experience in New Zealand found that removing intellectual disability from mental health legislation led to concerns that more offenders with intellectual disabilities ended up in prison, meaning that new legislation was required.Reference Smith15 It remains to be seen whether the UK Department of Health's Transforming Care Policy of further closures of the few remaining NHS intellectual disability in-patient units has had an impact on offenders with intellectual disability and access to appropriate treatment in hospital.Reference Taylor, McKinnon, Thorpe and Gillmer16
Model 1 suggests that for every 100 psychiatric beds that were closed, the average annual increase in the number of prisoners 10 years later was 36. It is worth considering that although the rates of mental disorders described in previous research are high (e.g., one in seven prisoners had major depression or psychosis), these rates do not appear to have increased substantially over the study period.Reference Fazel, Hayes, Bartellas, Clerici and Trestman17 Based on the results of this previous research, it is questionable whether psychiatric hospital bed closures directly influenced an increase the prison population in the way that our results suggest, which may weaken our support for the Penrose hypothesis.
Although the regression model eliminated the effects of non-psychiatric bed reduction on the increase in the prison population, the collinearity between the two variables (change in psychiatric and non-psychiatric beds) is a limitation that should be considered when interpreting these findings. However, the results of analyses, in which we have controlled for secular changes in the provision of in-patient hospital care in general, supported the view that there was an independent association between the annual change in psychiatric bed numbers and future (time-lagged) changes in the size of the prison population.
Model 2 suggests that the effect size of closing intellectual disability beds was much greater than the effect of closing mental illness beds on the number of prisoners 10 years later: there were 64 additional prisoners for every 100 intellectual disability bed closures compared with 20 additional prisoners for every 100 mental illness bed closures. If correct, this would suggest that there may be high rates of intellectual disability within the male prison population. This has been previously identified,Reference Hayes, Shackell, Mottram and Lancaster18 but there is a lack of consensus within the research literature regarding the changing numbers of people with an intellectual disability in prison. A recent meta-analysis reported intellectual disability prevalence rates in prison between 1 and 70%,Reference García-Largo, Martí-Agustí, Martin-Fumadó and Gómez-Durán19 reflecting a wide variety of methodologies used to attempt these prevalence estimates.Reference McBrien20 If the most modest estimates are true, then it may not follow that intellectual disability bed closures had a large impact on the prison population 10 years later. However, the poor quality of existing evidence means it is impossible to have certainty without robust contemporaneous estimates of prevalence.
There were noteworthy differences according to gender. For example, in model 1, for every 100 psychiatric beds closed the model predicts three more female prisoners on average 10 years later, compared with 33 more male prisoners (a ratio of 11:1). In 1960, the male:female prisoner ratio was close to 30:1; by 2018, this was 20:1. One interpretation is that the closure of hospital beds had a greater impact on the female prison population and was the reason why female prisoners made up an increasing proportion of the total prison population over time.
Data are not available on the number of male and female psychiatric in-patients throughout the study period, but there is evidence that since the move to treatment in the community for mental health disorders, there has been an increase in the proportion of male in-patients in psychiatric services. This aligned with another observation made by Penrose: in places where there were fewer psychiatric patients, the gender split of psychiatric in-patients more closely resembled that found in prisons. What we observed was that as the prison population increased, it became more similar to the psychiatric in-patient population with regard to gender. In model 2, the reduction in mental illness beds explained the most variance in the female prison population 10 years later. This was in line with previous research that identified a higher prevalence of mental illness in the female prison population compared with the male prison population.Reference Gunn21,Reference Tyler, Miles, Karadag and Rogers22 We also found a trend for the reduction in intellectual disability beds and non-psychiatric beds to be associated with the increase in the female prison population.
Limitations and future research direction
Arguably, this was an ‘alternative’ test of the Penrose hypothesis, as the number of psychiatric beds was used as a proxy measure of the number of in-patients; this was a limitation of the study, as Penrose used the actual number of in-patients. The number of patients admitted into a bed each year may have changed during the time period because of the length of stay getting shorter,Reference House, West, Smith, Tubeuf, Guthrie and Trigwell23 but these data were not available for each bed type for the years 1960 to 2018–2019. Further, we were unable to consider the effect of readmissions: although there may be more total admissions with a shorter length of stay, we could not simply say that therefore more patients are admitted because a proportion would have likely been repeated admissions of the same patients. Should such data become available, future research should account for this to more accurately measure the number of patients, similar to the original Penrose study. However, the key message remained – there was still an association between the number of hospital beds and the prison population. This suggested that there were effects of reducing bed numbers that went beyond simply how many patients could be accommodated: fewer beds may have caused longer waits and delays to admission, which may have resulted in pressure on the criminal justice system and instigated increases in the prison population, as a subset of those who may have been admitted to hospital may now be imprisoned as a result of the lack of NHS beds.
A proportion of NHS-funded psychiatric in-patient care is provided by privately run hospitals. This increased during the study period, especially in later years of the study.24 Data on private psychiatric beds, including nursing homes and 24-hour care facilities, were not included because this information was not routinely collected by the UK Government. Additionally, prior researchReference Mundt, Chow, Arduino, Barrionuevo, Fritsch and Girala2 has considered the influence of economic factors on the Penrose hypothesis, but economic data were not included in this research. However, the 58 years studied contained both periods of recession and growth in the UK economy. Recessions occurred in the mid-1970s, the early 1980s, the early 1990s and in 2008. Despite this, we found that the association held across the study period.
Furthermore, although England has differential socioeconomic statuses between areas, the association was still observed in England; this is despite previous research finding that the Penrose hypothesis did not hold true in countries of varying socioeconomic status.Reference Blüml, Waldhör, Kapusta and Vyssoki25 Data was not available on psychiatric bed numbers by region across the study period, and prisoners are often placed in prison at some distance from their home, making it more complicated to research this effect at a regional level. Future research could investigate the Penrose hypothesis by using multi-level analysis in the context of area-level socioeconomic deprivation.
Moreover, the many potential confounders with known effects on the prison population (including rates of homelessness and crime, population drug use, the increase in secure hospital beds and the rate of people under the care of community mental health services) were not accounted for in the data analysis as they were not available for each individual year of study. The absence of these data may have biased our findings away from the null. Future research utilising population-level data may be useful to account for these confounders. At present, the study highlights the correlation between psychiatric bed numbers and prisoner numbers, and the associations according to gender and bed type. These correlations and models should be tested in future research in light of other population-level confounders, such as drug use and crime rates.
Strengths
By calculating population-adjusted numbers per 100 000, the changes in the population of England have been accounted for, which allowed for more robust comparisons between years. Additionally, longitudinal data were essential to determine direct associations between variables. This provides a greater amount of confidence in the conclusions of this research. The extended time period used is a strength when compared with previous research; to our knowledge, this is the longest time period of consecutive years studied for the Penrose hypothesis. Finally, our research incorporates novel additions to the study of the Penrose hypothesis, as it analysed non-psychiatric beds and separately investigated the male and female prison populations in relation to NHS beds.
In conclusion, there was a very strong inverse relationship between NHS bed numbers and the prison population between 1960 and 2018–2019 in England. This association was specific for psychiatric beds, and was strongest at a time lag of 10 years. Therefore, the Penrose hypothesis held true in England, but the association occurs at a lag of a number of years, something that was not considered in previous research nor the original 1939 hypothesis. The reason for this lag of 10 years needs further research. We also found evidence that the association differed according to gender and psychiatric bed type (mental illness and intellectual disability).
Data availability
The data that support the findings of this study are openly available from NHS England (england.nhs.uk/statistics/statistical-work-areas/bed-availability-and-occupancy/bed-data-overnight), Howard League for Penal Reform (https://howardleague.org/prisons-information/), Ministry of Justice (https://www.gov.uk/government/collections/prison-population-statistics) and Office for National Statistics (https://www.ons.gov.uk/peoplepopulationandcommunity/populationandmigration/populationestimates/timeseries/ukpop/pop). Data on some of the earlier years of hospital bed numbers (1960 to 2008–2009) are available from corresponding author, P.K., upon reasonable request.
Author contributions
G.W. and R.A. conceived the study, were responsible for acquisition and analysis of the data, and drafted and approved the published manuscript. S.W. was responsible for analysis and interpretation of the data, and drafted and approved the published manuscript. P.K. and I.M. conceived the study, were responsible for analysis and interpretation of the data, and drafted and approved the published manuscript. All authors are accountable for the accuracy and integrity of their areas of involvement in the study.
Funding
This research received no specific grant from any funding agency, commercial or not-for-profit sectors.
Declaration of interest
None.


 Open access
eLetters
No eLetters have been published for this article.