

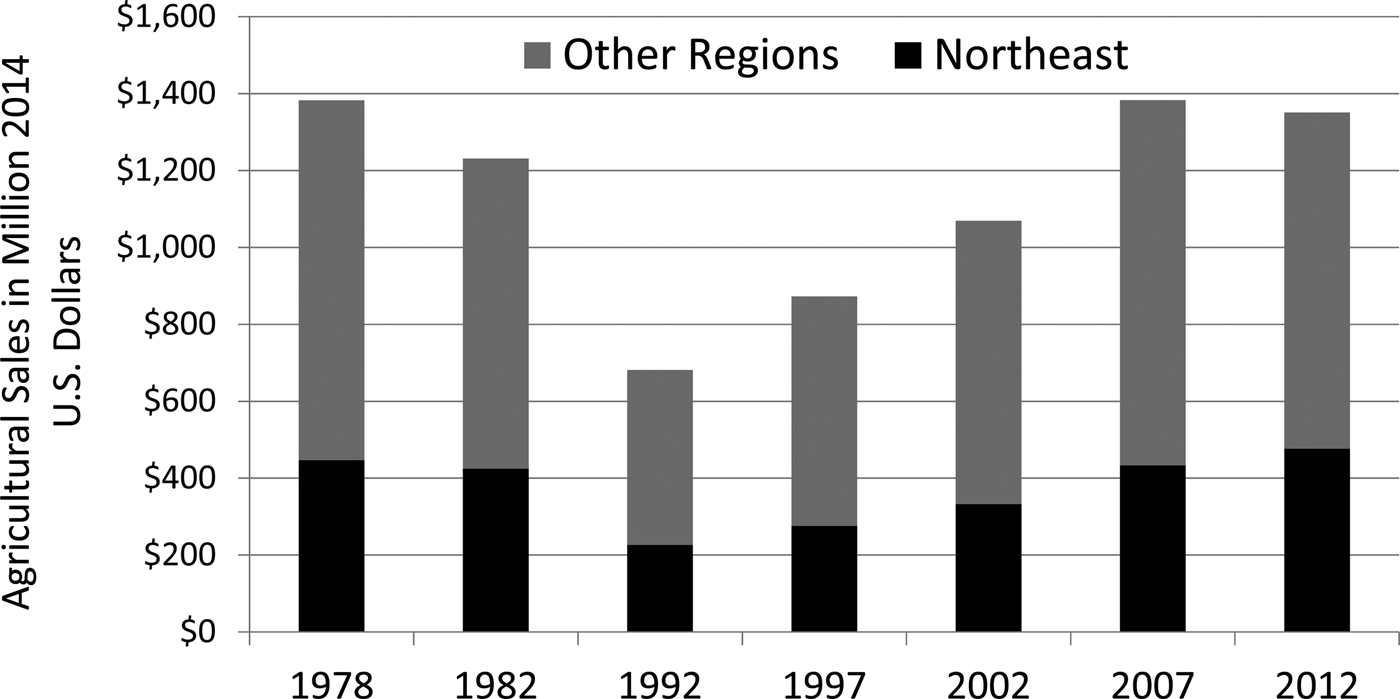
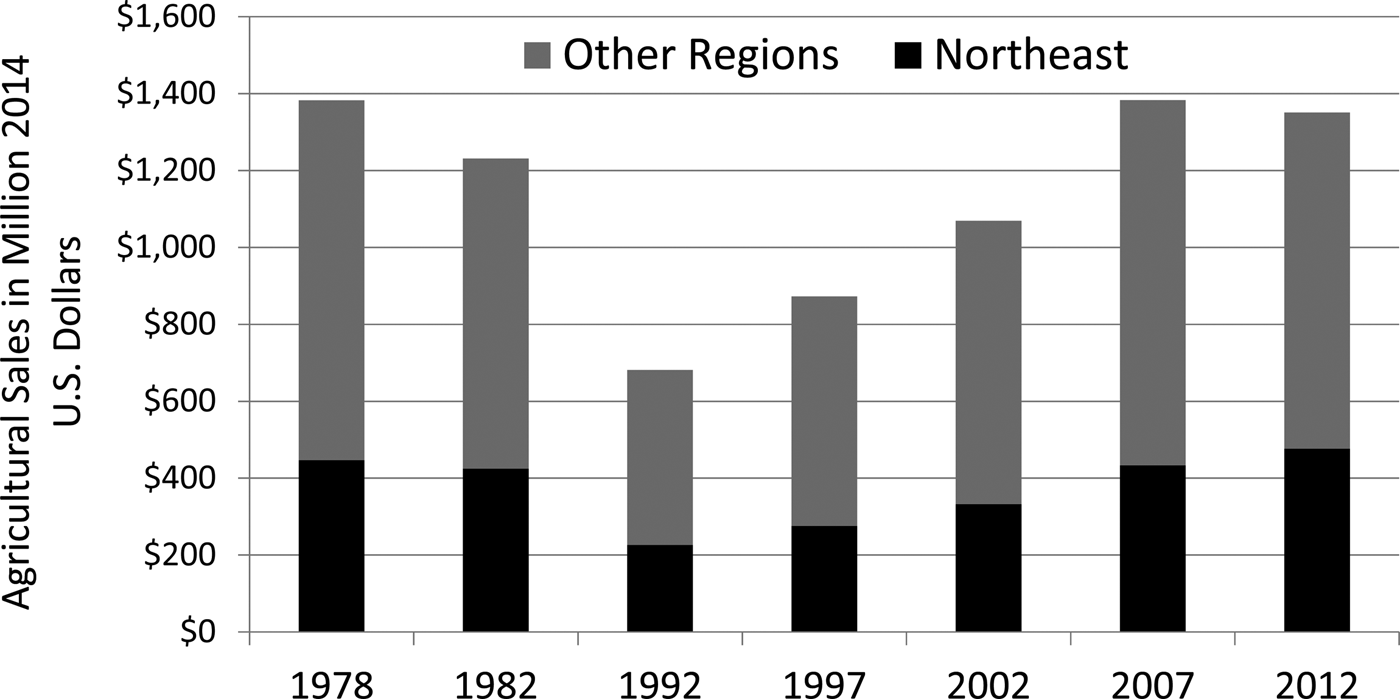
Direct-to-consumer (DTC) agricultural sales—the sale of food for human consumption at farmers' markets and other farmer-to-consumer marketing outlets—in the United States doubled from $0.7 billion in 1992 to $1.4 billion in 2007.Footnote 1 In 2012, however, sales remained at $1.4 billion (Figure 1). It is not clear what part the recession, market saturation, an aging population, or other factors may have played in the plateau between 2007 and 2012. Understanding the factors that influence DTC agricultural sales informs planners, economic development agencies, funders, and farm organizations seeking to support DTC agricultural markets of the conditions and regions where policy interventions can be most effective.
Trends in Direct-to-consumer Agricultural Sales
We estimate the influence of socioeconomic factors in metropolitan areas on county-level DTC agricultural sales in thirteen Northeast states between 1992 and 2012. During that period, there was considerable heterogeneity in terms of changes in per capita income in the metropolitan areas in those states. Some cities experienced relatively large increases in per capita income from growth in service-sector industries while other post-industrial cities lost manufacturing jobs and experienced smaller increases. We exploit this variation to estimate the extent to which changes in per capita income influenced DTC agricultural sales spatially and temporally.
No consensus has emerged in the literature regarding the influence of income on local food purchases (e.g., Byker et al. Reference Byker, Shanks, Misyak and Serrano2012, Martinez et al. Reference Martinez, Hand, Da Pra, Pollack, Ralston, Smith, Vogel, Clark, Tauer, Lohr, Low and Newman2010). Understanding how income influences DTC agricultural purchases is pertinent because income effects are ambiguous theoretically. Higher incomes imply that shoppers have a greater ability to purchase the kinds of foods prominent in such markets, such as fruits, vegetables, and specialty cuts of locally raised meat, while also increasing the opportunity cost of time for at-home food preparation. Prior studies are challenging to generalize since their results are specific to particular DTC market segments, states, and/or time periods. Furthermore, they focused primarily on whether income levels could predict the frequency of DTC agricultural purchases or consumers' attitudes regarding purchasing local food rather than on the level of purchases directly.
Our study methodology is distinguished by use of panel data, which allows us to estimate factors that influence the demand for DTC agricultural products over a longer period than previous studies. Another novel aspect is that we estimate the socioeconomic influences on DTC agricultural sales premised on the geographic distance between counties and urban centers rather than using data from a single political boundary definition as done in previous studies. We follow the framework proposed by Swenson (Reference Swenson2010) in geographically conceptualizing local food markets as it provides a more accurate depiction of market opportunities available to DTC farmers.
We find that a $1,000 increase in per capita income in metropolitan areas within 100 miles of a county increases the county's DTC agricultural sales by an average of $70,900 per year. When analyzing metropolitan areas within 150 miles, sales increase by an average of $57,200 per year. These parameter estimates correspond to an income elasticity of 2.2 to 2.7 (i.e., a 10 percent increase in income corresponds to a 22–27 percent increase in sales of DTC agricultural foods). This estimated income elasticity is considerably higher than estimates for other kinds of food products (Economic Research Service (ERS) 2012).
County-level increases in per capita income also have a positive effect on DTC agricultural sales, but the coefficients are smaller in magnitude than corresponding coefficients in specifications in which we estimate the effects of income in nearby metropolitan statistical areas (MSAs). This finding suggests that limiting a study to the effect of socioeconomic factors from a single political district could omit important determinants of demand by consumers in nearby principal cities and therefore could underpredict the influence of per capita income. We further test whether per capita income is endogenous. We find that per capita income is exogenous, but our results are robust to both assumptions.
We also find that counties in metropolitan areas did not have greater sales ceteris paribus, which contradicts the results of several prior studies (e.g., Low and Vogel Reference Low and Vogel2011). Finally, we find no evidence that DTC agricultural sales in the Northeast declined significantly between 2007 and 2012. The only statistically significant change in DTC agricultural sales occurred between 2002 and 2007, which was positive relative to sales between 1992 and 1997.
Background
The U.S. Department of Agriculture's (USDA's) Census of Agriculture has publicly disseminated data on DTC agricultural sales every five years since 1992 at the county level and in 1978 and 1982 at the state level. Sales are reported for crops, livestock, poultry, and other agricultural products (e.g., fresh fruits and vegetables, eggs, chickens, turkeys, cattle, and lambs) sold directly by producers to individuals for human consumption at farmers' markets, roadside stands, community-supported agriculture (CSA) programs, door-to-door marketing, on-farm pick-your-own operations, and other direct marketing channels. The census definition excludes inedible products (such as cut flowers, wool, and craft items), commodities not grown or raised on the vendor's farm, commodities purchased and resold within 30 days, and processed products such as cheese, butter, jelly, sausage, ham, wine, and cider (NASS 2012).
This definition of DTC agricultural sales represents a segment of transactions considered to be local or regional food sales because it excludes inedible products and processed food products often sold at farmers' markets and sales of edible farm products to retail institutions such as restaurants, schools, and hospitals. The market channel for farm-to-retail institutional sales of local food is larger than the market channel for DTC agricultural sales (Low and Vogel Reference Low and Vogel2011). Nonetheless, the census has never tracked purchases of agricultural products by retail institutions; DTC sales are the only component of local food sales that has been measured consistently over time.
Characteristics of local food markets in the United States vary regionally due to differences in farm sizes, consumer preferences, land characteristics, and transportation and distribution infrastructures. We focus on the Northeast for several reasons. First, along with the West Coast, the Northeast region has the highest local food sales geographically (Low et al. Reference Low, Adalja, Beaulieu, Key, Martinez, Melton, Perez, Ralston, Stewart, Suttles, Vogel and Jablonski2015, Low and Vogel Reference Low and Vogel2011). DTC agricultural sales were more prominent in the Northeast, which was responsible for 31–35 percent of such sales nationally between 1978 and 2012 with the greatest percentage share occurring in 2012 (Figure 1). Local food sales in the West Coast region typically come from larger farms located relatively far from metropolitan areas and thus more often involve intermediated markets (Low and Vogel Reference Low and Vogel2011). Furthermore, the scale of conventional agriculture in the Northeast is limited, implying that DTC agricultural sales are a relatively important marketing opportunity for northeastern farmers. In the Northeast, 15 percent of farms reported DTC agricultural sales that accounted for 1.9 percent of the total value of the region's agricultural product sales in 2012. In the rest of the nation, only 6 percent of farms reported direct sales, and those sales comprised 0.2 percent of total value in 2012 (USDA 2014).
Literature Review
Impacts of DTC Agricultural Markets
Many policymakers, funders, and farm organizations have sought to capitalize on consumers' interest in buying local food since satisfying that demand presents a market opportunity for farmers and a potential economic development strategy for communities. The local economic impacts of DTC agricultural sales can exceed those of sales of food from traditional retail outlets such as grocery stores (Hughes et al. Reference Hughes, Brown, Miller and McConnell2008, Hughes and Isengildina-Massa Reference Hughes and Isengildina-Massa2015). Farmers who sell directly to consumers retain 100 percent of the retail proceeds and incur marketing costs that range from 13 percent to 62 percent of the retail price (King et al. Reference King, Hand, DiGiacomo, Clancy, Gomez, Hardesty, Lev and McLaughlin2010). Food products sold in traditional retail outlets are not necessarily grown locally so a significant share of the retail proceeds from such outlets does not accrue to local farmers and businesses.
DTC agricultural sales also contribute to local economies because they typically come from small and medium sized farms (Low and Vogel Reference Low and Vogel2011, Ahearn and Sterns Reference Ahearn and Sterns2013), providing a market opportunity for farms that may find it difficult to access conventional agricultural supply chains. Such farms also are more likely to hire labor and purchase inputs locally (Jablonski and Schmit Reference Jablonski and Schmit2014). Fruit and vegetable farms that sell produce locally employ thirteen people for every million dollars of sales while nonlocal fruit and vegetable farms employ just three workers (Low and Vogel Reference Low and Vogel2011). Local farmers who produce food products are also more likely to depend on farming as their primary occupation (Low and Vogel Reference Low and Vogel2011).
DTC agricultural marketing channels are appealing as an economic development strategy because they are well-suited to unprocessed higher-value crops, particularly fruits and vegetables (Conner et al. Reference Conner, Knudson, Hamm and Peterson2008). Thus, promoting these markets as an economic development strategy can complement efforts to increase consumption of these food groups (Herman et al. Reference Herman, Harrison, Abdelmonem and Jenks2008). Swenson (Reference Swenson2010), for example, found that replacing corn and soybean production with seasonal production of fresh fruits and vegetables for local markets had a positive economic impact in six Midwestern states.
The contribution of DTC agricultural production to overall economic activity varies widely. Brown et al. (Reference Brown, Goetz, Ahearn and Liang2014), for example, found that per-capita DTC sales were a statistically significant predictor of changes in per-capita farm sales in New England and the mid-Atlantic between 2002 and 2007 and, in New England, that farm sales were a predictor of changes in per capita income; such sales were not good predictors of changes in the rest of the country.
Income
Many changes in socioeconomic conditions in recent decades could have contributed to the increase in sales of DTC agricultural products. Higher incomes, for example, would allow consumers to increase their purchases of food products prominent in DTC agricultural markets. ERS (2012) reports income elasticities for a number of agricultural food products: 0.3 for eggs, a range for fresh fruit of –0.4 for apples to 0.1 for other fresh fruits, and, for fresh vegetables, 0.1 for onions and potatoes, 0.4 for lettuce, 0.7 for carrots, 0.9 for tomatoes, and 1.2 for other fresh vegetables. The extent to which such increased purchases of food are made directly from farmers depends on the extent to which the DTC products have the quality attributes that consumers desire. The literature suggests that freshness and quality are principle reasons for purchasing local food; however, an overarching generalization that consumers will pay more for local foods cannot be drawn from studies that estimated price premiums (Martinez et al. Reference Martinez, Hand, Da Pra, Pollack, Ralston, Smith, Vogel, Clark, Tauer, Lohr, Low and Newman2010, Low et al. Reference Low, Adalja, Beaulieu, Key, Martinez, Melton, Perez, Ralston, Stewart, Suttles, Vogel and Jablonski2015). Prices at DTC outlets generally are comparable to prices at traditional retail outlets (e.g., Valpiani et al. Reference Valpiani, Wilde, Rogers and Stewart2015).
Higher incomes also could increase DTC agricultural purchases by reducing reliance on supplemental nutrition benefits, which have been notoriously difficult to use for direct purchases from farmers due to administrative impediments. When the paper-based food stamp program transitioned to the electronic Supplemental Nutrition Assistance Program (SNAP), annual redemptions of benefits at farmers' markets declined from more than $14.7 million in 1993 to $1.8 million in 2007 (FNS 2010, 2011). By 2014, SNAP redemptions had grown substantially, reaching $18.8 million, in part due to efforts by farmers' markets to be more accessible and affordable (FNS 2014).
Higher incomes could also reduce some consumers' DTC agricultural purchases because they increase the opportunity cost of time needed to shop for, prepare, and serve fresh unprocessed foods at home relative to processed foods. Consumption of food away from home as a share of household food expenditures increased from 36.5 percent in 1992 to 43.1 percent in 2012 (ERS 2014), and Maples et al. (Reference Maples, Morgan, Interis and Harri2013) found that preparation of meals at home was a statistically significant indicator of whether a consumer would purchase food directly from farmers.
A number of studies have found no relationship to income for frequency of purchasing food directly from farmers, for frequency of attending a market that offers DTC products, or for attitudes regarding local food purchases (Abello et al. Reference Abello, Palma, Waller and Anderson2014, Blanck et al. Reference Blanck, Nebeling, Yaroch and Thompson2011, Keeling-Bond, Thilmany, and Bond Reference Keeling-Bond, Thilmany and Bond2009, Zepeda and Li Reference Zepeda and Li2006, Onianwa, Wheelock, and Mojica Reference Onianwa, Wheelock and Mojica2005, Wolf, Spittler, and Ahern Reference Wolf, Spittler and Ahern2005, Stephenson and Lev Reference Stephenson and Lev2004, Brown Reference Brown2003). Racine et al. (Reference Racine, Munford, Laditka and Lowe2013) found that income had a negative effect on the frequency of DTC agricultural purchases in North Carolina.
Studies of the relationship between income and the level of DTC purchases are challenging to generalize because the results typically are specific to a small geographic region, a narrow market segment, and a particular time period. Hunt (Reference Hunt2007) and Gumirakiza, Curtis, and Bosworth (Reference Gumirakiza, Curtis and Bosworth2014), working in Maine and in Utah and Nevada respectively, conducted surveys of farmers' market shoppers and found that higher income was associated with greater expenditures in those venues. Varner and Otto's (Reference Varner and Otto2008) study of Iowa found that a 10 percent increase in per capita income in the region in which a farmers' market was situated resulted in a 16 percent increase in sales per vendor.
Demographic Characteristics
The age distribution and racial and ethnic characteristics of residents in a region are additional factors that could influence demand for DTC agricultural products. However, as with income, the results of the studies completed to date have been mixed (Byker et al. Reference Byker, Shanks, Misyak and Serrano2012). Racine et al. (Reference Racine, Munford, Laditka and Lowe2013) and Keeling-Bond, Thilmany, and Bond (Reference Keeling-Bond, Thilmany and Bond2009) found that Caucasians purchased food directly from farmers more frequently than other racial and ethnic groups. Blanck et al. (Reference Blanck, Nebeling, Yaroch and Thompson2011), Zepeda and Li (Reference Zepeda and Li2006), and Onianwa, Wheelock, and Mojica (Reference Onianwa, Wheelock and Mojica2005), on the other hand, found that race and ethnicity were not significant in predicting the frequency of DTC agricultural purchases. Several studies (Abello et al. Reference Abello, Palma, Waller and Anderson2014, Blanck et al. Reference Blanck, Nebeling, Yaroch and Thompson2011, Keeling-Bond, Thilmany, and Bond Reference Keeling-Bond, Thilmany and Bond2009, Stephenson and Lev Reference Stephenson and Lev2004) found that middle-aged shoppers made more DTC purchases or supported local farmers more than other age cohorts while others found no significance for age (Gumirakiza, Curtis, and Bosworth Reference Gumirakiza, Curtis and Bosworth2014, Zepeda and Li Reference Zepeda and Li2006, Onianwa, Wheelock, and Mojica Reference Onianwa, Wheelock and Mojica2005, Wolf, Spittler, and Ahern Reference Wolf, Spittler and Ahern2005, Brown Reference Brown2003).
Geography
A handful of studies have used data from the Census of Agriculture to estimate the influence of factors at a county and state level (Cheng, Bills, and Uva Reference Cheng, Bills and Uva2011, Low and Vogel Reference Low and Vogel2011, Timmons and Wang Reference Timmons and Wang2010, Brown, Gandee, and D'Souza Reference Brown, Gandee and D'Souza2006). The specifications in some of those studies included independent variables that influenced both supply and demand for DTC sales in the same equation and thus produced potentially biased parameter estimates. The studies also used static models so they could not infer factors that influenced DTC agricultural sales over time. Further, many of the specifications used control variables within a single political boundary to represent DTC agricultural sales. Consequently, market conditions that are geographically proximate but not within the same political boundary are not included as explanatory variables. One exception is Swenson (Reference Swenson2010), which estimated hypothetical economic impacts of residents in cities in six Midwest states purchasing fruits and vegetables from farms within 150 miles regardless of political boundaries.
Methods and Data
Definition of the Study Region
We estimate the impacts of socioeconomic conditions in nearby MSAs on county-level DTC agricultural sales in thirteen Northeast states: Maine, New Hampshire, Vermont, Massachusetts, Connecticut, and Rhode Island in New England and New York, New Jersey, Delaware, Pennsylvania, Maryland, Virginia, and West Virginia. Our procedure for defining MSAs that could influence county-level DTC production is similar to the one used in Swenson (Reference Swenson2010). For a given county in the Northeast, we consider MSAs in the United States that have a population of at least 250,000 in the 2010 census and are within 100 miles of the county (regardless of whether the MSA is inside or outside the Northeast region). Table 1 presents the 50 MSAs included in the 100-mile scenario and their populations in 2010. For robustness, we also estimate a specification using 150 miles as the definition of proximity between a county and MSAs. We estimate each distance as the number of miles between the county population centroid and the corresponding MSA population centroid, which is calculated as the average of the county-level population centroids for each county in the MSA weighted by the county's population (U.S. Census Bureau 2015).
List of Included Metropolitan Statistical Areas in the 100-mile Scenario

Source: U.S. Census Bureau (2013).
Note: The 150-mile distance definition also includes Cincinnati OH-KY-IN, Dayton OH, Fayetteville NC, and Lexington-Fayette KY.
We omitted counties for which DTC agricultural sales were excluded from the publicly available census data, which typically occurs when the number of sales in the county is so small (perhaps one or two farmers only) that releasing the data could disclose private information. We also excluded seventeen counties that were more than 100 miles from any MSA in the 100-mile scenario since we assumed that DTC sales in those counties would not be significantly influenced by socioeconomic conditions in the MSAs. We did the same for counties more than 150 miles away in the 150-mile scenario. In that case, there were only two: Aroostook and Washington Counties in Maine.
Dependent Variable
We use gross DTC agricultural sales as the dependent variable to estimate the income elasticity of those purchases. This specification allows us to compare our results to prior estimates of income elasticity for other food products reported by ERS (2012). Other metrics could be used. The Census of Agriculture also tracks the number of farms engaged in DTC agricultural production at the county level. However, production on a farm could increase or decrease in response to changing market conditions so changes in the number of farms would not necessarily reflect changes in activity.
The county-level ratio of DTC agricultural sales to total agricultural sales is another potential candidate for the dependent variable. One drawback of this metric given our hypothesis and specification is that the factors that explain total agricultural sales and DTC agricultural sales at a county level may be different. Total agricultural sales are likely to be strongly influenced by changes in national and international agricultural commodity markets that are not relevant for DTC agricultural sales. Likewise, a county's total agricultural sales would not be strongly influenced by local socioeconomic conditions since commercial agricultural products would mostly be marketed through a geographically large supply chain for consumption elsewhere or as inputs for other nonlocal products. In addition, the ratio of DTC to total agricultural products could increase even though sales of DTC products declined if total agricultural sales declined at an even greater rate. A lack of publically available data covering multiple periods prohibited the use of other potential metrics, such as farm incomes.
Empirical Model
We estimate a first-difference equation in which the change in DTC agricultural sales at the county level is represented by a vector, y, and the independent variables are represented by two matrices, x and z. For each period t, y has dimension nx1 where n is the number of counties, x has dimension nxk where k represents the number of independent variables that vary over time, and z has dimension nxl where l represents the number of time-invariant control variables. The parameters to be estimated, α and β, are kx1 and lx1 vectors of the coefficients respectively. Estimating this first-difference equation controls for the possibility that time-invariant unobserved county-specific effects are correlated with the error term. We estimate equation 1 using pooled ordinary least squares.
 $$y_t - y_{t - 1} = \lpar x_t - x_{t - 1} \rpar {\rm \alpha} + z{\rm \beta} + \varepsilon _t - \varepsilon _{t - 1} $$
The independent variable of interest is the change in per capita personal income.
We also control for changes in population. A larger population increases the aggregate demand for food, which should have a positive influence on DTC agricultural sales. A larger population also increases demand for land for nonfarming purposes such as housing, which should negatively influence DTC sales.
We include changes in demographic characteristics over time as independent variables since the propensity to purchase agricultural products directly from farmers may vary by age cohorts and with race and ethnicity. We include the percent of residents in surrounding MSAs who are Hispanic, non-Hispanic white, 25 to 44 years of age, 45 to 64 years of age, and 65 years of age or older.Footnote 2 We further include dummy variables that control for the time interval, the state in which the county is located, counties that are within an MSA, and counties that are not within an MSA but are adjacent to a county that is within an MSA.Footnote 3
For the 100-mile scenario, we obtained the total population of the surrounding MSAs for a county by summing the populations of each MSA within 100 miles. Per-capita personal income for each county is the sum of all personal incomes within each of the MSAs divided by the population in those MSAs. The same approach is used for the 150-mile scenario and to obtain percentages for the demographic variables for the 100-mile and 150-mile scenarios.
In a third specification, the values of the socioeconomic and demographic independent variables correspond to the county in which the DTC agricultural sales occurred. We compare the results of this county-level specification to the results of our prior specifications to determine the impact of large concentrations of wealth in cities on DTC purchases. The socioeconomic and demographic data from the largest principal cities in the Northeast are excluded from the county-level regression since the political districts that contain those cities generally do not report DTC agricultural sales. Excluded, for example, are Suffolk County in Massachusetts (which contains Boston), the boroughs of New York City, the city of Philadelphia, the city of Baltimore, and Washington, D.C. and its nearest Virginia suburbs (cities of Arlington and Alexandria).
Test for Endogeneity
Per-capita personal income will be endogenous if it is influenced by changes in DTC agricultural sales (e.g., Brown et al. Reference Brown, Goetz, Ahearn and Liang2014). We test whether changes in personal income are exogenous using two instrumental variables that we hypothesize as highly correlated with income but exogenous with regard to DTC agricultural sales. The first is per capita income from interest, dividends, and rent, which are components of personal income (Bureau of Economic Analysis (BEA) 2015). We hypothesize that this income is exogenous to DTC agricultural sales to the extent that personal income from such sales is predominantly derived from wages, salaries, and proprietor income and not from interest, dividends, and rent. We also use the fifteen-year lag of per-capita personal income based on a prior study (Partridge, Rickman, and Ali Reference Partridge, Rickman and Ali2008) showing that lags of this duration are not endogenous.
Data
We use data on county-level DTC agricultural sales from the Census of Agriculture as the dependent variable (USDA 2014). The data for population, personal income, and personal income from interest, dividends, and rent come from the BEA (2015). The county-level demographic data come from the U.S. Census Bureau (2000a, 2000b, 2010, 2014), and the 2013 definitions of the MSAs were provided by the Office of Management and Budget (2013).
After eliminating counties for which sales data were withheld and counties more than 100 miles from an MSA, our panel consisted of 314 counties plus Chesapeake City and Virginia Beach City in Virginia (see Table 2). The value of DTC sales from those counties accounted for 96 percent of DTC sales in the study states. Forty-three percent of the counties in the sample were located within an MSA and 33 percent were contiguous to a county located in an MSA. As shown in Table 2, average county-level sales in 2012 were $1.354 million, more than double the 1992 average of $666,000. There was a high degree of variation in sales by county; in 2012, total county sales ranged from $3,000 to more than $12 million.
County-level Descriptive Statistics for the 100-mile Scenario

The average per-capita personal income levels of MSAs in the 100-mile study region increased from $36,500 in 1992 to $45,500 in 2007 and then to $46,000 in 2012 (Table 3). Individually, the changes in income in the MSAs were highly variable. For example, average per-capita income in the Bridgeport-Stamford-Norwalk MSA was $84,300 in 2012, $20,600 higher than in 1992. Income in the Baltimore-Columbia-Towson, Boston-Cambridge-Newton, and Washington-Arlington-Alexandria MSAs also increased by at least $15,000 between 1992 and 2012. However, per capita incomes in other MSAs in the region were less than $40,000 in 2012 and some experienced small rates of growth. Average per capita income increased by less than $6,000 between 1992 and 2012 in the Atlantic City-Hammonton, Reading, and York-Hanover MSAs and in three North Carolina MSAs that were near Virginia counties. Per capita income declined between 2007 and 2012 in some of the Northeast's wealthier MSAs, including Bridgeport-Stamford-Norwalk, Washington-Arlington-Alexandria, and New-York–Newark–Jersey-City, while other MSAs saw increases.
MSA-level Descriptive Statistics for the 100-mile Scenario

Note: Demographic characteristics of the population are reported for 1992 and 2012 only for brevity.
Table 3 also presents the average changes in populations and demographic profiles for the MSAs between 1992 and 2012. The average MSA population increased from 1.3 million in 1992 to 1.5 million in 2012. The average proportion of non-Hispanic whites decreased from 84 percent to 75 percent while the average proportion of Hispanics increased from 3 percent to 8 percent. The average proportion of the population age 25–44 decreased from 32 percent to 25 percent and the average proportion age 45–64 increased from 20 percent to 28 percent.
Results
We report results and robust standard errors to correct for serial correlation for our three specifications in Table 4. The per-capita income coefficient was positive and significant in all specifications (P < 0.01). The coefficients' magnitudes imply that a $1,000 increase in per-capita personal income of residents in nearby MSAs increased county-level DTC agricultural sales by an average of $70,900 in the 100-mile scenario and $57,200 in the 150-mile scenario.Footnote 4 The per-capita income coefficient in the county-level specification was smaller at 38.6.
Results of First-difference Regressions

Notes: *** significant at the 99 percent level; ** significant at the 95 percent level; * significant at the 90 percent level.
We calculated the income elasticities of demand from the corresponding parameter estimates using the 2012 per-capita income levels of the MSAs in the region, which we estimated as the weighted-average per-capita incomes of the MSAs (the income of each MSA was weighted by its population), and average 2012 DTC agricultural sales level of the counties. The resulting income elasticities were 2.7 for the 100-mile scenario and 2.2 for the 150-mile scenario.
The coefficients of change in population were statistically insignificant in the 100-mile and 150-mile scenarios but positive and significant in the county-level scenario (P < 0.1). The effect of changes in the proportion of the population comprised of non-Hispanic whites, of Hispanics, of individuals age 45–64, and of individuals age 65 or older were statistically insignificant at the 90 percent level in all of the specifications. The change in proportion of the population age 25–44 was statistically significant in the 100-mile specification (P < 0.05) relative to the percent of the population under age 25. Thus, a 1 percent increase in the percentage of the population age 25–44 would increase average county-level DTC agricultural sales by $108,768.
The coefficient corresponding to the 2002–2007 inter-census interval was positive and statistically significant at the 90 percent level or more in the 100-mile and county-level specifications, indicating that DTC sales were higher in that period than in the omitted 1992–1997 interval. The coefficients corresponding to the 2007–2012 and 1997–2002 interval dummies were not statistically significant.
Increases in DTC agricultural sales were greater in the northern part of the study region than in the southern part. The state dummy variables for Maine, New Hampshire, Massachusetts, and Connecticut were positive with at least 90 percent statistical significance while the dummy variable for Virginia was significantly negative in all of the specifications. The New York and Vermont dummy variables were positive and statistically significant in the 150-mile and county-level specifications, and the West Virginia dummy variable was negative and statistically significant in the 100-mile scenario. The coefficient for counties adjacent to MSAs was negative and statistically significant in the 100-mile scenario (P < 0.1). This result suggests that increases in DTC sales were smaller in those counties than in counties that were not within or adjacent to an MSA. The MSA dummy was statistically insignificant in all of the scenarios.
Table 5 presents the results of the instrumental variable regressions. The coefficients of the first-stage parameter for fifteen-year lagged per-capita income and per capita income from interest, dividends, and rent were positive and statistically significant at the 90 percent level or more in all of the specifications. The first-stage F-statistic was also statistically significant in all specifications (P < 0.01). We tested for over-identified instruments and found that the chi-square test was statistically insignificant in all three specifications. We conclude that our instruments are relevant and valid based on the results from the first-stage regressions and over-identification tests.
Results of Instrumental Variable Regressions

Notes: *** significant at the 99 percent level; ** significant at the 95 percent level; * significant at the 90 percent level. The other independent variables are omitted for brevity; the full results are available from the authors.
We performed the Durbin-Wu-Hausman endogeneity test and found that the resulting F-statistic was statistically insignificant. Thus, we cannot reject the null hypothesis that per-capita personal income is exogenous, and we present the first-difference results as our primary findings since that is the most efficient model. However, for robustness, we report parameter estimates for per-capita personal income from the instrumental variable regressions. As in the first-difference regressions, the coefficients in the instrumental variable regressions remained positive and significant in the second stage but the magnitudes of the per-capita income coefficients were lower in the 100-mile and 150-mile specifications.
Discussion
We find that per-capita personal income in MSAs has a positive influence on DTC agricultural sales. Our parameter estimates in the 100-mile and 150-mile scenarios correspond to income elasticities between 2.2 and 2.7, which is higher than the income elasticities of conventional food products reported by ERS (2012). Thus, the variation in the trajectories of per capita income in Northeast MSAs has a high degree of explanatory power in predicting changes in DTC agricultural sales over time.
The magnitude of the per-capita income coefficient is larger in the 100-mile scenario than in the 150-mile scenario, indicating that increases in income that occurred in MSAs located 100 to 150 miles of a county have a smaller impact on DTC sales than increases in income that occurred in MSAs within 100 miles. This result suggests that the income effect of MSAs on DTC agricultural sales is attenuated as geographic distance, and thus transportation costs, increases. We further find that the parameter estimate for per capita income in the county-level specification is 67 percent of the corresponding parameter estimate in the 150-mile scenario. Thus, only examining socioeconomic factors from within a political district can omit important determinants of demand from nearby principal cities and underpredict the impact of per capita income on DTC agricultural sales.
The coefficient corresponding to counties located in an MSA is insignificant in our specifications. This contrasts with Low and Vogel (Reference Low and Vogel2011), which found that DTC agricultural sales were highest in counties in MSAs. The per-capita personal income and urbanization coefficients collectively imply, therefore, that proximity to a high-income MSA has a greater impact on DTC sales than a county being in an MSA.
The statistical significance of population in the county-level specification suggests that population growth is more pertinent within a county and that population changes in nearby MSAs are not a significant influence on DTC agricultural sales. The statistical insignificance of the coefficients of the race and ethnicity proportions reinforce the results of previous studies that found little effect of race and ethnicity on DTC agricultural purchasing patterns. The statistically significant coefficient for the 25–44 age cohort in the 100-mile scenario is also consistent with earlier studies that found that middle-age shoppers had a greater propensity to purchase food directly from farmers. The large magnitude of the coefficient in the 100-mile scenario indicates that regions that experience increases in that age cohort are more likely to see relatively large increases in DTC agricultural sales, ceteris paribus.
We further find that the time dummy representing change from 2002–2007 is statistically significant and positive in the 100-mile and county-level specifications but otherwise find no statistically significant coefficients for time-period dummy variables. Thus, we cannot conclude that DTC agricultural sales declined, ceteris paribus, in the Northeast during the 2007–2012 interval even though the parameter estimates for the corresponding dummy variables are negative. While DTC sales increased by 10 percent in the Northeast between 2007 and 2012, they simultaneously declined by 8 percent elsewhere in the United States. Thus, whether our conclusion can be applied to DTC agricultural sales in other geographic regions of the United States is unclear.
We find that the growth in DTC agricultural sales was relatively pronounced in the northern portion of the study region—specifically, in New England and New York. There may have been greater demand for locally produced food by northerly residents, perhaps because of variations in state policies or among organizations that develop and foster DTC agricultural markets.
Conclusion
Our study is one of the first to use a panel data set to conduct a spatial analysis of demand-side factors that influence DTC agricultural sales for a geographic region in which DTC agricultural marketing is prominent. We find that a combination of a decline in per capita income in some MSAs and an aging demographic are most likely to be the primary factors behind the relatively small increase in DTC agricultural sales between 2007 and 2012 as there is no change in the trend after controlling for those factors.
Policy initiatives have emerged to support DTC agricultural markets as a means of economic development and have focused on training and technical assistance, infrastructure investments, and marketing campaigns. Our results are informative for planners, policymakers, economic development agencies, and agricultural producers endeavoring to identify locations in which DTC production is likely to have the greatest potential for growth. In particular, our results suggest that a region characterized by relatively low DTC agricultural sales and relatively high incomes in surrounding MSAs presents a greater opportunity to expand such markets through a targeted policy intervention than regions in which DTC agricultural sales are already relatively robust.
Future studies could use our methodology to determine whether other geographic regions of the country that have different cultural preferences, agro-ecologic conditions, supply chain infrastructures, and land use patterns produce similar results. With availability of additional data, income elasticities for other types of local food purchases, such as processed food products sold directly to consumers and farm-to-retail sales, could be analyzed. Those extensions could advance our understanding of the extent to which various components of local food markets are substitutes or complements for each other.


 Open access

