


Introduction
Reliable chronologies are fundamental for interpreting proxy records of past ecosystem and climate change obtained from environmental archives such as aquatic sediments. Radiocarbon (14C) dating is an exceedingly valuable method to determine the age of organic material for archives covering the last ∼50 kyr and for investigating the past and present carbon cycle (Heaton et al. Reference Heaton, Köhler, Butzin, Bard, Reimer, Austin, Bronk Ramsey, Grootes, Hughen, Kromer, Reimer, Adkins, Burke, Cook, Olsen and Skinner2020; Levin and Hesshaimer Reference Levin and Hesshaimer2000). The organic matter (OM) preserved within sediments typically comprises components from diverse sources with different 14C signatures that reflect pre-depositional histories of mixing, transport, and recycling. Aquatic systems can further be influenced by hard-water and reservoir effects which impact the 14C signature of aquatically produced OM and can lead to an older apparent age (Philippsen Reference Philippsen2013). The organic carbon within a stratigraphic layer thus represents a heterogeneous mixture in both composition and age (Strunk et al. Reference Strunk, Olsen, Sanei, Rudra and Larsen2020). Consequently, while 14C of bulk OM (TO14C) can be used for investigating carbon cycle processes (Blattmann et al. Reference Blattmann, Wessels, McIntyre and Eglinton2019; Hou et al. Reference Hou, Yu, Eglinton, Haghipour, Zhang and Zhao2023; Ishiwa et al. Reference Ishiwa, Yokoyama, Obrochta, Uehara, Okuno, Ikehara and Miyairi2021; Obrochta et al. Reference Obrochta, Yokoyama, Yoshimoto, Yamamoto, Miyairi, Nagano, Nakamura, Tsunematsu, Lamair, Hubert-Ferrari, Lougheed, Hokanishi, Yasuda, Heyvaert, De Batist and Fujiwara2018), the heterogeneity of bulk OM and the presence of pre-aged carbon limit the use of TO14C as a chronological tool.
Recent advances in accelerator mass spectrometry (AMS) have made possible microscale 14C measurements with sample sizes <20 µg C (Haghipour et al. Reference Haghipour, Ausin, Usman, Ishikawa, Wacker, Welte, Ueda and Eglinton2019; Welte et al. Reference Welte, Hendriks, Wacker, Haghipour, Eglinton, Günther and Synal2018; Yokoyama et al. Reference Yokoyama, Miyairi, Aze, Yamane, Sawada, Ando, de Natris, Hirabayashi, Ishiwa, Sato and Fukuyo2019). These developments have facilitated 14C analyses of different carbon-bearing fractions of natural sediment matrices at the compound-specific (Ingalls and Pearson Reference Ingalls and Pearson2005) and particle-selective (Tennant et al. Reference Tennant, Jones, Brock, Cook, Turney, Love and Lee2013) levels, which previously were limited by their low ambient concentrations. 14C dating of these specific fractions can provide a source-specific chronological framework independent of the carbon from other fractions of the bulk sediment. Furthermore, if these fractions are carriers of paleoenvironmental information, it enables the generation of proxy-specific chronologies.
Terrestrial plant macrofossils are the preferred material for 14C dating of lacustrine sediment cores since they reflect the 14C signature of atmospheric carbon at the time of their formation. However, terrestrial macrofossils are not consistently present in sufficiently high concentrations throughout many lacustrine sediment records. Pollen from terrestrial plants have been proposed as a suitable alternative for 14C dating (Brown et al. Reference Brown, Nelson, Mathewes, Vogel and Southon1989). Pollen grains are ubiquitously present and typically well-preserved in lacustrine sediments. Also, they serve as established markers for terrestrial ecosystem variability (e.g., Tzedakis et al. Reference Tzedakis, Hooghiemstra and Pälike2006).
Traditional protocols for pollen extraction from sediments involve several wet chemical steps, but the resulting pollen concentrates are often dominated by other terrestrial and aquatic palynomorphs and plant fragments and are thus insufficiently pure for 14C dating. Several methods for further purification have been proposed, including sieving (Brown et al. Reference Brown, Nelson, Mathewes, Vogel and Southon1989; Cwynar et al. Reference Cwynar, Burden and McAndrews1979), density separation (Vandergoes and Prior Reference Vandergoes and Prior2003), and pipetting (Mensing and Southon Reference Mensing and Southon1999). These, however, frequently entail heavy trade-offs between pollen purity, yield, and processing time.
Recent studies have demonstrated that efficient isolation of pollen from lacustrine sediments can be achieved by complementing the physicochemical processing with flow cytometry (Tennant et al. Reference Tennant, Jones, Brock, Cook, Turney, Love and Lee2013). Flow cytometry is an established analytical method in the biomedical fields which exploits inter alia the optical characteristics of different cell types for the automated separation of particle matrices. Applying this approach to lake sediments enables rapid separation of pollen from preprocessed particle matrices, resulting in high yield and high-purity pollen samples of sufficient size suitable for routine 14C dating (Kasai et al. Reference Kasai, Leipe, Saito, Kitagawa, Lauterbach, Brauer, Tarasov, Gosla, Arai and Sakuma2021; Omori et al. Reference Omori, Yamada, Kitaba, Hori and Nakagawa2023; Ota et al. Reference Ota, Yokoyama, Miyairi, Obrochta, Yamamoto, Hubert-Ferrari, Heyvaert, De and Fujiwara2024; Steinhoff et al. Reference Steinhoff, Pickarski, Litt, Hajdas, Welte, Wurst, Kühne, Dolf, Germer and Kallmeyer2022; Tunno et al. Reference Tunno, Zimmerman, Brown and Hassel2021; Yamada et al. Reference Yamada, Omori, Kitaba, Hori and Nakagawa2021; Zimmerman et al. Reference Zimmerman, Brown, Hassel and Heck2019). Pollen-14C data in these studies were shown to largely agree with the chronological framework of their respective record. However, the number of studies comparing the pollen-14C data with established dating methods remains small. Furthermore, rigorous blank assessment associated with this approach has not previously been undertaken.
In this study, we assess microscale (i.e., 20–100 µg C) pollen-14C dating utilizing flow cytometry to isolate pollen from selected depth intervals of two lake sediment records with established age estimates based on plant-macrofossil-14C data and tephras. By comparing the 14C results obtained from isolated pollen samples with independent chronologies, we seek to assess the utility of this technique for refining age-depth models of lacustrine records. Microscale AMS dating greatly reduces sample size requirements and expands the range of application of pollen-14C measurements to pollen-depauperate sediments. To ensure the accuracy of the microscale AMS measurements, we conducted a comprehensive blank assessment for the entire pollen isolation protocol using both modern and fossil pollen reference materials.
Material and methods
Sample sites
This study focuses on sediment cores retrieved from two lake systems, Hämelsee and Flocktjärn, which were studied in detail in previous studies. Together, the lake records cover the late deglacial period and the Holocene, with established chronologies (Engels Reference Engels2021; Engels et al. Reference Engels, Lane, Haliuc, Hoek, Muschitiello, Baneschi, Bouwman, Bronk Ramsey, Collins, de Bruijn, Heiri, Hubay, Jones, Laug, Merkt, Müller, Peters, Peterse, Staff, ter Schure, Turner, van den Bos and Wagner-Cremer2022; Jones et al. Reference Jones, Lane, Brauer, Davies, de Bruijn, Engels, Haliuc, Hoek, Merkt, Sachse, Turner and Wagner-Cremer2018) based on varve counting and tephrochronology for Hämelsee, and 14C dating of terrestrial plant macrofossils for Flocktjärn. A notable feature of both lake systems is the absence of significant inflow, which limits the input of pollen and soil-derived material via fluvial transport. The comparison with independent chronologies provides a robust basis for assessing the coherence and reliability of the flow cytometry-based 14C dating approach.
Hämelsee is a small lake located in northern Germany (52°45′34″N, 9°18′40″E; 19.5 m a.s.l.) and forms a closed lake system fed exclusively by precipitation and groundwater. The lake has a near-circular shape with a diameter of ∼300 m and a present-day maximum water depth of ∼4.9 m. Due to the absence of shelter from wind, the lake does not develop a hypolimnion (Merkt and Müller Reference Merkt and Müller1999). The surrounding area consists of fluvial sands, and the major geomorphological features of the relatively flat landscape were shaped during the late Weichselian. The lake basin is interpreted either as a pingo remnant, formed by the thawing of ice lenses and permafrost, or as a dolina resulting from the collapse of underlying salt deposits (Engels et al. Reference Engels, Lane, Hoek, Baneschi, Bouwman, Brogan, Bronk Ramsey, Collins, de Bruijn, Haliuc, Heiri, Hubay, Jones, Jones, Laug, Merkt, Muschitiello, Müller, Peters, Peterse, Pueschel, Staff, ter Schure, Turner, van den Bos and Wagner-Cremer2024; Merkt and Müller Reference Merkt and Müller1999). The sediment record HAEM13 from the lake, covering the last glacial-interglacial transition, has been extensively investigated, including tephrochronological, geochemical, and palynological analyses (Engels et al. Reference Engels, Lane, Haliuc, Hoek, Muschitiello, Baneschi, Bouwman, Bronk Ramsey, Collins, de Bruijn, Heiri, Hubay, Jones, Laug, Merkt, Müller, Peters, Peterse, Staff, ter Schure, Turner, van den Bos and Wagner-Cremer2022, Reference Engels, Lane, Hoek, Baneschi, Bouwman, Brogan, Bronk Ramsey, Collins, de Bruijn, Haliuc, Heiri, Hubay, Jones, Jones, Laug, Merkt, Muschitiello, Müller, Peters, Peterse, Pueschel, Staff, ter Schure, Turner, van den Bos and Wagner-Cremer2024; Jones et al. Reference Jones, Lane, Brauer, Davies, de Bruijn, Engels, Haliuc, Hoek, Merkt, Sachse, Turner and Wagner-Cremer2018). Four tephra layers of the record are correlated to eruption events during the deglacial-Holocene transition (Jones et al. Reference Jones, Lane, Brauer, Davies, de Bruijn, Engels, Haliuc, Hoek, Merkt, Sachse, Turner and Wagner-Cremer2018): Saksunarvatn Ash (SA; Iceland), Askja-S tephra (Ask-S; Iceland), Ulmener Maar Tephra (UMT; Eifel Volcanic Field), and Laacher See Tephra (LST; Eifel Volcanic Field). We utilize sediments from HAEM13 at these tephra layers (1 cm resolution, 2 cm for LST) for pollen processing. Material containing the Vedde Ash (identified by Jones et al. (Reference Jones, Lane, Brauer, Davies, de Bruijn, Engels, Haliuc, Hoek, Merkt, Sachse, Turner and Wagner-Cremer2018)) was not available for this study. Sedimentation rates across the relevant period range between 50 and 60 cm/kyr. The SA, Ask-S, and UMT samples are from sections featuring organic/carbonate laminations, and the LST sample from a varved section composed of clays with organic laminations. The pollen record of Hämelsee is characterized by high abundances of Pinus (ca. 35 µm at the shorter axes), Cyperaceae (ca. 25–30 µm), and Betula spp. (15–25 µm) (Beug Reference Beug2015; Engels et al. Reference Engels, Lane, Haliuc, Hoek, Muschitiello, Baneschi, Bouwman, Bronk Ramsey, Collins, de Bruijn, Heiri, Hubay, Jones, Laug, Merkt, Müller, Peters, Peterse, Staff, ter Schure, Turner, van den Bos and Wagner-Cremer2022, Reference Engels, Lane, Hoek, Baneschi, Bouwman, Brogan, Bronk Ramsey, Collins, de Bruijn, Haliuc, Heiri, Hubay, Jones, Jones, Laug, Merkt, Muschitiello, Müller, Peters, Peterse, Pueschel, Staff, ter Schure, Turner, van den Bos and Wagner-Cremer2024). In addition to the 14C analysis of pollen, we analyze samples of two organic particle fractions that are produced in parallel with the pollen samples: pollen-sized non-pollen particles (same light scatter as pollen but differing fluorescence) and all non-pollen particles (particles with different light scatter or fluorescence; Figure 4, see also Supplementary Material: Figures S1, S2).
Flocktjärn is a small and shallow lake (ca. 250×400 m2) located in northern Sweden (64°42′29″N, 20°50′13″E; 121 m a.s.l.) ∼20 km from the Baltic Sea, with a maximum present-day water depth of 5.2 m (Engels Reference Engels2021). In the early Holocene, the area was inundated by the sea, but isostatic uplift following the retreat of the Scandinavian Ice Sheet led to the gradual emergence of the lake basin from 9000 cal. a BP onward (Berglund Reference Berglund2004; Lindén et al. Reference Lindén, Möller, Björck and Sandgren2006). The lake environment is relatively acidic and has been surrounded by marsh and boreal forest dominated by Pinus (ca. 35 µm), Picea (60–65 µm), and Betula spp. (15–25 µm) (Beug Reference Beug2015; Engels Reference Engels2021). A previous study (Engels Reference Engels2021) conducted a detailed palynological analysis of a sediment record recovered from the deepest part of the lake. The 3.7 m long record spans the past 8 kyr based on 14C dates from terrestrial plant macrofossils, yielding an average sedimentation rate of ca. 45 cm/kyr (Engels Reference Engels2021). The sediment record is almost entirely composed of detrital gyttja (0–3.2 m), with the older section formed by organic-rich clay (3.3–3.5 m) (Engels Reference Engels2021). Here we investigate nine of the ten layers (2 cm resolution) across the record that have macrofossil-based 14C dates. The one exception is the depth interval 295.5–297.5 cm where no material was available for this study. In addition to measurements on pollen, we obtain TO14C data from the same layers on bulk OM prepared using the acid-fumigation method (Komada et al. Reference Komada, Anderson and Dorfmeier2008).
Location map of the lakes Hämelsee (orange) and Flocktjärn (purple).

Preprocessing
Prior to pollen sorting with flow cytometry, all samples are preprocessed following an adapted version (Figure 2) of traditional pollen extraction protocols used for palynological studies. The protocol presented here is largely based on Tennant et al. (Reference Tennant, Jones, Brock, Cook, Turney, Love and Lee2013). The difference from standard protocols (Birks et al. Reference Birks, Last and Smol2001; Faegri et al. Reference Faegri, Kaland and Krzywinski1989) lies in prioritizing high pollen yields and minimal alteration of their isotopic signature over preserving the quantitative distribution of different pollen taxa. Each stage of the preprocessing serves to remove non-pollen (organic and inorganic) particles and other carbon-bearing phases that could affect the measured age of the pollen. Moreover, the resulting increase of the pollen concentration in the particle matrix facilitates more efficient flow cytometric sorting and a higher sorting yield.
Flow chart of all steps of the preprocessing. Between each step, samples are centrifuged at 2500 rpm for 10 min and subsequently decanted; all acid and base incubation stages are performed at 90°C in a sand bath.

All acid and base solutions are prepared using MilliQ (MQ) water to minimize introduction of extraneous carbon. During each digestion stage, the Teflon tubes holding the samples are shaken, heated (sand bath at 90°C), centrifuged (2500 rpm), and then decanted; rinsing is performed by filling the tubes with MQ water, which are then shaken, centrifuged, and decanted.
Details of the preprocessing sequence are provided in Figure 2. Briefly, sediment samples are freeze-dried and homogenized with pestle and mortar. The samples are then placed in 50 mL Teflon tubes. Carbonates are dissolved by adding HCl (10%); humic matter and other organic substances are removed with NaOH (10%). NaOH treatment is thoroughly repeated until the supernatant becomes clear or attains a light-yellow hue. After preconditioning with HCl (10%) to prevent CaF2 formation, the HF (40%) digestion stage dissolves silicates and clay minerals. 3–4 iterations of rinsing are typically required to sufficiently dilute the HF for further handling. The resulting sample is passed through a 63 µm sieve and collected on a 20 µm sieve. Although the sieving may remove some pollen of certain species (e.g., Picea), these sieving parameters provide the best balance between instrument limitations (clogging of the sample line and the nozzle) and encountered pollen assemblages, in terms of the final recovery by flow cytometry (see Discussion). The collected material is kept refrigerated, suspended in MQ water or, in the case of extended storage, in a NaN3 solution (1%) to prevent microbial growth.
Flow cytometry
The flow cytometer utilized in this study is a BD InfluxTM cell sorter (BD Biosciences, US) located at the Biogeoscience Group (ETH Zurich) and is equipped with a 140 µm nozzle and a 488 nm laser. Sorting is conducted by introducing a dilution of preprocessed, suspended particles into the system. The sample fluid is encapsulated by a saline sheath fluid that is focused into a continuous stream of micro-droplets induced by acoustic waves (Figure 3). As particles within these droplets traverse the laser beam, their optical properties are analyzed through the evaluation of forward scatter, side scatter, and two fluorescence intensities (Figure 4). These parameters provide information about the size, surface complexity, and molecular composition of the individual particles, respectively. The fluorescence intensities are measured for the wavelength windows of 530±20 nm and 580±15 nm. The acquired data are queried against a set of predefined criteria for the target particles called a sorting gate. Upon fulfillment of the criteria, an electric charge is added or subtracted to the corresponding droplet which consequently is deflected into designated collection tubes (Figure 3). Simultaneous, parallel sorting of different particle fractions into respective collection tubes is possible using different sorting gates. Particles not contained in any sorting gate are discarded as waste (Figure 3). We use the above-mentioned four optical parameters for defining the sorting gate as the intersection of two regions in the 2D parameter spaces of light scatter and fluorescence (Figure 4). Due to the autofluorescence of sporopollenin (Hunt et al. Reference Hunt, Rushworth and Dykes2007), the polymer that constitutes the outer wall of pollen grains, pollen are characterized by high fluorescence intensities within the parameter space (Figure 4).
Schematic of particle separation with the BD Influx. Acoustic waves applied at the nozzle cause the stream to break off into micro-droplets which are charged when containing a target particle. The electrostatic field generated by the deflection plates directs the charged droplets into the corresponding collection tubes.

Typical scatter plot of a preprocessed pollen concentrate (here from Flocktjärn). The blue region marks all particles that are of similar dimension to pollen, red region all particles that possess similar fluorescence intensities. The intersection of the two regions is used to identify and separate pollen which here compose ca. 1% of all particles.

Sorting criteria and instrument settings were optimized for pollen sorting using various test samples: pollen-sized plastic particles (Copolymer Microsphere Suspension, Thermo ScientificTM, CA, US), modern pollen of different species (Bonapol, CZ), and pollen extracts from preprocessed lake sediments. The sorting gate is slightly adjusted for different sediment cores, with microscopic inspection of test sorts, as the pollen assemblage and the composition of the particle matrix may vary.
Different sort modes can be selected for balancing sorting efficiency (fraction of particles requested for collection relative to all target particles; the sorting of a target particle can be aborted under predefined conditions in some settings), sorting recovery (fraction of successfully collected particles relative to all particles requested for collection; the process of drop formation or charge application can be suboptimal, which can result in the loss of the droplet), sorting time, and sorting purity (BD Biosciences 2011). Depending on the selected sort mode and particle concentration, sorting efficiency or purity becomes compromised if, for example, the spacing between particles is smaller than between droplets, resulting in the presence of multiple particles within one droplet. For our purpose, the most suitable are the two modes 1.0 Drop ENRICH (ENRICH) and 1.0 Drop PURE (PURE) (see Supplementary Material for details on other modes): ENRICH provides the highest efficiency where every target particle is requested for sorting, thus giving the highest yield per sample quantity; PURE achieves higher purity and recovery at the cost of lower efficiency by applying a phase gate that aborts sorts when particles are too closely spaced or not centered. The choice between the modes ENRICH and PURE depends on the available sample quantity and its initial pollen concentration. We routinely find sorting recoveries of 80–90% with both sort modes.
The instrument is operated using a sheath fluid consisting of MQ water with NaCl (1 g/L) added to meet the minimal salt load requirement for the charging of droplets. We aim for average event rates of 1000–1500 particles per second with a drop frequency of 13–14 kHz. Higher event rates can compromise sorting purity or sorting efficiency. The operating sheath pressure during sorting is 5.5 psi. A high piezo amplitude (>40 instrument units) and low sheath fluid flow set a high break-off point of the stream into droplets, which appears critical for ensuring high sorting recoveries of >80% for particles in the size range of 20–63 µm. During sorting, a 2 mm × 4 mm magnetic stirrer placed in the sample tube keeps particles in suspension.
After sorting, the collection tube (15 mL) is twice filled with MQ water, centrifuged, and decanted to rinse out residual salts. The isolated pollen grains are transferred with single-use pipettes into 25 µL tin capsules (Elementar, DE) that are pre-cleaned with dichloromethane. The capsules are immediately placed on a heating plate at 70°C for drying and then folded and placed in pre-combusted 1.5 mL gas chromatography vials. The collected material can be reintroduced into the instrument for analysis or for a second sorting process to further increase the sample's purity.
14C measurement and blank assessment
14C measurements were conducted using the proto-MICADAS (Mini CArbon DAting System) AMS at the Laboratory of Ion Beam Physics, ETH Zurich (Switzerland). This MICADAS is equipped with a gas ion source that is coupled via a gas interface system to an elemental analyzer (Vario Micro from Elementar, DE), enabling direct 14C measurement on CO2 released from combustion of organic material (Wacker et al. Reference Wacker, Fahrni, Hajdas, Molnar, Synal, Szidat and Zhang2013). Data evaluation and corrections were performed following Welte et al. (Reference Welte, Hendriks, Wacker, Haghipour, Eglinton, Günther and Synal2018) and 14C ages were calibrated using the IntCAL20 calibration curve (Reimer et al. Reference Reimer, Austin, Bard, Bayliss, Blackwell, Bronk Ramsey, Butzin, Cheng, Edwards, Friedrich, Grootes, Guilderson, Hajdas, Heaton, Hogg, Hughen, Kromer, Manning, Muscheler, Palmer, Pearson, Van Der Plicht, Reimer, Richards, Scott, Southon, Turney, Wacker, Adolphi, Büntgen, Capano, Fahrni, Fogtmann-Schulz, Friedrich, Köhler, Kudsk, Miyake, Olsen, Reinig, Sakamoto, Sookdeo and Talamo2020) with OxCal v4.4 (Bronk Ramsey Reference Bronk Ramsey2009). All measurements presented in this study were conducted across one run (one target).
Due to the small masses of our samples (<100 µg C), measured F14C values are impacted by extraneous carbon that is inevitably introduced during the processing. Assuming that this contamination is constant between samples, the resulting shift in F14C can be corrected with a mass-balance correction based on the mass and F14C value of the measurement and of the contamination (Hanke et al. Reference Hanke, Wacker, Haghipour, Schmidt, Eglinton and McIntyre2017). We conducted a comprehensive blank assessment of the entire pollen isolation process using modern and 14C-dead pollen materials as processing standards. The mass and F14C value of the contamination can be computed from the two possible endmembers of contamination, a modern and a fossil one, which can be independently traced using the 14C-dead and modern processing standards, respectively (Hanke et al. Reference Hanke, Wacker, Haghipour, Schmidt, Eglinton and McIntyre2017). We used lake sediment of a single layer (Sokli B-series, Finland; estimated age ca. 115 ka BP (Helmens et al. Reference Helmens, Väliranta, Engels and Shala2012)) as 14C-dead reference, and commercially available Betula pendula pollen (Bonapol, CZ) from a single vial (Batch 137.06.1.20) as modern reference. Both were included in multiple batches alongside regular samples with identical procedures for the preprocessing, flow cytometry, and subsequent transfer. For each preprocessed sample, a series of subsamples of different masses was generated with the flow cytometer sorting all pollen-sized particles using the mode ENRICH. F14C data of the untreated modern reference material, used as the nominal value, was measured on a larger (>1 mg C) graphitized sample (Němec et al. Reference Němec, Wacker and Gäggeler2010). Graphite measurements can be more precise than gas measurements by allowing measurements across multiple runs with larger samples.
The masses of the modern and 14C-dead components of the contamination were determined following the procedure described by Haghipour et al. Reference Haghipour, Ausin, Usman, Ishikawa, Wacker, Welte, Ueda and Eglinton(2019), where data gained from measurements are compared to a model of constant contamination. The χ2 parameters (sum of the squared residuals divided by the squared uncertainties), evaluated for each of the modern and the 14C-dead contaminant, were optimized by changing the masses for the contamination in increments of 0.02 µg C.
Results
Blank assessment
Processing standards were routinely included in preprocessing batches, with multiple subsamples generated for optimal tracing of associated contamination (Figure 5). The nominal F14C value of the modern reference material acquired from graphite measurement was 1.0082±0.0027. Uncertainties of the modeled mass and F14C value of the contamination were found to fit optimally to the scatter of the measured data when assigning a 30% uncertainty to the mass and 5% to the F14C. Encompassing the entire pollen isolation procedure, the blank assessment yielded a constant contamination of 1.34±0.40 µg C and F14C of 0.85±0.04. The χ2 values for this constant contamination were 0.69 for the modern and 1.02 for the 14C-dead components of the contamination. The scatter of data points and the constant contamination remained fairly consistent between different processing batches, including a series of unprocessed modern pollen samples (Figure 5). F14C values of all pollen samples of the two lakes were corrected using our blank value. All measurements on non-pollen particle fractions were corrected with the same blank value, assuming that the amount and F14C value of the contamination are similar.
Blank assessment on the processing standards for (a) tracing fossil and (b) modern contamination. The curves represent the best model fits for a constant contamination of 1.34±0.40 µg C with F14C of 0.85±0.04, with the 1σ error ranges shown with dotted lines. Each color indicates a different preprocessing batch, with points bordered in black in (b) indicating prolonged storage before generating sub-samples with the flow cytometer. Green data points in (a) represent unprocessed modern Betula pollen. Partly transparent colors (four points in (a) in two in (b)) indicate outliers not included in the computing of the contamination.

Impact of different sort modes on sorting purity
A re-analysis with the flow cytometer of sorted pollen from a Flocktjärn sample indicates that the fraction of particles well outside the sorting gate was around 30% with ENRICH and 5% with PURE. Most non-target particles were substantially lower in light scatter and thus smaller than pollen, suggesting that sorting purity in terms of carbon mass was significantly higher. Under the light microscope, sorted samples from ENRICH and PURE of the same material did not appear qualitatively different since most impurities were too small to have a visual impact. To assess the influence of the sort mode on the 14C value, we compared the 14C data of an artificial test sample. This test sample was generated by mixing preprocessed Betula pollen (used as the modern processing standard) with pollen-free, 14C-dead particles (fraction <20 µm from the preprocessed fossil reference material), resulting in a pollen particle concentration of ca. 10%. This mixture was then separated again using each sort mode. We find that ENRICH yielded a pollen sample with an F14C value of 0.835±0.010, while PURE yielded an F14C value of 1.007±0.014. This indicated that ca. 83% of the carbon in the ENRICH sample could be attributed to pollen and that the remaining ca. 17% were from sorting impurities, whereas the PURE sample was nearly impurity-free.
Hämelsee and Flocktjärn records
Pollen concentrations after preprocessing varied between 2–10% for samples from Flocktjärn and 0.2–2% for Hämelsee. The vast majority of non-pollen particles exhibited lower values across all optical parameters compared to pollen (Figure 4, Supplementary Material: Figures S1, S2), indicating that most were substantially smaller in size (≲1 µm) and consisted of residues still retained after the sieving process. Typical sorting efficiencies fluctuated around 50–70% for the sort mode PURE. Microscopic inspection of sorted material indicated a marked improvement in pollen purity after flow cytometry (Figure 6).
Comparison of a pollen sample from Flocktjärn under the light microscope (a) after the preprocessing and (b) after flow cytometry with ENRICH. The sorting achieves a drastic increase of the pollen concentration from <10% to >95% and near-complete removal of organic debris which constitute the majority of particles in a). The pollen assemblages in (a) and (b) are mostly composed of Pinus, but include also other species such as Betula and some fern spores. The presence of Pinus increases from (a) to (b) compared to other pollen species, likely due to the sorting gate not covering the entire population of smaller pollen.

The sort modes ENRICH and PURE were used for the Flocktjärn and Hämelsee records, respectively. For both records and sort modes, 1000 pollen grains typically yielded ca. 1 µg C. A typical sample of 50k pollen grains can be generated in a day (depending on the pollen concentration). For the Flocktjärn record, we aimed at 100 k pollen grains, resulting in sample sizes of ca. 100 µg C for most samples. After finding that less pollen material was sufficient for 14C measurements, sorting of 80k pollen grains was targeted for samples from the Hämelsee record, except for the UMT sample where some material was lost during the preprocessing (Table 1). We aimed for similar and sufficiently large sample sizes (larger than required) to level and reduce the effect of the contamination and the additional uncertainty introduced by the blank correction (Figure 5). For both records, 1 g of dry sediment generally provided a sufficient amount of pollen for at least one AMS measurement.
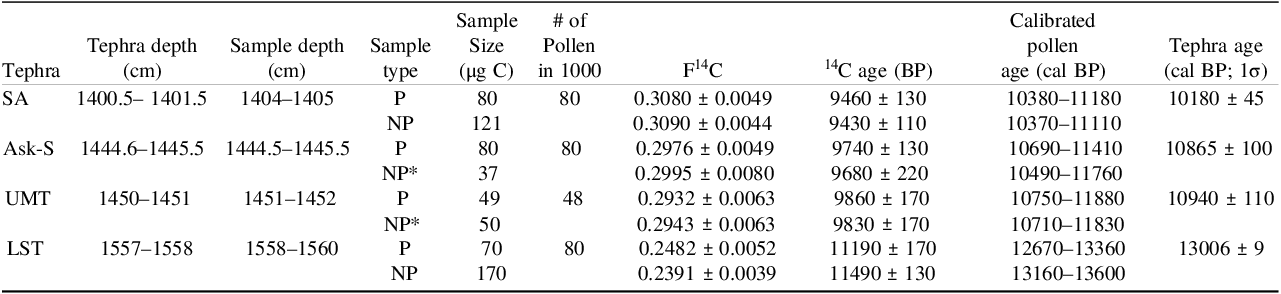
Hämelsee record; comparison of tephra dates (Engels et al. 2022) with the 14C data of the pollen (P), non-pollen (NP), and pollen-sized non-pollen samples (NP*). 14C ages were calibrated on the IntCAL20 calibration curve (Reimer et al. 2020).

The pollen from the Flocktjärn record were sorted using the sort mode ENRICH (Figure 7). We initially used this mode for its faster sorting and because visual comparison of the two sort modes with the microscope did not indicate a notable difference in pollen purity. For two layers, replicate pollen samples were generated with PURE (Supplementary Material: Table T1). We elected not to redo sorting of the remaining layers with PURE since the replicates did not indicate a significant difference in 14C values.
14C data of the Flocktjärn record; (a) Comparison of 14C ages of different dating targets in the record and (b) their differences. Only pollen-14C ages from sorts with ENRICH are shown. Symbols and errors of each series are shifted along their depth (y-axis) for 1 cm to enhance visibility.

The pollen-14C data from Flocktjärn overlapped with their macrofossil counterparts at their 2σ intervals for five layers and at their 3σ intervals for an additional three layers (Figure 7). At 74–76 cm, the pollen sample was significantly older than the macrofossil counterpart, which was confirmed by a replicate measurement of the pollen material (Supplementary Material: Table T1). Pollen samples were, on average, 152±33 14C yr older than the corresponding macrofossils. In comparison, TO14C values were systematically older than the macrofossils by 300±32 14C yr (Figure 7).
All Hämelsee samples were sorted using the sort mode PURE. The calibrated 14C ages of pollen agreed within uncertainties with the tephra dates for the Ask-S, UMT, and LST. For the SA, our result differs from the estimate based on the Kråkenes lake sequence (Lohne et al. Reference Lohne, Mangerud and Birks2014) at the 2σ interval (Table 1; Figure 8). Our analytical uncertainties, coupled with the shape of the 14C calibration curve (Reimer et al. Reference Reimer, Austin, Bard, Bayliss, Blackwell, Bronk Ramsey, Butzin, Cheng, Edwards, Friedrich, Grootes, Guilderson, Hajdas, Heaton, Hogg, Hughen, Kromer, Manning, Muscheler, Palmer, Pearson, Van Der Plicht, Reimer, Richards, Scott, Southon, Turney, Wacker, Adolphi, Büntgen, Capano, Fahrni, Fogtmann-Schulz, Friedrich, Köhler, Kudsk, Miyake, Olsen, Reinig, Sakamoto, Sookdeo and Talamo2020) in particular during the relevant time periods of the Ask-S and UMT samples, unfortunately led to large uncertainties for the calendar ages (Figure 8). The 14C data of the non-pollen particle fractions were also in good agreement with their pollen counterparts within uncertainties, suggesting that the 14C differences between the particle fractions were relatively small (Table 1).
Overview of the age probability distributions of the Hämelsee pollen and non-pollen samples (Table 1) calibrated on the IntCal20 curve (Reimer et al. Reference Reimer, Austin, Bard, Bayliss, Blackwell, Bronk Ramsey, Butzin, Cheng, Edwards, Friedrich, Grootes, Guilderson, Hajdas, Heaton, Hogg, Hughen, Kromer, Manning, Muscheler, Palmer, Pearson, Van Der Plicht, Reimer, Richards, Scott, Southon, Turney, Wacker, Adolphi, Büntgen, Capano, Fahrni, Fogtmann-Schulz, Friedrich, Köhler, Kudsk, Miyake, Olsen, Reinig, Sakamoto, Sookdeo and Talamo2020). The reference ages of the corresponding tephra SA, Ask-S, UMT, and LST (Engels et al. Reference Engels, Lane, Haliuc, Hoek, Muschitiello, Baneschi, Bouwman, Bronk Ramsey, Collins, de Bruijn, Heiri, Hubay, Jones, Laug, Merkt, Müller, Peters, Peterse, Staff, ter Schure, Turner, van den Bos and Wagner-Cremer2022) are indicated by gray bars (2σ uncertainty range).

Discussion
Preprocessing
Since the pioneering study by Tennant et al. (Reference Tennant, Jones, Brock, Cook, Turney, Love and Lee2013) employing flow cytometry for 14C analysis of pollen, several studies have used this approach (Kasai et al. Reference Kasai, Leipe, Saito, Kitagawa, Lauterbach, Brauer, Tarasov, Gosla, Arai and Sakuma2021; Omori et al. Reference Omori, Yamada, Kitaba, Hori and Nakagawa2023; Ota et al. Reference Ota, Yokoyama, Miyairi, Obrochta, Yamamoto, Hubert-Ferrari, Heyvaert, De and Fujiwara2024; Steinhoff et al. Reference Steinhoff, Pickarski, Litt, Hajdas, Welte, Wurst, Kühne, Dolf, Germer and Kallmeyer2022; Tunno et al. Reference Tunno, Zimmerman, Brown and Hassel2021; Yamada et al. Reference Yamada, Omori, Kitaba, Hori and Nakagawa2021; Zimmerman et al. Reference Zimmerman, Brown, Hassel and Heck2019). The procedures for sample preprocessing vary in their details but agree in their general strategy: the stepwise removal of components that may impact 14C measurements. We use a slightly modified preprocessing protocol compared to similar studies that applied flow cytometry to pollen for 14C measurements: 1) We adopt repeated NaOH rinsing, 2) we use HF treatment instead of density separation, 3) we omit the use of HNO3 or bleach (Figure 2). We expect that these modifications result in 1) better removal of humic material, 2) superior removal of detrital particles and simpler handling, and 3) better preservation of pollen and their autofluorescence signal at the trade-off of potentially retaining more organic particles.
Repeated base treatment was adopted for removing as much OM, particularly humic substances, as possible (Tunno et al. Reference Tunno, Zimmerman, Brown and Hassel2021). One treatment cycle appears insufficient for the removal of all humic components given that the supernatant even after the second cycle usually still retains a dark brown color. The presence of humic substances promotes formation of aggregates which hamper sorting and, when attached to pollen, represents a source of carbon that is not eliminated by flow cytometry, thus distorting the resulting 14C measurement.
A notable difference between studies is the method of choice for the removal of silicates and clay minerals: density separation (Omori et al. Reference Omori, Yamada, Kitaba, Hori and Nakagawa2023; Tunno et al. Reference Tunno, Zimmerman, Brown and Hassel2021; Yamada et al. Reference Yamada, Omori, Kitaba, Hori and Nakagawa2021; Zimmerman et al. Reference Zimmerman, Brown, Hassel and Heck2019) or HF treatment (Kasai et al. Reference Kasai, Leipe, Saito, Kitagawa, Lauterbach, Brauer, Tarasov, Gosla, Arai and Sakuma2021; Steinhoff et al. Reference Steinhoff, Pickarski, Litt, Hajdas, Welte, Wurst, Kühne, Dolf, Germer and Kallmeyer2022; Tennant et al. Reference Tennant, Jones, Brock, Cook, Turney, Love and Lee2013). Both techniques produce comparable results with regard to the pollen assemblage (Campbell et al. Reference Campbell, Fletcher, Hughes and Shuttleworth2016), though density separation can result in a higher pollen concentration, in particular for organic-rich sediments such as peat. In our case, we opted for the HF treatment because of its more straightforward and less laborious (albeit more hazardous) handling.
Traditional pollen extraction protocols routinely include an acetolysis stage used to remove cellulosic components from pollen walls and other OM (Birks et al. Reference Birks, Last and Smol2001; Faegri et al. Reference Faegri, Kaland and Krzywinski1989). Tennant et al. (Reference Tennant, Jones, Brock, Cook, Turney, Love and Lee2013) replaced the acetolysis step with a HNO3 digest to avoid the use of carbon-bearing acetate solutions. However, HNO3 impacts the autofluorescence of sporopollenin (Hunt et al. Reference Hunt, Rushworth and Dykes2007; Steinhoff et al. Reference Steinhoff, Pickarski, Litt, Hajdas, Welte, Wurst, Kühne, Dolf, Germer and Kallmeyer2022), thus hindering the distinction between the main pollen population and other organic debris. In trial experiments, we did not observe a notable increase of the pollen concentration by the addition of a HNO3 stage. The use of oxidants such as NaOCl has been proposed as an alternative, but does not seem to improve sorting (Zimmerman et al. Reference Zimmerman, Brown, Hassel and Heck2019). We consider removal of cellulose from pollen not essential for 14C analysis because it should exhibit the same age as the rest of the pollen constituents, and we therefore decided to omit this step entirely (Figure 2).
The optimal sieving parameters strongly depend on the pollen taxa present in the sediment and on the instrumental specifications of the flow cytometer used. Complete exclusion of particles significantly smaller than pollen (<5 µm) by sieving is at present unattainable (Figure 4, Supplementary Material: Figure S1, S2) likely due to the high surface tension of water and cohesive forces between smaller particles. The presence of these small particles adversely impacts the efficiency, purity, and duration of the sorting. This remains the main bottleneck in pollen sorting despite additional efforts such as ultrasonication or rinsing with solvents such as methanol or ethanol during sieving. Several pollen taxa lie partly outside the chosen 20–63 µm range, such as Betula (15–25 µm) or Picea (60–65 µm) (Beug Reference Beug2015; Stanley and Linskens Reference Stanley and Linskens1974). We found that the gain from retaining more small pollen by using a 10 µm sieve, as opposed to a 20 µm sieve, is outweighed by the complications from retaining even more other small particles and by the fact that the distinction between pollen and non-pollen among smaller particles based on the properties analyzed by the flow cytometer becomes increasingly blurred. Introducing particles >63 µm renders the instrument (i.e., the sample line and the nozzle) more prone to clogging, which already is a frequent issue (e.g., once a day). Larger particles can also interfere with the drop formation process which results in a lower sorting recovery. In addition, introducing larger particles could complicate the identification of the region of the parameter space inhabited by pollen not shared with other particles.
Our preprocessing protocol (Figure 2) removes all the targeted phases of carbonates, humic matter, and other minerals, although we emphasize that the details of the preprocessing (e.g., amount of reagents used or duration of treatments) would likely need adjustment for different sediment types (e.g., for peat or sediments with high clay content). Generally, we suggest that chemical treatment should be kept at a minimum in order to minimize the potential for contamination. Past studies introduced slight modifications to existing protocols without quantifying the exact advantages and disadvantages of one version versus the other, so comparable data on the efficiency and purity of different protocols are currently lacking. Due to the use of flow cytometry at a later stage of the isolation protocol, producing a high-purity sample during the preprocessing is preferable, but not essential.
Flow cytometric sorting of pollen
We use the intensities of forward and side scatter, along with two fluorescence windows, to define a sorting gate for reliably identifying pollen (Figure 4). Analyses of modern and fossil pollen indicate that pollen inhabit a typical region of the parameter space that remains fairly consistent between different pollen taxa and lake environments (Supplementary Material: Figure S1, S2). However, the transition between pollen and other particle populations has no clear boundary in any parameter, rendering it difficult to define a universal sorting gate. Precise adjustment of the sorting gate is thus required when the pollen-dominated region shifts due to changes in pollen assemblage, presence of aquatically derived particles, or sediment composition. Differentiating between pollen taxa with our instrument is in most cases not possible as their optical parameters overlap. We note that for lakes with a strong presence of fungal spores or algal remains, pollen-14C dating may be more complicated as non-pollen palynomorphs can exhibit similar optical properties but different 14C signatures than pollen (Birks et al. Reference Birks, Last and Smol2001; Hunt et al. Reference Hunt, Rushworth and Dykes2007). In our case, though, algal remains and fungal spores can be discounted as they were rare in the pollen assemblages from both lakes (Engels Reference Engels2021; Engels et al. Reference Engels, Lane, Haliuc, Hoek, Muschitiello, Baneschi, Bouwman, Bronk Ramsey, Collins, de Bruijn, Heiri, Hubay, Jones, Laug, Merkt, Müller, Peters, Peterse, Staff, ter Schure, Turner, van den Bos and Wagner-Cremer2022, Reference Engels, Lane, Hoek, Baneschi, Bouwman, Brogan, Bronk Ramsey, Collins, de Bruijn, Haliuc, Heiri, Hubay, Jones, Jones, Laug, Merkt, Muschitiello, Müller, Peters, Peterse, Pueschel, Staff, ter Schure, Turner, van den Bos and Wagner-Cremer2024). We observed no more than ∼5% erroneously sorted non-pollen pollen-sized particles when inspecting sorted material under the light microscope (Figure 6). Furthermore, sorted samples from ENRICH and PURE of the same material do not appear qualitatively different under the light microscope, as most impurities from the use of ENRICH are too small to have a visual impact.
We suggest that PURE is generally the preferred sort mode over ENRICH. The comparison of the two sort modes based on an artificial sample indicates that the impact on the 14C value of the product can be substantial. However, the contrast in F14C between different organic particle fractions in natural samples is expected to be much less than in our artificial sample (a binary mixture of 14C-dead material and modern pollen). Differences in the outcome for replicate samples generated with each sort mode are within measurement uncertainties likely for this reason (Supplementary Material: Table T1).
A re-sort of a pre-sorted pollen sample can further increase the pollen purity. This second sort requires less time than the first, although additional material loss will occur. If pollen concentrations were substantially lower than in our case but sufficient sediment material was available, a re-sort (e.g., first ENRICH, then PURE) can be considered for improving the sample quality. We find that 10k pollen grains, on average, yield ca. 10 µg C for both lakes. However, other pollen-to-mass conversion rates have been reported (e.g., Tunno et al. Reference Tunno, Zimmerman, Brown and Hassel2021) and the exact conversion rate likely depends on the species of the sorted pollen.
Blank assessment
A thorough blank assessment is critical for accurate blank correction of microscale samples <100 µg C. The blank corrections based on our assumption of constant contamination can result in a shift of the 14C age by several hundred years depending on the age and size of the sample (Figure 5; see also Supplementary Material: Table T2).
The amount of contamination of 1.34±0.40 µg C with an F14C of 0.85±0.04 we assessed is somewhat higher than the 0.8±0.2 µg C and F14C of 0.5±0.1 reported in Steinhoff et al. Reference Steinhoff, Pickarski, Litt, Hajdas, Welte, Wurst, Kühne, Dolf, Germer and Kallmeyer(2022). However, we consider our assessment more reliable and rigorous, as Steinhoff et al. (Reference Steinhoff, Pickarski, Litt, Hajdas, Welte, Wurst, Kühne, Dolf, Germer and Kallmeyer2022) used lignite as the fossil processing standard, which behaves differently in the absorption of extraneous carbon compared to pollen.
The principal assumption in our blank assessment is that contamination of constant mass (and F14C) is added to the sample during the entire procedure, for example from residual solvents or the tin capsule containing the sample (Haghipour et al. Reference Haghipour, Ausin, Usman, Ishikawa, Wacker, Welte, Ueda and Eglinton2019). However, contaminants that adhere to pollen grains or are introduced prior to or during flow cytometry should manifest as blank carbon that scales with the sample size. Consequently, such contamination would be expressed as a constant offset between the measured and the true F14C values. Our data closely follow the curve of constant contamination without any significant offset (Figure 5), indicating that any such size-dependent contamination is negligible. Most of the contamination is thus likely introduced after flow cytometry, such as during sample transfer and from the tubes and tin capsules (Haghipour et al. Reference Haghipour, Ausin, Usman, Ishikawa, Wacker, Welte, Ueda and Eglinton2019).
Hämelsee and Flocktjärn records
Most of our pollen ages are in agreement with previous age determinations for both lake records (Figures 7, 8). Differences in 14C between replicate samples with different sort modes, as well as between samples of different particle fractions (Table 1), are not significant. This indicates that the 14C signature of pollen is practically the same as that of the non-pollen particle fractions, likely due to the low concentration of pre-aged carbon in the preprocessed material. This is likely due to the absence of a major inflow to the lake, which limits the input of pre-aged material from a large catchment. In addition, substantial amounts of small pollen and pollen fragments are likely present in the non-pollen particle fractions, further decreasing differences in the 14C signatures.
For Flocktjärn, we observe that our pollen-14C ages tend to be slightly older than the corresponding macrofossil-14C ages, although most overlap with their counterparts within their 3σ uncertainty intervals (Figure 7). At 74–76 cm, a significant age offset between macrofossils and pollen is confirmed by a replicate produced with PURE, indicating that sorting impurities from the use of ENRICH are not the cause. Aquatic-derived carbon is unlikely the cause either, as both the palynological record and the microscopic inspection of the sorted material do not indicate an increased presence of non-pollen palynomorphs for this particular sediment layer. TO14C ages are systematically older than both macrofossils and pollen (Figure 7), likely due to recycling of carbon within the lake and input of pre-aged (soil) carbon from the landscape.
The observed mean age difference of pollen compared to macrofossils is relatively small considering the overall agreement and uncertainties of the individual age estimates (Figure 7), but statistically significant. Given the large sample sizes (∼100 µg C) and the lack of correlation between sample mass and age offset, we can exclude incorrect blank correction as a cause of the observed offset. The age offset is also substantially larger than what could be expected from inter-lab offsets (Wacker et al. Reference Wacker, Scott, Bayliss, Brown, Bard, Bollhalder, Friedrich, Capano, Cherkinsky, Chivall, Culleton, Dee, Friedrich, Hodgins, Hogg, Kennett, Knowles, Kuitems, Lange, Miyake, Nadeau, Nakamura, Naysmith, Olsen, Omori, Petchey, Philippsen, Bronk Ramsey, Prasad, Seiler, Southon, Staff and Tuna2020). As we find it difficult to debate the macrofossil ages as being too young, we can explain the age offset in the three following ways: 1) inclusion of pre-aged, non-pollen particles during sorting, 2) inclusion of pre-aged, reworked pollen entering the lake system, and 3) resuspension and deposition processes remobilizing pollen within the lake.
We believe that the first option, inclusion of pre-aged, non-pollen particles, is unlikely to be the cause for the observed age shift as the non-pollen particles appear to be practically the same age as the pollen. In addition, the number of non-pollen particles seen under the light microscope (<5%) is too small to explain a significant shift in 14C (Figure 6).
The second option, pre-aged pollen entering the lake system after previous retention in the landscape, can be considered because of the resilience of pollen in the environment. Such a process could substantially skew the actual age distribution of pollen transported into a lake towards older ages. For example, the mean age offset of 152±33 14C yr between pollen and macrofossils can be explained by a hypothetical contribution of ∼16% of pollen that are older by 1000 14C yr, assuming a similar mean age for these pollens as the surface soils in boreal forests (Shi et al. Reference Shi, Allison, He, Levine, Hoyt, Beem-Miller, Zhu, Wieder, Trumbore and Randerson2020). However, we think that a contribution of pre-aged pollen (or other particles) of this magnitude is unrealistic given the marsh and forest environment surrounding the lake and the absence of significant inflow limit the erosional input of soil-derived material to the lake. Local pollen production would also likely overprint any distal and delayed pollen input. Moreover, soil formation processes in Holocene Scandinavia and thus the burial of pollen are slow, resulting in the prolonged exposure of pollen to oxygen and to repeated freezing-thawing cycles. Should they have remained in these conditions for centuries, the reworked pollen from soils would likely be physically altered and thus identified relatively easily, but no substantial presence of such pollen was detected under the light microscope in more than single occurrences (Figure 6). We consider incorporation of pre-aged extraneous material into pollen, in situ or during the processing, unlikely for the same reason, as we expect that such additional material would be noticeable under microscope if sufficiently abundant to cause the observed age offset.
The third option, resuspension and deposition processes remobilizing pollen within the lake, can also lead to the input of pre-aged pollen. In this case, the surface of affected pollen would not be altered due to the preserving conditions in the lake. Lateral translocation of surface sediments by resuspension and sediment focussing from lake margin to depocenter have been documented, for example using radionuclides (Kansanen’ et al. Reference Kansanen’, Jaakkola, Kulmala and Suutarinen1991; Matisoff Reference Matisoff2017; Meili et al. Reference Meili, Braf and Konitzer1997). Surface sediments in organic-rich and relatively shallow settings, such as Flocktjärn, can often be unconsolidated and remobilized easily (Righetti and Lucarelli Reference Righetti and Lucarelli2010). Sediment perturbation (e.g., from winds) could thus cause vertical mixing and lateral translocation of pollen to the depocenter where sediment cores are typically recovered. This would result in a skewed pollen age distribution within a sediment layer with older mean pollen ages compared to the larger, less mobile macrofossils that sink into the unconsolidated sediment. We presently think that the third explanation is the most plausible. The first two options seem less likely as the main cause based on our observations but could contribute to the overall age shift.
The age offset between pollen and other age markers is likely specific to each lake system. Older pollen-14C dates compared to tephra dates of the same layers were reported for the Mono Lake (California, USA) (Zimmerman et al. Reference Zimmerman, Brown, Hassel and Heck2019), but no systematic age offset between macrofossils and pollen was found for the Fallen Leaf Lake (California, USA) (Tunno et al. Reference Tunno, Zimmerman, Brown and Hassel2021) or Lake Suigetsu (Japan) (Yamada et al. Reference Yamada, Omori, Kitaba, Hori and Nakagawa2021). We also observe instances of both a significant age offset and no offset in the Flocktjärn record (Figure 7), both of which are confirmed by replicates (Supplementary Material: Table T1), suggesting that the effect of the process causing the age offset is variable over time. This may explain why the two oldest pollen ages from Flocktjärn do not differ from their macrofossil counterparts: during the early stages of lake formation in the early Holocene, following the isostatic uplift of the area from the sea, the pool of pre-aged pollen and soil material, both in the surrounding landscape and within the lake itself, was likely smaller. Pollen resuspension may also have been limited in surface sediments composed of organic-rich clay, coinciding with the two oldest samples, compared to the detrital gyttja that composes the remainder of the record (Engels Reference Engels2021).
Our pollen ages for the Hämelsee record agree well with the tephra dates for the Ask-S, UMT, and LST (Table 1, Figure 8), including alternative estimates for these events reported in the literature (Brauer et al. Reference Brauer, Endres and Negendank1999, Reference Brauer, Endres, Zolitschka and Negendank2000; Bronk Ramsey et al. Reference Bronk Ramsey, Albert, Blockley, Hardiman, Housley, Lane, Lee, Matthews, Smith and Lowe2015). For the SA, our pollen age is somewhat older than the most accepted estimate based on the Kråkenes Lake sequence (Lohne et al. Reference Lohne, Mangerud and Birks2014). However, they are still compatible within their 3σ-uncertainty intervals, especially if the 3 cm depth offset, corresponding to roughly 50 years, between the tephra depth and the sample depth (Table 1) is considered based on the sedimentation rates inferred for this interval (Engels et al. Reference Engels, Lane, Haliuc, Hoek, Muschitiello, Baneschi, Bouwman, Bronk Ramsey, Collins, de Bruijn, Heiri, Hubay, Jones, Laug, Merkt, Müller, Peters, Peterse, Staff, ter Schure, Turner, van den Bos and Wagner-Cremer2022). It is possible that the observed age offset for the SA layer is caused by similar mechanisms as those discussed for Flocktjärn.
Age offsets between the chronological markers and the proxy data in a record are problematic. A proxy-specific chronology based on the proxy carrier can potentially solve this issue assuming that both the paleoenvironmental information and its age distribution are retarded and attenuated by the same transfer function. Pollen-14C analysis can thus provide the most representative chronological framework for interpreting pollen data. Since the residence time of pollen in the environment prior to their final deposition is unknown, future studies should precisely assess pollen-14C data against an absolute timescale to explore the theoretical accuracy that can be achieved with pollen dating. In addition, if pollen-14C data indeed capture transport or sedimentary processes, it can perhaps be used as a tracer for studying the past environment, similarly to other approaches such as compound-specific 14C analysis (Ingalls and Pearson Reference Ingalls and Pearson2005), at the particle level. Further assessment of the potential incorporation of pre-aged carbon by pollen from the sedimentary matrix during deposition and the preprocessing is also warranted. Nevertheless, the present study underlines the potential to retrieve robust 14C data of pollen isolated from aquatic sediments that hold promise for their further utilization as proxies, chronological tools, and in carbon cycle studies.
Conclusion
The approach of utilizing flow cytometry together with microscale AMS measurements makes pollen-based 14C analysis an attractive alternative to macrofossil-14C dating. This holds, in particular, for terrestrial sediment records where traditional dating targets are limited, given the ubiquitous presence of pollen and small sample-size requirements. The approach also can complement traditional dating methods by the generation of source- and proxy-specific chronologies, which provide the most reliable temporal framework for interpreting proxy records. The challenge of this approach lies in the generation of high-purity pollen samples of sufficient size, while introducing only minimal amounts of extraneous carbon. Our protocol is able to routinely generate such samples while introducing a constant contamination of only 1.34±0.40 µg C and F14C of 0.85±0.04 to the final sample, enabling reliable dating of microscale samples.
For relatively pollen-rich settings like Flocktjärn and Hämelsee, 1 g of dry sediment provides sufficient material for multiple pollen-14C measurements. 50k pollen grains, which typically are equivalent to ca. 50 µg C for our samples, can be sorted in a day and can produce a robust measurement. For smaller samples, contamination and the additional uncertainty from the blank correction become an important consideration. The pollen-to-mass conversion, however, may differ for other locations depending on the species of the sorted pollen in the final sample. We advise to use the rigorous sort mode PURE for the BD Influx flow cytometer (or similar settings for other instruments) as long as material is not limited. In our case, though, differences in the final 14C value between sort modes for natural samples were not observed, likely due to negligible differences in the 14C signature between pollen and non-pollen particles. We did not test for the separation of non-pollen palynomorphs like spores and algal remains since they were largely absent in our records. Therefore, we advise caution and further investigation for example, when exploring settings that are high in aquatic productivity.
Our pollen-14C data generally agree well with the established chronological framework. However, we observe that pollen-14C ages appear, on average, somewhat older than their macrofossil counterparts and possibly also associated tephra events. This suggests a delay between the formation of pollen and their final deposition, likely due to resuspension and sediment focussing processes within the lake. While this places a limitation on the accuracy of pollen-14C as a dating tool (although the offset is relatively small and can perhaps be corrected for), it also enables the use of pollen-14C analysis as an environmental tracer for investigating transport and sedimentary processes of OM at the particle level. Furthermore, this observation highlights the advantage of proxy-specific chronologies for the interpretation of paleoenvironmental data where the proxy carriers themselves are subject to signal retardation and attenuation.
Supplementary material
To view supplementary material for this article, please visit https://doi.org/10.1017/RDC.2025.10168
Acknowledgments
We thank Dr. Andreas Koutsodendris (Heidelberg University, DE) and Prof. Dr. Natalie Dubois (EAWAG, CH), who kindly provided various pollen and lake sediment samples. This work is funded by the Swiss National Science Foundation (SNF Grant number 197303).
Competing interests
The authors declare none.


 Open access