


I. INTRODUCTION
Trametinib (marketed under the trade names Mekinist® and Spexotras®, among others, as a dimethyl sulfoxide solvate) is an oral anticancer medication used for the treatment of melanoma and glioma (brain tumor). It is administered alone or in combination with dabrafenib mesylate. The systematic name (CAS Registry Number 1187431-43-1) is N-[3-[3-cyclopropyl-5-(2-fluoro-4-iodoanilino)-6,8-dimethyl-2,4,7-trioxopyrido[4,3-d]pyrimidin-1-yl]phenyl]acetamide methylsulfinylmethane. A two-dimensional molecular diagram of trametinib dimethyl sulfoxide is shown in Figure 1.
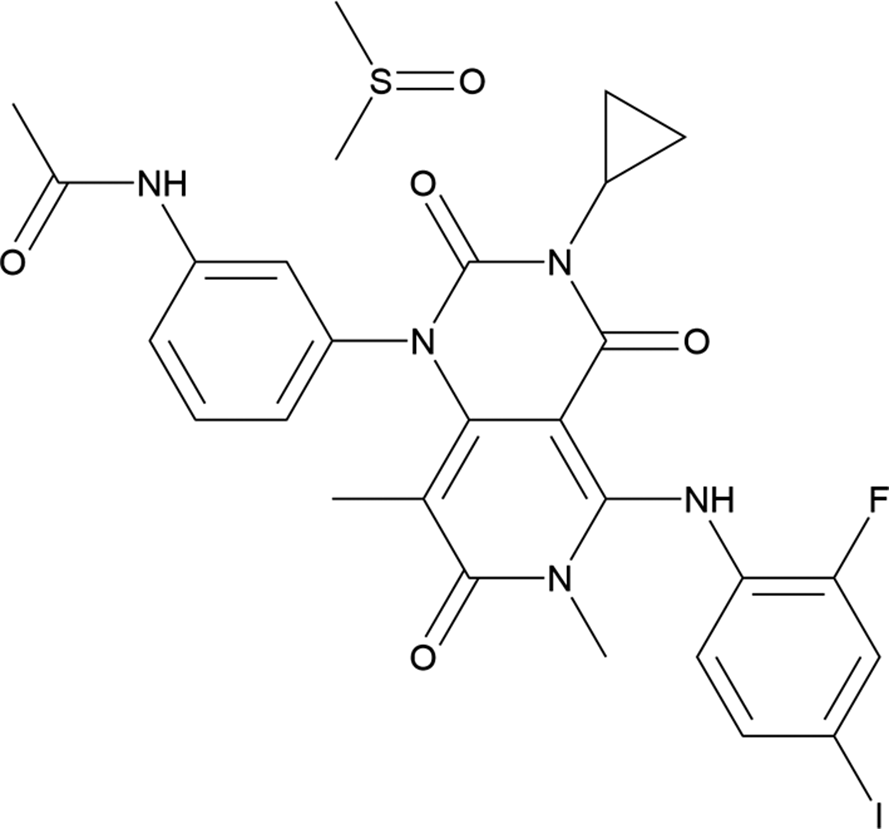
Figure 1. The two-dimensional structure of trametinib dimethyl sulfoxide.
Trametinib and preparation methods are described in International Patent Application WO2005/121142 A1 (Sakai, Reference Sakai2005; Japan Tobacco Inc.), and NMR data for many compounds are reported. This patent also describes the preparation of the dimethyl sulfoxide solvate. Crystalline Form M of trametinib dimethyl sulfoxide, different from the prior art, is reported in U.S. Patent 9181243 B2 (Hu et al., Reference Hu, Sheng and Sheng2015a; Hangzhou Pushat Pharmaceutical Technology Co. Ltd.) with X-ray powder diffraction data. Powder patterns of crystalline Form E (ethanol solvate), Form N (n-propanol solvate) anhydrous and hydrated Form A, and amorphous trametinib are reported in International Patent Application WO 2015/081566 A1 (Hu et al., Reference Hu, Sheng and Sheng2015b). Crystal structures of ethanol, acetone, benzene, methanol, nitromethane, and 2-propanol solvates of trametinib have been reported by Shruti et al. (Reference Shruti, Almehairbi, Saeed, Alkhidir, Ali, Vishwakarma, Mohamed and Chopra2022). The crystal structure of trametinib complexed to a protein has been reported by Khan et al. (Reference Khan, Real, Marsiglia, Chow, Duffy, Yerabolu, Scopton and Dar2020).
This work was carried out as part of a project (Kaduk et al., Reference Kaduk, Crowder, Zhong, Fawcett and Suchomel2014) to determine the crystal structures of large-volume commercial pharmaceuticals and include high-quality powder diffraction data for them in the Powder Diffraction File™ (PDF®; Kabekkodu et al., Reference Kabekkodu, Dosen and Blanton2024).
II. EXPERIMENTAL
Trametinib dimethyl sulfoxide was a commercial reagent, purchased from TargetMol (Batch #T5857) and was used as received. The light beige powder was packed into a 0.5-mm-diameter Kapton capillary and rotated during the measurement at ~2 Hz. The powder pattern was measured at 298(1) K at the Wiggler Low Energy Beamline (Leontowich et al., Reference Leontowich, Gomez, Diaz Moreno, Muir, Spasyuk, King, Reid, Kim and Kycia2021) of the Brockhouse X-Ray Diffraction and Scattering Sector of the Canadian Light Source using a wavelength of 0.819563(2) Å (15.1 keV) from 1.6 to 75.0° 2θ with a step size of 0.0025° and a collection time of 3 minutes. The high-resolution powder diffraction data were collected using eight Dectris Mythen2 X series 1K linear strip detectors. NIST SRM 660b LaB6 was used to calibrate the instrument and refine the monochromatic wavelength used in the experiment.
The pattern was indexed using N-TREOR as incorporated into EXPO2014 (Altomare et al., Reference Altomare, Cuocci, Giacovazzo, Moliterni, Rizzi, Corriero and Falcicchio2013) on a primitive triclinic unit cell with a = 10.76519, b = 12.61284, c = 12.82135 Å, α = 61.273, β = 69.878, γ = 77.810°, V = 1,431.2 Å3, and Z = 2. The space group was assumed to be P-1, which was confirmed by the successful solution and refinement of the structure. A reduced cell search in the Cambridge Structural Database (Groom et al., Reference Groom, Bruno, Lightfoot and Ward2016) yielded one hit, but no structures for trametinib or its derivatives.
The trametinib molecule was downloaded from PubChem (Kim et al., Reference Kim, Chen, Cheng, Gindulyte, He, He and Li2023) as Conformer3D_COMPOUND_CID_11707110.sdf. It was converted to a *.mol2 file using Mercury (Macrae et al., Reference Macrae, Sovago, Cottrell, Galek, McCabe, Pidcock and Platings2020). A DMSO molecule was built using Spartan ‘24, and saved as a .mol2 file. The crystal structure was solved by Monte Carlo simulated annealing techniques as implemented in EXPO2014 (Altomare et al., Reference Altomare, Cuocci, Giacovazzo, Moliterni, Rizzi, Corriero and Falcicchio2013), including a bump penalty on the non-H atoms. One of the 10 runs yielded a solution with a much better figure of merit.
Rietveld refinement was carried out with GSAS-II (Toby and Von Dreele, Reference Toby and Von Dreele2013). Only the 4.0 to 60.0° portion of the pattern was included in the refinements (d min = 0.819 Å). The absorption coefficient μR was fixed at 0.45. All non-H bond distances and angles were subjected to restraints, based on a Mercury/Mogul Geometry Check (Bruno et al., Reference Bruno, Cole, Kessler, Luo, Motherwell, Purkis and Smith2004; Sykes et al., Reference Sykes, McCabe, Allen, Battle, Bruno and Wood2011). The Mogul average and standard deviation for each quantity were used as the restraint parameters. The aromatic rings were restrained to be planar. The restraints contributed 3.4% to the overall χ 2. The hydrogen atoms were included in calculated positions, which were recalculated during the refinement using Materials Studio (Dassault Systèmes, 2023). The U iso of the heavy atoms were grouped by chemical similarity. The iodine atom I1 was refined anisotropically. The U iso for the H atoms were fixed at 1.3× the U iso of the heavy atoms to which they are attached. The peak profiles were described using an isotropic microstrain model. The background was modeled using a six-term shifted Chebyshev polynomial, with a peak at 10.45° to model the scattering from the Kapton capillary and any amorphous component in the specimen.
The final refinement of 150 variables using 22,401 observations and 112 restraints yielded the residual R wp = 0.0753. The largest peak (0.49 Å from I1) and hole (1.41 Å from C62) in the difference Fourier map were 0.54(12) and − 0.49(12) eÅ−3, respectively. The final Rietveld plot is shown in Figure 2. The largest features in the normalized error plot are in the shapes and positions of some of the strong peaks. These misfits probably indicate a change in the specimen during the measurement. A small number of unindexed peaks are present, indicating the presence of a trace of at least one crystalline impurity.
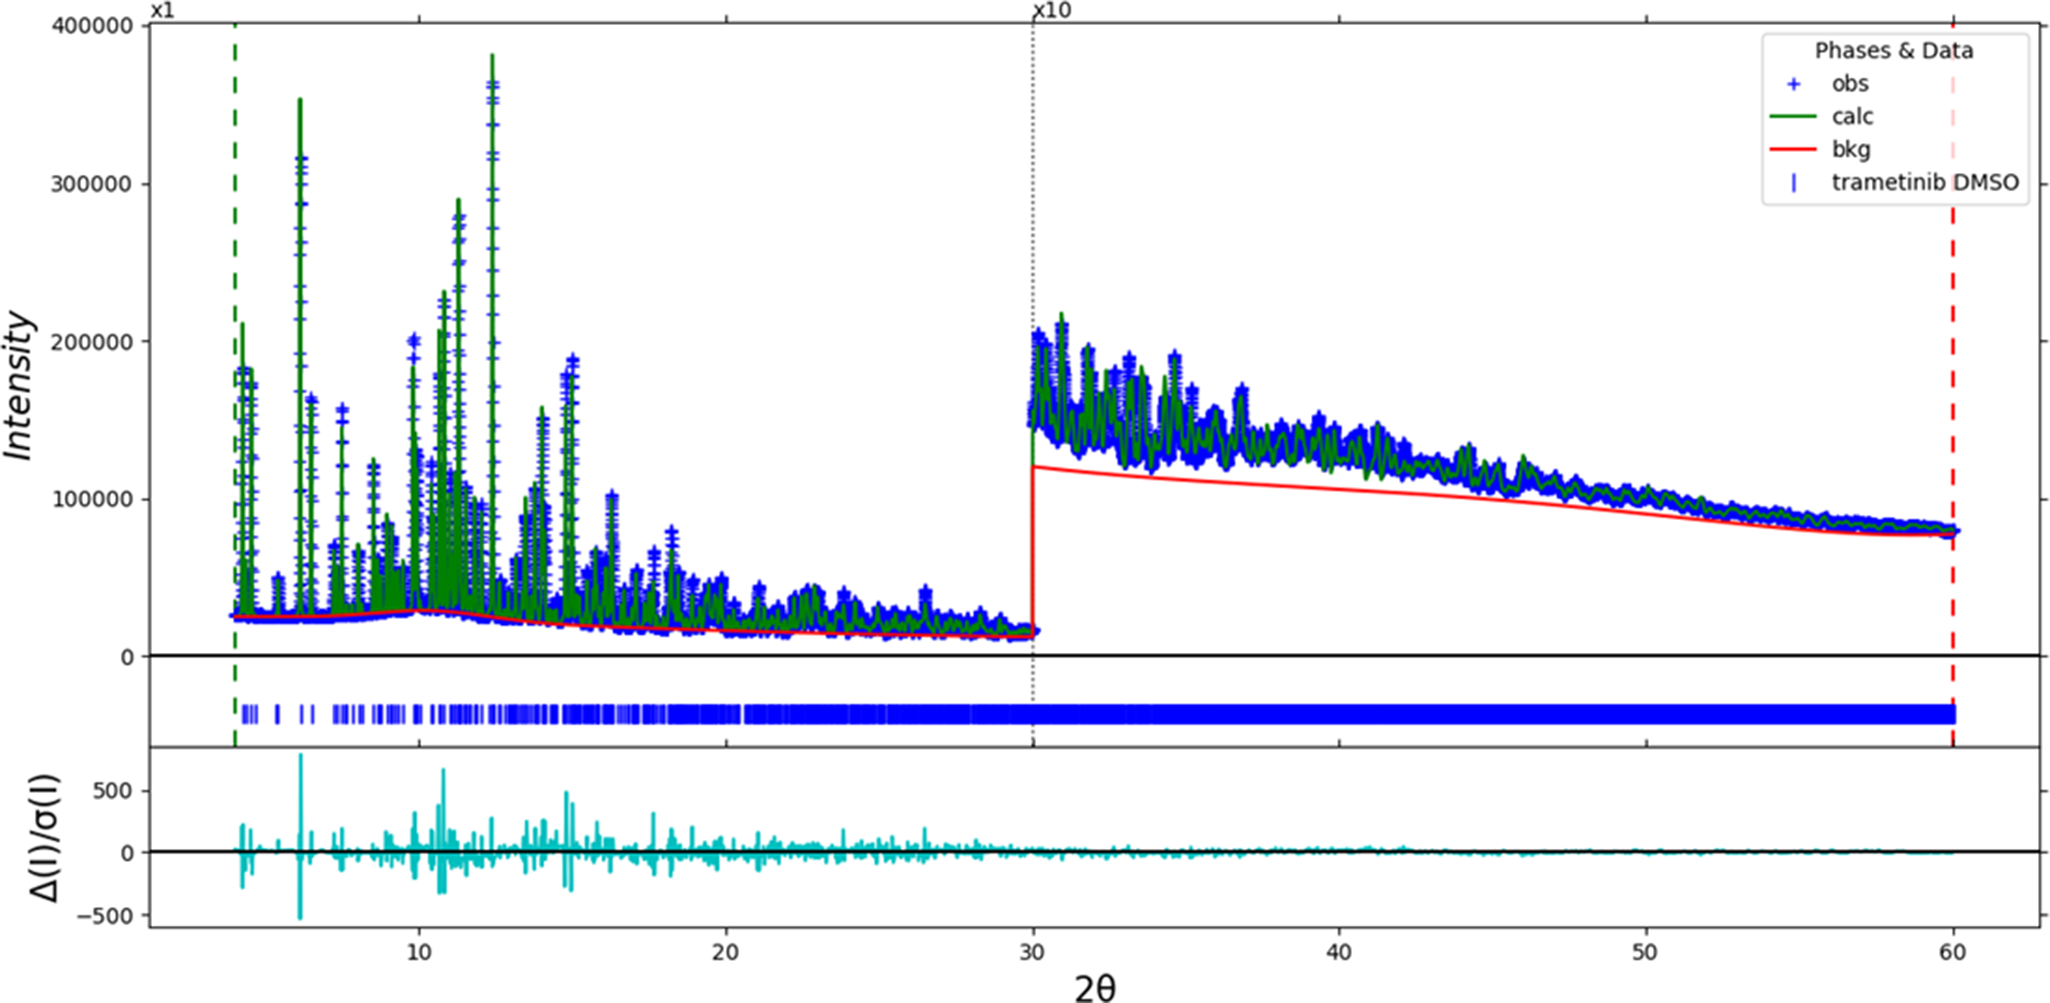
Figure 2. The Rietveld plot for trametinib dimethyl sulfoxide. The blue crosses represent the observed data points, and the green line is the calculated pattern. The cyan curve is the normalized error plot, and the red line is the background curve. The vertical scale has been changed to 40,000 full scale for 2θ > 30.0.
The crystal structure of trametinib dimethyl sulfoxide was optimized (fixed experimental unit cell) with density functional theory techniques using VASP (Kresse and Furthmüller, Reference Kresse and Furthmüller1996) through the MedeA graphical interface (Materials Design, 2024). The calculation was carried out on 32 cores of a 144-core (768-GB memory) HPE Superdome Flex 280 Linux server at North Central College. The calculation used the GGA-PBE functional, a plane wave cutoff energy of 400.0 eV, and a k-point spacing of 0.5 Å−1, leading to a 2 × 2 × 2 mesh, and took ~17 hours. Single-point density functional theory calculations (fixed experimental cell) and population analysis were carried out using CRYSTAL23 (Erba et al., Reference Erba, Desmarais, Casassa, Civalleri, Donà, Bush and Searle2023). The basis sets for the H, C, N, and O atoms in the calculation were those of Gatti et al. (Reference Gatti, Saunders and Roetti1994), and the basis sets for F, I, and S were those of Peintinger et al. (Reference Peintinger, Vilela Oliveira and Bredow2013). The calculations were run on a 3.5-GHz PC using eight k-points and the B3LYP functional and took ∼4.2 hours.
III. RESULTS AND DISCUSSION
The root-mean-square Cartesian displacement of the non-H atoms in the Rietveld-refined and VASP-optimized molecules is 0.097 Å (Figure 3). The agreement is within the normal range for correct structures (van de Streek and Neumann, Reference van de Streek and Neumann2014). The largest differences are in the orientations of the methyl groups. Since the hydrogen atom positions in the experimental structure were calculated using force-field techniques, the differences are not surprising. The asymmetric unit is illustrated in Figure 4. The remaining discussion will emphasize the VASP-optimized structure.
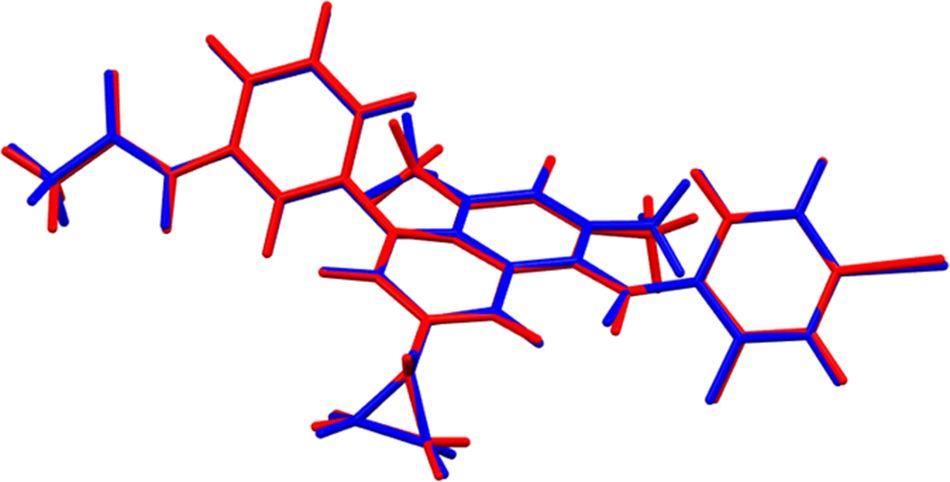
Figure 3. Comparison of the Rietveld-refined (red) and VASP-optimized (blue) structures of the trametinib molecule. The root-mean-square Cartesian displacement is 0.097 Å. Image generated using Mercury (Macrae et al., Reference Macrae, Sovago, Cottrell, Galek, McCabe, Pidcock and Platings2020).

Figure 4. The asymmetric unit of trametinib dimethyl sulfoxide, with the atom numbering. The atoms are represented by 50% probability spheroids. Image generated using Mercury (Macrae et al., Reference Macrae, Sovago, Cottrell, Galek, McCabe, Pidcock and Platings2020).
Almost all of the bond distances and bond angles fall within the normal ranges indicated by a Mercury Mogul Geometry check (Macrae et al., Reference Macrae, Sovago, Cottrell, Galek, McCabe, Pidcock and Platings2020). The bond angles C27–N10–C19 (Value = 132.0°, average = 122.4(21)°, Z-score = 4.6), N10–C19–N9 (value = 122.3°, average = 117.3(13)°, Z-score = 3.9), and C20–C22–N9 (value = 119.1°, average = 117.2(5)°, Z-score = 3.7) are flagged as unusual. The standard uncertainties on the last two are relatively small, inflating the Z-scores. The torsion angle N9–C19–N10–C27 lies on a long tail of a distribution of relatively few values. This angle reflects the orientation of the halogenated ring with respect to the rest of the molecule. Since N10 participates in an intramolecular hydrogen bond (see below), that interaction may affect the value of this torsion angle.
Quantum chemical geometry optimization of the isolated trametinib molecule (DFT/B3LYP/6-31G*/water) using Spartan ‘24 (Wavefunction, 2023) indicated that the observed conformation is 4.8 kcal/mol lower in energy than the local minimum, and has a similar conformation (rms displacement = 0.623 Å). The global minimum-energy conformation is only 1.8 kcal/mol lower in energy but has different orientations of all of the peripheral groups (rms displacement = 2.316 Å). The molecule is thus apparently flexible, and intermolecular interactions determine the solid-state conformation.
The crystal structure (Figure 5) contains hydrogen-bonded trametinib and DMSO molecules. These are arranged into layers parallel to the (101) plane. The Mercury Aromatics Analyser indicates no strong phenyl–phenyl interactions.
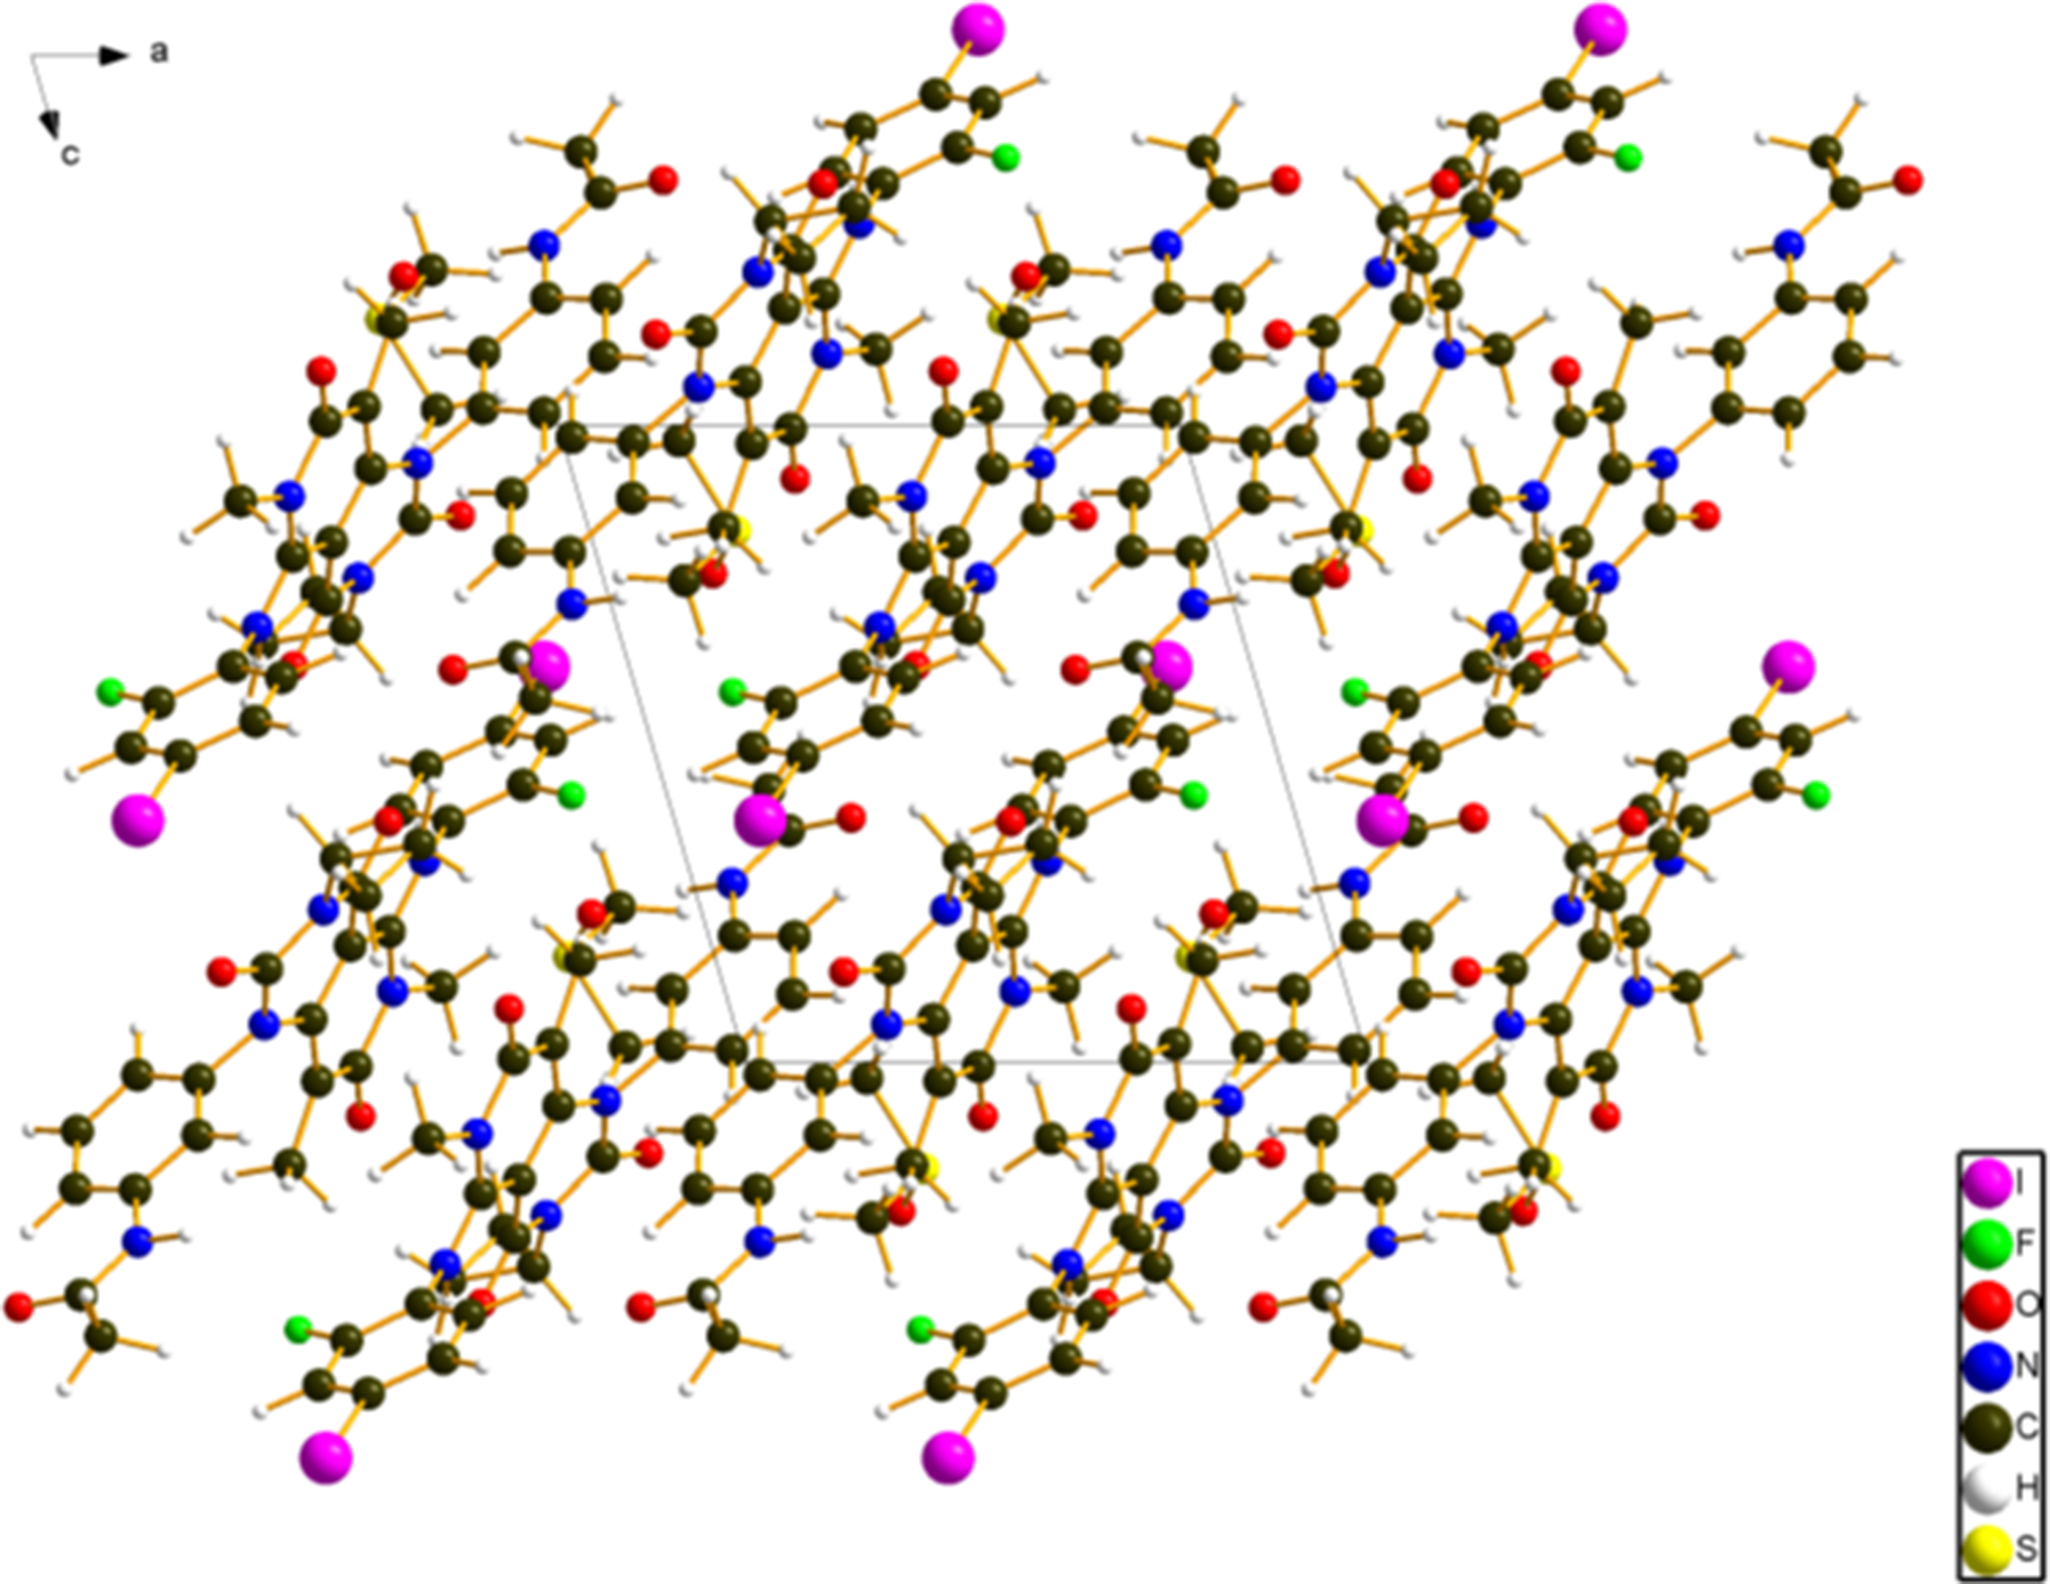
Figure 5. The crystal structure of trametinib dimethyl sulfoxide, viewed down the b-axis. Image generated using Diamond (Crystal Impact, Reference Putz and Brandenburg2023).
Analysis of the contributions to the total crystal energy of the structure using the Forcite module of Materials Studio (Dassault Systèmes, 2023) indicates that angle distortion terms dominate the intramolecular energy. The intermolecular energy is dominated by electrostatic attractions, which in this force field-based analysis also includes hydrogen bonds. The hydrogen bonds are better discussed using the results of the DFT calculation.
There are three classical hydrogen bonds in the structure (Table I). One (N11–H55···O70) links the trametinib and DMSO molecules. Another (N10–H43···O3) is an intramolecular hydrogen bond. N3–H43 also forms a weaker intermolecular hydrogen bond. The energies of these N–H···O hydrogen bonds were calculated using the correlation of Wheatley and Kaduk (Reference Wheatley and Kaduk2019). Several C–H···O hydrogen bonds, from methyl groups, ring hydrogen atoms, and the cyclopropyl ring, link trametinib molecules. Two additional C–H···O hydrogen bonds link the DMSO and trametinib molecules.
TABLE I. Hydrogen bonds (CRYSTAL23) in trametinib dimethyl sulfoxide. * = intramolecular.

The volume enclosed by the Hirshfeld surface of trametinib dimethyl sulfoxide (Figure 6; Hirshfeld, Reference Hirshfeld1977; Spackman et al., Reference Spackman, Turner, McKinnon, Wolff, Grimwood, Jayatilaka and Spackman2021) is 704.15 Å3, 98.59% of half the unit cell volume. The packing density is thus fairly typical. The only significant close contacts (red in Figure 6) involve the hydrogen bonds. The volume/non-hydrogen atom is close to normal at 17.4 Å3.
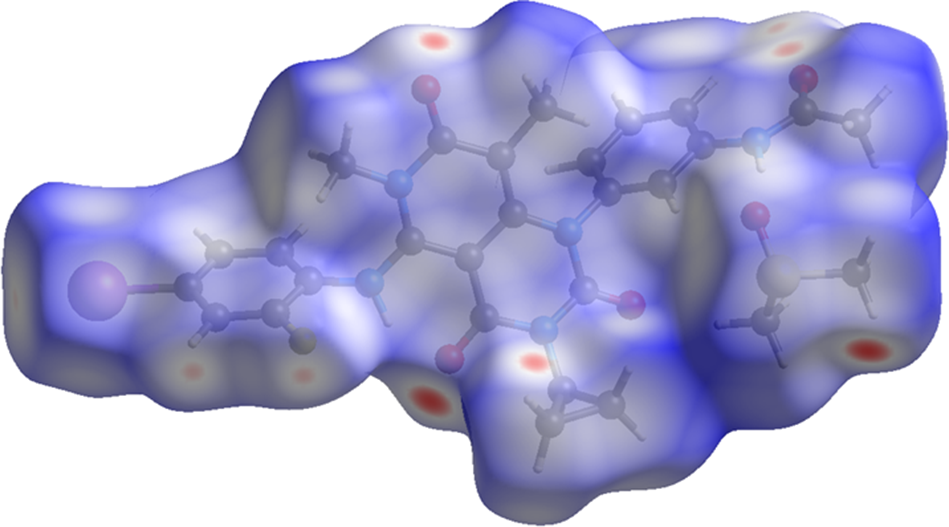
Figure 6. The Hirshfeld surface of trametinib dimethyl sulfoxide. Intermolecular contacts longer than the sums of the van der Waals radii are colored blue, and contacts shorter than the sums of the radii are colored red. Contacts equal to the sums of radii are white. Image generated using CrystalExplorer (Spackman et al., Reference Spackman, Turner, McKinnon, Wolff, Grimwood, Jayatilaka and Spackman2021).
The Bravais–Friedel–Donnay–Harker (Bravais, Reference Bravais1866; Friedel, Reference Friedel1907; Donnay and Harker, Reference Donnay and Harker1937) algorithm suggests that we might expect isotropic morphology for trametinib dimethyl sulfoxide. A second-order spherical harmonic model was included in the refinement. The texture index was 1.007(0), indicating that the preferred orientation was not significant in this rotated capillary specimen.
ACKNOWLEDGEMENTS
Part or all of the research described in this paper was performed at the Canadian Light Source, a national research facility of the University of Saskatchewan, which is supported by the Canada Foundation for Innovation (CFI), the Natural Sciences and Engineering Research Council (NSERC), the Canadian Institute of Health Research (CIHR), the Government of Saskatchewan, and the University of Saskatchewan. This work was partially supported by the International Centre for Diffraction Data. We thank Adam Leontowich for his assistance in the data collection. We also thank the ICDD team – Megan Rost, Steve Trimble, and Dave Bohnenberger – for their contribution to research, sample preparation, and in-house XRD data collection and verification.
DATA AVAILABILITY STATEMENT
The powder pattern of trametinib dimethyl sulfoxide from this synchrotron dataset has been submitted to the International Centre for Diffraction Data (ICDD) for inclusion in PDF®. The Crystallographic Information Framework (CIF) files containing the results of the Rietveld refinement (including the raw data) and the DFT geometry optimization were deposited with the ICDD. The data can be requested at pdj@icdd.com.
CONFLICTS OF INTEREST
The authors have no conflicts of interest to declare.


 Open access